

Abstract
Despite advancements in treatment, high‐grade serous ovarian cancer (HGSOC) is still characterized by poor patient outcomes. To understand the molecular heterogeneity of this disease, which underlies the challenge in selecting optimal treatments for HGSOC patients, we have integrated genomic, transcriptomic, and epigenetic information to identify seven new HGSOC subtypes using a multiscale clustering method. These subtypes not only have significantly distinct overall survival, but also exhibit unique patterns of gene expression, microRNA expression, DNA methylation, and copy number alterations. As determined by our analysis, patients with similar clinical outcomes have distinct profiles of activated or repressed cellular processes, including cell cycle, epithelial‐to‐mesenchymal transition, immune activation, interferon response, and cilium organization. Furthermore, we performed a multiscale gene co‐expression network analysis to identify subtype‐specific key regulators and predicted optimal targeted therapies based on subtype‐specific gene expression. In summary, this study provides new insights into the cellular heterogeneity of the HGSOC genomic, epigenetic, and transcriptomic landscapes and provides a basis for future studies into precision medicine for HGSOC patients.
Keywords: co‐expression network, drug repositioning, key regulator, molecular subtypes, ovarian cancer
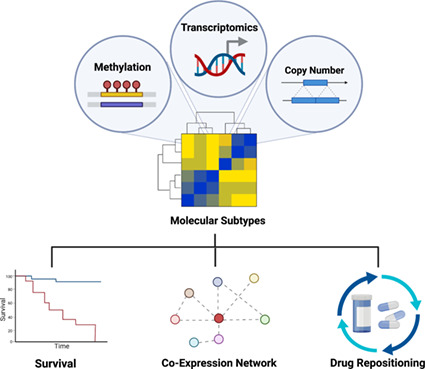
We integrated multiomics information to identify seven novel HGSOC molecular subtypes using a multiscale clustering method. These subtypes have distinct survival, genetic, and epigenetic patterns. We also constructed a gene co‐expression network to identify subtype‐specific key regulators. We further predicted and validated targeted therapies for HGSOC molecular subtypes. This study provides a foundation for pecision medicine in HGSOC.
Abbreviations
- ARI
adjusted Rand Index
- BH
Benjamini–Hochberg
- CAF
cancer‐associated fibroblast
- CNA
copy number alteration
- CTL
cytotoxic T‐lymphocyte
- D2R
dopamine D2 receptor
- DEG
differentially expressed gene
- DMP
differential methylated probe
- ECM
extracellular matrix
- EMT
epithelial‐to‐mesenchymal transition
- EMUDRA
Ensemble of Multiple Drug Repositioning Approaches
- FC
fold change
- FDR
false discovery rate
- FET
Fisher's exact test
- GDC
Genomic Data Commons
- HGSOC
high‐grade serous ovarian cancer
- Hh
hedgehog
- HRD
homologous recombination deficiency
- KDA
key driver analysis
- KW
Kruskal–Wallis
- MDSC
myeloid‐derived suppressor cell
- megena
multiscale embedded gene co‐expression network analysis
- MHC
major histocompatibility complex
- MSigDB
Molecular Signatures Database
- MWINA
Multiscale Weighted Interaction Network Analysis
- NSCLC
non‐small‐cell lung cancer
- OS
overall survival
- PARPi
poly‐ADP ribose polymerase inhibitors
- PFNs
Planar Filtered Networks
- RB
Reichardt‐Bornholdt
- SPD
shortest path distance
- TCGA
The Cancer Genome Atlas
- TGF‐beta
transforming growth factor‐beta
Ovarian cancer is the most lethal gynecological cancer in the United States, with over 14 000 estimated deaths in 2018 that make up 5% of total cancer‐related deaths in women [1]. Though the 5‐year survival rate for localized disease is over 90%, the vast majority of patients are not diagnosed until the tumor has already progressed to distant stage disease, for which the average 5‐year survival drops to below 30% [1]. High‐grade serous ovarian cancer (HGSOC) accounts for the majority of mortalities from ovarian cancer, and its overall survival has shown little improvement over the past several decades. Despite initial effective treatment with platinum‐based chemotherapy, resistance arises in a large majority (80–90%) of patients with late‐stage disease [1]. Although poly‐ADP ribose polymerase inhibitors (PARPi) have been a recent treatment of HGSOC carrying homologous recombination deficiency (HRD), therapeutic options approaches for remaining HGSOC are still limited [1, 2]. Therefore, multiomics approaches are expected to predict disease processes for enabling precision‐guided therapeutic strategies.
Recently, there have been efforts directed at identifying molecular subtypes of HGSOC that may further identify and predict unanticipated susceptibilities. Tothill et al. were one of the first groups to stratify high‐grade tumors into subtypes with distinct molecular signatures, followed by The Cancer Genome Atlas (TCGA) Research Network, which also identified a set of HGSOC subtypes with similar molecular signatures from both the TCGA and Tothill cohorts [3, 4, 5]. However, the subtypes based on the TCGA transcriptomic data did not differ significantly in survival, though their miRNA‐based subtypes did [5]. Later, studies focusing on transcriptomic and/or multiomic data identified subtypes with molecular characteristics similar to those by Tothill et al and The Cancer Genome Atlas Research Network [6, 7, 8, 9, 10, 11, 12, 13]. Though previous studies successfully identified a poor surviving subtype enriched for epithelial‐to‐mesenchymal transition (EMT), extracellular matrix (ECM), and transforming growth factor‐beta (TGF‐beta)‐related genes, our clustering method allows for more comprehensive molecular characterization to compare and contrast all the identified subtypes and to expand the range of innovative subtype‐specific treatment strategies [7, 12, 14, 15, 16, 17, 18, 19]. Moreover, there remains opportunities to identify additional subtypes of HGSOC [12, 18].
Using a novel clustering approach, Multiscale Weighted Interaction Network Analysis (MWINA) [20], we developed a rigorous systems biology framework for analyzing multiomics data from HGSOC to reveal seven HGSOC patient subtypes that are significantly distinct in their overall survival (OS). Compared with the previously published HGSOC subtypes, the new subtypes show unique combinations of activated or repressed biological processes such as cell cycle, epithelial‐to‐mesenchymal transition, immune activation, interferon response, and cilium organization. We then used subtype‐specific gene expression to identify molecular signatures, networks, key regulators, and therapeutic compounds for each subtype and showed that even subtypes with similarly poor or favorable clinical outcomes are characterized by different molecular pathways. Finally, we utilized the subtype‐specific gene expression profiles to predict drugs against each subtype. This study provides not only new insights into the processes underlying the molecular heterogeneity of HGSOC but also identifies potential therapeutics for HGSOC subtypes, representing a significant advance toward precision medicine for ovarian cancer.
Results
Identification of HGSOC molecular subtypes
For sample clustering, we used survival‐associated features from the mRNA expression, microRNA expression, copy number alteration (CNA), and DNA methylation data from 512 TCGA HGSOC samples (TCGA‐HGSOC) selected by Zhang et al. [14]. The prognostic significance of each individual feature was assessed by univariate Cox proportional hazard model analysis (P < 0.05) relative to patient survival [14]. A total of 4526 features were used, including the expression of 1651 mRNA genes, 140 microRNAs, 2191 somatic CNAs, and 455 DNA methylation sites. Feature values were then normalized with respect to the expression of normal controls as described previously [14].
A new clustering approach, Multiscale Weighted Interaction Network Analysis (MWINA), was utilized to identify novel HGSOC subtypes from the TCGA‐HGSOC cohort. Briefly, MWINA optimizes for network modularity, Q(γRB), and Reichardt‐Bornholdt parameter, γRB, controls the resolution of the optimal solution [21] (see Methods for details). By exploiting γRB across a range of 0.1–4, 60 sets of HGSOC patient subtypes with varying degrees of compactness were generated. These sets were then ranked based on the significance of the subtype OS (defined as the time between initial surgical resection to date of death or date of last follow‐up) as demonstrated by the survival chi‐squared statistic. Finally, we selected the highest ranked set that contains seven subtypes with highly varied molecular signatures and significantly distinct OS (chi‐squared P < 4.21 × 10⁻¹¹). (Fig. 1A,B, Table 1).
Fig. 1.
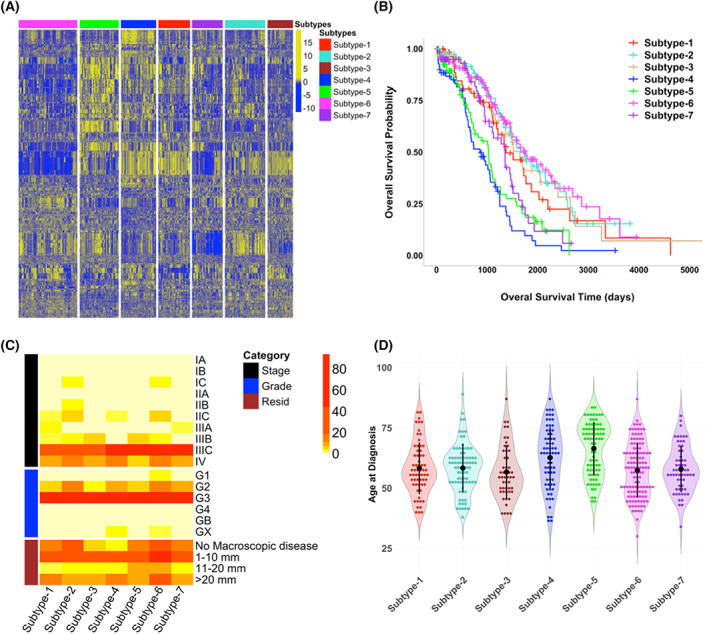
MWINA‐based HGSOC subtypes with distinct molecular profiling patterns and overall survival (OS), but similar clinical traits. (A) Multiscale weighted clustering of 512 TCGA ovarian cancer patients based on previously published features significantly associated with survival. These include mRNA and miRNA expression, copy number segments, and DNA methylation positions. Columns represent samples organized by subtype membership, and rows represent z‐score normalized feature expression. (B) Kaplan–Meier survival curves showing OS probabilities for seven novel ovarian cancer subtypes. Censored data are represented by “+” to indicate time to last follow‐up. Chi‐squared P‐value < 4.21 × 10⁻¹¹. (C) Clinical traits for each ovarian cancer subtype. Clinical traits shown include tumor stage, tumor histological grade, and residual tumor size. Color gradient corresponds to number of patients. (D) Distribution for age at diagnosis for patients categorized by molecular subtype, with mean age ± one standard deviation shown for each subtype.
Table 1.
Summary of clinical, transcriptomic, and epigenetic traits for all subtypes.
| Subtype | # Samples | Mean age at diagnosis | Mean OS (days) | miRNA dysreg. a | Methyl. dysreg. a | Immune response | ECM | Cell cycle | Cilium |
|---|---|---|---|---|---|---|---|---|---|
| 1 | 62 | 58.26 | 1067.05 | Low | Low | Low | – | High | Med‐High |
| 2 | 79 | 58.32 | 1284.11 | Moderate | Moderate | High | Low | – | – |
| 3 | 50 | 56.68 | 1177.28 | Low | Low | – | – | – | – |
| 4 | 69 | 62.65 | 764.64 | High | High | High | High | Low | Low‐Med |
| 5 | 77 | 66.42 | 841.1 | High | High | Low | Low | High | – |
| 6 | 115 | 57.39 | 1164.54 | Low | Moderate | – | Low | Low | High |
| 7 | 60 | 57.88 | 946.68 | Low | Moderate | – | – | – | – |
The level of miRNA or methylation dysregulation is determined by the number of differentially expressed miRNAs or methylation sites for each subtype (Table S4), such as subtypes with high, intermediate, and low numbers of DE‐miRNAs and DMPs are designated as having high, moderate, and low dysregulation. The immune response, ECM, cell cycle, and cilium categorizations are defined by the number of upregulated subtype‐specific DEGs that are enriched for these categories (Fig. 2A). Subtypes with downregulated DEGs that are enriched for these categories are labeled as “low” (Fig. 2B).
The stability of the MWINA‐based subtypes was assessed by subsampling. MWINA was performed on each of 50 datasets generated by randomly subsampling for 80% of all features and 80% of all patients. A concordance matrix was then generated across all the bootstrapped clusters to represent the probabilities that any pair of two patients are consistently found in the same cluster (Fig. S3A). From the bootstrapping outputs, empirical P‐values were computed to evaluate cluster concordances across the 50 datasets. All the MWINA‐based subtypes yielded P‐values < 10−6, demonstrating the robustness of the identified subtypes.
To check whether the subtypes were biased toward clinical traits, we tested whether the seven subtypes can be distinguished by tumor stage, tumor histological grade, residual tumor size, or age at diagnosis. Kruskal–Wallis (KW) test shows that there is no significant difference in tumor stage, histological grade, or residual tumor size among the subtypes (Fig. 1C; Table S1), but age at diagnosis is significantly different among the subtypes and affects OS (Cox proportional hazard P = 0.0020, HR = 1.02), with Subtype‐4 and Subtype‐5 having the highest mean age at diagnosis (Fig. 1D, Table 1). However, removing Subtype‐4 and Subtype‐5 eliminated this covariate effect (Cox proportional hazard P = 0.34, HR = 1.01, KW‐test P = 0.8124) among the rest of the five subtypes (Table S1). Furthermore, the age at diagnosis for each pair of subtypes was significantly different (Student's t‐test P < 0.05) only for comparisons with Subtype‐4 or Subtype‐5 but not for all other subtype pairs (Fig. S3B), suggesting that age at diagnosis is not a significant predictor of subtype membership for the other five subtypes. Lastly, Cox proportional hazard analysis showed a significant effect of residual disease on OS in the overall cohort (P = 0.0042, HR = 1.19), but not within subtypes 2, 4, 5, and 6 (P = 0.089, HR = 1.14). Although subtype‐6 has fewer samples with residual disease compared with the others, this result suggests that membership within the subtypes with the shortest and longest OS may not be due to amount of residual tumor alone.
In comparison with the published TCGA‐HGSOC subtypes by Zhang et al. [14], redistribution of the TCGA‐HGSOC samples by the MWINA cluster algorithm improved the subtype prognostic significance by several orders of magnitude (MWINA chi‐squared P < 4.21 × 10⁻¹¹ vs. Zhang et al. 2013 chi‐squared P = 2.96 × 10⁻⁷) (Fig. S3C). In addition, the MWINA‐based subtypes with poor OS do not have significantly more late‐stage disease patients compared with other MWINA‐based subtypes (Fig. 1C; Table S1), which is in contrast to the poor prognosis subtype identified by Zhang et al. [14] that contains more patients in stages IIIC and IV. Lastly, we identified subtypes with significant variations in immune cell activation, which was not a focus of the subtypes from Zhang et al. [14]. This shows that the MWINA‐based subtypes are not duplication of the subtypes from Zhang et al. [14], but rather a redistribution of these patients to form even more prognostically distinct groups.
Molecular signatures of the HGSOC subtypes
To understand the underlying molecular processes of each subtype, we performed differential gene expression (DEG) analysis on the transcriptomic data. We compared the samples within each subtype with those from the rest of the six subtypes in the full RNA‐Seq data of the 420 samples from the TCGA‐HGSOC cohort and also performed DEG analysis on the microarray data between the samples in each subtype against the normal controls (n = 8). The Molecular Signatures Database (MSigDB) was used to identify pathways and functions uniquely enriched in differentially expressed genes per subtype (BH‐corrected P < 0.05 and fold change ≥ 1.2) (Fig. 2A,B). The samples in Subtype‐4 are enriched for extracellular matrix (ECM) functions including adhesion, vasculature development and cell movement compared with the rest of the subtypes and normal samples (Fig. 2A; Fig. S4A). Upregulation of these processes likely contributes to the poor prognosis of the patients in this subtype, as many of these genes have been implicated in epithelial‐to‐mesenchymal transition (EMT) and metastasis [22]. By contrast, though the patients in Subtype‐5 also have poor OS (Fig. 1B, Table 1), they are characterized by upregulated cell cycle process genes and downregulated genes in defense response and immune system process (Fig. 2A,B; Fig. S4B). Similar to Subtype‐5, Subype‐1 also has upregulated cell cycle genes but it has downregulated genes involved in cell substrate and anchoring junctions (Fig. 2A,B). Subtype‐2, Subtype‐3, and Subtype‐6, with favorable survival (Fig. 1B, Table 1), have upregulated immune activation, protein localization, and cilium organization, respectively (Fig. 2A). Finally, a significant number of genes upregulated in Subtype‐7 have the conserved CAGGTG motif, and many of the downregulated genes have the conserved SCGGAAGY motif corresponding to ELK1 transcription factor binding site (Fig. 2A,B). Due to their distinct molecular pathways, Subtypes‐1, 2, 3, 4, 5, 6, and 7 are renamed as S‐CC (cell cycle), S‐immune, S‐LOC (localization), S‐ECM, S‐CC‐2, S‐cilium, and S‐motif, respectively. The results show that subtypes with similar prognoses are characterized by distinct molecular pathways (Fig. S4C–F).
Fig. 2.
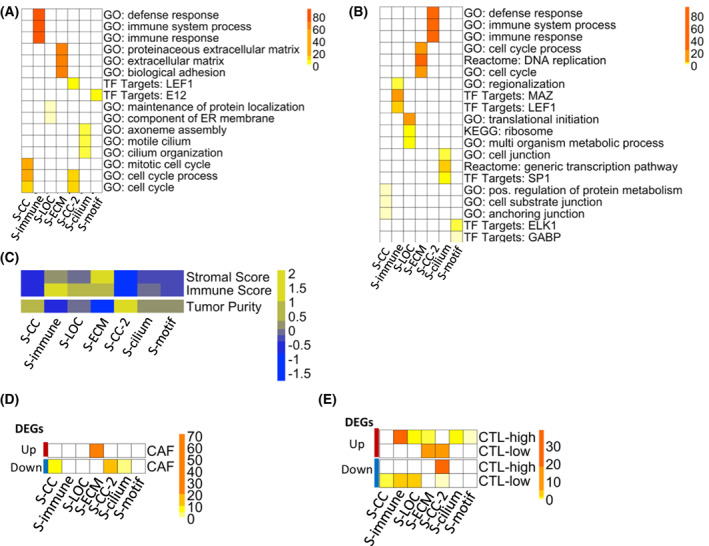
HGSOC subtypes have distinct gene expression signatures and cell type compositions. (A, B) Enrichment of MSigDB gene sets in the (A) upregulated and (B) downregulated DEGs for each subtype. DEGs were identified by comparing the samples in each subtype with the rest of the samples (BH‐corrected P < 0.05, fold change ≥ 1.2) and enrichment is determined via Fisher's exact test (FET) for overlapping genes. Color gradient shows −log10(FET P‐value). (C) Heatmap showing the mean estimate Stromal, Immune, and Tumor Purity scores for each subtype. All scores are z‐score normalized across subtypes. (D, E) Heatmaps showing enrichment of subtype‐specific up‐ (red, top) and down‐ (blue, bottom) regulated DEGs for (D) Cancer‐associated fibroblast (CAF) markers under regulation by TGF‐beta, and for genes characteristic of (E) cytotoxic T‐lymphocyte (CTL) high and low HGSOC tumors. Enrichment is determined via FET. Color gradient shows −log10(FET Bonferroni‐corrected P‐value). See also Fig. S4.
As previously shown, HGSOC tumors can have a high amount of stromal and immune cell infiltration from the tumor microenvironment [23]. To explore whether subtype‐specific gene expression signatures are due to contributions from the tumor microenvironment, we examined cell type composition of each subtype. Using the estimate R package [24], we computed stromal scores, immune scores, and tumor purity scores as proxies for tumor composition (Fig. 2C). Although subtype tumor purity scores were not directly correlated with survival outcome (Pearson correlation rho = 0.045, P‐value = 0.33), the KW‐test shows that the subtype stromal, immune, and tumor purity scores are significantly different among the seven subtypes (Table S1).
The subtype‐specific immune and ECM gene signatures are likely due to immune and stromal cell infiltrates from the tumor microenvironment. The upregulated DEGs from S‐ECM significantly overlap (Fisher's exact test (FET) Bonferroni‐corrected P = 1.01 × 10−72) with CAF‐specific genes that are under TGF‐beta regulation [25] (Fig. 2D). By contrast, there is no overlap between the TGF‐beta regulated CAF‐specific genes and DEGs from other subtypes (Fig. 2D). The DEGs from S‐immune significantly overlap (FET Bonferroni‐corrected P < 0.05) with the differentially expressed genes in ovarian tumors rich in cytotoxic T‐lymphocytes (CTLs) [26], demonstrating the presence of an infiltrating CTL population in the S‐immune subtype (Fig. 2E). The DEGs from other subtypes with similar OS as S‐immune, such as S‐LOC and the S‐cilium, also overlap with markers corresponding CTL‐high and CTL‐low states (Fig. 2E). By contrast, the upregulated DEGs in S‐ECM have significant overlap with the CTL‐low gene signature, suggesting that the immune cell signature in S‐ECM does not originate from an infiltrating CTL population (Fig. 2E). Instead, the immune signature in the S‐ECM is likely from a myeloid‐derived suppressor cell (MDSC) population, as demonstrated by the significant overlap (FET Bonferroni‐corrected P < 2.06 × 10⁻¹⁴) of the S‐ECM upregulated DEGs with genes overexpressed in MDSCs from non‐small‐cell lung cancer (NSCLC) (data accessible at NCBI GEO database, accession GSE79404) (Fig. S4G) [27, 28]. Lastly, the S‐CC‐2 seems to lack both infiltrating CTLs and MDSCs, as shown by the low estimate stromal and immune scores, as well as downregulation of CAF, CTL, and MDSC‐specific genes in its DEG signature (Fig. 2D,E; Fig. S4G,H).
Subtype‐specific gene networks and key regulators
To uncover gene–gene coexpression/co‐regulation relationships in HGSOC, multiscale embedded gene co‐expression network analysis (megena) was performed to construct a global gene–gene correlation network from the transcriptomic data of all patients [29] (Fig. 3A, Table 2). While the RNA‐Seq data were available for only 420 TCGA HGSOC samples for building the megena network, this subpopulation and the 512 patients used for subtype clustering are sufficiently similar to make the network an accurate clinical representation of the entire TCGA‐HGSOC cohort (Table S2). megena identified 826 gene modules, which were significantly enriched for a variety of functions such as ECM (module M4), immune system process (module M6), interferon response (module M7), cell cycle (module M12), and cilium organization (module M15) (Fig. 3B).
Fig. 3.
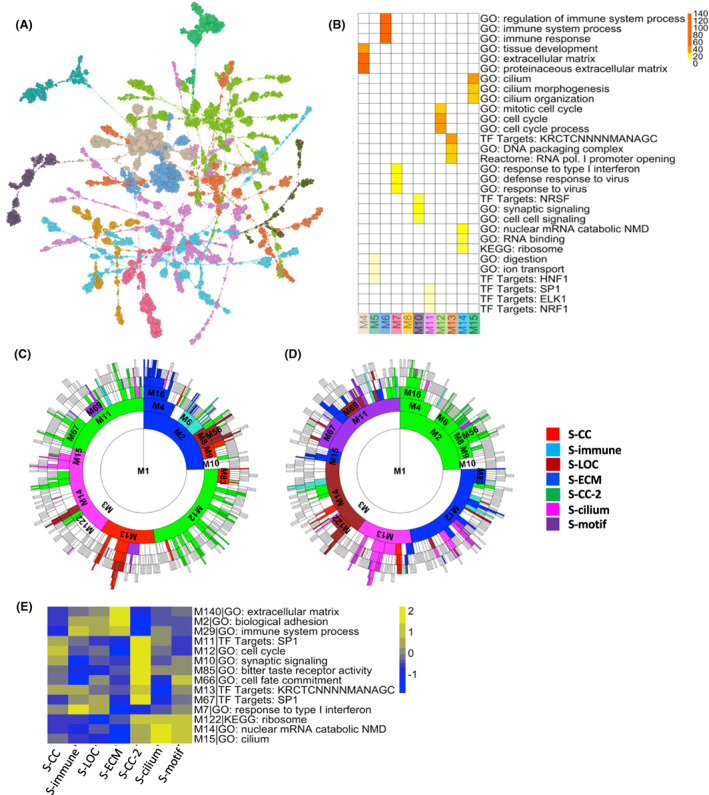
Characterization of the HGSOC subtype gene signatures of by the megena co‐expression network. (A) Graphical representation of the global megena gene network based on TCGA HGSOC mRNA expression. Node colors represent gene module membership, and node size is proportional to node degree. (B) Heatmap showing enrichment of module genes for MSigDB gene sets. Modules correspond to those shown in Fig. 3A. Module enrichment is determined via Fisher's exact test (FET) for overlapping genes. Color gradient shows −log10(FET Bonferroni‐corrected P‐value). (C, D) Sunburst plots showing overlap of subtype‐specific (C) upregulated or (D) downregulated DEGs with megena network module genes. Colors correspond to subtypes whose DEGs are most enriched for that module. Enrichment is ranked by FET P‐value. Modules with FET Bonferroni‐corrected P‐value > 0.05 are not colored. (E) Subtype mean expression of hub genes from select megena gene network modules. Mean expression is normalized by z‐score across subtypes. See also Figs S5 and S6.
Table 2.
Key resources.
| Reagent or resource | Source | Identifier |
|---|---|---|
| Software and algorithms | ||
| Deposited data | Zhang et al. [14] | https://doi.org/10.17632/67yzwc826b.2 |
| megena | Song et al. [29] | http://research.mssm.edu/multiscalenetwork/packages/MEGENA_1.1.tar.gz |
| estimate | Yoshihara et al. [24] | https://bioinformatics.mdanderson.org/estimate/ |
| MSigDB | Broad Institute | http://software.broadinstitute.org/gsea/msigdb |
| limma | Ritchie et al. [74] | https://bioconductor.org/packages/release/bioc/html/limma.html |
| lumi | Du et al. [73] | https://bioconductor.org/packages/release/bioc/html/lumi.html |
| gistic2.0 | Mermel et al. [36] | GISTIC2.0 |
| genepattern notebook | Reich et al. [78] | http://genepattern‐notebook.org/ |
| emudra | Zhou et al. [37] | https://doi.org/10.7303/syn11510888 |
| clue repurposing | CLUE | https://clue.io/repurposing‐app |
The co‐expressed gene modules significantly overlap with many DEG signatures of the subtypes. As expected, the signatures of these subtypes with similar OS are enriched for different sets of gene modules. S‐ECM and S‐CC‐2, the two subtypes with the poorest prognosis, have opposite patterns of DEG enrichment of the ECM modules (M4, M16, and M140) and cell cycle module (M12 and M12‐child modules) genes (Fig. 3C,D; Figs S5 and S6). For the subtypes with good prognosis, S‐immune DEG signature shows upregulation of the immune system (M6) and interferon response (M7) modules, in contrast to S‐cilium, which shows upregulation of ribosome and translation (M14) and cilium (M15) module genes and downregulation of DNA packaging and transcription (M13) genes (Fig. 3C,D; Figs S5 and S6). For subtypes with intermediate OS, S‐CC demonstrates upregulation in cell cycle (M83) as well as DNA packaging and transcription (M13, M114) module genes, S‐LOC shows downregulation in RNA processing (M69) and ribosome and protein translation (M14, M122, and M421) module genes, and S‐motif shows upregulation in targets of transcription factor SP1 (M11 and M67) modules (Fig. 3C,D; Fig. S5). Trends in the mean expression of megena module hub genes for each subtype also closely match the enriched modules, showing that these globally identified module hub genes are likely also subtype key hubs (Fig. 3E).
To confirm this hypothesis, we performed the key driver analysis (KDA) to identify subtype‐specific key regulators and found that a significant number of subtype‐specific key regulators are also key hub genes in the global megena network (Fig. 4; Fig. S7A–E) [30, 31]. The upregulated DEGs of S‐immune and the downregulated DEGs of S‐CC‐2 are concentrated in the immune response module M6 (Fig. 4A). CD53, a tetraspanin protein found primarily on cells of hematopoietic lineage, is the highest ranked key driver in both S‐immune and S‐CC‐2 (Fig. 4A). Other top‐ranked key regulators for S‐immune and S‐CC‐2 such as SPI1, SASH3, BIN2, PTPRC, and FERMT3 are also closely related to myeloid and lymphocyte development, innate immunity, and other hematopoietic cell functions. Together with the estimate scores and DEG enrichment gene signatures (Fig. 2C,E), these key regulators again demonstrate that differences in the amount of external immune cell infiltration are most likely responsible for the differences in immune gene expression for these two subtypes. Though the key regulators of S‐immune are most concentrated in the immune response module (M6) (Fig. 4A), S‐immune is also potentially driven by other key regulators in the major histocompatibility complex (MHC) class I antigen‐processing response module (M7) such as TAP1, TAP2, and PSMB9 (Fig. S7F). This finding, combined with the enrichment of the CTL‐high gene signature in S‐immune upregulated DEGs (Fig. 2E), suggests higher levels of antigen‐presentation and cytotoxic T‐cell activation compared with other subtypes.
Fig. 4.
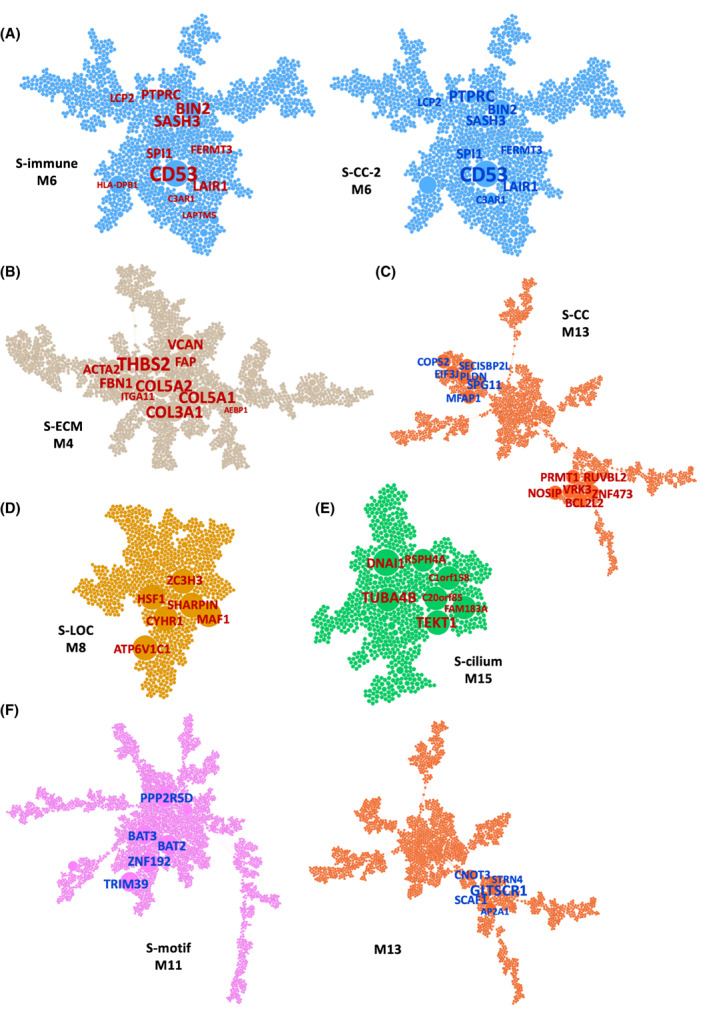
Predicted subtype key regulators projected onto megena mRNA network modules. (A–F) Node size and label size are proportional to key driver ranking, with text sizes corresponding to higher ranked key regulators. Label color represents direction of subtype‐specific DEGs (BH‐corrected P < 0.05) used for key driver prediction, where red corresponds to upregulated DEGs and blue corresponds to downregulated DEGs. (A) S‐immune and the S‐CC‐2 key regulators shown in the immune system process‐enriched module M6. (B) S‐ECM key regulators in the ECM‐enriched module M4. (C) S‐CC key regulators in the DNA packaging‐enriched module M13. (D) S‐LOC key regulators in the RNA binding‐enriched module M8. (E) S‐cilium key regulators in the cilium‐enriched module M15. (F) S‐motif key regulators in the transcription factor targets‐enriched module M11. See also Fig. S7.
Key regulators of S‐ECM are uniquely concentrated in the ECM module (M4) (Fig. 4B). Identification of collagen genes COL5A1, COL5A2, and COL3A1 as top key regulators points to a tumor microenvironment with significant fibrosis and desmoplastic change. Fibrogenesis in S‐ECM samples is likely due to the presence of an activated cancer‐associated fibroblast (CAF) population in the tumor microenvironment, as indicated by the identification of CAF marker genes as key regulators for S‐ECM, including FAP, ACTA2, PDGFRB, VCAN, and ITGA11 [25, 32, 33, 34] (Fig. 4B). Consequently, the unique upregulation of TGF‐beta family genes TGFB1, TGFBR2, TGFBI, TGFB1I1, and TGFB3 in S‐ECM could be due to increased production of TGF‐beta by CAFs in the tumor microenvironment [33]. Furthermore, CAFs can also secrete other immunosuppressive cytokines such as IL‐6 and C‐C motif chemokine ligand 2, both of which are upregulated in S‐ECM [33].
The key regulators of the rest subtypes are also distinct. S‐CC regulators predicted from both up‐ and downregulated DEGs primarily fall into the DNA packaging and transcription module (M13) and the cell cycle module (M12), such as PRMT1 and BCL2L12, and is suggestive of overactive cell replication in S‐CC (Fig. 4C; Fig. S7G). The key regulators of S‐LOC are primarily concentrated in module M8, which contains a number of genes related to RNA binding and translation (Fig. 4D), and key regulators in S‐cilium predicted by its upregulated DEGs all fall into M15, which is associated with cilium and cilium motility (Fig. 4E). This unique upregulation of cilium‐related genes in S‐cilium could explain the favorable prognosis of this subtype, as the maintenance of normal cilium gene expression has been implicated in decreased tumor proliferation [35]. Lastly, S‐motif key regulators fall into M11, which is enriched for genes containing conserved binding sites for transcription factors such as SP1, ELK1, and NRF1 (Fig. 4F). Integrating subtype patient outcome with subtype‐specific key drivers, we can predict appropriate activation or inhibition of key driver gene expression to promote antitumor processes and suppress tumorigenic pathways (Table S3). For example, further upregulation of the S‐immune key regulators will likely improve patient outcome, whereas this is not the case for S‐ECM and S‐CC‐2 (Table S3).
We found that the impact of differentially expressed (DE‐) miRNAs on gene expression varies by subtype. S‐ECM and S‐CC‐2 have the largest number of DE‐miRNAs compared with the other subtypes, whereas S‐CC, S‐LOC, and S‐cilium each have fewer than 12 DE‐miRNAs and consequently less miRNAs influence (Tables S4 and S5). DE‐miRNAs also seem to be significantly correlated with subtype‐specific key regulator expression (Figs S1A,B and S2). Subtype‐specific methylation analysis showed that cis‐differential methylated probe (DMP) genes also include a large portion of subtype‐specific key regulators, especially those that are predicted to downregulate DEGs in the S‐cilium and S‐motif (Fig. S1C,D, Table S6). Trans‐DMP genes are associated with upregulation of cell cycle signal in S‐CC‐2, as well as downregulation of ECM genes in S‐immune (Fig. S1E,F). Finally, we identified subtype‐specific CNAs using gistic2.0 [36], which produced different patterns of genomic locations with copy number variations for each subtype and predicted many more deletions than amplifications for all the subtypes (Figs S1G–J, S8 and S9, Tables S4 and S7). Most of the common gene amplifications and deletions involved in HGSOC tumorigenesis are simultaneously present in most subtypes and not subtype‐specific, except AKT1/2 amplifications and BRCA1/2 deletions, which are present in only two subtypes (Table S8).
Subtype‐specific therapeutics
The genetic heterogeneity of the seven HGSOC subtypes suggests the need for individualized treatment strategies. To this end, we used the recently developed Ensemble of Multiple Drug Repositioning Approaches (emudra) to identify drugs that can reverse differentially expressed gene signatures in each subtype in comparison with normal ovarian tissues [37] (see Methods). DEGs between subtypes versus normal samples showed significant and coherent functional categories that are largely similar to those from DEGs identified by comparing subtypes to the rest of the tumor samples (Table S9). Additional input to emudra included drug perturbation data from over 10 000 compounds tested on four cancer cell lines [37]. Comparison of the log2(fold change) values of the DEGs between each subtype versus the normal samples to those of the drug treatment DEGs shows that the top‐ranked drugs for each subtype can reverse the DEG signature of the subtype (Fig. 5A; Table S9).
Fig. 5.
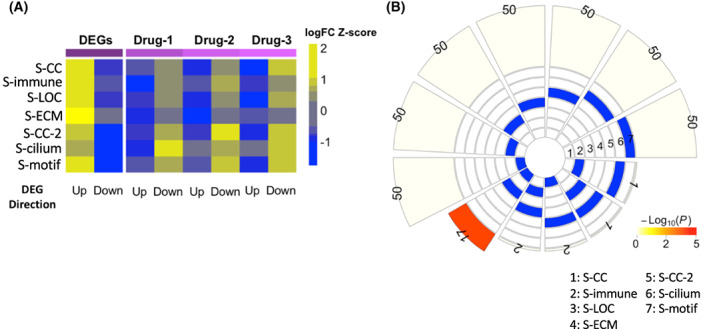
Characterization of the top predicted drugs for each of the seven HGSOC subtype. (A) Heatmap of the average log2(fold change) values of the top 50 DEGs (ranked by P‐value) for each subtype versus the normal ovarian tissues and those of the same set of genes induced by the top 3 predicted drugs for the respective subtype. The log2(fold change) values are z‐score normalized within each subtype. (B) Intersection of the lists of top predicted drugs for the seven subtypes. Here, we considered the top 50 drugs for each subtype. Intersections with at least one shared drug are shown. Intersection significance was assessed by FET. Color gradient shows −log10(FET P‐value).
The unique gene expression profiles of the HGSOC subtypes resulted in small overlap between the predicted drug lists (Fig. 5B). Among all the 21 pairwise comparison, 2 pairs of subtypes share 1 drug, 2 pairs share 2 drugs, and a pair (S‐CC and S‐LOC) share 17 drugs. The large overlap between S‐CC and S‐LOC may be due to relatively similar expression profiles though a vast majority of their drugs are different. Although the DEGs upregulated in S‐CC, S‐LOC, and S‐CC‐2 are all enriched for cell cycle‐related processes (Table S9), the predicted top drugs are very different (Tables S2 and S10). Subtypes with similarly good or poor prognoses also have different drugs. Although topoisomerase inhibitors have been shown to be effective in treating platinum‐resistant HGSOC, they are predicted to reverse only S‐CC‐2 DEG signatures but not those for S‐ECM (Table 3) [38]. Similarly, the top‐ranked drugs for S‐immune and S‐cilium, two subtypes with good prognoses, belong to different drug classes as well (Table 3, Table S10).
Table 3.
Summary of top‐ranked repositioned drugs with available annotation information.
| Subtype | Rank | Compound | Mode of action | Target(s) | Disease area | Phase |
|---|---|---|---|---|---|---|
| S‐CC | 2 | Tyrphostin ag 1478 | EGFR inhibitor | EGFR, MAPK14 | Preclinical | |
| 4 | bms‐754807 | IGF‐1 inhibitor | AKT1, IGF1R | Phase 2 | ||
| 11 | 4‐Demethoxy‐daunorubicin | Topoisomerase inhibitor | TOP2A | Hematologic malignancy | Launched | |
| S‐immune | 10 | Barasertib | Aurora kinase inhibitor | AURKA, AURKB |
Phase 2 Phase 3 |
|
| 15 | BRD‐K27305650 | mTOR inhibitor, PI3K inhibitor, DNA‐dependent protein kinase inhibitor, phosphodiesterase inhibitor, PLK inhibitor | AKT1, CHEK1, GSK3B, LCK, MAPK1, MAPK11‐12, MAPK14, MAPK8, MTOR, PIK3CA‐B, PIK3CD, PIK3CG, PLK1, PRKCA, PRKDC, ROCK1, RPS6KB1, SGK1 | Preclinical | ||
| S‐LOC | 5 | azd8055 | mTOR inhibitor | MTOR | Phase 1 | |
| 7 | BRD‐K44432556 | Hypoxia‐inducible factor activator | HIF1A | Preclinical | ||
| 8 | BRD‐K57080016 | MEK inhibitor | MAP2K1 | Phase 3 | ||
| S‐ECM | 7 | Ropinirole | Dopamine receptor agonist | ADRA2A‐C, DRD1‐5, HTR1A‐B, HTR2A‐D | Neurology, psychiatry | Launched |
| 12 | Alclometasone | Glucocorticoid receptor agonist | CYP3A4, NR3C1, SERPINA6 | Dermatology | Launched | |
| 30 | Toremifene‐citrate | Estrogen receptor antagonist, selective estrogen receptor modulator (SERM) | ESR1 | Oncology | Launched | |
| S‐CC‐2 | 3 | Camptothecin | Topoisomerase inhibitor | TOP1 | Phase 3 | |
| 13 | Doxorubicin | Topoisomerase inhibitor | TOP2A | Hematologic malignancy, oncology | Launched | |
| 16 | 4‐Demethoxy‐daunorubicin | Topoisomerase inhibitor | TOP2A | Hematologic malignancy | Launched | |
| S‐cilium | 14 | mdl 11,939 | Serotonin receptor antagonist | HTR2A‐C | Phase 2 | |
| 32 | tcs 359 | FLT3 inhibitor | FLT3 | Preclinical | ||
| S‐motif | 6 | Prilocaine | Local anesthetic | SCN1‐5A, SCN7‐11A | Neurology, psychiatry | Launched |
| 17 | BRD‐A59174698 | Adrenergic receptor agonist | ADRB2 | Obstetrics, gynecology | Launched | |
| 33 | Atovaquone | Mitochondrial electron transport inhibitor | DHODH | Infectious disease | Launched |
Discussion
In this study, we developed a novel clustering algorithm called MWINA and applied it to the multiomic data from HGSOC to uncover seven novel HGSOC subtypes that are highly distinct in OS. These subtypes are robust and not biased toward clinical parameters such as tumor stage and grade. More importantly, the subtypes are comprehensively characterized by specific molecular changes involving microRNAs, DNA methylation and copy number alterations as well as molecular networks.
By utilizing MWINA, our study identified subtypes with coherent gene expression signatures that can be categorized into very poor (S‐ECM and S‐CC‐2), intermediate (S‐CC and S‐motif), and relatively good (S‐immune, S‐LOC, and S‐cilium) prognoses [14, 39]. In addition, our multiscale co‐expression network analysis of HGSOC and the extension into multiomic correlation networks enabled in‐depth, comprehensive characterization of the identified subtypes. Previous work on ovarian cancer subtyping such as Zhang et al.'s subtype analysis showed a concentration of both high‐grade and late‐stage tumors in their subtype‐2, which also demonstrated enrichment in ECM‐ and EMT‐related genes [14]. However, even though the subtype S‐ECM from this study is also enriched for similar genes, there is no significant difference in tumor grade and stage among the MWINA subtypes. Furthermore, the other MWINA subtypes also have clearly defined molecular signatures, such as immune system activation (S‐immune), cell cycle (S‐CC and S‐CC‐2), cilium (S‐cilium), and transcription factor binding motifs (S‐motif) that are associated with prognostic outcome. Although the subtypes from Zhang et al. had significantly different overall survival times, it is unclear whether the other subtypes besides subtype‐2 had well‐defined gene signatures and key regulators that are associated with prognosis. Furthermore, the highly translational nature of our work in the utilization of emudra to predict subtype‐specific therapies lays the foundation for the development of subtype‐based personalized treatment strategies in HGSOC.
Interestingly, two subtypes with similar ages at diagnosis and similarly favorable prognoses are regulated by completely different molecular pathways. The tumors from S‐immune display high immune cell infiltrates and low stromal cell infiltrates as shown by their DEG signatures and estimate profiles. By contrast, the tumors from S‐cilium have very low immune gene expression, and while their ECM gene expression is also low, they display an upregulated cilium gene signature that could point to the S‐cilium tumors being in a quiescent state, resulting in longer OS [40, 41, 42, 43]. However, loss of cilia expression, such as observed in patients belonging to S‐ECM, leads to aberrant hedgehog (Hh) signaling in HGSOC, resulting in maintenance of cancer stem cells, decreased cell differentiation, and eventual cancer progression [35]. This may open the opportunity for subtype‐specific treatment with ciliogenesis‐promoting drugs such as glucocorticoids, fibrates, and other nuclear receptor modulators [44]. Alclometasone, a glucocorticoid receptor agonist and one of the top‐ranked repositioned drugs for S‐ECM, could prove to be highly effective for patients belonging to this subtype. On the contrary, the patients from S‐immune may benefit from immune checkpoint inhibitors combined with mTOR inhibitors to enhance the activation and cytotoxicity of the relatively large amount of CD8+ T‐cells already present in this subtype [45, 46, 47]. BRD‐K27305650, an mTOR inhibitor predicted to reverse S‐immune gene expression signatures, could be an ideal candidate for this purpose.
Besides the loss of cilia expression, S‐ECM also has upregulated ECM and immune response which are under the regulation of microRNAs and methylations. On the contrary, S‐CC‐2, which has similarly poor survival as S‐ECM, is characterized by a gene signature profile that is almost completely opposite. The patients in S‐CC‐2 have downregulated ECM and immune response as well as upregulated cell cycle‐related process also under significant regulation of microRNAs and methylations. It is interesting to note that although S‐CC is similar to S‐CC‐2 in both tumor cell type composition and upregulated cell cycle gene expression, the patients in S‐CC have longer OS. This difference in survival may be due to miRNA and methylation dysregulation seen in S‐CC‐2, as S‐CC has only one‐sixth of DE‐miRNAs and fewer than 2.5% of DMPs compared with the Subtype‐5.
It has been shown that expression of various ECM‐remodeling proteins and components is associated with poor prognosis in HGSOC [22]. Similar to the mesenchymal subtype from the original TCGA study of ovarian cancer, S‐ECM shows upregulation of genes such as COL5A2, COL1A1, COL3A1, THBS2, COL11A1, COL6A3, and MMP2 that are involved in epithelial‐to‐mesenchymal transformation (EMT) processes, metastasis, and chemoresistance [48, 49, 50, 51, 52]. The lack of significant enrichment in interferon signaling combined with high stromal cell infiltration in S‐ECM could also contribute to chemoresistance, as interferon‐gamma derived from CD8+ lymphocytes is involved in modulation of fibroblast‐associated resistance to platinum‐based chemotherapy [53].
Ropinirole, a dopamine receptor agonist predicted to reverse the gene signatures of S‐ECM, may be an effective innovative therapy for targeting the TGF‐beta and EMT processes. A previous study showed that defects in the dopamine D2 receptor (D2R) led to a pro‐inflammatory environment characterized by increased tumor necrosis factor‐alpha, TGF‐beta1, Smad3, Snail1, as well as increased EMT processes and increased production of ECM proteins such as vimentin, fibronectin 1, and collagen I, and an increase in normal D2R subsequently downregulated the expression of these proteins [54]. Similarly, dopamine was also found to improve the survival of mice implanted with liver cancer [55].
Differences in gene expression signatures and survival outcomes between the younger S‐immune and the older S‐CC‐2 patients are suggestive of the tumor evolution trajectory of HGSOC [56]. Earlier stage of HGSOC development is often characterized by greater lymphocyte infiltration that leads to an active immune response, whereas cancer later in the evolutionary trajectory demonstrates negligible immune cell presence in the tumor microenvironment [56]. This phenomenon was characterized previously by the TCGA group in their identification of the immunoreactive subtype, which has many resemblances to S‐immune [5]. Therefore, it is not surprising that the key regulators downregulated in S‐CC‐2, but upregulated in the S‐immune include CD53, a key player in B‐cell activation [57, 58], and PTPRC, a regulator in T‐cell and B‐cell antigen receptor signaling and positive regulator of T‐cell activation [59]. Additionally, various types of interferon signaling, which is downregulated in S‐CC‐2 but upregulated in S‐immune, have been shown to deter HGSOC tumor progression and improve patient prognosis [60, 61, 62]. Specifically, increased type I interferon signaling reduces immunosuppression in the tumor microenvironment by upregulating CD45+ immune cells, CD8+ T‐cells, and natural killer cells, and is associated with favorable outcomes [45, 63, 64]. This explains the longer survival seen in the patients from S‐immune, which has significantly higher expression of tumor infiltrating lymphocytes (TILs) marker compared with other subtypes [65, 66]. PRMT1 and BCL2L12, the top two upregulated regulators of S‐CC, also play critical roles in tumor development. BCL2L12 can bind to p53 in the nucleus to prevent association with p53 targets [67] and also acts as anti‐apoptotic factor in glioblastoma by inhibiting caspases 3 and 7 in the cytoplasm [68, 69, 70]. PRMT1 expression is critical in maintaining cell cycle processes in many types of cancer, and its depletion significantly reduces the number of cells in the S phase of the cell cycle [71].
Our innovative multiomics‐based approach to patient clustering in HGSOC yielded seven molecular subtypes that have distinct signatures in gene expression and upstream regulation not observed in previous studies. In addition to the subtypes with significantly distinct OS, it is interesting that we identified two pairs of subtypes with similar prognostic outcomes but entirely opposite gene signatures as well as different drug susceptibility profiles. These findings highlight the heterogeneity of the disease even among patients that have almost identical clinical parameters and demonstrate the critical importance of accurate and biologically meaningful subtypes in HGSOC.
However, there are a few important limitations to our study. Although we categorized HGSOC patients into subtypes with distinct molecular signatures, the bulk nature of the RNA‐seq data means it is difficult to attribute upregulated genes to the tumor cells alone. Since it is highly likely that gene signatures are also reflective of stromal and immune cell infiltration, it may be necessary to look into single‐cell sequencing data in the future in order to refine our drug repositioning results to target both tumor and stromal subsets simultaneously. In addition, it is important to recognize that the study of ovarian cancer is gradually shifting away from an era of placing tumors into discrete subtypes and to modeling HGSOC subtypes as various stages in the tumor development trajectory [72]. Geistlinger et al. concluded that current HGSOC subtypes may be reflective of the later, subclonal stages of the disease, and subtype‐specific therapies should instead target genomic alterations that occur earlier in tumor evolution in order to be effective.
In summary, we integrated large‐scale multiomics data to identify seven HGSOC subtypes which not only have significantly distinct overall survival but also carry unique patterns of gene expression, microRNA expression, DNA methylation, and copy number alterations. These subtypes show more significant prognostic difference. Second, we performed multiscale gene co‐expression network analysis to identify subtype‐specific key regulators and predicted targeted therapies based on subtype‐specific gene expression patterns. While the previous studies have done subtyping analysis of HGSOC, our study is the first one to integrate three major components including subtyping analysis, network analysis, and drug repositioning. Additional work is needed to translate this basic research into clinical applications but the more precise molecular subtyping, the comprehensive depiction of the molecular features of these subtypes, and the predicted subtype‐specific therapies derived from this study lay down a solid foundation for precision medicine for HGSOC. Future work will include experimental validation of subtype‐specific pathways and regulators, predicted therapeutics, as well as creating a biomarker panel of top subtype‐specific key regulators that can distinguish patient subtypes in a clinical setting.
Methods
Data processing
Level 3 open access data available through the NIH National Cancer Institute Genomic Data Commons (GDC) Data Portal for the Cancer Genome Atlas (TCGA) ovarian serous cystadenocarcinoma mRNA expression (Illumina HiSeq RNA‐Seq and HG‐U133A microarray) and miRNA expression (Illumina HiSeq miRNA‐Seq, RPKM data) were downloaded and processed in November 2014, and methylation beta values (Illumina Infinium HumanMethylation27 array) and masked copy number segment data (Affymetrix SNP 6.0 array) were downloaded and processed in August 2018. Clinical data, including stage, residual tumor size, tumor grade, and OS, were also obtained through the GDC Data Portal. OS is a closed dataset and is defined as time to death from day of diagnosis for deceased patients or time to last follow‐up for living patients at the time of data collection.
Genes with no or low expression in RNA‐Seq mRNA (n = 420) and miRNA (n = 486) expression data were removed. The filtered data then underwent log2 transformation, quantile normalization, and correction by linear regression for confounding covariate effects including batch, tissue source site, center, plate, race, and age. Genes with no or low expression in the microarray gene expression data for normal (n = 8) and tumor (n = 586) samples were also filtered out, and log2 transformation, quantile normalization, and correction by linear regression for confounding covariate effects including batch, tissue source site, center, plate, race, and age were subsequently performed. 18 243 mRNA genes and 705 miRNAs from RNA‐Seq data remained after filtering, and 12 042 genes from microarray data remained after filtering. These remaining genes were used for downstream analyses. Five hundred and twelve patients with mRNA expression, microRNA expression, methylation, and CNA data were used for subtype identification. Though the RNA‐Seq data were available for only 420 samples and 486 samples for mRNA and miRNA expression, there is no significant difference in the clinical demographics between the 512 patients used for subtype clustering and the sample subset with RNA‐Seq data (Table S2). Additionally, all the subtypes were well‐represented, with 70–90% of patients from each subtype having mRNA RNA‐Seq data available, and 86–97% of patients from each subtype having miRNA RNA‐Seq data available.
Methylation beta values were converted to M‐values using the function beta2m from the lumi R package [73], and then the M‐values were corrected by linear regression for confounding covariate effects including batch, tissue source site, center, plate, race, and age. Only corrected M‐values from primary tumor samples (n = 540) were used for differential methylated probe (DMP) analysis and DMP‐gene correlation analysis. Copy number segment data did not undergo normalization or covariate correction, since the data had been previously tangent normalized as part of the data preparation and analysis pipeline from the National Cancer Institute Genomic Data Commons (https://docs.gdc.cancer.gov/Data/Bioinformatics_Pipelines/CNV_Pipeline/). Briefly, the segment data were normalized by subtracting variations found in a set of normal samples, and only segment data from primary tumor samples (n = 568) were used for downstream analyses.
MWINA clustering for de novo subtype identification
Multiscale Weighted Interaction Network Analysis (MWINA) was used to create de novo subtype clusters using a set of survival‐associated multiomic features described previously [20]. A combination of features including mRNA expression, microRNA expression, copy number alteration, and DNA methylation from TCGA high‐grade ovarian serous adenocarcinoma was selected based on univariate Cox proportional hazard model analysis (P < 0.05) [14]. A total of 4526 features were used, including the expression of 1651 mRNA genes, 140 microRNAs, 2191 somatic copy number alterations, and 455 DNA methylation sites [14]. Features were normalized as follows:
where Featurenorm is the normalized expression value, Feature is the unnormalized expression value, Mediancontrols is the feature median of expression of the normal control samples, and SDpatients is the feature standard deviation of the patient samples [14].
MWINA employs multiresolution optimization of Newman's modularity (denoted Q) with Reichardt‐Bornholdt (RB) parameter [21], γRB, allowing for detection of fine‐resolution modules with small γRB <1, coarse‐grained modules with larger γRB >1, and converging to Q when γRB = 1. In order to optimize Q(γRB = γ′) for some γ′ > 0, we employed an iterative three‐step optimization approach:
Split: For each module, perform k‐median clustering on the shortest path distance (SPD) for k = 2, …, k max for some k max, where the solution with k = k′ optimizing Q(γRB = γ′) is chosen.
- Merge: For all pairs of modules after step 1, perform the following iterative procedure.
- Identify an adjacent module pair which improves Q(γRB = γ′) the most and merge if the merged Q(γRB = γ′) is higher than the preceding solution,
- Repeat step 2‐a until no further pair is found.
Refine: Perform extremal optimization by assigning node fitness as a function of Q(γRB = γ′), shifting module membership of least fit nodes.
Steps 1–3 are repeated iteratively till no further improvements are made.
With the aforementioned algorithm, solutions are obtained for γmin ≤ γ′ ≤ γmax with some increment dγ. Let us denote the solution for each γ′ as Z(γ′). In order to identify similar solutions and range of γ′ that behave similarly, adjusted Rand Index (ARI) was employed to measure similarity between two distinct solutions Z(γ′) and Z(γ″) with some threshold of ARI > ARIcutoff to determine similar. For each = {γ|ARI(Z(γa), Z(γb)) > ARIcutoff for γa, γb ɛ}, the median solution showing the largest overall score. The median solutions across all are gathered to identify the final multiscale solution of MWINA.
Chi‐squared test for comparing overall survival
The chi‐squared statistic was computed to compare the subtype OS for the MWINA TCGA‐HGSOC subtypes, with the null hypothesis being that there is no significant difference among the distributions of the subtype OS.
Cluster consensus and robustness evaluation
Subtype consensus was evaluated by performing MWINA clustering 50 times, each time using 80% of randomly sampled features and 80% of randomly sampled patients. Results from the 50 times bootstrapping were summarized into a n‐by‐n matrix of pairwise sample concordance values, where n is the total number of patients, and the value at position n ij is the probability that patient i and patient j are in the same cluster:
Individual subtype robustness was evaluated by calculating the probability that the sum of pairwise concordance values for patients within a subtype is greater than the sum of pairwise concordances for the same number of randomly sampled patients. Using this probability, we calculated a robustness empirical P‐value for each subtype based on the comparison of the sum of subtype patient pairwise concordances to that of 1 million iterations of randomly sampled patients:
Differential gene expression analysis
Differentially expressed genes (DEGs), miRNAs (DE‐miRNAs), and methylated probes (DMPs) were identified using expression data from TCGA (as described previously) with the limma R package [74]. Subtype‐specific DEGs were found between samples within each subtype versus remaining samples from all other subtypes and also between subtype samples versus samples with normal ovarian tissue. HG‐U133A microarray data were used for DEG analysis between tumor samples versus normal tissue, since there are no RNA‐Seq data available through TCGA for normal tissue. DE‐miRNAs and DMPs were calculated between samples within each subtype versus remaining samples from all other subtypes. Significantly differentially expressed genes were defined as having fold change (FC) ≥ 1.2 and Benjamini–Hochberg (BH)‐adjusted P < 0.05.
Fisher's exact test
Fisher's exact test (FET) was performed to evaluate gene set overlaps between MSigDB annotated gene sets, subtype gene sets (such as subtype‐specific DEGs, DE‐miRNA‐affected genes, cis‐eDMP and trans‐eDMP genes, and key regulators), megena module genes, and other gene sets including cancer‐associated fibroblast, cytotoxic T‐cell, and myeloid‐derived suppressor cell genes signatures. FET was also performed to determine overlap between TCGA‐HGSOC subtype samples for MWINA subtypes and Zhang et al. [14] subtypes. FET significance is defined by P‐value < 0.05 after Bonferroni correction.
Gene set enrichment
Gene set annotations used in gene set enrichment analysis were downloaded from the Molecular Signatures Database (MSigDB) [75, 76, 77]. One‐sided Fisher's exact test (FET) was performed between MSigDB gene sets versus subtype DEGs, miRNA‐correlated genes, genes under methylation regulation, and predicted amplified or deleted genes.
megena network construction
megena (Multiscale Embedded Gene Co‐expression Network Analysis) is a novel gene co‐expression network framework that utilizes parallelized embedded network construction and novel clustering techniques to identify multiscale modules in Planar Filtered Networks (PFNs) [29]. The megena gene co‐expression network for HGSOC was constructed RNA‐Seq mRNA expression data from the GDC Data Portal and processed as described previously. A false discovery rate (FDR) threshold of 0.10 was used to filter out insignificant gene–gene interactions, and a module FDR threshold of 0.05 was applied to identify significant multiscale gene modules.
Key driver analysis
Key driver analysis (KDA) was performed for to identify subtype‐specific key regulators (drivers). The global HGSOC megena gene co‐expression network (N) and significant subtype‐specific DEGs (G) (between subtype samples versus remaining tumor‐bearing patient samples from all other subtypes, as described above) were used as inputs for KDA. Fisher's exact test was used to identify network nodes whose one‐ to two‐degree neighbors are enriched in genes in G, and nodes with a BH‐corrected P‐value < 0.05 are identified as key regulators (drivers). This analysis is done separately for up and downregulated DEGs for all seven HGSOC subtypes to identify upregulated and downregulated key regulators.
Correlation analysis
Spearman correlation was performed to identify mRNA‐mRNA, mRNA‐miRNA, and mRNA‐methylation relationships. Pearson correlation was performed between patient age at diagnosis and OS time and between estimate tumor purity scores and OS time. For features with different numbers of samples, the intersection of samples was used. Correlation significance is defined by P‐value < 0.05 after Bonferroni correction.
Prediction of subtype amplified and deleted genes
TCGA patient copy number segment data were categorized by subtype membership and genes with significant copy number altered regions for each subtype were identified using the gistic2.0 algorithm available via the genepattern notebook online tool suite with default settings [36, 78]. Human genome assembly GRCh38 (hg38) was used as the refgene file. The marker file was created from the TCGA segmentation file and records the start and end positions of each segment as individual markers.
Drug repositioning
Subtype‐specific DEGs between subtype samples versus normal ovarian tissue samples were identified as described previously. We used more relaxed cutoffs to determine DEGs for each subtype due to a small number (8) of normal samples curated in the TCGA cohort. For subtypes 4 and 5, we used P‐value < 0.15, and for the rest subtypes, we used P‐value < 0.2. These DEG signatures were taken as input for the Ensemble of Multiple Drug Repositioning Approach (emudra) as described previously [37] to identify drugs that can reverse these signatures. We considered only the data from 4 cell lines (MCF7, HT29, A375, and A549) treated with the largest number of drugs in the LINCS cohort [79]. Specifically, 12 812, 13 622, 12 312, and 13 159 drugs were tested in the MCF7, HT29, A375, and A549 cell lines, respectively, while 8764 drugs tested in all four cell lines. Only the drugs tested in at least two of the four cell lines were included in the final ranking.
We obtained the annotations of the compounds from the Repurposing Hub drug repurposing hub (https://clue.io/repurposing‐app). The Repurposing Hub contains comprehensive annotations for a total of 6125 compounds: 2369 Launched drugs, 1619 drugs that reached phases 1–3 of clinical development, 96 compounds that were previously approved but withdrawn from use, and 2041 preclinical or tool compounds. Specifically, we extracted a variety of drug information, including compound name, clinical trial status, mechanism of action, protein targets, disease areas, and approved indications (where applicable). We excluded the compounds that have no annotation.
Quantification and statistical analysis
Statistical details and parameters including the exact value of n, the definition of center, dispersion and precision measures (mean ± SD) and statistical significance are reported in the figures and figure legends. The data are judged to be statistically significant if P < 0.05 after Bonferroni correction for correlation analysis and FET, or fold change ≥ 1.2 and P < 0.05 after Benjamini–Hochberg correction for differential expression analysis. Survival significance for MWINA subtypes is determined by the chi‐squared test. Differences in sample features and sample clinical data were determined by the Kruskal–Wallis analysis of variance test and Student's t‐test, and significance was reached if P < 0.05. Statistical analysis was performed with R.
Conflict of interest
The authors declare no conflict of interest.
Author contributions
BZ conceptualized and designed the study. MJW, S‐HC and YAW participated in the study design. MJW and S‐HC participated in the discussion of the results. YAW performed research; RN, WS, XZ and SV contributed software tools and participated in data analysis and interpretation. YAW and BZ wrote the manuscript. All the authors reviewed and revised the paper.
Supporting information
Fig. S1. Functional annotation of upstream regulator signatures of the HGSOC subtypes. (A‐B) Heatmaps showing enrichment of MSigDB gene sets in (A) upregulated genes and (B) downregulated genes for each set of subtype DE‐miRNA‐affected genes. DE‐miRNAs were identified by comparing the samples in a subtype with the rest of the samples. (C‐D) Heatmaps showing enrichment of MSigDB gene sets in the subtype cis‐eDMP genes for (C) hypermethylated and (D) hypomethylated DMPs. (E‐F) Heatmaps showing enrichment of MSigDB gene sets in genes (E) upregulated and (F) downregulated for each subtype that are also predicted to be under trans‐regulation by subtype DMPs. DMPs were identified by comparing the samples in each subtype with the rest of the samples. (G‐H) Heatmaps showing enrichment of MSigDB gene sets in the predicted (G) amplified and (H) deleted genes for each subtype. (I‐J) Bar plots showing number of overlapping (I) amplified and (J) deleted genes between subtype pairs. Green dots below each bar indicate the subtype pairs being compared.
Fig. S2. Subtype‐specific DE‐miRNAs and DMPs and their relationships with megena network modules. Graphical representation of regulation of subtype‐specific DEGs by top 10 subtype DE‐miRNAs and DMPs. DEGs are highlighted by color within megena network modules, and DEGs labeled in white are also subtype key regulators. DE‐miRNAs and DMPs are also color coded as shown. Edges between megena module nodes and DE‐miRNAs and DMPs show significant positive (red) or negative (blue) expression correlations. (A) S‐immune DE‐miRNAs and DMPs and the immune system process‐enriched module M6. (B) S‐ECM DE‐miRNAs and DMPs and the ECM‐enriched module M4. (C) S‐CC‐2 DE‐miRNAs and DMPs and the immune system process‐enriched module M6.
Fig. S3. MWINA subtypes are robust redistributions of Zhang et al HGSOC subtypes and have some differences in age at diagnoses. (A) Plots of HGSOC sample concordances. Samples are along the x and y axes, and color intensities correspond to sample pairwise concordance probabilities. Concordance probabilities range from 1.0 along the diagonal (red) to 0 (white). Concordance clustering is based on Euclidean, Manhattan, or Maximum distance calculation methods. (B) Heatmap of ‐log10(p‐value) from Student's t‐test for age at diagnosis between subtype pairs. Only comparisons between Group 4 or Group 5 versus other subtypes were significant (p < 0.05). (C) Heatmap of ‐log10(p‐value) from Fisher's exact test for overlap between patients from MWINA subtypes and patients from Zhang et al (2013) subtypes.
Fig. S4. HGSOC subtypes with similar prognosis have distinct gene expression signatures. (A‐B) Heatmap of MSigDB gene set enrichment for overexpressed (A) and underexpressed (B) genes in HGSOC tumor samples of each subtype with respect to normal controls. Enrichment is represented by FET ‐log10(BH‐adjusted p‐value) for gene set overlap. (C‐F) Overlap of upregulated or downregulated DEGs between (C) poor surviving subtypes (S‐ECM and S‐CC‐2) and (D‐F) favorable survival subtypes (S‐immune, S‐LOC, and S‐cilium). P‐value is calculated from Fisher's exact test (FET), and nonsignificant FET p‐values (p > 0.05) are not shown. (G‐H) Heatmaps showing subtype DEG enrichment for genes up‐ or downregulated in (D) CAFs from ovarian tumors compared with normal ovarian stroma, and for genes upregulated in (E) MDSCs (compared with PMNs) from NSCLC. Enrichment is determined via FET. Color gradient shows ‐log10(FET p‐value). FET, Fisher's exact test; CAF, cancer‐associated fibroblast; MDSC, myeloid‐derived suppressor cell; NSCLC, non‐small‐cell lung cancer. Related to Fig. 2.
Fig. S5. megena module genes are enriched for HGSOC subtype upregulated DEGs. Sunburst plots showing overlap of subtype‐specific upregulated DEGs with megena network module genes. Colors correspond to ‐log10(FET p‐value). Modules with p‐value >0.05 are not colored. Related to Fig. 3.
Fig. S6. megena module genes are enriched for HGSOC subtype downregulated DEGs. Sunburst plots showing overlap of subtype‐specific downregulated DEGs with megena network module genes. Colors correspond to ‐log10(FET p‐value). Modules with p‐value >0.05 are not colored. Related to Fig. 3.
Fig. S7. Overlap of subtype‐specific key driver genes and megena module genes. (A‐E) Overlap of subtype‐specific key driver genes and megena module hub genes for (A) S‐CC and cell cycle‐enriched module M83, (B) S‐immune and immune system process‐enriched module M6 and interferon response‐enriched module M7, (C) S‐ECM and ECM‐enriched module M4, (D) S‐CC‐2 and immune system process‐enriched module M6 and cell cycle‐enriched module M12, and (E) S‐cilium and cilium‐enriched module M15. P‐value is calculated from Fisher's exact test (FET) ECM, extracellular matrix; FET, Fisher's exact test. (F‐G) Subtype‐specific key drivers shown in megena modules. Node size and label size are proportional to key driver ranking, with larger node and text sizes corresponding to higher ranked key drivers. Label color represents direction of subtype‐specific DEGs (p < 0.05) used for key driver prediction, where red corresponds to upregulated DEGs and blue corresponds to downregulated DEGs. (F) S‐immune key drivers shown in the interferon response‐enriched module M7. (G) S‐CC key drivers in the cell cycle‐enriched module M12. Related to Fig. 4.
Fig. S8. Focal somatic copy number alterations for subtype samples by chromosome location of amplified regions
Fig. S9. Focal somatic copy number alterations for subtype samples by chromosomal location for deleted regions.
Table S1. Kruskal–Wallis test for significance of clinical traits and estimate scores in subtypes.
Table S2. Student's t‐test of clinical traits between samples with RNA‐Seq data and samples used for subtype identification.
Table S3. Predicted therapeutic actions on subtype‐specific key driver genes.
Table S4. Number of differentially expressed genes, miRNAs, methylated positions, and amplifications and deletions for each subtype compared with the rest of the samples.
Table S5. Overlap between subtype DEGs or key drivers and genes significantly correlated (Spearman p < 0.05) with subtype DE‐miRNAs.
Table S6. Overlap between subtype DEGs or key drivers and subtype cis‐eDMP genes.
Table S7. Overlap between subtype DEGs or key drivers and predicted amplified or deleted genes.
Table S8. Presence of amplified and deleted genes commonly associated with HGSOC tumorigenesis for all subtypes.
Table S9. Functional annotation enrichment of DEGs between subtype vs. normal ovarian tissue used for drug repositioning analysis.
Table S10. Top 5 repositioned drugs for each subtype.
Acknowledgements
This work was supported in parts by grants from the Mount Sinai Seed Fund, the National Institutes of Health (NIH)/National Institute on Aging (R01AG046170 and RF1AG057440), NIH/National Institute of Allergy and Infectious Diseases (U01AI111598) and NIH/National Institute of Diabetes and Digestive and Kidney Diseases (R01DK118243).
Edited by Takashi Gojobori
Data accessibility
Input data for MWINA clustering have been deposited in Mendeley Data at https://doi.org/10.17632/67yzwc826b.2. megena R package is available at CRan (https://cran.r‐project.org/).
References
- 1. Siegel RL, Miller KD, Jemal A. Cancer statistics, 2018. CA Cancer J Clin. 2018;68:7–30. [DOI] [PubMed] [Google Scholar]
- 2. Wang YK, Bashashati A, Anglesio MS, Cochrane DR, Grewal DS, Ha G, et al. Genomic consequences of aberrant DNA repair mechanisms stratify ovarian cancer histotypes. Nat Genet. 2017;49:856–65. [DOI] [PubMed] [Google Scholar]
- 3. Tothill RW, Tinker AV, George J, Brown R, Fox SB, Lade S, et al. Novel molecular subtypes of serous and endometrioid ovarian cancer linked to clinical outcome. Clin Cancer Res. 2008;14:5198–208. [DOI] [PubMed] [Google Scholar]
- 4. Helland A, Anglesio MS, George J, Cowin PA, Johnstone CN, House CM, et al. Deregulation of MYCN, LIN28B and LET7 in a molecular subtype of aggressive high‐grade serous ovarian cancers. PLoS One. 2011;6:e18064. [DOI] [PMC free article] [PubMed] [Google Scholar]
- 5. Cancer Genome Atlas Research Network . Integrated genomic analyses of ovarian carcinoma. Nature. 2011;474:609–15. [DOI] [PMC free article] [PubMed] [Google Scholar]
- 6. Bentink S, Haibe‐Kains B, Risch T, Fan JB, Hirsch MS, Holton K, et al. Angiogenic mRNA and microRNA gene expression signature predicts a novel subtype of serous ovarian cancer. PLoS One. 2012;7:e30269. [DOI] [PMC free article] [PubMed] [Google Scholar]
- 7. Yang D, Sun Y, Hu L, Zheng H, Ji P, Pecot CV, et al. Integrated analyses identify a master microRNA regulatory network for the mesenchymal subtype in serous ovarian cancer. Cancer Cell. 2013;23:186–99. [DOI] [PMC free article] [PubMed] [Google Scholar]
- 8. Tan TZ, Miow QH, Huang RY, Wong MK, Ye J, Lau JA, et al. Functional genomics identifies five distinct molecular subtypes with clinical relevance and pathways for growth control in epithelial ovarian cancer. EMBO Mol Med. 2013;5:1051–66. [DOI] [PMC free article] [PubMed] [Google Scholar]
- 9. Gardi NL, Deshpande TU, Kamble SC, Budhe SR, Bapat SA. Discrete molecular classes of ovarian cancer suggestive of unique mechanisms of transformation and metastases. Clin Cancer Res. 2014;20:87–99. [DOI] [PubMed] [Google Scholar]
- 10. Jonsson JM, Johansson I, Dominguez‐Valentin M, Kimbung S, Jonsson M, Bonde JH, et al. Molecular subtyping of serous ovarian tumors reveals multiple connections to intrinsic breast cancer subtypes. PLoS One. 2014;9:e107643. [DOI] [PMC free article] [PubMed] [Google Scholar]
- 11. Konecny GE, Wang C, Hamidi H, Winterhoff B, Kalli KR, Dering J, et al. Prognostic and therapeutic relevance of molecular subtypes in high‐grade serous ovarian cancer. J Natl Cancer Inst. 2014;106:dju249. [DOI] [PMC free article] [PubMed] [Google Scholar]
- 12. Zhang S, Jing Y, Zhang M, Zhang Z, Ma P, Peng H, et al. Stroma‐associated master regulators of molecular subtypes predict patient prognosis in ovarian cancer. Sci Rep. 2015;5:16066. [DOI] [PMC free article] [PubMed] [Google Scholar]
- 13. Way GP, Rudd J, Wang C, Hamidi H, Fridley BL, Konecny GE, et al. Comprehensive cross‐population analysis of high‐grade serous ovarian cancer supports no more than three subtypes. G3 (Bethesda). 2016;6:4097–103. [DOI] [PMC free article] [PubMed] [Google Scholar]
- 14. Zhang W, Liu Y, Sun N, Wang D, Boyd‐Kirkup J, Dou X, et al. Integrating genomic, epigenomic, and transcriptomic features reveals modular signatures underlying poor prognosis in ovarian cancer. Cell Rep. 2013;4:542–53. [DOI] [PubMed] [Google Scholar]
- 15. Asad M, Wong MK, Tan TZ, Choolani M, Low J, Mori S, et al. FZD7 drives in vitro aggressiveness in Stem‐A subtype of ovarian cancer via regulation of non‐canonical Wnt/PCP pathway. Cell Death Dis. 2014;5:e1346. [DOI] [PMC free article] [PubMed] [Google Scholar]
- 16. Hayano T, Yokota Y, Hosomichi K, Nakaoka H, Yoshihara K, Adachi S, et al. Molecular characterization of an intact p53 pathway subtype in high‐grade serous ovarian cancer. PLoS One. 2014;9:e114491. [DOI] [PMC free article] [PubMed] [Google Scholar]
- 17. Lu L, Katsaros D, Canuto EM, Biglia N, Risch HA, Yu H. LIN‐28B/let‐7a/IGF‐II axis molecular subtypes are associated with epithelial ovarian cancer prognosis. Gynecol Oncol. 2016;141:121–7. [DOI] [PubMed] [Google Scholar]
- 18. Stuart JM, Segal E, Koller D, Kim SK. A gene‐coexpression network for global discovery of conserved genetic modules. Science. 2003;302:249–55. [DOI] [PubMed] [Google Scholar]
- 19. Greenwood MR. The relationship of enzyme activity to feeding behavior in rats: lipoprotein lipase as the metabolic gatekeeper. Int J Obes (Lond). 1985;9(Suppl 1):67–70. [PubMed] [Google Scholar]
- 20. Neff RA, Wang M, Vatansever S, Guo L, Ming C, Wang Q, et al. Molecular subtyping of Alzheimer's disease using RNA sequencing data reveals novel mechanisms and targets. Sci Adv. 2021;7:eabb5398. [DOI] [PMC free article] [PubMed] [Google Scholar]
- 21. Reichardt J, Bornholdt S. Statistical mechanics of community detection. Phys Rev E Stat Nonlin Soft Matter Phys. 2006;74:016110. [DOI] [PubMed] [Google Scholar]
- 22. Cheon DJ, Tong Y, Sim MS, Dering J, Berel D, Cui X, et al. A collagen‐remodeling gene signature regulated by TGF‐beta signaling is associated with metastasis and poor survival in serous ovarian cancer. Clin Cancer Res. 2014;20:711–23. [DOI] [PMC free article] [PubMed] [Google Scholar]
- 23. Izar B, Tirosh I, Stover EH, Wakiro I, Cuoco MS, Alter I, et al. A single‐cell landscape of high‐grade serous ovarian cancer. Nat Med. 2020;26:1271–9. [DOI] [PMC free article] [PubMed] [Google Scholar]
- 24. Yoshihara K, Shahmoradgoli M, Martinez E, Vegesna R, Kim H, Torres‐Garcia W, et al. Inferring tumour purity and stromal and immune cell admixture from expression data. Nat Commun. 2013;4:2612. [DOI] [PMC free article] [PubMed] [Google Scholar]
- 25. Yeung TL, Leung CS, Wong KK, Samimi G, Thompson MS, Liu J, et al. TGF‐beta modulates ovarian cancer invasion by upregulating CAF‐derived versican in the tumor microenvironment. Cancer Res. 2013;73:5016–28. [DOI] [PMC free article] [PubMed] [Google Scholar]
- 26. Leffers N, Fehrmann RS, Gooden MJ, Schulze UR, Ten Hoor KA, Hollema H, et al. Identification of genes and pathways associated with cytotoxic T lymphocyte infiltration of serous ovarian cancer. Br J Cancer. 2010;103:685–92. [DOI] [PMC free article] [PubMed] [Google Scholar]
- 27. Edgar R, Domrachev M, Lash AE. Gene Expression Omnibus: NCBI gene expression and hybridization array data repository. Nucleic Acids Res. 2002;30:207–10. [DOI] [PMC free article] [PubMed] [Google Scholar]
- 28. Barrett T, Wilhite SE, Ledoux P, Evangelista C, Kim IF, Tomashevsky M, et al. NCBI GEO: archive for functional genomics data sets – update. Nucleic Acids Res. 2013;41:D991–5. [DOI] [PMC free article] [PubMed] [Google Scholar]
- 29. Song W‐M, Zhang B. Multiscale embedded gene co‐expression network analysis. PLoS Comput Biol. 2015;11:e1004574. [DOI] [PMC free article] [PubMed] [Google Scholar]
- 30. Zhang B, Gaiteri C, Bodea LG, Wang Z, McElwee J, Podtelezhnikov AA, et al. Integrated systems approach identifies genetic nodes and networks in late‐onset Alzheimer's disease. Cell. 2013;153:707–20. [DOI] [PMC free article] [PubMed] [Google Scholar]
- 31. Huan T, Zhang B, Wang Z, Joehanes R, Zhu J, Johnson AD, et al. A systems biology framework identifies molecular underpinnings of coronary heart disease. Arterioscler Thromb Vasc Biol. 2013;33:1427–34. [DOI] [PMC free article] [PubMed] [Google Scholar]
- 32. Busch S, Andersson D, Bom E, Walsh C, Stahlberg A, Landberg G. Cellular organization and molecular differentiation model of breast cancer‐associated fibroblasts. Mol Cancer. 2017;16:73. [DOI] [PMC free article] [PubMed] [Google Scholar]
- 33. Chen X, Song E. Turning foes to friends: targeting cancer‐associated fibroblasts. Nat Rev Drug Discov. 2019;18:99–115. [DOI] [PubMed] [Google Scholar]
- 34. Parajuli H, Teh MT, Abrahamsen S, Christoffersen I, Neppelberg E, Lybak S, et al. Integrin alpha11 is overexpressed by tumour stroma of head and neck squamous cell carcinoma and correlates positively with alpha smooth muscle actin expression. J Oral Pathol Med. 2017;46:267–75. [DOI] [PMC free article] [PubMed] [Google Scholar]
- 35. Austyn JM, Gordon S. F4/80, a monoclonal antibody directed specifically against the mouse macrophage. Eur J Immunol. 1981;11:805–15. [DOI] [PubMed] [Google Scholar]
- 36. Mermel CH, Schumacher SE, Hill B, Meyerson ML, Beroukhim R, Getz G. GISTIC2.0 facilitates sensitive and confident localization of the targets of focal somatic copy‐number alteration in human cancers. Genome Biol. 2011;12:R41. [DOI] [PMC free article] [PubMed] [Google Scholar]
- 37. Zhou X, Wang M, Katsyv I, Irie H, Zhang B. EMUDRA: ensemble of multiple drug repositioning approaches to improve prediction accuracy. Bioinformatics. 2018;34:3151–9. [DOI] [PMC free article] [PubMed] [Google Scholar]
- 38. Tsunetoh S, Terai Y, Sasaki H, Tanabe A, Tanaka Y, Sekijima T, et al. Topotecan as a molecular targeting agent which blocks the Akt and VEGF cascade in platinum‐resistant ovarian cancers. Cancer Biol Ther. 2010;10:1137–46. [DOI] [PMC free article] [PubMed] [Google Scholar]
- 39. Zhang Z, Huang K, Gu C, Zhao L, Wang N, Wang X, et al. Molecular subtyping of serous ovarian cancer based on multi‐omics data. Sci Rep. 2016;6:26001. [DOI] [PMC free article] [PubMed] [Google Scholar]
- 40. Pan J, Snell W. The primary cilium: keeper of the key to cell division. Cell. 2007;129:1255–7. [DOI] [PubMed] [Google Scholar]
- 41. Goto H, Inoko A, Inagaki M. Cell cycle progression by the repression of primary cilia formation in proliferating cells. Cell Mol Life Sci. 2013;70:3893–905. [DOI] [PMC free article] [PubMed] [Google Scholar]
- 42. Plotnikova OV, Golemis EA, Pugacheva EN. Cell cycle‐dependent ciliogenesis and cancer. Cancer Res. 2008;68:2058–61. [DOI] [PMC free article] [PubMed] [Google Scholar]
- 43. Plotnikova OV, Pugacheva EN, Golemis EA. Primary cilia and the cell cycle. In: Sloboda RD, editor. Primary cilia. London: Academic Press; 2009. p. 137–60. [DOI] [PMC free article] [PubMed] [Google Scholar]
- 44. Friedman N, Linial M, Nachman I, Pe'er D. Using Bayesian networks to analyze expression data. J Comput Biol. 2000;7:601–20. [DOI] [PubMed] [Google Scholar]
- 45. Desvergne B, IJpenberg A, Devchand PR, Wahli W. The peroxisome proliferator‐activated receptors at the cross‐road of diet and hormonal signalling. J Steroid Biochem Mol Biol. 1998;65:65–74. [DOI] [PubMed] [Google Scholar]
- 46. Kaneda MM, Messer KS, Ralainirina N, Li H, Leem CJ, Gorjestani S, et al. PI3Kgamma is a molecular switch that controls immune suppression. Nature. 2016;539:437–42. [DOI] [PMC free article] [PubMed] [Google Scholar]
- 47. Lastwika KJ, Wilson W 3rd, Li QK, Norris J, Xu H, Ghazarian SR, et al. Control of PD‐L1 expression by oncogenic activation of the AKT‐mTOR pathway in non‐small cell lung cancer. Cancer Res. 2016;76:227–38. [DOI] [PubMed] [Google Scholar]
- 48. Monks SA, Leonardson A, Zhu H, Cundiff P, Pietrusiak P, Edwards S, et al. Genetic inheritance of gene expression in human cell lines. Am J Hum Genet. 2004;75:1094–105. [DOI] [PMC free article] [PubMed] [Google Scholar]
- 49. Berger J, Tanen M, Elbrecht A, Hermanowski‐Vosatka A, Moller DE, Wright SD, et al. Peroxisome proliferator‐activated receptor‐gamma ligands inhibit adipocyte 11beta‐hydroxysteroid dehydrogenase type 1 expression and activity. J Biol Chem. 2001;276:12629–35. [DOI] [PubMed] [Google Scholar]
- 50. Kim H, Watkinson J, Varadan V, Anastassiou D. Multi‐cancer computational analysis reveals invasion‐associated variant of desmoplastic reaction involving INHBA, THBS2 and COL11A1. BMC Med Genomics. 2010;3:51. [DOI] [PMC free article] [PubMed] [Google Scholar]
- 51. Januchowski R, Swierczewska M, Sterzynska K, Wojtowicz K, Nowicki M, Zabel M. Increased expression of several collagen genes is associated with drug resistance in ovarian cancer cell lines. J Cancer. 2016;7:1295–310. [DOI] [PMC free article] [PubMed] [Google Scholar]
- 52. Wu YH, Huang YF, Chang TH, Chou CY. Activation of TWIST1 by COL11A1 promotes chemoresistance and inhibits apoptosis in ovarian cancer cells by modulating NF‐kappaB‐mediated IKKbeta expression. Int J Cancer. 2017;141:2305–17. [DOI] [PubMed] [Google Scholar]
- 53. Wang W, Kryczek I, Dostal L, Lin H, Tan L, Zhao L, et al. Effector T cells abrogate stroma‐mediated chemoresistance in ovarian cancer. Cell. 2016;165:1092–105. [DOI] [PMC free article] [PubMed] [Google Scholar]
- 54. Jiang X, Konkalmatt P, Yang Y, Gildea J, Jones JE, Cuevas S, et al. Single‐nucleotide polymorphisms of the dopamine D2 receptor increase inflammation and fibrosis in human renal proximal tubule cells. Hypertension. 2014;63:e74–80. [DOI] [PMC free article] [PubMed] [Google Scholar]
- 55. Liu XF, Long HJ, Miao XY, Liu GL, Yao HL. Fisetin inhibits liver cancer growth in a mouse model: relation to dopamine receptor. Oncol Rep. 2017;38:53–62. [DOI] [PMC free article] [PubMed] [Google Scholar]
- 56. McGranahan N, Swanton C. Clonal heterogeneity and tumor evolution: past, present, and the future. Cell. 2017;168:613–28. [DOI] [PubMed] [Google Scholar]
- 57. Kotelevtsev Y, Holmes MC, Burchell A, Houston PM, Schmoll D, Jamieson P, et al. 11beta‐Hydroxysteroid dehydrogenase type 1 knockout mice show attenuated glucocorticoid‐inducible responses and resist hyperglycemia on obesity or stress. Proc Natl Acad Sci USA. 1997;94:14924–9. [DOI] [PMC free article] [PubMed] [Google Scholar]
- 58. Schaper F, van Spriel AB. Antitumor immunity is controlled by tetraspanin proteins. Front Immunol. 2018;9:1185. [DOI] [PMC free article] [PubMed] [Google Scholar]
- 59. Rheinlander A, Schraven B, Bommhardt U. CD45 in human physiology and clinical medicine. Immunol Lett. 2018;196:22–32. [DOI] [PubMed] [Google Scholar]
- 60. Pan J, Xiang Q, Ball S, Scatina J, Kao J, Hong JY. Lipopolysaccharide‐mediated modulation of cytochromes P450 in Stat1 null mice. Drug Metab Dispos. 2003;31:392–7. [DOI] [PubMed] [Google Scholar]
- 61. Marth C, Fiegl H, Zeimet AG, Müller‐Holzner E, Deibl M, Doppler W, et al. Interferon‐γ expression is an independent prognostic factor in ovarian cancer. Am J Obstet Gynecol. 2004;191:1598–605. [DOI] [PubMed] [Google Scholar]
- 62. Goodarzi MO, Guo X, Taylor KD, Quinones MJ, Saad MF, Yang H, et al. Lipoprotein lipase is a gene for insulin resistance in Mexican Americans. Diabetes. 2004;53:214–20. [DOI] [PubMed] [Google Scholar]
- 63. Stone ML, Chiappinelli KB, Li H, Murphy LM, Travers ME, Topper MJ, et al. Epigenetic therapy activates type I interferon signaling in murine ovarian cancer to reduce immunosuppression and tumor burden. Proc Natl Acad Sci USA. 2017;114:E10981–90. [DOI] [PMC free article] [PubMed] [Google Scholar]
- 64. Bowtell DD, Bohm S, Ahmed AA, Aspuria PJ, Bast RC Jr, Beral V, et al. Rethinking ovarian cancer II: reducing mortality from high‐grade serous ovarian cancer. Nat Rev Cancer. 2015;15:668–79. [DOI] [PMC free article] [PubMed] [Google Scholar]
- 65. Ye Q, Song DG, Poussin M, Yamamoto T, Best A, Li C, et al. CD137 accurately identifies and enriches for naturally occurring tumor‐reactive T cells in tumor. Clin Cancer Res. 2014;20:44–55. [DOI] [PMC free article] [PubMed] [Google Scholar]
- 66. Goode EL, Block MS, Kalli KR, Vierkant RA, Chen W, Fogarty ZC, et al. Dose‐response association of CD8+ tumor‐infiltrating lymphocytes and survival time in high‐grade serous ovarian cancer. JAMA Oncol. 2017;3:e173290. [DOI] [PMC free article] [PubMed] [Google Scholar]
- 67. Wu W, Liu S, Liang Y, Zhou Z, Bian W, Liu X. Stress hormone cortisol enhances Bcl2 like‐12 expression to inhibit p53 in hepatocellular carcinoma cells. Dig Dis Sci. 2017;62:3495–500. [DOI] [PubMed] [Google Scholar]
- 68. Stegh AH, Chin L, Louis DN, DePinho RA. What drives intense apoptosis resistance and propensity for necrosis in glioblastoma? A role for Bcl2L12 as a multifunctional cell death regulator. Cell Cycle. 2008;7:2833–9. [DOI] [PubMed] [Google Scholar]
- 69. Stegh AH, Kesari S, Mahoney JE, Jenq HT, Forloney KL, Protopopov A, et al. Bcl2L12‐mediated inhibition of effector caspase‐3 and caspase‐7 via distinct mechanisms in glioblastoma. Proc Natl Acad Sci USA. 2008;105:10703–8. [DOI] [PMC free article] [PubMed] [Google Scholar]
- 70. Stegh AH, Kim H, Bachoo RM, Forloney KL, Zhang J, Schulze H, et al. Bcl2L12 inhibits post‐mitochondrial apoptosis signaling in glioblastoma. Genes Dev. 2007;21:98–111. [DOI] [PMC free article] [PubMed] [Google Scholar]
- 71. Yoshimatsu M, Toyokawa G, Hayami S, Unoki M, Tsunoda T, Field HI, et al. Dysregulation of PRMT1 and PRMT6, type I arginine methyltransferases, is involved in various types of human cancers. Int J Cancer. 2011;128:562–73. [DOI] [PubMed] [Google Scholar]
- 72. Geistlinger L, Oh S, Ramos M, Schiffer L, LaRue RS, Henzler CM, et al. Multiomic analysis of subtype evolution and heterogeneity in high‐grade serous ovarian carcinoma. Cancer Res. 2020;80:4335–45. [DOI] [PMC free article] [PubMed] [Google Scholar]
- 73. Du P, Zhang X, Huang CC, Jafari N, Kibbe WA, Hou L, et al. Comparison of beta‐value and M‐value methods for quantifying methylation levels by microarray analysis. BMC Bioinformatics. 2010;11:587. [DOI] [PMC free article] [PubMed] [Google Scholar]
- 74. Ritchie ME, Phipson B, Wu D, Hu Y, Law CW, Shi W, et al. limma powers differential expression analyses for RNA‐sequencing and microarray studies. Nucleic Acids Res. 2015;43:e47. [DOI] [PMC free article] [PubMed] [Google Scholar]
- 75. Subramanian A, Tamayo P, Mootha VK, Mukherjee S, Ebert BL, Gillette MA, et al. Gene set enrichment analysis: a knowledge‐based approach for interpreting genome‐wide expression profiles. Proc Natl Acad Sci USA. 2005;102:15545–50. [DOI] [PMC free article] [PubMed] [Google Scholar]
- 76. Liberzon A, Birger C, Thorvaldsdottir H, Ghandi M, Mesirov JP, Tamayo P. The molecular signatures database (MSigDB) hallmark gene set collection. Cell Syst. 2015;1:417–25. [DOI] [PMC free article] [PubMed] [Google Scholar]
- 77. Liberzon A, Subramanian A, Pinchback R, Thorvaldsdottir H, Tamayo P, Mesirov JP. Molecular signatures database (MSigDB) 3.0. Bioinformatics. 2011;27:1739–40. [DOI] [PMC free article] [PubMed] [Google Scholar]
- 78. Reich M, Tabor T, Liefeld T, Thorvaldsdottir H, Hill B, Tamayo P, et al. The GenePattern Notebook environment. Cell Syst. 2017;5:149–51.e1. [DOI] [PMC free article] [PubMed] [Google Scholar]
- 79. Subramanian A, Narayan R, Corsello SM, Peck DD, Natoli TE, Lu X, et al. A next generation connectivity map: L1000 platform and the first 1,000,000 profiles. Cell. 2017;171:1437–52.e17. [DOI] [PMC free article] [PubMed] [Google Scholar]
Associated Data
This section collects any data citations, data availability statements, or supplementary materials included in this article.
Supplementary Materials
Fig. S1. Functional annotation of upstream regulator signatures of the HGSOC subtypes. (A‐B) Heatmaps showing enrichment of MSigDB gene sets in (A) upregulated genes and (B) downregulated genes for each set of subtype DE‐miRNA‐affected genes. DE‐miRNAs were identified by comparing the samples in a subtype with the rest of the samples. (C‐D) Heatmaps showing enrichment of MSigDB gene sets in the subtype cis‐eDMP genes for (C) hypermethylated and (D) hypomethylated DMPs. (E‐F) Heatmaps showing enrichment of MSigDB gene sets in genes (E) upregulated and (F) downregulated for each subtype that are also predicted to be under trans‐regulation by subtype DMPs. DMPs were identified by comparing the samples in each subtype with the rest of the samples. (G‐H) Heatmaps showing enrichment of MSigDB gene sets in the predicted (G) amplified and (H) deleted genes for each subtype. (I‐J) Bar plots showing number of overlapping (I) amplified and (J) deleted genes between subtype pairs. Green dots below each bar indicate the subtype pairs being compared.
Fig. S2. Subtype‐specific DE‐miRNAs and DMPs and their relationships with megena network modules. Graphical representation of regulation of subtype‐specific DEGs by top 10 subtype DE‐miRNAs and DMPs. DEGs are highlighted by color within megena network modules, and DEGs labeled in white are also subtype key regulators. DE‐miRNAs and DMPs are also color coded as shown. Edges between megena module nodes and DE‐miRNAs and DMPs show significant positive (red) or negative (blue) expression correlations. (A) S‐immune DE‐miRNAs and DMPs and the immune system process‐enriched module M6. (B) S‐ECM DE‐miRNAs and DMPs and the ECM‐enriched module M4. (C) S‐CC‐2 DE‐miRNAs and DMPs and the immune system process‐enriched module M6.
Fig. S3. MWINA subtypes are robust redistributions of Zhang et al HGSOC subtypes and have some differences in age at diagnoses. (A) Plots of HGSOC sample concordances. Samples are along the x and y axes, and color intensities correspond to sample pairwise concordance probabilities. Concordance probabilities range from 1.0 along the diagonal (red) to 0 (white). Concordance clustering is based on Euclidean, Manhattan, or Maximum distance calculation methods. (B) Heatmap of ‐log10(p‐value) from Student's t‐test for age at diagnosis between subtype pairs. Only comparisons between Group 4 or Group 5 versus other subtypes were significant (p < 0.05). (C) Heatmap of ‐log10(p‐value) from Fisher's exact test for overlap between patients from MWINA subtypes and patients from Zhang et al (2013) subtypes.
Fig. S4. HGSOC subtypes with similar prognosis have distinct gene expression signatures. (A‐B) Heatmap of MSigDB gene set enrichment for overexpressed (A) and underexpressed (B) genes in HGSOC tumor samples of each subtype with respect to normal controls. Enrichment is represented by FET ‐log10(BH‐adjusted p‐value) for gene set overlap. (C‐F) Overlap of upregulated or downregulated DEGs between (C) poor surviving subtypes (S‐ECM and S‐CC‐2) and (D‐F) favorable survival subtypes (S‐immune, S‐LOC, and S‐cilium). P‐value is calculated from Fisher's exact test (FET), and nonsignificant FET p‐values (p > 0.05) are not shown. (G‐H) Heatmaps showing subtype DEG enrichment for genes up‐ or downregulated in (D) CAFs from ovarian tumors compared with normal ovarian stroma, and for genes upregulated in (E) MDSCs (compared with PMNs) from NSCLC. Enrichment is determined via FET. Color gradient shows ‐log10(FET p‐value). FET, Fisher's exact test; CAF, cancer‐associated fibroblast; MDSC, myeloid‐derived suppressor cell; NSCLC, non‐small‐cell lung cancer. Related to Fig. 2.
Fig. S5. megena module genes are enriched for HGSOC subtype upregulated DEGs. Sunburst plots showing overlap of subtype‐specific upregulated DEGs with megena network module genes. Colors correspond to ‐log10(FET p‐value). Modules with p‐value >0.05 are not colored. Related to Fig. 3.
Fig. S6. megena module genes are enriched for HGSOC subtype downregulated DEGs. Sunburst plots showing overlap of subtype‐specific downregulated DEGs with megena network module genes. Colors correspond to ‐log10(FET p‐value). Modules with p‐value >0.05 are not colored. Related to Fig. 3.
Fig. S7. Overlap of subtype‐specific key driver genes and megena module genes. (A‐E) Overlap of subtype‐specific key driver genes and megena module hub genes for (A) S‐CC and cell cycle‐enriched module M83, (B) S‐immune and immune system process‐enriched module M6 and interferon response‐enriched module M7, (C) S‐ECM and ECM‐enriched module M4, (D) S‐CC‐2 and immune system process‐enriched module M6 and cell cycle‐enriched module M12, and (E) S‐cilium and cilium‐enriched module M15. P‐value is calculated from Fisher's exact test (FET) ECM, extracellular matrix; FET, Fisher's exact test. (F‐G) Subtype‐specific key drivers shown in megena modules. Node size and label size are proportional to key driver ranking, with larger node and text sizes corresponding to higher ranked key drivers. Label color represents direction of subtype‐specific DEGs (p < 0.05) used for key driver prediction, where red corresponds to upregulated DEGs and blue corresponds to downregulated DEGs. (F) S‐immune key drivers shown in the interferon response‐enriched module M7. (G) S‐CC key drivers in the cell cycle‐enriched module M12. Related to Fig. 4.
Fig. S8. Focal somatic copy number alterations for subtype samples by chromosome location of amplified regions
Fig. S9. Focal somatic copy number alterations for subtype samples by chromosomal location for deleted regions.
Table S1. Kruskal–Wallis test for significance of clinical traits and estimate scores in subtypes.
Table S2. Student's t‐test of clinical traits between samples with RNA‐Seq data and samples used for subtype identification.
Table S3. Predicted therapeutic actions on subtype‐specific key driver genes.
Table S4. Number of differentially expressed genes, miRNAs, methylated positions, and amplifications and deletions for each subtype compared with the rest of the samples.
Table S5. Overlap between subtype DEGs or key drivers and genes significantly correlated (Spearman p < 0.05) with subtype DE‐miRNAs.
Table S6. Overlap between subtype DEGs or key drivers and subtype cis‐eDMP genes.
Table S7. Overlap between subtype DEGs or key drivers and predicted amplified or deleted genes.
Table S8. Presence of amplified and deleted genes commonly associated with HGSOC tumorigenesis for all subtypes.
Table S9. Functional annotation enrichment of DEGs between subtype vs. normal ovarian tissue used for drug repositioning analysis.
Table S10. Top 5 repositioned drugs for each subtype.
Data Availability Statement
Input data for MWINA clustering have been deposited in Mendeley Data at https://doi.org/10.17632/67yzwc826b.2. megena R package is available at CRan (https://cran.r‐project.org/).