

Summary
Suppressor of cytokine signaling-1 (SOCS1) exerts control over inflammation by targeting p65 nuclear factor-κB (NF-κB) for degradation in addition to its canonical role regulating cytokine signaling. We report here that SOCS1 does not operate on all p65 targets equally, instead localizing to a select subset of pro-inflammatory genes. Promoter-specific interactions of SOCS1 and p65 determine the subset of genes activated by NF-κB during systemic inflammation, with profound consequences for cytokine responses, immune cell mobilization, and tissue injury. Nitric oxide synthase-1 (NOS1)-derived nitric oxide (NO) is required and sufficient for the displacement of SOCS1 from chromatin, permitting full inflammatory transcription. Single-cell transcriptomic analysis of NOS1-deficient animals led to detection of a regulatory macrophage subset that exerts potent suppression on inflammatory cytokine responses and tissue remodeling. These results provide the first example of a redox-sensitive, gene-specific mechanism for converting macrophages from regulating inflammation to cells licensed to promote aggressive and potentially injurious inflammation.
Subject areas: Immunology, Molecular mechanism of gene regulation, Transcriptomics
Graphical abstract
Highlights
-
•
SOCS1 is a critical negative regulator of p65 NF-κB in unactivated macrophages
-
•
SOCS1 binds to a subset of pro-inflammatory genes, suppressing their transcription
-
•
NO from NOS1 removes SOCS1, licensing maximal pro-inflammatory transcription
-
•
NOS1 deficiency increases a subset of suppressive pulmonary macrophages
Immunology; Molecular mechanism of gene regulation; Transcriptomics
Introduction
Macrophages are widely distributed cells with critical roles in maintaining normal tissue homeostasis1,2 and removing tissue and cellular debris that could promote pathological inflammatory processes that adversely impact organ function. While this maintenance role is incredibly important, these cells must also be able to activate aggressive inflammation on detection of invading pathogens. This is required to effectively contain infection, enable pathogen clearance, and promote antigen presentation to activate adaptive immune cells.3,4 In this sense, macrophages are sentinels producing some of the earliest inflammatory signals to alert and activate other cell types via a complex and diverse array of cytokine- and chemokine-dependent signals.5,6 Functional variation exists in these responses, with the first recognized macrophage subset or “polarization” being classically activated macrophages, which mobilize immune cells to hunt, trap, and destroy pathogens, followed by alternatively activated macrophages, associated with the resolution of inflammation, initiation of tissue repair, and possibly even tumorigenesis.7,8 More recent reports support the existence of a multitude of macrophage inflammatory states whose specific composition of intercellular mediators determines different courses and outcomes for inflammation.3 Signaling mechanisms operating within the macrophage that specify these functional changes determine whether inflammation promotes immunity and the return to normal physiologic function or amplifies injury, leading to tissue dysfunction with potentially deadly consequences (i.e., systemic inflammatory response and sepsis). The work reported here describes a novel mechanism by which these cells switch from a homeostatic or even regulatory macrophage phenotype with powerful anti-inflammatory activity to a more aggressive, pro-inflammatory phenotype that can initiate aggressive immunologic responses with significant consequences for the surrounding tissue.
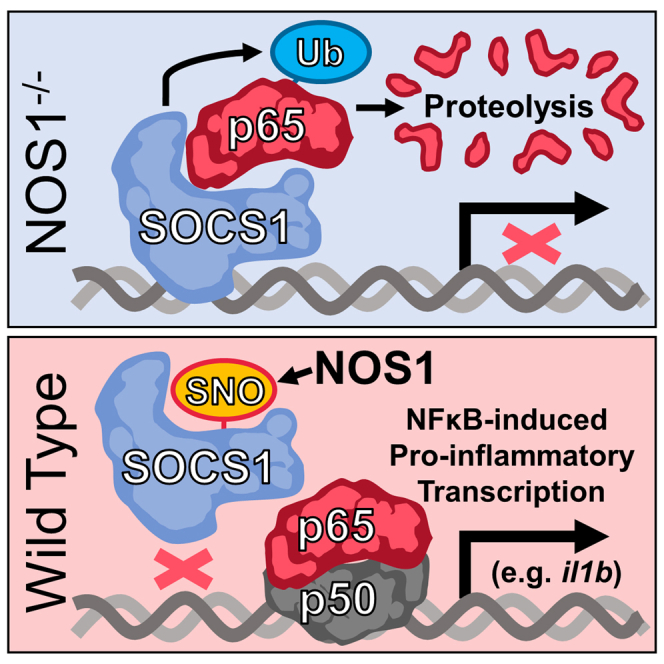
Nuclear factor κB (NF-κB) is a master regulator of inflammation, controlling the transcription of hundreds of pro-inflammatory and regulatory genes.9 Quantitative or qualitative changes to its transcriptional activity have the potential to determine whether inflammation is protective or pathologic. The canonical pro-inflammatory configuration of NF-κB is composed of a heterodimer of p65 and p50, whereas the p50 homodimer is normally associated with anti-inflammatory transcriptional activity.10,11 The stability of p65 in the nucleus and hence its capacity to bind target genes, is diminished by suppressor of cytokine signaling-1 (SOCS1), a major component of an E3-ubiquitin ligase complex that tags DNA-bound p65 for degradation.12,13 We previously reported that SOCS1 is S-nitrosated by nuclear nitric oxide synthase-1 (NOS1), impeding its association with p65. This preserves p65 protein levels and activity in the nucleus, in turn, enabling NFκB-dependent pro-inflammatory transcription.14 While results presented here confirm our previous hypothesis that SOCS1 enforces anti-inflammatory transcriptional activity by controlling the balance of active NF-κB conformations in the nucleus, the current study demonstrates that SOCS1 selectively regulates the transcription of a specific subset of pro-inflammatory gene targets. This occurs through direct binding to the cis-regulatory elements of these genes, and NOS1-derived NO is required to dislodge SOCS1 before full inflammatory transcription is possible. Preservation of SOCS1 in NOS1−/− macrophages leads to the emergence of a strongly immuno-regulatory macrophage functional polarization state that profoundly impacts the outcome of inflammation. Our results indicate that SOCS1 binding to pro-inflammatory NFκB-target genes in the resting state makes macrophages refractory to signals promoting tissue injury and that NOS1-derived NO is a required first step to displace SOCS1 from these sites thereby licensing their transcription and subsequent maximal p65 NFκB-dependent inflammatory transcriptional activation.
Results
NOS1-derived NO regulates a specific subset of NFκB-target genes (pattern 1 genes)
We previously reported that macrophages deficient in NOS1 are restricted in their ability to fully activate p65 NFκB-dependent pro-inflammatory transcription.14 To better understand this regulatory mechanism, whole transcriptome analysis was performed using RNA-Seq to compare wild-type (WT) and NOS1−/− bone marrow-derived macrophages (BMDM) at 0 (control), 2 (early inflammatory transcription), and 8 h (later inflammatory transcription/polarization) after stimulation of the cells with lipopolysaccharide (LPS) (Table S1). Principal components analysis of transcript abundance (Figure 1A) revealed that macrophages clustered together based on their LPS-treatment conditions rather than their NOS1 genotype, indicating that the regulation of transcription mediated by NOS1-derived NO was considerably more subtle than the changes stimulated by LPS. This was surprising considering our previous observation that NOS1 was required for both inflammatory injury and the expression of a critical subset of pro-inflammatory cytokines during endotoxemia.14 Nonetheless, it suggested the possibility that NOS1 exerted regulatory control over a more restricted and functionally important gene set. Thus, we identified 3,167 transcripts for further analysis based on their requirement for LPS for mRNA expression at 2 or 8 h (Figure 1B, see Table S1 for the individual genes and the ordering of genes in the heatmap). The requirement for NOS1 in transcription was determined by establishing filters for genes with more mRNA in WT than in knockout (KO) macrophages. Capturing genes known to have differential expression from previous work14 required adopting less stringent statistical thresholds, an approach further justified by the transcriptional similarity of the genotypes reported by the principle components analysis (PCA) (Figure 1A). This approach identified a subset of 943 LPS-inducible transcripts that required NOS1 for their maximal expression and 2,124 LPS-inducible transcripts that did not require NOS1 (Figure 1B and Table S1). More detailed kinetic analyses of mRNA by qPCR confirmed that this subset was reduced in NOS1−/− BMDM more than in WT macrophages (Figure 1C), while those genes identified as NOS1-independent were not significantly changed in NOS1−/− (Figure 1D). One notable exception was ifnb1, which was identified by RNA-Seq analysis as independent of NOS1, whereas more sensitive qPCR analysis confirmed it to be dependent on NOS1 for maximal expression. This may have resulted from reduced sensitivity in the RNA-Seq dataset, where the average signal for ifnb1 was quite low at 8 h (25) compared to il1b (60,309), il6 (8,159), or il12b (14,548) (see Table S1). Given its importance to inflammation, ifnb was analyzed further and reclassified as NOS1-dependent for downstream analyses based on qPCR results. Intriguingly, NOS1 also appears to suppress transcripts typically associated with alternatively activated macrophage phenotypes, inflammatory resolution, and tissue injury repair including Il10, Arginase-1, and Siglec-18,15 as these were increased in NOS1−/− cells (Figure S1). Analysis of the macrophage transcriptome both globally and kinetically, therefore, supports a role for NOS1 as a regulator of a select subset of macrophage inflammatory genes. This selectivity seemed unlikely to result from the product of NOS1 because NO is a highly diffusible gas that would be expected to reach the entire genome of the macrophage. Our previous report described the mechanism for NOS1-derived NO as controlling SOCS1, which in turn directly regulates p65 NF-κB protein stability. Because these transcriptome analyses indicated that NOS1 controls a considerably smaller (but functionally important) subset of inflammatory genes, we next determined if the NOS1/SOCS1 signaling axis could exert control at individual gene loci presented below.
Figure 1.

Transcriptomics of WT and NOS1−/− BMDM stimulated with LPS reveals that NOS1 function is required for the optimal transcription of a subset of pro-inflammatory genes in macrophages
(A) Principal components analysis of mRNA expression levels comparing LPS-responsive genes in WT or NOS1−/− BMDM stimulated with LPS (100 ng/ml) for 0, 2, or 8 h indicates that NOS1 deficiency has modest impact on overall transcriptional response of most LPS-induced genes in BMDM.
(B) Heatmap of normalized expression levels comparing LPS-responsive genes in WT or NOS1−/− BMDM stimulated with LPS for 0, 2, or 8 h. Data are segregated into NOS1-dependent (top) and independent (bottom) gene sets as described in the STAR Methods and presented as hierarchically clustered sets. See Table S1 for the values and ordering of all genes presented.
(C and D) (C) Kinetic analyses of mRNA abundance in LPS-stimulated BMDM over 24 h quantified by qPCR for NOS1-dependent and (D) NOS1-independent genes identified by RNA-Seq. Data show median ±SEM ∗p < 0.05, ∗∗∗p < 0.001, ∗∗∗∗p < 0.0001, Holm-Sidak test. See also Figure S1 for expression of genes associated with alternatively activated macrophages.
NOS1-derived nitric oxide must remove preloaded SOCS1 from regulatory regions of NOS1-dependent (pattern 1 genes) to license maximal p65 binding and transcription
Our group and others have reported that SOCS1 physically interacts with p65,13,14,16 an interaction that requires p65 binding to DNA.13 The gene-specific requirement we identified for NOS1 for maximal LPS-induced transcription (Figure 1) prompted us to determine if we could detect selective physical association of SOCS1 with these NOS1-dependent NFκB-regulatory sites. Because SOCS1 mediates the proteasomal degradation of p65,13,14,16 we reasoned that the loss of p65 from gene promoters in NOS1−/− compared to WT would be a good indication of target genes to investigate for SOCS1 selective binding. Sequencing of chromatin immunocleavage (ChIC-Seq) was performed (Table S2) with antibodies directed against p65 and SOCS1 in WT and NOS1−/− BMDM and the promoter regions, 3 kb upstream of the transcription start sites (TSS) were then analyzed for binding activity.17 Robust binding of p65 over IgG control was detected after 30 min or 8 h of LPS stimulation in 6,766 promoter regions. 1,862 of these genes were also identified as transcriptionally active after LPS treatment (described in Figure 1) and were selected for further analysis. These were further segregated using an additional filter for genes with preferential binding of p65 in WT over NOS1−/− as well as the preferential transcription in WT over NOS1−/−. Of the 1,862 LPS-dependent genes, we identified 218 genes that required NOS1 for full p65 binding and transcription and defined these genes as Pattern 1. 778 LPS-dependent genes that did not require NOS1 for either maximal mRNA or p65 binding were defined as Pattern 2 (Figure 2A and Table S3). Gene Ontology (GO) pathway analysis was performed for both Pattern 1 and Pattern 2 gene sets as well as the larger set of all genes that required LPS for maximal mRNA and p65 binding. To determine gene set specific functional annotations for each group, GO annotations were considered only if they were found to be significant in that group but they were not found to be significant in the other two gene sets (Figure 2B, Table S3). Pattern 1 genes were enriched for pathways involving T-helper 1 type cytokines, Natural Killer (NK) cell tumoricidal activity, and Major Histocompatibility Complex (MHC) II antigen presentation (Figure 2B and Table S3). The presence of pathways associated with innate immune cell mobilization, oxidant generation and response, as well as the repair of tissue damage were consistent with our previous findings that NOS1 plays an important role in inflammatory injury. By contrast Pattern 2 genes were enriched for pathways involving MHC I antigen presentation, IL-17, and IL-4, supporting the concept that the NOS1-dependent Pattern 1 genes represent a specialized subset of LPS-dependent genes (Table S3). The p65 binding to these two genes sets, as well as a third control set of genes that demonstrated minimal p65 binding that failed to increase after LPS treatment (to represent genomic background noise) is presented from pairwise analysis of WT versus NOS1−/− macrophages at 30 min and 8 h, sorted based on increased p65 binding at 8 h in WT over KO cells (Figure 2C and Table S2). Pattern 1 genes demonstrate significantly increased p65 in WT cells while Pattern 2 genes include a variety of presentations but none demonstrated statistical enrichment of p65 in WT. All Pattern 1 and Pattern 2 genes demonstrated LPS-inducible p65 binding, although this is not always apparent from the comparison of WT and NOS1−/− cells shown in Figure 2C. Unstimulated macrophages are not depicted here because the p65 signal was uniformly very low levels, as expected14 (see Figures 2E and 2F for a demonstration of baseline p65 binding).
Figure 2.

NOS1-dependence for p65 binding and transcription identifies a set of genes that preferentially recruit SOCS1 onto cis-regulatory sites prior to p65 recruitment
(A) Depiction of the logic for segregating genes into Pattern 1 (P1), Pattern 2 (P2), and Controls genes based on the global transcription and p65 binding analyses. A detailed explanation of the quantitative selection criteria can be found in the STAR Methods.
(B) Gene Ontology analysis was performed for i) P1, ii) P2, and iii) All genes that required LPS for maximal mRNA and p65 binding using the complete mouse genome as background. A selection of pathways are shown that were significantly enriched, False Discovery Rate (FDR) <0.05 for i) P1 but which were not enriched for ii) P2, or iii) all LPS genes. A full listing of GO annotations derived this way for all three gene sets can be found in Table S3.
(C) Binding intensities for p65 from ChIC-Seq for P1, P2, and Control (Cn) gene sets based on the DiffBind comparisons of WT and NOS1−/− BMDM 30 min and 8 h after LPS. Data is presented as heatmaps sorted based on the intensity of WT compared to NOS1−/− cells at 8 h. P1 genes demonstrate significantly increased p65 binding in WT cells compared to KO, while P2 genes do not. All genes presented demonstrate significantly increased p65 in WT cells after LPS treatment, data is provided in Table S2.
(D) SOCS1 ChIC-Seq binding distributions demonstrate increased binding by P1 genes. Data are presented as the maximum MACS2 peak score in the promoter regions of each gene compared to IgG control. Violin plots display kernel density estimation for the distributions of P1 (Red), P2 (blue), and Control (Green) genes presented as segregated by genotype and indicated treatment. Statistical analysis performed with Mann Whitney U testing indicated as ns (not significant), ∗ (p < 0.05), ∗∗ (p < 0.01), and ∗∗∗ (p < 0.0001).
(E) Heatmaps of p65 (top) and SOCS1 (bottom) binding intensity along 6 kb of genomic DNA centered on the TSS of P1, P2, or Control (Cn) gene sets. One replicate of duplicate samples of unstimulated or LPS-treated are depicted. Genes are presented in the same order for each gene set as determined by K means clustering, demonstrating that SOCS1 binding patterns mirror those of p65 but precede p65 binding in the unstimulated cells. Red indicates low binding, while white and then blue indicate increased binding intensity. Individual genes, their ordering, and their clustering can be found in Table S3.
(F) Averaged binding profiles for the data as presented in (E) show the relative enrichment of SOCS1 in untreated BMDM on sites that are not yet bound by p65, while IgG control binding patterns demonstrate no such enrichment.
To resolve SOCS1-binding activity, maximal SOCS1 ChIC-Seq binding intensity per gene was segregated based on the identified gene sets, genotype, and stimulatory conditions (Figure 2D). This is necessary because SOCS1 expression changes with LPS treatment; it was even identified as a Pattern 2 gene (see Tables S1 and S3).14 Pattern 1 genes that required NOS1 for maximal p65 binding and transcription did indeed demonstrate increased SOCS1 signal over Pattern 2 genes in NOS1−/− cells after both 30 min and 8 h of LPS stimulation (Figure 2D). LPS-treated WT macrophages, demonstrated increased SOCS1 binding on Pattern 1 genes at 30 min of LPS (albeit less significantly than in NOS1−/−) and this differential disappeared after 8 h of LPS, suggesting that NOS1 activity prevents preferential SOCS1 accumulation on Pattern 1 compared to Pattern 2 genes. Intriguingly, in the absence of LPS and thus before p65 is recruited, we could detect preferential binding of SOCS1 to Pattern 1 genes, both in NOS1−/− and in WT macrophages. Both Pattern 1 and 2 genes demonstrated significantly more SOCS1 binding than Control genes under all conditions. This suggested that in unstimulated macrophages, SOCS1 is preloaded onto the promoters of the NOS1-regulated Pattern 1 genes. To explore this, p65 and SOCS1 binding was visualized on these three gene sets for the 6 kb of genomic sequence flanking the TSS of each gene (Figures 2E and 2F). Chromatin-binding heatmaps of all genes presented in the same order based on K means clustering (See Table S3 for the order of genes and their clustering) demonstrate enrichment in TSS-proximal promoter regions for p65 after LPS. Similar patterns of binding were detected between p65 and SOCS1 after LPS treatment. Interestingly, the same binding pattern was detectable for SOCS1 even in the absence of LPS and p65 binding (Figures 2E and 2F). These findings prompted more detailed kinetic analysis of candidate genes using ChIP-PCR. We chose the identified Pattern 1 genes il1b, il12b, as well as ifnb1. We detected p65 enrichment on all three of these genes after 30 min, which was significantly dependent on NOS1 (Figure 3A), further substantiating the reclassification of ifnb1 as a Pattern 1 gene. SOCS1 binding was detectable at higher levels in untreated NOS1−/− BMDM than WT cells (Figure 3B), and only in WT macrophage was detectably decreased on all three genes after 15 min of LPS treatment, while in NOS1−/− macrophages there was no detectable decrease in SOCS1 binding. By 30 min however, the decrease was no longer detectable, likely due to the robust reexpression of new SOCS1 mRNA and protein. To determine the mechanism of NOS1-dependent depletion of SOCS1, macrophages were treated with NO generated from the chemical donor diethylamine (DEA) NONOate in the absence of LPS. This led to rapid depletion of SOCS1 from the Pattern 1 genes but had no impact on the background signal observed on Pattern 2 genes (Figure 3C). Taken together these results demonstrate that the regulatory elements of Pattern 1 genes, unlike those of Pattern 2 genes, are preloaded with SOCS1 in macrophages, and further indicate that very early after LPS treatment, NOS1-derived NO dislodges SOCS1 from these sites to render the promoters more accessible to p65.
Figure 3.

NOS1-derived NO is required to deplete SOCS1 from the regulatory regions of P1 genes
(A) Time-course ChIP-PCR analysis of p65 enrichment onto the regulatory regions of Il1b, Ifnb1, and Il12b genes in LPS-stimulated BMDM isolated from WT or NOS1−/− mice. Data show mean ±SEM ∗p < 0.05, ∗∗p < 0.01, two-way ANOVA test (n = 6). Dotted line represents the background noise of control IgG in all samples.
(B) Time-course ChIP-PCR analysis of SOCS1 enrichment onto regulatory regions of Il1b, Ifnb1, and Il12b genes in LPS-stimulated BMDM isolated from WT or NOS1−/− mice. Data show mean ± SEM ∗p < 0.05, ∗∗p < 0.01, ns = not significant, for two-way ANOVA testing (n = 6) between WT and NOS1−/− cells, # indicates p < 0.05 for reduction in a sample compared to its untreated control. Dotted line represents the background noise of control IgG in all samples.
(C) ChIP-PCR analysis of SOCS1 enrichment onto regulatory regions of P1 and P2 genes in unstimulated BMDM isolated from WT mice, compared to correspondent Normal IgG control. Data show mean ± SEM ∗∗∗p < 0.001, ∗∗∗∗p < 0.0001, ns = not significant, t-test (n = 6).
(D) ChIP-PCR analysis of SOCS1 enrichment onto regulatory regions of P1 and P2 genes in DEA NON-Oate-treated, unstimulated BMDM isolated from WT mice, compared to correspondent control. Data show mean ± SEM ∗∗∗p < 0.001, ∗∗∗∗p < 0.0001, ns = not significant, t-test (n = 4).
NOS1-derived nitric oxide is required for systemic expression of pattern 1 cytokines and pulmonary inflammation
Because the subset of NFκB-target inflammatory mediators regulated by SOCS1 contains cytokines typically involved in inflammatory tissue injury,13,18 we next sought to determine if early NO signaling in vivo impacts pulmonary tissue damage, a major cause of mortality during systemic inflammatory responses. WT and NOS1−/− mice were challenged with intraperitoneal LPS (10 mg/kg). Pattern 1 cytokines (IL1β, IL6, CCL2, and CXCL2) were significantly lower in serum of NOS1−/− than WT animals (Figure 4A). The reconstitution of NO signaling by coadministration of the chemical NO-donor S-nitroso-penicillamine (SNAP) concurrently with LPS, rescued the expression of these cytokines in NOS1−/− mice. Consistent with our in vitro findings, levels of cytokines/chemokines encoded by Pattern 2 NFκB-target genes, such as CXCL10 and CCL4, were neither dependent on NOS1, nor impacted by SNAP administration (Figure S2). Histologically, LPS-challenged NOS1−/− mouse lungs were protected compared to WT controls, where notable increases in parenchymal inflammatory edema were observed. Coadministration of NO donor, however, was sufficient to rescue inflammatory tissue remodeling in NOS1−/− mice to a level that was similar to that observed in WT lungs (Figure 4B). Similar to our observations with the Pattern 1 cytokines associated with inflammatory injury, these data support the role of NOS1-derived NO in promoting the actual tissue injury and remodeling observed with inflammatory lung injury.
Figure 4.

NOS1-derived nitric oxide is required to promote inflammation in vivo and pulmonary tissue injury
(A) Cytokine quantification in serum of WT or NOS1−/− mice (n = 7) injected with LPS ± SNAP or vehicle for 4 h. Data show mean ± SEM ∗p < 0.05, ∗∗p < 0.01, ∗∗∗p < 0.001 as deteremined by Student's t-test.
(B) Histological H&E staining of right lung of WT or NOS1−/− mice (representative of n = 3). Scale bar represents 1000μm. See also Figure S2 for NOS1-independent genes and the lack of impact of NOS1 deficiency or NO donor.
NOS1 deletion suppresses lung resident macrophage activation and prevents recruitment of inflammatory monocytes and neutrophils
The robust protection observed in NOS1−/− lungs motivated studies to determine if NOS1 regulates the activation of tissue resident macrophages or the recruitment of immune cells to the lungs. These populations were identified using a flow cytometric strategy that is detailed in Figures S3A and S3B.19 As described above, we observed that the gene locus for the pro-inflammatory T cell costimulatory molecule CD80 was bound by p65 and SOCS1 in a manner that was consistent with Pattern 1 genes in BMDM (Figure 2 and Table S3). This finding was further substantiated by the GO analyses of Pattern 1 and 2 genes (Figure 2B) and the known association of this critical immune-effector with antigen presentation, tissue injury, and inflammatory polarization.20,21,22 In addition, NOS1 was found to be required for increased CD80 surface expression in both resident pulmonary macrophage populations, alveolar, and lung interstitial macrophages after LPS administration (Figures 5A and 5B). Importantly, coadministration of LPS and NO donor was sufficient to reconstitute increased CD80 on both populations in NOS1−/− lungs. The monocyte and neutrophil recruiting chemokines CCL2 and CXCL2 both required NOS1 and were both also reconstituted in NOS1−/− by NO donor (Figure 4A). These reduced chemokine levels resulted in functional changes as well, demonstrated by the reduced recruitment of inflammatory/“classical” monocytes (iMono) and neutrophils to NOS1−/− lungs after LPS challenge, while again, both cell types were recovered when NOS1 was stimulated with LPS and NO donor (Figures 5C–5F). In contrast, recruitment of patrolling/“non-classical” monocytes (pMono), that do not respond to CCL2 and are thought to be involved in inflammatory resolution, were not dependent on NOS1 (Figure 5D).23,24,25 NO donor administration was sufficient to convert the ratio of inflammatory to patrolling monocytes (iMono:pMono) in NOS1−/− lungs to that seen in WT (Figure 5E). Together, these results indicate that NO derived from NOS1 is required for the activation of lung macrophage populations and the recruitment of immune cells associated with inflammatory tissue injury.26
Figure 5.

NOS1-derived nitric oxide is required to promote lung resident macrophage activation and induce recruitment of inflammatory monocytes and neutrophils
(A) Flow cytometry analysis of surface expression of pro-inflammatory marker CD80 in lung resident alveolar macrophages (AM) in WT or NOS1−/− mice injected with LPS ± SNAP or vehicle for 4 h.
(B) Flow cytometry analysis of surface expression of pro-inflammatory marker CD80 in lung resident interstitial macrophages (IM) in WT or NOS1−/− mice injected with LPS ± SNAP or vehicle for 4 h.
(C) Quantification of inflammatory monocyte (iMono) recruitment to left lung of WT or NOS1−/− mice injected with LPS ± SNAP or vehicle for 4 h.
(D) Quantification of patrolling monocyte (pMono) recruitment to left lung of WT or NOS1−/− mice injected with LPS ± SNAP or vehicle for 4 h.
(E) Quantification of the ratio iMono:pMono recruited to left lung of WT or NOS1−/− mice injected with LPS ± SNAP or vehicle for 4 h.
(F) Quantification of neutrophil recruitment to left lung of WT or NOS1−/− mice injected with LPS ± SNAP or vehicle for 4 h.
(A–F) Data show mean ± SEM ∗p < 0.05, ∗∗p < 0.01, ∗∗∗∗p < 0.0001 (n = 4) as determined using Student's t-test. See also the gating strategy described in Figure S5.
SOCS1 promotes the emergence of a subpopulation of regulatory macrophages with anti-inflammatory activity
Results shown above indicate that NOS1 shapes the transcriptional landscape of activated macrophages, yielding cells with unique anti-inflammatory gene signatures and properties. To characterize these populations in vivo in molecular detail, we performed single-cell whole transcriptome analyses (scRNA-Seq) on CD45+ cells prepared from WT and NOS1−/− lungs with and without LPS stimulation. Uniform Manifold Approximation and Projection (UMAP) analysis of the resulting data were performed to characterize the existing cell populations and identify any novel cellular states from the scRNA-Seq data. Macrophage populations were highly similar in preparations from both genotypes before LPS treatment, indicating that NOS1 does not play a significant role in the development of these populations in vivo (Figure 6A). LPS stimulation, in contrast, revealed two well-defined clusters of alveolar macrophages, both of which emerge in WT and NOS1−/− lungs. We refer to these populations as inflammatory (inflammatory alveolar macrophages (iAM)) and regulatory (regulatory alveolar macrophages (rAM)) cells based on their distinctive gene expression profiles (Figures 6, S4, and S5, Table S4). Results demonstrate that the iAM population is far more abundant in WT lungs (Figure 6A, red dashed circle) and was characterized by upregulation of a variety of Pattern 1 genes, including cd80, il1b, and il1a (Figures 6B, 6C, and S6A and, Table S4). In contrast, the rAM population was nearly absent in WT lungs but quite abundant in LPS-stimulated NOS1−/− (Figure 6A, blue dashed circle). Compared with iAM, the rAM population showed upregulation of genes such as Mertk and Abcg1, associated with efferocytosis and lipid metabolism (Figures 6D–6G and S5B.27,28 In general the rAM transcriptome was found to be consistent with those of macrophages involved in inflammatory resolution and even pro-tumorigenic functions,29,30,31 suggesting that the absence of NOS1−/− function allows for the emergence of a unique macrophage subpopulation with strong anti-inflammatory activity.
Figure 6.

NOS1−/− mice generate a novel subpopulation of rAM in response to LPS challenge in vivo
(A) Single-cell RNA-Sequencing analysis of CD45+ lung cells isolated from control or LPS-challenged, WT or NOS1−/− mice.
(B) rAM transcriptomic profile is enriched in genes associated with regulatory macrophages, whereas iAM transcriptomic profile is enriched in pro-inflammatory genes.
(C–G) STRING Networks enriched in iAM vs. rAM: (C) Inflammatory response (GO:0006956), FDR = 4.49E-27. (D) Oxidative phosphorylation (mmu00199), FDR = 3.98E-17. (E) Cellular lipid metabolism (GO:0044255), FDR = 3.43E-7. (F) Phagocytosis and clearance (CL:13279), FDR = 3.62E-6. (G) Lipid transport (KW-0445), FDR = 4.78E-5. See also Figures S4 and S5 for details of alveolar macrophage and pro-inflammatory gene expression, respectively.
NOS1−/− macrophage anti-inflammatory polarization is dependent on SOCS1
The studies detailed above support a mechanism whereby SOCS1 acts as a brake to suppress macrophage phenotypes that can initiate inflammatory tissue injury. NOS1-derived NO is required to alleviate this SOCS1-mediated inhibition by removing it from Pattern 1 target genes, thereby enabling their full transcriptional activation by p65. To further validate this mechanism in vivo, we took advantage of the finding from our scRNA-Seq data that NOS1−/− lungs demonstrate protection from inflammatory injury despite having a large fraction of macrophages with the pro-inflammatory iAM phenotype (Figure 6A). We, therefore, reasoned that the addition of NOS1−/− macrophages via adoptive transfer could have a dominant effect on recipient, WT macrophages, resulting in suppression of inflammatory injury in the WT lungs. Intratracheal delivery of 100,000 NOS1−/− donor BMDM followed by intraperitoneal LPS treatment (schematized in Figures 7A and 7B) protected recipient lung tissue from tissue remodeling, inflammatory cytokine responses, and macrophage inflammatory surface phenotypes compared to the recipients of WT donor macrophages (Figures 7D–7F). We further exploited this approach to genetically confirm the requirement for SOCS1 in this in vivo protective phenotype. BMDM deficient in SOCS1 or doubly deficient in SOCS1 and NOS1 (NOS1−/−SOCS1−/−) were also tested. In vitro analysis of Il1b, a prototype Pattern 1 gene, confirmed that NFκB-dependent pro-inflammatory transcription was suppressed in NOS1−/− BMDM compared with WT, SOCS1−/−, or NOS1−/−SOCS1−/− BMDM (Figure 7C). Cellular complementation with SOCS1−/− or NOS1−/− SOCS1−/− BMDM failed to provide the protection afforded by NOS1−/− BMDM for histopathological changes, cytokine responses, or macrophage surface phenotype specification (Figures 7D–7F). In fact, transplantation of NOS1−/− SOCS1−/− double knockout BMDM slightly worsened inflammatory tissue remodeling similar to the effect observed in recipients of SOCS1−/− BMDM. Taken together, these results support a role for NOS1 signaling in the activation of injurious inflammation in vivo and demonstrate that NOS1 deficiency leads to suppression of inflammation that depends on the preservation of SOCS1 and the emergence of a subpopulation of macrophages that can exert anti-inflammatory activity on the surrounding tissue.
Figure 7.

Adoptive transfers of NOS1−/− macrophages protect WT lungs from LPS-induced inflammatory injury, in a SOCS1-dependent manner
(A) Scheme of bone marrow-derived macrophage (BMDM) mutants generation.
(B) BMDM mutants were transplanted into congenic WT mouse lungs via intratracheal instillation.
(C) LPS-induced expression of Il1b in BMDM in vitro as quantified by RT-qPCR. Data show median ±SEM ∗∗p < 0.01, ∗∗∗p < 0.001, ns = not significant, two-way ANOVA (n = 3).
(D) Histological H&E staining of right lungs of control or LPS-challenged, transplanted mice. White bar scale = 100 μm. Data show representative image of n = 4.
(E) Lung tissue cytokine quantification from control or LPS-challenged, transplanted mice. Data show median ±SEM ∗p < 0.05, ∗∗p < 0.01, ns = not significant, using Student's t-test (n = 4).
(F) Flow cytometry analysis of total AM isolated from or LPS-challenged, transplanted mice. Data show representative density (n = 4). See also Figure S6 for similar analysis of in vitro derived BMDM.
Discussion
Our previous studies described an important regulatory mechanism for pro-inflammatory NFκB-dependent transcription in macrophages. LPS administration leads to activation of NOS1 in the nucleus and the resulting nitric oxide S-nitrosates SOCS1. This post-translational modification prevents SOCS1 from direct association with and targeting of p65 for proteasomal degradation.14 The current work reveals that this NOS1-SOCS1-p65 signaling axis is not active for all NFκB-dependent transcription, but in fact provides functional selectivity for more specific inflammatory phenotypes. This was based on a number of lines of evidence. Detailed macrophage transcriptomic studies revealed that only a subset of genes require NOS1-derived NO for full activation, referred to here as Pattern 1 genes (Figure 2). These include prototypic pro-inflammatory cytokines and chemokines involved in the activation and amplification of inflammation. In contrast, NOS1-independent genes include genes associated with inflammatory resolution and tissue repair (Figure S1). Systemic administration of LPS led to a serum cytokine profile in which Pattern 1 gene products required either NOS1 or an exogenous chemical donor of NO (SNAP) for their full expression, whereas Pattern 2 genes were not reduced by loss of NOS1 (Figure 4A), recapitulating observations in isolated macrophages. This correlated with changes to inflammatory signaling in in vivo lung resident macrophage populations, demonstrated by NOS1-dependent surface expression of the pro-inflammatory macrophage-associated surface antigen CD80 (Figure 5). CD80 is an important costimulatory molecule for activating T cells, and we found that the cd80 gene is a Pattern 1 gene, as its expression is also regulated by NOS1-SOCS1 activity (Table S3, Figures 5 and 7). In addition to these changes in gene expression, this signaling system has important functional consequences for inflammation. Immune cell recruitment was suppressed, as demonstrated by reduced infiltration of inflammatory monocytes and neutrophils into NOS1−/− mouse lungs compared to WT (Figures 5C–5F). Lung tissue also demonstrated reduced histopathological remodeling in NOS1−/−, a protection that could be reversed by the addition of exogenous NO chemical donor (Figure 4B).
Given these significant changes to the outcome of inflammation, it was surprising that a relatively small subset of LPS-induced genes was impacted by NOS1 deficiency. Further, this highly selective impact of NOS1 deficiency was at odds with the freely diffusible nature of its catalytic product. Given the amphipathic nature and small solvation sphere of NO, rapid propagation throughout the nucleus to saturate all genomic sites would be expected. Thus, the loss of only a subset of NFκB-dependent transcripts suggested that the target of NO in this cascade, SOCS1, might provide the more selective role in transcriptional regulation. Chromatin immunoprecipitation studies determining the binding of p65 and SOCS1 confirmed this by showing that, in NOS1−/− macrophages compared to controls, SOCS1 was enriched on the cis-regulatory sites of Pattern 1 genes while p65 was depleted. This effect was clearly observed in global binding and more detailed ChIP-qPCR analyses of macrophages after LPS stimulation (Figures 2 and 3). This supports the concept that SOCS1 can accumulate on chromatin and directly oppose the activity of p65 at these sites. Intriguingly, SOCS1 was also found to be preloaded specifically onto Pattern 1 genes in the absence of any LPS stimulation, an effect that was not detectable above background for Pattern 2 gene loci (Figure 3). Mechanistically, both LPS-activated NOS1 and chemical donors of NO, in the absence of any additional inflammatory stimuli, were sufficient to deplete SOCS1 from these sites, supporting a direct functional linkage between SOCS1 and NOS1-derived NO at these specific genomic locations (Figure 3). In addition to SOCS1 changing the total nuclear concentration of p65 protein as previously reported, the current study revealed a second, distinct mechanism whereby SOCS1 confers functional specificity on macrophage inflammatory activation, favoring inflammation that produces greater tissue injury when NOS1 is active. A brake on the expression of the selective subset of Pattern 1, NFκB-dependent genes is imposed by their direct association with SOCS1 and subsequent suppression of p65 binding and transactivation. NOS1-derived NO alleviates this suppression by displacing SOCS1 from its preloaded positions on these gene loci and permits maximal transcription of acute phase, pro-inflammatory factors.
To confirm that these pathways are functional in in vivo macrophage populations, single-cell transcriptomic analysis of NOS1−/− lung immune cells was performed. These results led to the detection of a regulatory subset of pulmonary macrophages that was observed in the absence of NOS1, here referred to rAM, that appear to antagonize more classically activated iAM observed both in WT and NOS1−/− lungs in vivo (Figure 6). Intriguingly, these two transcriptionally distinct macrophage populations are detectable in both WT and NOS1−/− contexts, with a small number of rAM detectable in WT lungs, and a significantly larger population in the lungs of LPS-challenged NOS1−/− mice. Flow cytometric analyses of LPS-stimulated BMDM confirmed that NOS1 signaling regulates iAM-like and rAM-like surface phenotypes, suggesting that these cellular states may not be restricted to the lungs (Figure S6). We used this observation to test the anti-inflammatory potential of rAM-like macrophages using a cytotherapy approach. WT mouse lungs were protected from LPS-induced inflammatory damage when transplanted with congenic NOS1−/− macrophages (Figures 7D and 7E). This protective function, however, is found to be completely dependent on functional SOCS1, since SOCS1 deletion in NOS1−/− macrophages recapitulated the iAM-like phenotype of WT macrophages (Figure 7).
Taken together, our results indicate that the NOS1-SOCS1 signaling axis regulates lung tissue remodeling during systemic inflammation, and that phenotypically and functionally distinct pulmonary macrophages underlie this change. We demonstrate that SOCS1 is preloaded on the regulatory sites of a select subset of pro-inflammatory genes, where it can rapidly target the transcription factor p65-NFκB for degradation and thereby suppress transactivation in a gene-specific manner. In the absence of NOS1, SOCS1 is preserved and yields a phenotypically distinct subset of macrophages with the potential to overcome the signals emanating from nearby, resulting in more anti-inflammatory macrophages. In contrast, NOS1-derived NO is both required and sufficient to dislodge SOCS1 from the chromatin and permit full p65-NFκB-dependent transcription, resulting in the pro-inflammatory phenotype. In this regard our results provide the first example of a redox-sensitive, nucleus- and gene-specific mechanism for converting macrophages from cells that maintain homeostasis to cells that are licensed to promote more aggressive and potentially injurious inflammation.
Limitations of the study
The profiling using high-throughput sequencing approaches to analyze BMDM in our study failed to detect the NOS1-dependence of the ifnb1 gene, while extensive quantitative PCR analyses confirmed that this gene was, in fact, NOS1-dependent for both p65 binding and transcription, and these individual gene analyses verified all genes found to be NOS1-dependent. The discrepancy may be due to the inherent heterogeneity of BMDM as a primary macrophage culture, slightly reduced sensitivity, or a combination. Thus, we cannot rule out that sequencing results may have missed other NOS1-dependent genes, which may provide additional insights into this important inflammatory signaling pathway, and something that would best be studied in in vivo macrophage populations.
STAR★Methods
Key resources table
| REAGENT or RESOURCE | SOURCE | IDENTIFIER |
|---|---|---|
| Antibodies | ||
| Chicken anti-Rabbit (Alexa488) | Invitrogen | A21441, Research Resource Identification (RRID): AB_2535859 |
| Goat anti-Mouse (Alexa647) | Invitrogen | A21236, RRID: AB_2535805 |
| Normal Rabbit IgG | Cell Signaling | 2729, RRID: AB_1031062 |
| Rabbit anti-p50 | Cell Signaling | 13586, RRID: AB_2665516 |
| Rabbit anti-p65 | Cell Signaling | 8242, RRID: AB_10859369 |
| Rabbit anti-SOCS1 | Cell Signaling | 3950, RRID: AB_2192983 |
| Hamster anti-CD11c N418 (BV711) | BioLegend | 117349, RRID: AB_2563905 |
| Hamster anti-CD80 16-10A1 (BUV496) 16-10A1 | BD Biosciences | 741091, RRID: AB_2870690 |
| Mouse anti-CD45.2 104 Fluorescein isothiocyante (FITC) | BioLegend | 109806, RRID: AB_313443 |
| Mouse anti-CD64 X54-5/7.1 (APC) | BioLegend | 139305, RRID: AB_11219205 |
| Rat anti-CD11b M1/70 (BUV395) | BD Biosciences | 563553, RRID: AB_2738276 |
| Rat anti-CD192 475301 (BV480) | BD Biosciences | 747971, RRID: AB_2872432 |
| Rat anti-CD206 MR5D3 (PE) | Thermo Fisher Scientific | MA5-16872, RRID: AB_2538350 |
| Rat anti-CD24 M1/69 (BUV737) | BD Biosciences | 565308, RRID: AB_2739174 |
| Rat anti-Ly6C AL-21 (BV605) | BD Biosciences | 563011, RRID: AB_2737949 |
| Rat anti-Ly6G 1A8 (BUV563) | BD Biosciences | 612921, RRID: AB_2870206 |
| Rat anti-MHC-II M5/114.15.2 (PECy7) | BioLegend | 107630, RRID: AB_2069376 |
| Rat anti-Siglec-F E50-2440 (BV786) | BD Biosciences | 740956, RRID: AB_2740581 |
| Chemicals, peptides, and recombinant proteins | ||
| 10X Tris/Borate/EDTA (TBE) Electrophoresis Buffer | Thermo Scientific | B52 |
| 16% methanol-free formaldehyde solution | Thermo Scientific | 28908 |
| 4-20% acrylamide TBE gel | Invitrogen | EC6225BOX |
| 4-Hydroxy-Tamoxifen | Calbiochem | 68047063 |
| BSA | Sigma | A9648 |
| DEA non-oate | Cayman Chemical | 82100 |
| DNase I | Sigma | 1010459001 |
| EasySep Buffer | StemCell | 20144 |
| Ethanol | SigmaAldrich | E7023 |
| Fetal Bovine Serum (FBS) | Hyclone | SH3039603 |
| Formaldehyde solution | Sigma | F8775 |
| L-Glutamine | Gibco | 25030081 |
| Liberase TB | Sigma | 5401127001 |
| LIVE/DEAD Fixable Aqua Cell Stain | Thermo Scientific | L34965 |
| Lipopolysaccharide (LPS) | Sigma | L2880 |
| Murine Macrophage Colony Stimulating Factor (MCSF) | Preprotech | 31502 |
| Penicilin-Streptomycin | Gibco | 15140122 |
| Red Blood Cell (RBC) Lysis Buffer | Invitrogen | 00430054 |
| RPMI 1640 | Gibco | 22400089 |
| SNAP | SigmaAldrich | N3398 |
| Critical commercial assays | ||
| Bicinchoninic Acid (BCA) Protein Assay Kit | Pierce | 23225 |
| CUTANA ChIC/CUT&RUN | EpiCypher | 141048 |
| EasySep Mouse CD45+ Selection kit | StemCell | 18945 |
| Fast SYBR Green | Applied Biosystems | 4385612 |
| High Capacity cDNA Reverse Transcription Kit | Applied Biosystems | 4368813 |
| Magna ChIP A/G kit | Millipore | 1710085 |
| Nuclear Extraction Kit | Abcam | ab11347 |
| Odyssey Infrared EMSA kit | LiCOR | 82907910 |
| Rnase-free DNase set | QIAGEN | 1023460 |
| RNeasy Mini Kit | QIAGEn | 74106 |
| SST Microtainer tubes | BD | 333823 |
| Deposited data | ||
| Sequencing Data blanket GEO accession number | GEO:GSE225835 | https://ncbi.nlm.nih.gov |
| Experimental models: Organisms/strains | ||
| Mouse: C57BL/6 (Wild-Type) | Jackson Laboratories | 000664, RRID:IMSR_JAX:000664 |
| Mouse: B6.SJL-Ptprca Pepcb/BoyJ | Jackson Laboratories | 002014, RRID: IMSR_JAX:002014 |
| Mouse: B6.129S4-Nos1tmPlh/J (NOS1−/−) | Jackson Laboratories | 002986, RRID: IMSR_JAX:002986 |
| Mouse: B6.129P2(FVB)-Lyz2tm1(cre/ERT2)Grtn/J | Jackson Laboratories | 032291, RRID: IMSR_JAX:032291 |
| Mouse: SOCS1FL/FL | Tanaka, et al.32 | SOCS1flox/flox |
| Oligonucleotides | ||
| For full primer sequences for qPCR analysis of mRNA and ChIP, see Table S5. | This Paper | N/A |
| Software and algorithms | ||
| Cytoscape 3 | Cytoscape Consortium | https://cytoscape.org/ |
| EdgeR | Robinson et al.33; McCarthy et al.34 | https://bioconductor.org/packages/release/bioc/html/edgeR.html |
| FCS Express 7 | De Novo Software | https://denovosoftware.com/ |
| GraphPad Prism 8 | GraphPad Software | https://www.graphpad.com/ |
| GREAT v.4.0.4 | McLean et al.35 | http://great.stanford.edu/public/html/ |
| Image Studio 5.2 | LiCOR | https://www.licor.com/bio/image-studio-lite/download |
| Integrative Genomic Viewer | Broad Institute | https://software.broadinstitute.org/software/igv/ |
| Plotly | Dash Enterprise | https://plotly.com/ |
| Seurat v4.1.0 | Hao et al.36 | https://satijalab.org/seurat/ |
| seqMINER v.1.3.4 | Ye et al.37 | http://bips.u-strasbg.fr/seqminer |
| SingleR v.1.6.1 | Bioconductor | https://bioconductor.org/packages/release/bioc/html/SingleR.html |
| Galaxy v.22.05 | Jalili et al.38 Afgan et al.39 | https://usegalaxy.org/ |
| Bowtie2 v.2.4.2 | Langmead et al.40 | https://usegalaxy.org/ |
| MACS2 callpeak v.2.1.1.20160309.6 | Feng et al.41 | https://usegalaxy.org/ |
| DiffBind v.2.10.0 | Ross-Innes et al.42 | https://usegalaxy.org/ |
| ChIPseeker v.1.18.0 | Yu et al.17 | https://usegalaxy.org/ |
| UCSC Genome Browser | Kent et al.43 | https://genome.ucsc.edu/ |
| Jupyter-Lab v.3.4.7 | Grüning et al.44 | https://anaconda.org/ |
| SciPy v.1.5.2 | Virtanen et al.45 | https://anaconda.org/ |
| Matplotlib v.3.3.2 | Hunter et al.46 | https://anaconda.org/ |
| Seaborn v.0.11.0 | Waskom et al.47 | https://anaconda.org/ |
| Pandas v.1.1.3 | McKinney et al.48 | https://anaconda.org/ |
| ShinyGO v.0.76.1 | Ge et al.49 | http://bioinformatics.sdstate.edu/go/ |
| bamCoverage v.3.5.1.0.0 | Ramírez et al.50 | https://usegalaxy.org/ |
| computeMatrix v.3.5.1.0.0 | Ramírez et al.50 | https://usegalaxy.org/ |
| plotHeatmap v.3.5.1.0.1 | Ramírez et al.50 | https://usegalaxy.org/ |
| Cell Ranger (v6.1.0) | 10X Genomics | https://support.10xgenomics.com/single-cell-gene-expression/software/overview/welcome |
| Seurat package (V4.1.0) within R (v4.1.3) | Hao et al.36 | https://github.com/satijalab/seurat/releases |
| BioRender for Figure Art | BioRender | https://biorender.com/ |
Resource availability
Lead contact
Further information and requests for resources and reagents should be directed to and will be fulfilled by Benjamin N. Gantner, Ph.D. (bgantner@mcw.edu).
Materials availability
SOCS1FL/FL mice were kindly provided by Dr. Akihiko Yoshimua and are restricted in availability due to a materials transfer agreement. All other resources used in the study are freely available or can be obtained from commercial sources. Detailed information on where to locate each is provided below.
Experimental model and subject details
The current study used both mice as an in vivo experimental model and primary cell cultures derived from mice.
Mice
All animals were maintained in pathogen-free conditions and all procedures were performed according to guidelines and study protocols approved by the Institutional Animal Care and Use Committee at Northwestern University. Wild-type C57BL/6 (JAX # 000664), NOS1−/− (JAX # 009286), SOCS1FL/FL (kindly provided by Dr Akihiko Yoshimua, Keio University, Tokyo, Japan), and LysMCre-ERT2 (JAX #032291) mice were bred in our facility and our colonies were refreshed yearly with mice purchased from Jackson Laboratory. To generate homozygous SOCS1FL/FL/LysMCre-ERT2 strain, SOCS1FL/FL was crossed with LysMCre-ERT2 for two generations. Then, to obtain double knockout, NOS1−/− were crossed with SOCS1FL/FL/LysMCre-ERT2 for several generations. Mice were housed at the Center for Comparative Medicine at Northwestern University, microisolator cages, with standard 12 h light/dark cycle, ambient temperature of 23°C and were provided standard rodent diet (Envigo/Teklad LM-485) and water ad libitum. When indicated, young mice (6-14 weeks) were injected intraperitoneally with 10 mg/kg lipopolysaccharide (LPS from E. coli O55:B5, Sigma, #L2880), 2 mg/kg S-Nitroso-N-acetyl-DL-penicillamine (SNAP, SigmaAldrich, #N3398), or vehicle (PBS) and humanely euthanized 4 h after injections. For animal experiments, sex was tracked as a biological variable, but no differences that merited further investigation were observed.
Bone marrow-derived macrophage culture
BMDM isolated from WT C57BL/6, NOS1−/−, SOCS1FL/FL/LysMCre-ERT2, or NOS1−/−/SOCS1FL/FL/LysMCre-ERT2 mice were prepared by in vitro differentiation for 5 days in complete Roswell Park Memorial Institute (RPMI) 1640 Medium (Gibco, # 22400089) supplemented with 10% (v/v) fetal bovine serum, 20 ng/mL recombinant murine MCSF (Preprotech, # 315-02), 100 U/mL Penicilin-Streptomycin and 2 mM L-Glutamine, at 37°C and 5% CO2 atmosphere. To induce SOCS1 deletion, BMDM isolated from SOCS1FL/FL/LysMCre-ERT2, or NOS1−/−/SOCS1FL/FL/LysMCre-ERT2 were treated with 1 μM 4-Hydroxy-Tamoxifen (4OH-Tx, Calbiochem #68047063) during the 5 days of differentiation. Cells were treated at different time points with 100 ng/mL LPS.
Method details
Study design
Following the discovery that NO regulates the interaction between NF-κB p65 subunit and its repressor SOCS1, the current study was designed to determine the impact of NO-dependent SOCS1 inhibition on pro-inflammatory gene transcription, macrophage polarization, inflammation onset, trajectory, and resolution. We compared the responses of BMDM as well as alveolar macrophages harvested from NOS1−/− and WT mice to LPS, a powerful pro-inflammatory stimulus. Double NOS1−/−/SOCS1−/− knockout mice were generated to ascertain the requirement for preserved SOCS1 activity in the emergence of anti-inflammatory macrophage phenotypes within the NOS1−/− genotype. NOS1−/−/SOCS1−/− recapitulated the transcriptional, phenotypic and functional phenotype of SOCS1−/−, lacked the protective anti-inflammatory activity of NOS1−/− and displayed a slight more pro-inflammatory activity than WT. Mechanistically, ChIC-Seq studies indicated that there is an inverse occupancy of SOCS1 and p65 on regulatory regions of pro-inflammatory genes shown to be sensitive to NO and that this inverse occupancy regulated by NO controls transcriptional outputs of pro-inflammatory NFκB-target genes relevant for macrophage polarization and function.
RNA isolation and Real time quantitative PCR
Total RNA was isolated from approximately 1x10⁶ cells by using RNeasy Mini Kit (QIAGEN, # 74106) with additional DNase treatment using RNase-free DNase Set (QIAGEN, # 1023460). cDNA was synthetized using High Capacity cDNA Reverse Transcription Kit (Applied Biosystems, # 4368813) according to manufacturer’s specifications. qPCR was performed using Fast SYBR Green (Applied Biosystems, # 4385612) on a Quant Studio 6 Flex PCR system (Applied Biosystems). Gene expression in each sample was normalized to mRNA for glyceraldehyde-3-phosphate dehydrogenase (GAPDH) and fold-changes relative to basal expression were calculated with the 2−ΔΔCt method. Each experiment was performed in three independent repeats from at least three biological replicates. Error bars represent standard error of biological replicates. Statistical analysis was performed by multiple t-tests corrected for multiple comparisons using Holm-Sidak method and confidence interval level of 95%. Forward and reverse primers used are listed in Table S5.
RNA-seq
RNA was isolated as described above from each sample treated with LPS for 2 h, 8 h, or control. Sequencing libraries were generated using Illumina Novaseq platform. Sample quality, library complexity, and alignment statistics were checked using an established pipeline at the Genomic Sciences and Precision Medicine Center at Medical College of Wisconsin (Milwaukee, WI).
Chromatin immunoprecipitation qPCR (ChIP-PCR) and chromatin immunocleavage (ChIC-Seq)
Approximately 1x10⁷ BMDM were treated with 100 ng/mL LPS or 10 μM DEA NON-Oate (Cayman Chemical, # 82100) for appropriate durations as specified in Figures and Figure Legends. Cells were fixed with 1% methanol-free formaldehyde solution (Thermo Scientific, # 28908) for 10 min at room temperature (RT). Then, reaction was quenched with addition of 125 mM glycine for 5 min. Chromatin isolation and immunoprecipitation were carried out using Magna ChIP A/G kit (Millipore, # 1710085). Chromatin was isolated from nuclei and sonicated in Diagenode Bioruptor Pico for 10 cycles of 30 s with intervals of 30 s at 4°C to generate DNA fragments with size range of 200–600 bp. Sheared chromatin equivalent to 2x10⁶ cells was diluted 1:10 in ChIP Dilution Buffer and protease inhibitor cocktail and incubated for 16 h with 20 μL Magnetic Protein A/G Beads (Millipore, # CS204457) and 5 μL antibodies. The antibodies used were anti-p65 (Cell Signaling, # 8242), anti-SOCS1 (Cell Signaling, # 3950), or Normal Rabbit IgG (Cell Signaling, # 2729). Immunoprecipitated DNA fragments were eluted and purified according to manufacturer’s instructions. ChIP products were analyzed by qPCR using Fast SYBR Green (Applied Biosystems, # 4385612) on a Quant Studio 6 Flex PCR system (Applied Biosystems). Each ChIP sample was normalized by its respective 1% input’s adjusted Cycle Threshold (Ct) (ΔCt), where
Enrichment was expressed in fold change relative to non-treated cell (2−ΔΔCt), where
where ΔCti is normalized ChIP at each time point specified in Figures and Figure Legends, and ΔCt0 is normalized ChIP of non-treated cells. To express ChIP enrichment in percentage of input, the formula used was
Each experiment was performed in three independent repeats from at least five biological replicates. Error bars represent standard error of biological replicates. Statistical analysis was performed by two-way ANOVA corrected for multiple comparisons using Sidak method and confidence interval level of 95%. Forward and reverse primers used are listed in Table S5.
For preparation of cells for ChIC-seq, approximately 1x10⁷ BMDM were treated with 100 ng/mL LPS for 30 min or control. Cells were briefly fixed with 1% methanol-free formaldehyde solution (Thermo Scientific, # 28908) for 1 min at RT. Then, reaction was quenched with addition of 125 mM glycine for 3 min. Cells were harvested in ice-cold PBS (pH 7.4) and centrifuged at 300 x g for 5 min at 4°C. Chromatin isolation and immunoprecipitation were carried out using CUTANA ChIC/CUT&RUN kit (EpiCypher #141048). One hundred thousand cells were resuspended in Wash Buffer (Pre-Wash Buffer supplemented with 1X protease inhibitor cocktail, 460 mM Spermidine, 1% Triton X-100, 0.045% SDS), and incubated with activated ConA beads for 10 min at RT. Then, cells were permeabilized with 0.01% Digitonin in Wash Buffer, and incubated with 0.5 μg target antibody at 4°C overnight with agitation. The antibodies used were anti-p65 (Cell Signaling, # 8242), anti-SOCS1 (Cell Signaling, # 3950), or Normal Rabbit IgG (Cell Signaling, # 2729). Cells were washed twice with cold Wash Buffer supplemented with Digitonin, and chromatin regions around target-DNA complex were digested with pAG-MNase for 10 min at RT, followed by addition of 2 mM CaCl2, and incubation with agitation for 2 h at 4°C. Digestion was stopped with addition of Stop Buffer, and E. coli Spike-in DNA was added to each sample for normalization. Target-DNA complex fragments were released by heat shock at 37°C for 10 min, followed by magnetic separation of cells. Cross linking was reversed by digestion of proteins in the supernatant with 20 μg Proteinase K at 55°C overnight. Chromatin fragments were purified by standard protocol using DNA Cleanup Columns provided in the kit. Sample quality, library complexity, and alignment statistics were checked using an established pipeline at the NUSeq Core Facility at Northwestern University (Chicago, IL).
RNA and ChIC-Seq data analysis and gene selection criteria
RNA-Seq analyses were performed with three biological replicates, ChIC-Seq were performed for p65 and SOCS1 with two sequencing replicates produced from six biological replicates that were pooled together for library preparation. The RNA sequencing reads were aligned against the reference mouse genome mm10 and ensemble GRCm38.79 using MaPRseq3 (STAR). The quality of ChICSeq reads, in FASTQ format, was evaluated using FastQC. Reads were trimmed to remove Illumina adapters from the 3′ ends using cutadapt51 and further analyzed using the Galaxy platform38 at usegalaxy.org.39 Trimmed reads were aligned to the mouse genome (mm10) using Bowtie2 (v.2.4.2) with default parameters while only reads that mapped uniquely to the genome were used in subsequent analysis,40 peak calling was performed using MACS2 callpeak (v.2.1.1.20160309.6) with an FDR <0.05 for individual samples against IgG controls.41 Comparative p65 binding was analyzed with DiffBind (v.2.10.0) on duplicate samples against matched IgG controls with FDR <0.2.42 Data was annotated using ChIPseeker (v.1.18.0)17 and the mm10 NCBI RefSeq collection from the UCSC Genome Browser.43 Combined analysis of transcript and binding data was implemented using Jupyter-Lab44 running the python modules SciPy,45 Pandas,48 matplotlib46 and Seaborn.47 Using these analyses, detected genes were then divided into subsets based on their gene-specific requirements for LPS or NOS1 in the promotion of p65 binding or transcription: Pattern 1 (LPS-dependent and NOS1-dependent for p65 binding and transcription), Pattern 2 (LPS-dependent and NOS1-independent for p65 binding and transcription), or Control (LPS-independent for p65 binding) gene sets. To accomplish this, filtering of gene-specific data was performed using thresholds based on either standard statistical tests or based on the data from candidate genes whose NOS1-dependent (il1b and il6) or independent (nlrp3) transcription was previously confirmed using quantitative PCR. The thresholds were as follows: Control genes for p65 background noise were defined as having no induction of p65 binding with LPS at 30 min or 8 h by requiring DiffBind signals <4.5 in control and <5 after LPS, as well as <2-fold LPS-inducible, and >0.05 FDR for either LPS time point. For both Pattern 1 and Pattern 2 genes, LPS inducibility was required for mRNA as >1.5-fold in LPS-treated at either time point over control with an FDR-adjusted p value <0.05, and LPS-dependent p65 binding required >1.3-fold in LPS-treated at 0.5 or 8 h over control with an FDR <0.05. NOS1-dependence was defined as genes with mRNA <0.9-fold with FDR <0.3 for NOS1−/− compared to WT after 8 h of LPS as well as p65 binding after 8 h LPS with >1.04-fold increase in WT compared to NOS1−/− and FDR <0.08, while genes that demonstrated <1.04-fold binding in WT after 30 min LPS treatment were depleted from this gene set to reduce noise in downstream analyses. NOS1-independent genes defined as genes that failed to meet both of these thresholds for NOS1-dependence. Gene ontology analysis was performed on gene sets using ShinyGO v.0.76.1 at (http://bioinformatics.sdstate.edu/go/)49 for Pattern 1 genes, Pattern 2 genes, and genes that required LPS for mRNA and p65 binding using the same cutoffs as described above for both Pattern 1 and Pattern 2 genes. GO annotations were associated with each of the three gene sets only if they were found to have FDR<0.05, and FDR>0.05 in the other two gene sets. DiffBind output for p65 binding normalized to IgG and comparing 30 min or 8 h of LPS treatment in WT cells directly against NOS1−/− were visualized as heatmaps using the signal detected by DiffBind. SOCS1 binding was quantitatively analyzed for gene sets by collecting the IgG-corrected MACS1 signal value for all peaks in the promoter regions of all genes in each set. The maximum value for each gene was collected and visualized with violin plots using kernel density estimation with a bandwidth of 0.2. These gene set binding values were compared using Mann Whitney U non-parametric significance testing between gene sets for each treatment condition. Visualization of gene set binding coverage of p65 and SOCS1 was generated with bamCoverage (v.3.5.1.0.0) using default conditions for the mm10 genome.50 These were assembled with computeMatrix (v.3.5.1.0.0) using TSS as reference points flanked with 6 kb.50 Each gene set was ordered and presented using the k means clustering and visualization features of plotHeatmap and plotProfile on v.3.5.1.0.1.50
Single-cell RNA-Sequencing
WT or NOS1−/− mice were challenged with intraperitoneal dose of 10 mg/kg LPS or vehicle control for 4 h. CD45+ cells were isolated from lungs using EasySep Mouse CD45 Positive Selection Kit (Stem Cell #18945). Briefly, whole lungs were minced and digested with 500 μg/mL Liberase TB (Sigma, # 5401127001), 150 μg/mL DNase I (Sigma #1010459001), and 5 mM MgCl2 in PBS (pH 7.4) for 20 min at 37°C. Then, single-cell suspension was filtered through 70 μm nylon mesh cell strainer and treated with RBC Lysis Buffer (Invitrogen, # 00430054) according to manufacturer’s instructions. Ten million lung cells in suspension were mixed with 5 μL Component A, 5 μL Component B, and 5 μL magnetic RapidSpheres provided in the EasySep kit, and incubated for 5 min in ice. CD45+ cells trapped in magnetic beads were isolated using a magnetic platform, and released diluted in EasySep Buffer (StemCell #20144). 10X Single-cell RNA-Seq library preparation and testing for sample quality, library complexity, and alignment statistics were performed using the established pipeline at the NUSeq Core Facility at Northwestern University (Chicago, IL).
Single-cell RNA-Seq data analysis
Demultiplexed raw reads were mapped to the mouse genome (Mm10) using Cell Ranger (v6.1.0) with default settings. Unfiltered count matrices for each library were loaded into R for processing by the Seurat package (V4.1.0, Hao and How et al. 2021) within R (v4.1.3).36 Several filters were applied using Seurat. First, cells were removed if they didn’t have a minimum of 300 features. Then we applied filters to remove cells that had more than 20% mitochondrial genes, or had fewer than 700 features, or had either fewer than 1000 UMIs, or had more than 100,000 UMIs. Applying these filters reduced the number of combined cells from 64,330 to 58,011. Cell cycle stage was estimated using Seurat. All samples were combined into a single Seurat object and then log normalized. Cell cycle stage, percentage of mitochondrial genes, and number of features were regressed out during normalization. Dimensionality reduction for clustering was done via PCA combined with Jackstraw in the Seurat package. Clustering was performed using the first 50 PCs with a range of resolutions (0.25–4, stepping every 0.5) and then used as input to t-SNE for imaging. The t-SNE plots were consulted to select a clustering resolution of 0.75. The Seurat function FindAllMarkers() was used to identify marker genes that differentiate any given cluster from the rest of the cells. Another Seurat function, FindMarkers(), was used to compare individual clusters to each other and to find genes that differentiate the two clusters. SingleR (v1.6.1) was used to identify resident macrophage cells in the dataset.52 We based the cell-type classification on the ImmGen database, which has normalized expression values for immune cells from 830 murine microarrays. Macrophage populations were confirmed with UMAP plotting of canonical marker genes. String network was generated using the list of differentially expressed genes in macrophage subclusters (iAM vs rAM), uploaded to Cytoscape 3 against reference species (Mus musculus) with confidence cutoff of 0.4 and zero additional interactions. Gene networks were clustered using the Markov Cluster Algorithm with granularity of 4. String functional enrichment was retrieved for network using the whole genome as background.
Serum cytokine quantification
Mice were humanely euthanized, and blood was collected by cardiac puncture using a 1 mL TB syringe attached to a 25-gauge needle. Serum was isolated using SST Microtainer tubes (BD, # 0333823) and cytokines were quantified using BioPlex 200 Mouse Cytokine Array by Eve Technologies Corporation (Calgary, Canada).
Lung homogenate cytokine quantification
One lobe of right lung was snap-frozen and stored in −80°C until the day of processing. Lung aliquot was lyzed in RIPA Buffer (Pierce #89900) with proteinase inhibitor cocktail (Roche #11873580001), using a glass potter. Tissue homogenate was cleared by centrifugation at 20,000 x g for 20 min at 4°C. Total protein in the supernatants was quantified by BCA Protein Assay Kit (Pierce #23225), and specific cytokines were quantified using BioPlex 200 Mouse Cytokine Array by Eve Technologies Corporation (Calgary, Canada).
Flow cytometry
Approximately 2x10⁶ BMDM were treated with 100 ng/mL LPS for appropriate durations as specified in Figures and Figure Legends. Then, cells were harvested with cell scraper in ice, incubated with blocking solution (anti-FcγR antibodies from 24G2 hybridoma supernatant) for 30 min in ice, stained with antibody mix (anti-CD80 and anti-MHC-II) and LIVE/DEAD Fixable Aqua Cell Stain (ThermoFischer, #L34965) for 30 min in flow cytometry buffer [PBS (pH 7.4), 0.5 mM EDTA, 0.5% (w/v) BSA], and fixed with 4% formaldehyde solution for 15 min at RT.
Lung tissue processing and flow cytometry analysis were performed according to protocol adapted from Yu and collaborators.19 Briefly, left lungs were minced in 1 mL PBS (ph 7.4) and digested with 50 μg/mL Liberase TB (Sigma, # 5401127001) for 30 min at 37°C. Samples were filtered through 70 μm cell strainer and treated with RBC Lysis Buffer (Invitrogen, # 00430054) according to manufacturer’s instructions. Two million cells were incubated with blocking solution for 30 min in ice, stained with antibody mix (anti-CD11b, anti-CD11c, anti-CD24, anti-CD45, anti-CD64, anti-CD80, anti-CD192, anti-CD206, anti-Ly6C, anti-Ly6G, anti-MHC-II, anti-Siglec-F, anti-F4/80, and anti-MerTK) and LIVE/DEAD Fixable Aqua Cell Stain for 30 min in flow cytometry buffer and fixed with 4% formaldehyde solution for 15 min at RT. Flow cytometry data was collected in FACSymphony (BD Biosciences) and analyzed by FCS Express 7. Macrophages, monocytes and neutrophils were identified using gating strategy described by Yu et al. 2016 and demonstrated in Figure S3.
Histology
One lobe of right lung were fixed in 4% formalin solution and processed by Mouse Histology and Phenotyping Laboratory at Northwestern. Formalin-fixed paraffin-embedded tissue was sectioned in 5 μm slices, stained with hematoxylin and eosin and imaged by Nikon Ti2 Widefield microscope using 10X, 20X, or 40× magnification.
Adoptive transfer
BMDM isolated from SOCS1FL/FL/LysMCre-ERT2 or NOS1−/−/SOCS1FL/FL/LysMCre-ERT2 mice was differentiated in presence or absence of 1 μM 4OH-Tx for 4 days to generate SOCS1+/+/NOS1+/+ (WT), SOCS1−/−/NOS1+/+ (SOCS1−/−), SOCS1+/+/NOS1−/− (NOS1−/−), or SOCS1−/−/NOS1−/− (SOCS1−/−/NOS1−/−) macrophages. One hundred thousand cells were transplanted via intratracheal instillation into 8 weeks-old congenic wild-type mice lungs (JAX #002014). Transplanted mice were allowed to rest for 24 h before challenge with intraperitoneal injection of 10 mg/kg LPS for 4 h. Serum and lung samples were processed and analyzed as previously described, as indicated in Figure 7 legends.
Quantification and statistical analysis
Statistical analyses were carried out as described in the relevant STAR Methods sections above. Where applicable, statistical significance are reported in the Figures and corresponding Figure Legends.
Acknowledgments
The authors acknowledge funding from the U.S. Heart Lung and Blood Institute (NHLBI to M.G.B. and B.N.G.), R01HL163820; U.S. National Institute of Allergy and Infectious Diseases (NIAID to M.G.B.), RO1AI131267; U.S. National Cancer Institute (NCI to M.G.B.), R01CA216882 and U.S. National Institute of Environmental Health Sciences (NIEHS to M.G.B.), R01ES028149. The authors also acknowledge funding from the Advancing a Healthier Wisconsin (to B.N.G. and M.G.B.) and funding from U.S. Department of Defense, Army Research Office grant # 72983 to M.G.B. and B.N.G. The authors thank Drs. Alexander Misharin and Scott Budinger (Northwestern University of Chicago) for helpful discussions.
Author contributions
D.R.C., M.G.B., and B.N.G conceived of and designed the experiments, analyzed the data, and wrote the manuscript with input from all authors. D.R.C. carried out experiments with assistance from F.R.P., V.P., and K.M.L.. Y.H. maintained and prepared reagents. B.W., S.R., D.W., F.Y., and B.N.G performed bioinformatic analyses. M.G.B and B.N.G supervised the work.
Declaration of interests
The authors declare no competing interests.
Inclusion and diversity
One or more of the authors of this paper self-identifies as an underrepresented ethnic minority in their field of research or within their geographical location. One or more of the authors of this paper self-identifies as a gender minority in their field of research. One or more of the authors of this paper self-identifies as a member of the LGBTQIA+ community.
Published: March 17, 2023
Footnotes
Supplemental information can be found online at https://doi.org/10.1016/j.isci.2023.106442.
Contributor Information
Marcelo G. Bonini, Email: marcelo.bonini@northwestern.edu.
Benjamin N. Gantner, Email: bgantner@mcw.edu.
Supplemental information
Data and code availability
-
•
Single-cell RNAseq, chic-seq, and RNAseq data have been deposited at GEO and are publicly available as a series under the blanket GEO accession number GEO:GSE225835, accessible at ncbi.nlm.nih.gov, also listed below in the key resources table.
-
•
No original code was produced for this manuscript. All software used are available through public or commercial sources described in the key resources table.
-
•
Any additional information required to reanalyze the data reported in this paper is available from the lead contact upon request.
References
- 1.Underhill D.M., Gordon S., Imhof B.A., Núñez G., Bousso P. Elie Metchnikoff (1845-1916): celebrating 100 years of cellular immunology and beyond. Nat. Rev. Immunol. 2016;16:651–656. doi: 10.1038/nri.2016.89. [DOI] [PubMed] [Google Scholar]
- 2.Yona S., Gordon S. From the reticuloendothelial to mononuclear phagocyte system - the unaccounted years. Front. Immunol. 2015;6:328. doi: 10.3389/fimmu.2015.00328. [DOI] [PMC free article] [PubMed] [Google Scholar]
- 3.Gessain G., Blériot C., Ginhoux F. Non-genetic heterogeneity of macrophages in diseases-A medical perspective. Front. Cell Dev. Biol. 2020;8 doi: 10.3389/fcell.2020.613116. [DOI] [PMC free article] [PubMed] [Google Scholar]
- 4.Guilliams M., Svedberg F.R. Does tissue imprinting restrict macrophage plasticity? Nat. Immunol. 2021;22:118–127. doi: 10.1038/s41590-020-00849-2. [DOI] [PubMed] [Google Scholar]
- 5.Mann M., Mehta A., Zhao J.L., Lee K., Marinov G.K., Garcia-Flores Y., Lu L.F., Rudensky A.Y., Baltimore D. An NF-kappaB-microRNA regulatory network tunes macrophage inflammatory responses. Nat. Commun. 2017;8:851. doi: 10.1038/s41467-017-00972-z. [DOI] [PMC free article] [PubMed] [Google Scholar]
- 6.Watanabe S., Alexander M., Misharin A.V., Budinger G.R.S. The role of macrophages in the resolution of inflammation. J. Clin. Invest. 2019;129:2619–2628. doi: 10.1172/JCI124615. [DOI] [PMC free article] [PubMed] [Google Scholar]
- 7.Porta C., Rimoldi M., Raes G., Brys L., Ghezzi P., Di Liberto D., Dieli F., Ghisletti S., Natoli G., De Baetselier P., et al. Tolerance and M2 (alternative) macrophage polarization are related processes orchestrated by p50 nuclear factor kappaB. Proc. Natl. Acad. Sci. USA. 2009;106:14978–14983. doi: 10.1073/pnas.0809784106. [DOI] [PMC free article] [PubMed] [Google Scholar]
- 8.Murray P.J., Allen J.E., Biswas S.K., Fisher E.A., Gilroy D.W., Goerdt S., Gordon S., Hamilton J.A., Ivashkiv L.B., Lawrence T., et al. Macrophage activation and polarization: nomenclature and experimental guidelines. Immunity. 2014;41:14–20. doi: 10.1016/j.immuni.2014.06.008. [DOI] [PMC free article] [PubMed] [Google Scholar]
- 9.Zhang Q., Lenardo M.J., Baltimore D. 30 Years of NF-kappaB: a blossoming of relevance to human pathobiology. Cell. 2017;168:37–57. doi: 10.1016/j.cell.2016.12.012. [DOI] [PMC free article] [PubMed] [Google Scholar]
- 10.Ma X.Y., Wang H., Ding B., Zhong H., Ghosh S., Lengyel P. The interferon-inducible p202a protein modulates NF-kappaB activity by inhibiting the binding to DNA of p50/p65 heterodimers and p65 homodimers while enhancing the binding of p50 homodimers. J. Biol. Chem. 2003;278:23008–23019. doi: 10.1074/jbc.M302105200. [DOI] [PubMed] [Google Scholar]
- 11.Fujita T., Nolan G.P., Ghosh S., Baltimore D. Independent modes of transcriptional activation by the p50 and p65 subunits of NF-kappa B. Genes Dev. 1992;6:775–787. doi: 10.1101/gad.6.5.775. [DOI] [PubMed] [Google Scholar]
- 12.Ryo A., Suizu F., Yoshida Y., Perrem K., Liou Y.C., Wulf G., Rottapel R., Yamaoka S., Lu K.P. Regulation of NF-kappaB signaling by Pin1-dependent prolyl isomerization and ubiquitin-mediated proteolysis of p65/RelA. Mol. Cell. 2003;12:1413–1426. doi: 10.1016/s1097-2765(03)00490-8. [DOI] [PubMed] [Google Scholar]
- 13.Strebovsky J., Walker P., Lang R., Dalpke A.H. Suppressor of cytokine signaling 1 (SOCS1) limits NFkappaB signaling by decreasing p65 stability within the cell nucleus. FASEB J. 2011;25:863–874. doi: 10.1096/fj.10-170597. [DOI] [PubMed] [Google Scholar]
- 14.Baig M.S., Zaichick S.V., Mao M., de Abreu A.L., Bakhshi F.R., Hart P.C., Saqib U., Deng J., Chatterjee S., Block M.L., et al. NOS1-derived nitric oxide promotes NF-kappaB transcriptional activity through inhibition of suppressor of cytokine signaling-1. J. Exp. Med. 2015;212:1725–1738. doi: 10.1084/jem.20140654. [DOI] [PMC free article] [PubMed] [Google Scholar]
- 15.Chávez-Galán L., Olleros M.L., Vesin D., Garcia I. Much more than M1 and M2 macrophages, there are also CD169(+) and TCR(+) macrophages. Front. Immunol. 2015;6:263. doi: 10.3389/fimmu.2015.00263. [DOI] [PMC free article] [PubMed] [Google Scholar]
- 16.Ben-Neriah Y. Pinning NF-kappaB to the nucleus. Mol. Cell. 2003;12:1344–1345. doi: 10.1016/s1097-2765(03)00493-3. [DOI] [PubMed] [Google Scholar]
- 17.Yu G., Wang L.G., He Q.Y. ChIPseeker: an R/Bioconductor package for ChIP peak annotation, comparison and visualization. Bioinformatics. 2015;31:2382–2383. doi: 10.1093/bioinformatics/btv145. [DOI] [PubMed] [Google Scholar]
- 18.Strebovsky J., Walker P., Dalpke A.H. Suppressor of cytokine signaling proteins as regulators of innate immune signaling. Front. Biosci. 2012;17:1627–1639. doi: 10.2741/4008. [DOI] [PubMed] [Google Scholar]
- 19.Yu Y.R.A., O'Koren E.G., Hotten D.F., Kan M.J., Kopin D., Nelson E.R., Que L., Gunn M.D. A protocol for the comprehensive flow cytometric analysis of immune cells in normal and inflamed murine non-lymphoid tissues. PLoS One. 2016;11:e0150606. doi: 10.1371/journal.pone.0150606. [DOI] [PMC free article] [PubMed] [Google Scholar]
- 20.Julià A., Bonafonte-Pardàs I., Gómez A., López-Lasanta M., López-Corbeto M., Martínez-Mateu S.H., Lladós J., Rodríguez-Nunez I., Myers R.M., Marsal S. Targeting of the CD80/86 proinflammatory axis as a therapeutic strategy to prevent severe COVID-19. Sci. Rep. 2021;11 doi: 10.1038/s41598-021-90797-0. [DOI] [PMC free article] [PubMed] [Google Scholar]
- 21.Nolan A., Weiden M., Kelly A., Hoshino Y., Hoshino S., Mehta N., Gold J.A. CD40 and CD80/86 act synergistically to regulate inflammation and mortality in polymicrobial sepsis. Am. J. Respir. Crit. Care Med. 2008;177:301–308. doi: 10.1164/rccm.200703-515OC. [DOI] [PMC free article] [PubMed] [Google Scholar]
- 22.Sun Y., Liu Z., Liu D., Chen J., Gan F., Huang K. Low-level aflatoxin B1 promotes influenza infection and modulates a switch in macrophage polarization from M1 to M2. Cell. Physiol. Biochem. 2018;49:1110–1126. doi: 10.1159/000493294. [DOI] [PubMed] [Google Scholar]
- 23.Narasimhan P.B., Marcovecchio P., Hamers A.A.J., Hedrick C.C. Nonclassical monocytes in Health and disease. Annu. Rev. Immunol. 2019;37:439–456. doi: 10.1146/annurev-immunol-042617-053119. [DOI] [PubMed] [Google Scholar]
- 24.Olingy C.E., San Emeterio C.L., Ogle M.E., Krieger J.R., Bruce A.C., Pfau D.D., Jordan B.T., Peirce S.M., Botchwey E.A. Non-classical monocytes are biased progenitors of wound healing macrophages during soft tissue injury. Sci. Rep. 2017;7:447. doi: 10.1038/s41598-017-00477-1. [DOI] [PMC free article] [PubMed] [Google Scholar]
- 25.Nahrendorf M., Swirski F.K., Aikawa E., Stangenberg L., Wurdinger T., Figueiredo J.L., Libby P., Weissleder R., Pittet M.J. The healing myocardium sequentially mobilizes two monocyte subsets with divergent and complementary functions. J. Exp. Med. 2007;204:3037–3047. doi: 10.1084/jem.20070885. [DOI] [PMC free article] [PubMed] [Google Scholar]
- 26.Amulic B., Cazalet C., Hayes G.L., Metzler K.D., Zychlinsky A. Neutrophil function: from mechanisms to disease. Annu. Rev. Immunol. 2012;30:459–489. doi: 10.1146/annurev-immunol-020711-074942. [DOI] [PubMed] [Google Scholar]
- 27.Scott R.S., McMahon E.J., Pop S.M., Reap E.A., Caricchio R., Cohen P.L., Earp H.S., Matsushima G.K. Phagocytosis and clearance of apoptotic cells is mediated by MER. Nature. 2001;411:207–211. doi: 10.1038/35075603. [DOI] [PubMed] [Google Scholar]
- 28.Runyan C.E., Welch L.C., Lecuona E., Shigemura M., Amarelle L., Abdala-Valencia H., Joshi N., Lu Z., Nam K., Markov N.S., et al. Impaired phagocytic function in CX3CR1(+) tissue-resident skeletal muscle macrophages prevents muscle recovery after influenza A virus-induced pneumonia in old mice. Aging Cell. 2020;19:e13180. doi: 10.1111/acel.13180. [DOI] [PMC free article] [PubMed] [Google Scholar]
- 29.Cai B., Kasikara C., Doran A.C., Ramakrishnan R., Birge R.B., Tabas I. MerTK signaling in macrophages promotes the synthesis of inflammation resolution mediators by suppressing CaMKII activity. Sci. Signal. 2018;11:eaar3721. doi: 10.1126/scisignal.aar3721. [DOI] [PMC free article] [PubMed] [Google Scholar]
- 30.Kubala M.H., Punj V., Placencio-Hickok V.R., Fang H., Fernandez G.E., Sposto R., DeClerck Y.A. Plasminogen activator inhibitor-1 promotes the recruitment and polarization of macrophages in cancer. Cell Rep. 2018;25:2177–2191.e7. doi: 10.1016/j.celrep.2018.10.082. [DOI] [PMC free article] [PubMed] [Google Scholar]
- 31.Wojcik A.J., Skaflen M.D., Srinivasan S., Hedrick C.C. A critical role for ABCG1 in macrophage inflammation and lung homeostasis. J. Immunol. 2008;180:4273–4282. doi: 10.4049/jimmunol.180.6.4273. [DOI] [PubMed] [Google Scholar]
- 32.Tanaka K., Ichiyama K., Hashimoto M., Yoshida H., Takimoto T., Takaesu G., Torisu T., Hanada T., Yasukawa H., Fukuyama S., et al. Loss of suppressor of cytokine signaling 1 in helper T cells leads to defective Th17 differentiation by enhancing antagonistic effects of IFN-gamma on STAT3 and Smads. J. Immunol. 2008;180:3746–3756. doi: 10.4049/jimmunol.180.6.3746. [DOI] [PubMed] [Google Scholar]
- 33.Robinson M.D., McCarthy D.J., Smyth G.K. edgeR: a Bioconductor package for differential expression analysis of digital gene expression data. Bioinformatics. 2010;26:139–140. doi: 10.1093/bioinformatics/btp616. [DOI] [PMC free article] [PubMed] [Google Scholar]
- 34.McCarthy D.J., Chen Y., Smyth G.K. Differential expression analysis of multifactor RNA-Seq experiments with respect to biological variation. Nucleic Acids Res. 2012;40:4288–4297. doi: 10.1093/nar/gks042. [DOI] [PMC free article] [PubMed] [Google Scholar]
- 35.McLean C.Y., Bristor D., Hiller M., Clarke S.L., Schaar B.T., Lowe C.B., Wenger A.M., Bejerano G. GREAT improves functional interpretation of cis-regulatory regions. Nat. Biotechnol. 2010;28:495–501. doi: 10.1038/nbt.1630. [DOI] [PMC free article] [PubMed] [Google Scholar]
- 36.Hao Y., Hao S., Andersen-Nissen E., Mauck W.M., 3rd, Zheng S., Butler A., Lee M.J., Wilk A.J., Darby C., Zager M., et al. Integrated analysis of multimodal single-cell data. Cell. 2021;184:3573–3587.e29. doi: 10.1016/j.cell.2021.04.048. [DOI] [PMC free article] [PubMed] [Google Scholar]
- 37.Ye T., Krebs A.R., Choukrallah M.A., Keime C., Plewniak F., Davidson I., Tora L. seqMINER: an integrated ChIP-seq data interpretation platform. Nucleic Acids Res. 2011;39:e35. doi: 10.1093/nar/gkq1287. [DOI] [PMC free article] [PubMed] [Google Scholar]
- 38.Jalili V., Afgan E., Gu Q., Clements D., Blankenberg D., Goecks J., Taylor J., Nekrutenko A. The Galaxy platform for accessible, reproducible and collaborative biomedical analyses: 2020 update. Nucleic Acids Res. 2020;48:W395–W402. doi: 10.1093/nar/gkaa434. [DOI] [PMC free article] [PubMed] [Google Scholar]
- 39.Afgan E., Baker D., Batut B., van den Beek M., Bouvier D., Cech M., Chilton J., Clements D., Coraor N., Grüning B.A., et al. The Galaxy platform for accessible, reproducible and collaborative biomedical analyses: 2018 update. Nucleic Acids Res. 2018;46:W537–W544. doi: 10.1093/nar/gky379. [DOI] [PMC free article] [PubMed] [Google Scholar]
- 40.Langmead B., Salzberg S.L. Fast gapped-read alignment with Bowtie 2. Nat. Methods. 2012;9:357–359. doi: 10.1038/nmeth.1923. [DOI] [PMC free article] [PubMed] [Google Scholar]
- 41.Feng J., Liu T., Qin B., Zhang Y., Liu X.S. Identifying ChIP-seq enrichment using MACS. Nat. Protoc. 2012;7:1728–1740. doi: 10.1038/nprot.2012.101. [DOI] [PMC free article] [PubMed] [Google Scholar]
- 42.Ross-Innes C.S., Stark R., Teschendorff A.E., Holmes K.A., Ali H.R., Dunning M.J., Brown G.D., Gojis O., Ellis I.O., Green A.R., et al. Differential oestrogen receptor binding is associated with clinical outcome in breast cancer. Nature. 2012;481:389–393. doi: 10.1038/nature10730. [DOI] [PMC free article] [PubMed] [Google Scholar]
- 43.Kent W.J., Sugnet C.W., Furey T.S., Roskin K.M., Pringle T.H., Zahler A.M., Haussler D. The human genome browser at UCSC. Genome Res. 2002;12:996–1006. doi: 10.1101/gr.229102. [DOI] [PMC free article] [PubMed] [Google Scholar]
- 44.Grüning B.A., Rasche E., Rebolledo-Jaramillo B., Eberhard C., Houwaart T., Chilton J., Coraor N., Backofen R., Taylor J., Nekrutenko A. Jupyter and Galaxy: easing entry barriers into complex data analyses for biomedical researchers. PLoS Comput. Biol. 2017;13:e1005425. doi: 10.1371/journal.pcbi.1005425. [DOI] [PMC free article] [PubMed] [Google Scholar]
- 45.Virtanen P., Gommers R., Oliphant T.E., Haberland M., Reddy T., Cournapeau D., Burovski E., Peterson P., Weckesser W., Bright J., et al. SciPy 1.0: fundamental algorithms for scientific computing in Python. Nat. Methods. 2020;17:261–272. doi: 10.1038/s41592-019-0686-2. [DOI] [PMC free article] [PubMed] [Google Scholar]
- 46.Hunter J.D. Matplotlib: a 2D graphics environment. Comput. Sci. Eng. 2007;9:90–95. doi: 10.1109/MCSE.2007.55. [DOI] [Google Scholar]
- 47.Waskom M. seaborn: statistical data visualization. J. Open Source Softw. 2021;6:3021. doi: 10.21105/joss.03021. [DOI] [Google Scholar]
- 48.McKinney W. O'Reilly Media; 2013. Python for Data Analysis: Data Wrangling with Pandas, NumPy, and IPython. [Google Scholar]
- 49.Ge S.X., Jung D., Yao R. ShinyGO: a graphical gene-set enrichment tool for animals and plants. Bioinformatics. 2020;36:2628–2629. doi: 10.1093/bioinformatics/btz931. [DOI] [PMC free article] [PubMed] [Google Scholar]
- 50.Ramírez F., Ryan D.P., Grüning B., Bhardwaj V., Kilpert F., Richter A.S., Heyne S., Dündar F., Manke T. deepTools2: a next generation web server for deep-sequencing data analysis. Nucleic Acids Res. 2016;44:W160–W165. doi: 10.1093/nar/gkw257. [DOI] [PMC free article] [PubMed] [Google Scholar]
- 51.Martin M. Cutadapt removes adapter sequences from high-throughput sequencing reads. EMBnet. J. 2011;17:10. doi: 10.14806/ej.17.1.200. [DOI] [Google Scholar]
- 52.Aran D., Looney A.P., Liu L., Wu E., Fong V., Hsu A., Chak S., Naikawadi R.P., Wolters P.J., Abate A.R., et al. Reference-based analysis of lung single-cell sequencing reveals a transitional profibrotic macrophage. Nat. Immunol. 2019;20:163–172. doi: 10.1038/s41590-018-0276-y. [DOI] [PMC free article] [PubMed] [Google Scholar]
Associated Data
This section collects any data citations, data availability statements, or supplementary materials included in this article.
Supplementary Materials
Data Availability Statement
-
•
Single-cell RNAseq, chic-seq, and RNAseq data have been deposited at GEO and are publicly available as a series under the blanket GEO accession number GEO:GSE225835, accessible at ncbi.nlm.nih.gov, also listed below in the key resources table.
-
•
No original code was produced for this manuscript. All software used are available through public or commercial sources described in the key resources table.
-
•
Any additional information required to reanalyze the data reported in this paper is available from the lead contact upon request.