

Significance
The highly organized tissues and organs that form our body emerge from dynamic cellular activities. Among such activities, cell shape changes, rearrangements and divisions sculpt epithelial tissues into elongated sheets or tubes. Remodeling of cell–cell contacts is key to all these transformations. Although much is known about the molecular machinery that regulates the remodeling of cell–cell contacts, there is a lack of approaches to directly probe the mechanics of cell–cell contacts and thus assess their ability to resist or deform in response to mechanical loads. We developed an experimental technique to exert contractile and extensile stresses on cell–cell contacts. Our results lead to a physical model of junctional mechanics, with implications for modeling collective cell behavior in epithelial tissues.
Keywords: cell mechanics, optical tweezers, tissue morphogenesis, vertex model
Abstract
Biological tissues acquire reproducible shapes during development through dynamic cell behaviors. Most of these behaviors involve the remodeling of cell–cell contacts. During epithelial morphogenesis, contractile actomyosin networks remodel cell–cell contacts by shrinking and extending junctions between lateral cell surfaces. However, actomyosin networks not only generate mechanical stresses but also respond to them, confounding our understanding of how mechanical stresses remodel cell–cell contacts. Here, we develop a two-point optical manipulation method to impose different stress patterns on cell–cell contacts in the early epithelium of the Drosophila embryo. The technique allows us to produce junction extension and shrinkage through different push and pull manipulations at the edges of junctions. We use these observations to expand classical vertex-based models of tissue mechanics, incorporating negative and positive mechanosensitive feedback depending on the type of remodeling. In particular, we show that Myosin-II activity responds to junction strain rate and facilitates full junction shrinkage. Altogether our work provides insight into how stress produces efficient deformation of cell–cell contacts in vivo and identifies unanticipated mechanosensitive features of their remodeling.
How tissues and organs acquire their shape from internal cellular behaviors is a long-standing question that has fascinated several generations of scientists. Over the past decades, fluorescence imaging has revealed the complex choreography of cells during tissue morphogenesis (1, 2). By integrating imaging with genetics and biochemical manipulations, several studies have identified the molecular players shaping tissues and how their activities are regulated (3–6). Cell shape changes and rearrangements are among the most prominent cellular behaviors of tissue morphogenesis, enabling epithelial tissues to flow, elongate, fold, or invaginate (7). Such behaviors involve constant gain and loss of cell–cell contacts through remodeling cell–cell junctions, adherens junctions in particular (8).
Recent attempts to understand the mechanics of cell junctions have highlighted not only how the interplay between actomyosin contractility and adhesion affects junction length (9–11) but also their dissipative mechanical nature and mechanosensitive response (12–15). Myosin-II (Myo-II) is required for cell intercalation and in particular for junction shrinkage during germband elongation in the early Drosophila epithelium (16). Myo-II accumulates along shrinking junctions during this process in a pulsatile fashion (4). Several works hypothesized that Myo-II could react to junctional deformation (17–21). However, with a few exceptions (18, 21), most studies use Myo-II as a proxy for tension, which precludes the identification of feedback between Myo-II and tension.
Theoretical frameworks of tissue mechanics, notably the numerical schemes called vertex models (22, 23), are designed to explain cell shapes in terms of a balance of junctional tensions and cell pressures. Vertex models have been applied to describe several morphogenetic movements such as epithelial folding (24) and extension (25), formation of tissue boundaries (26), optic cup morphogenesis (27), and regular patterns in the retina (28). Such a framework has also been used to test potential mechanical feedback between Myo-II (affecting tension) and junction elongation (14, 29). In particular, Noll et al. (29) assumed that elongated junctions increase Myo-II recruitment, while contracted junctions decrease Myo-II levels.
Here, we implement a method based on optical manipulation to apply a controlled external mechanical perturbation to cell junctions. This method allows us to discriminate between different feedback models of epithelial mechanics. The optical method is derived from our previous work, showing that optical tweezers can directly trap individual junctions and deform them locally (30). Extending the method to deflect two junctions, we apply different patterns of forces at the edges of junctions to produce different modes of remodeling, including extension and shrinkage (partial or total). We used these measurements to challenge recently proposed models of junctional remodeling (14, 31). Going back and forth between experiments and simulations, we specify the mechanosensitive response of the junctions in vivo.
Results
Junction Extension.
To probe cell junction remodeling, we developed an experimental approach that uses two optical traps (Fig. 1 A and B). The experimental setup combines a home-built optical tweezers system with a spinning disk microscope for high-resolution imaging (Fig. 1A). The two traps are generated and controlled by fast galvanometric mirrors that time-share an infrared laser beam between two positions (32). We have shown previously that a single optical trap can directly tweeze and deflect individual cell junctions, enabling the measurement of junction tension and junction rheology in the early epithelium of the Drosophila embryo (12, 30). However, single junction manipulation does not result in significant contact remodeling. We reasoned that by tweezing and manipulating two junctions concomitantly we could deform their adjacent common junction (Fig. 1B, black junction in the sketch). We used 200-mW power per laser trap, which induces sufficiently large deflections (when the traps are moved) without damaging effects (See Supplementary information discussing potential damaging effects at high laser power and SI Appendix, Fig. S1). To exert an extensile force on junctions, we first applied two-point optical manipulation in a diagonal pull configuration: The two traps are moved away from each other in an antiparallel direction by 1.5 µm and then maintained at fixed positions (Fig. 1B and Movie S1). This manipulation results in the extension of the common adjacent junction, called hereafter the middle junction (Fig. 1C, length change of the black junction sketched in Fig. 1B). The middle junction extends gradually and reaches a stable length within 60 s (Δl60s, Fig. 1 C and D), which corresponds to a time slightly larger than the timescale of mechanical dissipation that we measured previously in this early epithelium (50 s see ref. 12). As a comparison, junctions, in the absence of manipulation (Fig. 1E, control) or at a few cells distance (>5 and <10) from the points of manipulation (SI Appendix, Fig. S2), do not change length significantly. The diagonal pull with two traps results in asymmetric length change of the adjacent junctions (Fig. 1D). The manipulated junctions (Fig. 1D, red) are first deflected but do not change their length in the long term. In contrast, the adjacent nonmanipulated junctions decrease their length (Fig. 1D, blue). We checked that the observed length changes were not a consequence of cell positions’ changes along the optical axis due to trapping forces (SI Appendix, Fig. S3).
Fig. 1.

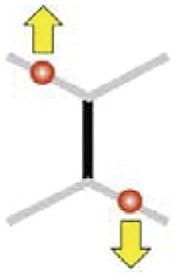
Remodeling cell contacts by two-point optical manipulation. (A) Schematic of the setup. The early epithelium of the Drosophila embryo is imaged using a spinning disc confocal system, while cell–cell junctions are remodeled by a two-point optical manipulation produced by an infrared laser. (B) Schematic (Left) and images (Right) of the diagonal pull manipulation: the laser focus of the two traps (red dots) are positioned at two junctions (red, manipulated junctions) sharing a common neighboring junction (black, Middle junction). The traps are moved away from each other, in an antiparallel direction and maintained at 1-µm distance from their initial position (yellow arrows), causing junction remodeling. The cell junctions are labelled by E-cad::GFP. Scale bar: 5 µm. (C) Length changes of the middle (black) and adjacent nonmanipulated junctions (blue). Median (solid line) and the 25th to 75th percentile range are shown. Δl60s denotes the length change 60 s after the onset of manipulation (N = 24). (D) Length changes, 60 s post diagonal pull manipulation; the results from each of the N = 24 experiments are represented through identically coloured dots connected by grey lines. (E) Comparison of length changes at 60 s of the middle junction for different manipulation geometries: i) diagonal pull (N = 24), ii) same side pull (N = 28), iii) single junction pull (N = 30). Control corresponds to length changes at 60 s of junctions in the absence of manipulation. (F) Comparison of cumulative length changes showing, in the context of the diagonal pull manipulation, the compensatory mechanism between the extension of the middle junction and the contraction of the adjacent nonmanipulated junctions.
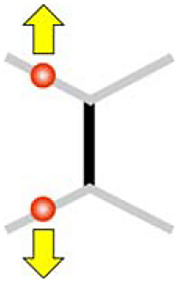
To test if other patterns of extensile forces can remodel cell junctions, we then manipulated two junctions belonging to the same cell and sharing an adjacent junction (a configuration called same side pull, Fig. 1E). In contrast to the diagonal pull (Fig. 1E), the same side pull manipulation did not produce any significant changes in the middle junction length (Fig. 1E), nor that of the manipulated or adjacent nonmanipulated junctions (Fig. 1F, same side pull to be compared with diagonal pull). The diagonal pull elicits an asymmetric sliding mechanism (Fig. 1F, green versus orange and Fig. 1D): the middle junction extends at the expense of adjacent nonmanipulated junctions while the manipulated junctions maintain their length. In comparison, single junction manipulation was inefficient in changing the length of adjacent junctions (Fig. 1E).
To understand the mechanical origin of this response, we adapted a mechanical model of tissues that could be experimentally falsifiable. In vertex models, the geometry of epithelial cells is represented by edges (junctions) connecting vertices (representing tricellular contacts) at a set of locations ri. Here, we consider the set of vectors ri = (xi,yi) within a two-dimensional manifold that describes the apical surface, which we consider flat at this scale. The motion of the vertices is then determined by the balance between friction forces ( , with a friction coefficient, that is typically mediated by mechanical interactions with the vitelline membrane (33) and the mechanical work exerted by pressure and tension forces, described through a work function U that includes an elastic control of the cell apical surface area and a set of junction tensions (23):
| [1] |
where KA is the area elastic modulus, AJ denotes the cell area within the apical surface of the cell J and A0 its target area, such that PJ − PI = -KA(AJ − AI) corresponds to the difference of pressure between the cells I and J; Λij the junction tension; is the length along the junction between the vertices i and j.
To mimic the effect of the trapping forces, we introduced a set of two-way vertices, initiated at the middle of all junctions (Fig. 2A and Movie S2). When active, the trap acts on the closest vertex through an additional force Fi(trap)
| [2] |
Fig. 2.

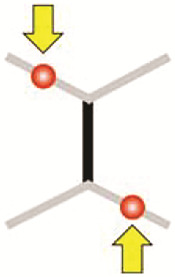
Vertex model simulations including dynamic feedbacks predict junction extension and contraction. (A). A vertex-based network with tricellular junctions (red dots) and intermediated mechanical elements (green dots), on which trapping forces are applied (yellow arrows). The model considers tensions Λij along junctions and cell pressures within each cells P = -KA(A − A0), with A (resp. A0) the cell current (resp. target) area (B) Comparison of model simulated and experimentally observed length changes at 60 s post-manipulation for middle, manipulated, and nonmanipulated adjacent junctions, for diagonal pull (N = 24), for ke = 0 (Model A) and ke = 0.005 (Model B). (C) Model simulated (solid curve) and experimentally observed (broken curve) length changes of the middle junction (with ke = 0.005, model B, see Methods for details). (D) Cartoons of the predicted length changes for diagonal pull and diagonal push manipulation, in the presence or absence of dynamic remodeling. In the absence of dynamic remodeling ke (ke = 0, model A), extensile strain does not produce any change of junction tension Λ (Middle Top). Extensile strain ( > 0) caused by diagonal pull elicits a negative feedback (ke = 0.05 > 0 in model B) on tension, which favors larger extension (Top Right). Contractile strain ( < 0) caused by diagonal push can elicit a positive feedback (Bottom Left: kc > 0) or a positive feedback (bottom right: kc = −0.05 < 0 in model C) on tension, which favors large or small contraction, respectively. (E) Comparison of model simulated and experimentally observed length changes at 60 s post-manipulation for middle, manipulated, and nonmanipulated adjacent junctions, for diagonal push (N = 38), for kc = 0.005 and kc = 0.0 (Model B) and kc = −0.005 (Model C). (F) Comparison of simulated and experimentally observed cumulative length changes at 60 s post-manipulation showing compensatory mechanism between contraction of the middle and extension of adjacent junctions for the diagonal push.
where Ktrap is the trap stiffness and rtrap − ri denotes the relative position between the center of the trap and the deflected vertex, which may either be a two-way vertex (diagonal pull or push, defined later) or a three-way vertex (direct push).
Combining the trap forces of Eq. 2 within the framework of Eq. 1 defines what we call model A. We ran simulations on networks of cells whose statistical properties matched those observed in experiments in terms of area, perimeter, length of cell–cell edges, tension and pressure statistics (SI Appendix, Sec. 2 and Fig. S7). We found that model A failed to reproduce the extension observed in the diagonal pull manipulation (Fig. 2B). This indicates that a mechanism that favors large strains in response to extensile forces is missing in model A.
We then adapted a vertex model in which junctions are dynamically remodeled upon large strain. Following (14), we consider that the junction tension Λij along the junction between the vertices i and j (Fig. 2C) dynamically adapts to changes in junction length according to the rule
| [3] |
where ke denotes the rate of tension remodeling under junction extension; the strain along the junction between the vertices i and j and represents a critical strain beyond which such remodeling occurs. Following (12, 14)., the rest length l0,ij of the cell–cell junction evolves according to
| [4] |
where kL > 0 is a viscous relaxation rate (with 1/kL called junction viscoelastic time in ref. 12).
Adding this mechanosensitive response to model A defines what we call model B (models A and B are identical when ke = 0; note that at steady state, lij = l0,ij). We accurately predict the experimental observations (Fig. 2D) for a positive value ke = 0.005 (=0.18 pN⋅μm−1⋅s−1) together with kL = 0.04 (=0.04 s−1); the latter value is consistent with previous estimates of the cortical renewal time (34). Such behavior reveals that an extensional strain reduces tension (Fig. 2D). Model B also accurately predicted the reduction in length of the adjacent nonmanipulated junctions (Fig. 2B). Model B further predicted the fact that in the same side pull manipulation (Table 1), the junction length changes would be limited.
Table 1.
Comparison between experimental observations and models
| Model A Classical vertex model | Model B Classical vertex model + Junction remodeling (extension) ke > 0 and kc = 0 | Model C Classical vertex model + Junction remodeling (extension & shrinkage) ke > 0 and kc < 0 | Model D Classical vertex model + Junction remodeling (extension & shrinkage) + Myosin recruitment | Experimental results | |
|---|---|---|---|---|---|
Diagonal pull
|
+0.24 μm (+0.12 μm, +0.37 μm) | +0.61 μm (+0.15 μm, +1.12 μm) | +0.61 μm (+0.15 μm, +1.12 μm) | +0.61 μm (+0.15 μm, +1.12 μm) | +0.72 μm (+0.34 μm, +1.12 μm) |
Same side pull
|
+0.08 μm (+0.05 μm, + 0.12 μm) | +0.20 μm (+0.07 μm, +0.37 μm) | +0.20 μm (+0.08 μm, +0.34 μm) | +0.20 μm (+0.05 μm, +0.34 μm) | +0.18 μm (-0.05 μm, +0.45 μm) |
Diagonal push
|
-0.57 μm (-0.69 μm, -0.39 μm) | -0.63 μm (-0.72μm, -0.45 μm) | -0.30 μm (-0.36 μm, -0.22 μm) | -0.30 μm (-0.36 μm, -0.22 μm) | -0.20 μm (-0.65 μm, -0.02 μm) |
Direct push
|
ε = -0.82 (-0.83, -0.80) | ε = -0.83 (-0.84, -0.81) | ε = -0.76 (-0.77, -0.74) | ε = -0.95 (-0.96, -0.74) | Full shrink ε = -1 |
Comparison of the median extension of the middle junction (diagonal pull, same side pull, and diagonal push) and median strain of the middle junction (direct push) between experiments and simulations. In parenthesis: 25th to 75th percentiles.
The value that we find for kL is significantly larger than the estimate found for in vitro epithelial cells (14, 35). An explicit link between the actin turnover and the viscoelastic time 1/kL was shown in (12), where Cytochalasin D (a drug blocking the actin remodeling) was shown to increase the junction viscoelastic time.
Junction Shrinkage.
As the diagonal pull manipulation produces a significant extension of the middle junction, we wondered if a similar manipulation with opposite direction of forces (which we call diagonal push) could produce the opposite length changes (Fig. 2D, Bottom and Fig. 2E). As expected, we found that such push manipulation leads to a significant shrinkage of the middle junction, and to an extension of the manipulated and nonmanipulated adjacent junctions. However, in contrast to the diagonal pull manipulation, the diagonal push produces a symmetric deformation (Fig. 2E): the shrinkage of the middle junction is similarly compensated by the extension of the manipulated and nonmanipulated adjacent junctions. As for junction extension, we used our observations to constrain the physical model. We noticed that the extent of junction shrinkage in diagonal push was smaller than that for junction extension in diagonal pull. We thus tested if dynamical remodeling was also present or not for junction shrinkage by introducing an asymmetric deformation in the form
| [5] |
where we introduce the parameter kc for the rate of tension remodeling under junction contraction. Adding the mechanosensitive response of Eq. (5) to model B defines what we call model C. Exploring different values of kc (Fig. 2D, Bottom, kc = 0, kc < 0, kc > 0), we found that a negative value kc = −0.003 (= −0.10 pN⋅μm−1⋅s−1, see Methods) produced the best fit to our experimental observations, not only for the shrinkage of the middle junction but also for manipulated and nonmanipulated adjacent junctions (Fig. 2E). The fact that the best fit value of kc is negative indicates that, under the diagonal push manipulation, the junction shrinkage reduces junction tension (Fig. 2D, Bottom). A prediction of this mechanosensitive response is that after a trap release, the middle junction should relax back to a configuration associated with a lower tension. Consistent with our model prediction, we found that, after shutting the laser off (trap release), the middle junction returns to a longer length (SI Appendix, Fig. S4).
Myosin-II Feedbacks on Junction Shrinkage.
In five instances out of thirty eight, the diagonal push manipulation led to a full shrinkage of the middle junction, i.e., the three-way vertices on each side of the junction joined into a single four-way vertex.
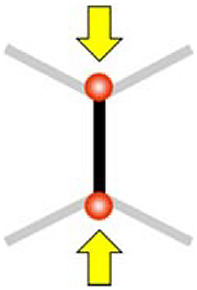
The formation of four-way vertices is a step in the cell intercalation process (16). To understand the mechanics of such full junction remodeling, we designed the direct push manipulation by positioning the traps on the two vertices of a junction and moving them inwards to the middle of the junction (Fig. 3 A and B, and Movies S3 and S4). Such direct push manipulation led to full-junction shrinkage (Fig. 3 B and C). We compared these striking observations with the predictions of model C elaborated so far. While our model C qualitatively explains the junction shrinkage of the targeted junction and the extension of its neighboring junctions, it predicts a partial shrinkage (at 80% of the initial length) and fails to explain full (100%) shrinkage of the middle junction (Fig. 3D and Table 1). In addition, we seek to understand why the experimental shrinkage statistics exhibits a two-population behavior with half of the junctions shrinking with an average time of 13 s (N = 8) and the other half in 72 s (N = 7), which is about six times slower (Fig. 3C).
Fig. 3.

Direct push on vertices produces full junction remodeling. (A). Schematic of the direct push manipulation. Traps are positioned on vertices and move toward the center of the middle of the junction. (B). Two examples of full-junction shrinkage with distinct kinetics: fast (Left, 7 s) and slow (Right, 109 s) shrinkage. (Scale bar: 5 µm.) (C). Length changes of shrinking junctions over time (N = 15). Full shrinkage times are broadly distributed. Blue and red curves show mean length changes for curves exhibiting short full shrinkage times (t4way < 30 s) and long full shrinkage times (t4way ≥ 30 s). (Scale bar: 5 µm.) (D). Comparison of model simulated and experimentally observed strains. Model C does not predict full junction shrinkage.
Such discrepancy of our model C predictions in the direct push context points to a missing feedback on the optically forced junction shrinkage. Here, we show that Myosin-II (Myo-II) recruitment can mediate such a mechanism. Myo-II is known to be required for cell intercalation and, in particular, for junction shrinkage during germband elongation in the early Drosophila epithelium (16). Myo-II accumulates along shrinking junctions during this process in a pulsatile fashion (4). As suggested in several works (17–20, 36), we hypothesized that Myo-II could react to deformation. To test this hypothesis, we performed experiments in ROCK-inhibited embryos (using the Rho-kinase inhibitor H-1152) and compared the deformations produced in this condition with untreated embryos, both for direct push and diagonal pull (Fig. 4 A and B, respectively). We did not manage to shrink junctions by direct push of vertices in ROCK-inhibited embryos (Fig. 4A, Bottom images, and Movie S5). Instead, the manipulation resulted in the junctions being bent (Movie S5). This shows that Myo-II activity is required for the full-junction shrinkage process. In contrast, for diagonal pull, we did not observe any difference in junction deformation between the ROCK-inhibited and untreated embryos (Fig. 4B, Bottom plots). To further test the requirement of Myo-II in junction shrinkage in push experiments, we imaged Myo-II during optical manipulation (Fig. 4 C and D, and Movie S6). Analysis of Myo-II intensity along junctions that fully shrink shows the temporal accumulation of Myo-II in the targeted junction (kymograph Fig. 4D). A similar response was observed for F-actin in the same direct push manipulation (SI Appendix, Fig. S5 and Movie S7). This increase in Myosin intensity supports a Myo-II-dependent feedback mechanism that would amplify the reduction in junction length by optical manipulation and contribute to full-junction shrinkage (Fig. 4E). To further assess this point, we looked for correlations between Myo-II intensity and the strain rate in push experiments (Fig. 4 F and G). Optical manipulation allowed us to explore a regime of high (negative) strain rates (circles and diamonds) compared with those observed in the absence of manipulation (triangles) and revealed the mechanosensitive response of junctional Myo-II to the junctional strain rate (Fig. 4G).
Fig. 4.

Myosin-II activity depends on contractile strain rate to produce full shrinkage. (A) Direct push manipulation in ROCK-inhibited embryos (via injection). At 30 s post-manipulation, the middle junction appears bent but not shrunk. (Scale bar: 5 µm.) (B). Diagonal pull manipulation in ROCK-inhibited (N = 11) and comparison to untreated embryos (N = 24). Length changes in the two conditions for middle (black), manipulated (red), and nonmanipulated adjacent (blue) junctions. (C). Images of Myo-II (Sqh::GFP, inverted contrast) at the onset of the direct push and during shrinkage (25 s). (Scale bar: 5 µm.) (D). Kymograph of Myo-II (Sqh::GFP) intensity along a shrinking junction under direct push, showing accumulation of Myo-II over time. (E). Schematic of the mechanical model showing the feedback mechanism by which Myo-II strain rate-dependent feedback on tension promotes full junction shrinkage. (F). The minimal strain rate (i.e., maximum absolute contraction rate), for direct push manipulation, diagonal push manipulation (making four-way vertices), diagonal push manipulation in the absence of manipulation. (G). Maximum increase in Myo-II intensity along junctions as a function of the minimal strain rate, for direct push manipulation (diamonds), diagonal push manipulation (circles), and in the absence of manipulation (triangles). (H). Comparison of models D and D′ simulated, and experimentally observed strains. Models D and D′ simulated include Myo-II-positive feedback on tension depicted in (E). (I). Cumulative density function (CDF) of full-junction shrinkage time experimentally observed (solid lines, N = 15) and simulated in model D′ (broken lines, N = 183)
These results demonstrate the existence of a positive feedback mechanism, which we then introduced in our physical model. We assumed that, for sufficiently large strain rates, i.e. larger than = -0.05 s−1, that MyoII is recruited and induces a tension increase in the form
| [6] |
where H(x) is the Heaviside step function (equal to 1 if x > 0, 0 otherwise); 1/km is a time scale for myosin recruitment and Tm a strength of the myosin-induced tension modulation. The adjunction of Eq. 6 to our previous model C defines model D. Following Eq. 6), we first considered an exponential kernel (i.e., the term kmexp[−km(t − t′)] in Eq. 6), which could recapitulate the statistics of junction lengths in the direct push manipulation (Fig. 4H). However, model D could not recapitulate the behavior of the cumulative distribution function (CDF) of shrinkage times (Fig. 4I), which shows a slope change at a value close to 50% that is indicative of two (fast or slow) categories of shrinkage events (Fig. 3C). This led us to define model D′ which incorporates an explicit time-delay in the memory kernel by substituting the exponential memory kernel = by a Gaussian kernel in Eq. 6, see Supplementary Information. Considering the time shift to be Gaussian distributed, we were able to achieve a qualitative fit of the cumulative distribution of shrinkage times (Fig. 4I), as well as all other experimental observations (Table 1).
Discussion
In previous work, a single-trap manipulation provided the means to measure the local junction tension and rheology (30, 37). Here, we have introduced a method to remodel cell junctions efficiently. We show that a two-point manipulation can exert forces in several configurations to extend or shrink junctions. This allows us to directly mimic events that occur in vivo and assess, without proxy, the mechanics of junction remodeling.
By applying different patterns of forces, we identified different modes of deformation. These modes involve length compensatory mechanisms between adjacent junctions. Diagonal pull elicits junction extension by asymmetric sliding, as evidenced by the asymmetry of length changes of the nonmanipulated and adjacent manipulated junctions (Fig. 1 D and F). Such asymmetry suggests that the two apposed membranes forming the extending junction slide alongside each other. Whether the resulting shear could lead to the rupture of adhesion bonds remains to be understood (38). In contrast, shrinkage by diagonal or direct push results in a symmetric sliding with equal length compensation from the nonmanipulated and adjacent manipulated junctions. This suggests an unzipping mechanism, in agreement with recent observations of vertex sliding mediated by Myo-II contractility (39).
In recent years, several techniques to measure tissue mechanics in situ have burgeoned (40–42). Still, with a few exceptions in vivo (12) and in vitro (14, 43), these are seldom used to falsify theoretical models. Here, we have used two-point manipulation to discriminate among several mechanical models. We found that the standard vertex models with constant tensions cannot explain junction remodeling. We find that a set of simple mechanosensitive rules, implying positive and negative feedback loops on the junctional tension, allows us to describe our complete set of experimental manipulations. Our direct experimental approach complements image-based force inference methods recently implemented to estimate the mechanical parameters of remodeling epithelial tissues (44).
Actomyosin networks are known to not only generate but also respond to forces. Myo-II is a mechanosensitive enzyme whose activity and binding affinity depend on the mechanical load (45). Mechanical forces could also affect F-actin assembly and disassembly. At the tissue level, epithelial tension has been shown to orient actomyosin networks, which, in turn, modify force generation (46). Furthermore, at cell junctions, the attachment of actomyosin networks to adhesion complexes is also mechanosensitive (47–50). These different feedback mechanisms between forces and the contractile and adhesion networks are challenging to assess in vivo. The two-point perturbation presented here approach provides the means to dissect such feedback in vivo.
Works from our group and others have reported strain rate values during Drosophila embryogenesis. During germband elongation (data shown in Fig. 4 F and G and in refs. 4 and 51), junctions shrink stepwise with strain rates of the order of 0.01 s−1. Consistent with a recent paper showing that strain rate quantitatively affects the pattern of Myo-II recruitment during germband elongation (21), our measurements indicate that such strain rates can locally trigger Myo-II response (Fig. 4G). Similar rates have been measured during mesoderm invagination (3) and dorsal closure (52), where cells change their apical area in a pulsatile fashion. Large strain rates (of the order of 0.3 s−1) are observed during cytokinesis in the Drosophila (53) but also in the C. elegans embryo (54).
Similar strain rates (of the order of 0.1 s−1) are typical in laser ablation experiments, such as those performed at a similar stage Drosophila development to ours (25). Both the laser ablation and direct push perturbation result in a rapid change in the junctional tension; indeed, in a laser ablation experiment, the laser cut induces a rapid decrease in the junction tension, from a finite positive value to a value close to zero. In direct push manipulation, the force applied by the trap amounts to a rapid increase in the junction tension. It is, therefore, coherent that the observed strain rates can be of the same order of magnitude in these two experiments.
Our findings extend recent measurements of the viscoelastic and mechanosensitive properties of junctions. Single-trap optical manipulation has revealed the characteristic time of energy dissipation at junctions, which depends on actin turnover (12). Optogenetic control of Myo-II activity has shown that the viscoelastic response of junctions is active: Upon strain, junctions adapt their contractile tension. Here, we specify the positive and negative feedbacks that regulate junction dynamics. Consistent with in vitro results (14), we found that junctional tension adapts in vivo to the applied strain. However, we found that contraction and extension lead to distinct adaptations. Furthermore, our approach disentangles the Myo-II-dependent and Myo-II-independent contributions to strains. On the one hand, we identified two Myo-II-independent mechanical feedbacks, with one positive feedback to junction extension (as encapsulated in the sign of the parameter, ke >0) and one negative feedback to junction contraction (kc < 0). On the other hand, we uncovered Myo-II-dependent feedback to junction contraction (rate km), controlled by the junctional strain rate, complementing previous reports showing that Myo-II accumulates upon tissue deformation (17–20, 36).
A set of negative/positive couplings between forces and deformation could represent an efficient mechanism to buffer weak contraction events while ensuring full contraction at large loads. As such, we expect our findings to have broad implications for understanding tissue morphogenesis.
Methods
Sample Preparation.
To image the adherens junctions and Myo-II in Drosophila embryos, we used E-cadherin::GFP flies (endogenous promoter) and sqsh::GFP flies, respectively. Once harvested, the embryos were washed with 100% bleach for 50 s to remove the chorion. Embryos at the end of cellularization (stage 5 end) were then selected under a dissection microscope and aligned on the edge of the coverslip. Alignment was done with the germband visible in the imaging plane. For Myo-II activity inhibition, embryos were placed in halocarbon oil and injected using a microinjection setup with ROCK inhibitor (H-1152, 40 mM, Invitrogen). Embryos were immersed in halocarbon oil for spinning disk imaging.
Two-Point Optical Manipulation and Imaging.
Optical manipulation of the cell junctions in individual embryos was done using a spinning-disk microscope (Perkin-Elmer), coupled with a home-built two-point manipulation laser system. The laser trap system was described in (30). A 100× water immersion lens (CFI Plan Apochromat VC 100× oil, NA 1.40, WD 0.13) was used for imaging and optical manipulation in the imaging plane. To achieve two-point manipulation, we split an IR laser beam (1,070-nm wavelength) into two beams by fast commutation of two galvanometric mirrors. The switching time of the galvanometric mirrors is 100 µs, representing 2.5% of the time spent on each trap (4 ms). The relationship between the (X and Y) positions of the two resulting traps and the galvanometric command voltages is calibrated by trapping colloidal beads in water prior to manipulation in the embryo (30).
Prior to a junction manipulation, laser traps are stably positioned for 5 s on a point located along the target junction. The trap is then moved to a defined distance and maintained (Fig. 1A). If not otherwise stated, the trap displacements were 1.5 µm within 3 s, the laser power per trap was fixed at 200 mW, and the acquisition was performed over 3 min.
Image and Data Analysis.
To analyze the length of junctions, we performed image segmentation with Tissue Analyzer (39). The length changes presented in the figures are averaged over 5 s. To measure the strain rate, the curves are first smoothed according to a spline interpolation defined on a 5-s time window (applied to the data acquired with 1-s frame rate). To analyze the intensity of Myo-II, we corrected for photobleaching (Fiji) and then measured the signal intensity at the junctions from the segmented image. Myo-II intensity is defined by the ratio of the integrated signal at the junction to the junction length. Kymographs are made from the images with KymoResliceWide, after photobleaching correction and registration to remove tissue drift have been performed (all procedures were performed in Fiji).
Vertex-Based Models:
adimensional units.
We normalize Eq. 1 using the length scale the time scale , and the stress scale . Simulations are performed using the equation
where all parameters in title are dimensionless, in particular with .
Parameter values.
Our estimate for the average apical area of manipulated Drosophila epithelial cells is . In our simulation, we set the target area at . Considering an area stiffness (55), our stress unit reads . Comparing the time evolution of junction length between experiments and simulations, Fig. 2C, we fix the time scale as . A previous experimental found that the range of tension is (23). To mimic such heterogeneity of the junction tension, we assume a Gaussian distribution of with an average and SD . We further validated our choice of the parameter set by finding a quantitative agreement between experiments and simulations on the distribution of cell area, cell perimeter, and cell shape index (SI Appendix, Sec. 2 and Fig. S7).
Trap forces.
We randomly choose a junction whose length was within the range of 0.9 µm to 2.4 µm (as in experiments), i.e., 0.15 to 0.4 in dimensionless unit; this junction will correspond to the junction called middle junction in experiments. The stiffness of the spring connecting the optical trap and the vertex under pulling/pushing is taken as (30), which results in . The displacement of the optical trap in experiments is , i.e.
Initialization.
We begin with a hexagonal cell pattern consisting of cells in a periodic box satisfying , i.e. . For the given distribution in tension the system is not at steady state; we then let the system relax according to the motion equation (1). We performed T1 topological transition any time a junction length reaches the threshold value (i.e., ).
Additional information and model validation are provided in SI Appendix, Sec. 2.
Supplementary Material
Appendix 01 (PDF)
Diagonal pull manipulation A movie of diagonal pull manipulation, which corresponds to Fig. 1B in the main text (E-cad::GFP). The length change at 60 s post-manipulation is Δl60s = 1.13 μm. Total duration is 70 s (10 times fast forward). Red circles are the two positions of laser focus. Scale bar: 5 μm.
Simulation of diagonal pull manipulation A movie of numerical simulation of a diagonal pull manipulation using model D as described in the main text.
Fast shrinkage in direct push manipulation A movie of direct push manipulation, which corresponds to Fig. 3B (left) in the main text (E-cad::GFP). The junction was shrunk fast (7 s) after applying optical forces. Scale bar: 5 μm.
Slow shrinkage in direct push manipulation A movie of direct push manipulation which is corresponding to Fig. 3B (right) in the main text (E-cad::GFP). The junction was slowly shrunk (109 s) after force application. Scale bar: 5 μm.
direct push manipulation for a Rock-inhibited tissue A movie of direct push manipulation for a Rock-inhibited tissue, which corresponds to Fig. 4A in the main text (E-cad::GFP). The junction was not shrunk and escaped from optical manipulation. Scale bar: 5 μm.
Myosin II response during junction shrinkage A movie of direct push manipulation, which corresponds to Fig. 4C in the main text (Sqh::GFP, inverted contrast). Scale bar: 5 μm.
F-actin response during junction shrinkage A movie of direct push manipulation which is corresponding to Fig. S5 (Utrophin::GFP, inverted contrast). Scale bar: 5 μm.
Acknowledgments
The project leading to this publication has received funding from France 2030, the French Government program managed by the French National Research Agency (ANR-16-CONV-0001) and from Excellence Initiative of Aix-Marseille University - A*MIDEX, and generic grants, ANR-17-CE13-0032 and ANR-20-CE30-0023. We also acknowledge the France-Bioimaging Infrastructure (ANR-10-INBS-04). We thank Thomas Lecuit and Yi-An Yang for insightful meetings and advice, the Lenne, Rupprecht and Lecuit groups for discussions, and François Graner and Katia Barrett for comments on the manuscript.
Author contributions
K.N., S.-Z.L., J.-F.R., and P.-F.L. designed research; K.N., S.-Z.L., and C.C. performed research; K.N., S.-Z.L., C.C., J.-F.R., and P.-F.L. analyzed data; and K.N., S.-Z.L., J.-F.R., and P.-F.L. wrote the paper.
Competing interests
The authors declare no competing interest.
Footnotes
This article is a PNAS Direct Submission. G.H.K. is a guest editor invited by the Editorial Board.
Contributor Information
Jean-François Rupprecht, Email: jean-francois.RUPPRECHT@univ-amu.fr.
Pierre-François Lenne, Email: pierre-francois.LENNE@univ-amu.fr.
Data, Materials, and Software Availability
Images (tiff); excel sheets data have been deposited in Zenodo (https://doi.org/10.5281/zenodo.6867898) (56).
Supporting Information
References
- 1.Keller P. J., Schmidt A. D., Wittbrodt J., Stelzer E. H., Reconstruction of zebrafish early embryonic development by scanned light sheet microscopy. Science 322, 1065–1069 (2008). [DOI] [PubMed] [Google Scholar]
- 2.McDole K., et al. , In toto imaging and reconstruction of post-implantation mouse development at the single-cell level. Cell 175, 859–876.e33 (2018). [DOI] [PubMed] [Google Scholar]
- 3.Martin A. C., Kaschube M., Wieschaus E. F., Pulsed contractions of an actin-myosin network drive apical constriction. Nature 457, 495–499 (2009). [DOI] [PMC free article] [PubMed] [Google Scholar]
- 4.Rauzi M., Lenne P. F., Lecuit T., Planar polarized actomyosin contractile flows control epithelial junction remodelling. Nature 468, 1110–1114 (2010). [DOI] [PubMed] [Google Scholar]
- 5.Sherrard K., Robin F., Lemaire P., Munro E., Sequential activation of apical and basolateral contractility drives ascidian endoderm invagination. Curr. Biol. 20, 1499–1510 (2010). [DOI] [PMC free article] [PubMed] [Google Scholar]
- 6.Krueger D., Tardivo P., Nguyen C., De Renzis S., Downregulation of basal myosin-II is required for cell shape changes and tissue invagination. EMBO J. 37, e100170 (2018). [DOI] [PMC free article] [PubMed] [Google Scholar]
- 7.Collinet C., Lecuit T., Programmed and self-organized flow of information during morphogenesis. Nat. Rev. Mol. Cell Biol. 22, 245–265 (2021). [DOI] [PubMed] [Google Scholar]
- 8.Pinheiro D., Bellaïche Y., Mechanical force-driven adherens junction remodeling and epithelial dynamics. Dev. Cell 47, 3–19 (2018). [DOI] [PubMed] [Google Scholar]
- 9.Maître J.-L., et al. , Adhesion functions in cell sorting by mechanically coupling the cortices of adhering cells. Science 338, 253–256 (2012). [DOI] [PubMed] [Google Scholar]
- 10.Graner F., Riveline D., ‘The forms of tissues, or cell-aggregates’: ‘Arcy Thompson’s influence and its limits. Development 144, 4226–4237 (2017). [DOI] [PubMed] [Google Scholar]
- 11.Winklbauer R., Dynamic cell-cell adhesion mediated by pericellular matrix interaction - a hypothesis. J. Cell Sci. 132, jcs231597 (2019). [DOI] [PubMed] [Google Scholar]
- 12.Clément R., Dehapiot B., Collinet C., Lecuit T., Lenne P.-F., Viscoelastic dissipation stabilizes cell shape changes during tissue morphogenesis. Curr. Biol. 27, 3132–3142.e4 (2017). [DOI] [PubMed] [Google Scholar]
- 13.Iyer K. V., Piscitello-Gómez R., Paijmans J., Jülicher F., Eaton S., Epithelial viscoelasticity is regulated by mechanosensitive E-cadherin turnover. Curr. Biol. 29, 578–591.e5. 2019). [DOI] [PubMed] [Google Scholar]
- 14.Staddon M. F., Cavanaugh K. E., Munro E. M., Gardel M. L., Banerjee S., Mechanosensitive junction remodeling promotes robust epithelial morphogenesis. Biophys. J. 117, 1739–1750 (2019). [DOI] [PMC free article] [PubMed] [Google Scholar]
- 15.Lenne P.-F., Rupprecht J.-F., Viasnoff V., Cell junction mechanics beyond the bounds of adhesion and tension. Dev. Cell 56, 202–212 (2021). [DOI] [PubMed] [Google Scholar]
- 16.Bertet C., Sulak L., Lecuit T., Myosin-dependent junction remodelling controls planar cell intercalation and axis elongation. Nature 429, 667–671 (2004). [DOI] [PubMed] [Google Scholar]
- 17.Pouille P.-A., Ahmadi P., Brunet A.-C., Farge E., Mechanical signals trigger myosin II redistribution and mesoderm invagination in Drosophila Embryos. Sci. Signal. 2, ra16 (2009). [DOI] [PubMed] [Google Scholar]
- 18.Mitrossilis D., et al. , Mechanotransductive cascade of Myo-II-dependent mesoderm and endoderm invaginations in embryo gastrulation. Nat. Commun. 8, 13883 (2017). [DOI] [PMC free article] [PubMed] [Google Scholar]
- 19.Bailles A., et al. , Genetic induction and mechanochemical propagation of a morphogenetic wave. Nature 572, 467–473 (2019). [DOI] [PMC free article] [PubMed] [Google Scholar]
- 20.Duda M., et al. , Polarization of myosin II refines tissue material properties to buffer mechanical stress. Dev. Cell 48, 245–260.e7 (2019). [DOI] [PMC free article] [PubMed] [Google Scholar]
- 21.Gustafson H. J., Claussen N., De Renzis S., Streichan S. J., Patterned mechanical feedback establishes a global myosin gradient. Nat. Commun. 13, 7050 (2022). [DOI] [PMC free article] [PubMed] [Google Scholar]
- 22.Nagai T., Honda H., A dynamic cell model for the formation of epithelial tissues. Philos. Mag. 81, 699–719 (2009). [Google Scholar]
- 23.Alt S., Ganguly P., Salbreux G., Vertex models: From cell mechanics to tissue morphogenesis. Philos. Trans. R. Soc. Lond. B Biol. Sci. 372, 20150520 (2017). [DOI] [PMC free article] [PubMed] [Google Scholar]
- 24.Odell G. M., Oster G., Alberch P., Burnside B., The mechanical basis of morphogenesis. I. Epithelial folding and invagination. Dev. Biol. 85, 446–462 (1981). [DOI] [PubMed] [Google Scholar]
- 25.Rauzi M., Verant P., Lecuit T., Lenne P.-F., Nature and anisotropy of cortical forces orienting Drosophila tissue morphogenesis. Nat. Cell Biol. 10, 1401–1410 (2008). [DOI] [PubMed] [Google Scholar]
- 26.Landsberg K. P., et al. , Increased cell bond tension governs cell sorting at the Drosophila anteroposterior compartment boundary. Curr. Biol. 19, 1950–1955 (2009). [DOI] [PubMed] [Google Scholar]
- 27.Eiraku M., et al. , Self-organizing optic-cup morphogenesis in three-dimensional culture. Nature 472, 51–56 (2011). [DOI] [PubMed] [Google Scholar]
- 28.Salbreux G., Barthel L. K., Raymond P. A., Lubensky D. K., Coupling mechanical deformations and planar cell polarity to create regular patterns in the zebrafish retina. PLOS Comput. Biol. 8, e1002618 (2012). [DOI] [PMC free article] [PubMed] [Google Scholar]
- 29.Noll N., Mani M., Heemskerk I., Streichan S. J., Shraiman B. I., Active tension network model suggests an exotic mechanical state realized in epithelial tissues. arXiv 13, 1221–1226 (2017). [DOI] [PMC free article] [PubMed] [Google Scholar]
- 30.Bambardekar K., Clément R., Blanc O., Chardès C., Lenne P.-F., Direct laser manipulation reveals the mechanics of cell contacts in vivo. Proc. Natl. Acad. Sci. U.S.A. 112, 1416–1421 (2015), 10.1073/pnas.1418732112. [DOI] [PMC free article] [PubMed] [Google Scholar]
- 31.Damavandi O. K., Lawson-Keister E., Manning M. L., Universal features of rigidity transitions in vertex models for biological tissues (2022), 10.1101/2022.06.01.494406. [DOI]
- 32.Nishizawa K., Chardès C., Clément R., Lenne P.-F., Two-point optical manipulation of cell junctions in the early epithelium of the drosophila embryo. Methods Mol. Biol. 2600, 107–118 (2023). [DOI] [PubMed] [Google Scholar]
- 33.D’Angelo A., Dierkes K., Carolis C., Salbreux G., Solon J., In vivo force application reveals a fast tissue softening and external friction increase during early embryogenesis. Curr. Biol. 29, 1564–1571.e6. 2019). [DOI] [PMC free article] [PubMed] [Google Scholar]
- 34.Salbreux G., Charras G., Paluch E., Actin cortex mechanics and cellular morphogenesis. Trends Cell Biol. 22, 536–545 (2012). [DOI] [PubMed] [Google Scholar]
- 35.Cavanaugh K. E., Staddon M. F., Munro E., Banerjee S., Gardel M. L., RhoA mediates epithelial cell shape changes via mechanosensitive endocytosis. Dev. Cell 52, 152–166.e5 (2020). [DOI] [PMC free article] [PubMed] [Google Scholar]
- 36.Gustafson H. J., Claussen N., Renzis S. D., Streichan S. J. “Patterned mechanical feedback establishes a global myosin gradient” (2021). [DOI] [PMC free article] [PubMed]
- 37.Ferro V., Chuai M., McGloin D., Weijer C. J., Measurement of junctional tension in epithelial cells at the onset of primitive streak formation in the chick embryo via non-destructive optical manipulation. Development 147, dev175109 (2020). [DOI] [PMC free article] [PubMed] [Google Scholar]
- 38.Nestor-Bergmann A., et al. , Adhesion-regulated junction slippage controls cell intercalation dynamics in an apposed-cortex adhesion model. PLOS Comput. Biol. 18, e1009812 (2022). [DOI] [PMC free article] [PubMed] [Google Scholar]
- 39.Vanderleest T. E., et al. , Vertex sliding drives intercalation by radial coupling of adhesion and actomyosin networks during Drosophila germband extension. Elife 7, 2153 (2018). [DOI] [PMC free article] [PubMed] [Google Scholar]
- 40.Sugimura K., Lenne P.-F., Graner F., Measuring forces and stresses in situ in living tissues. Development 143, 186–196 (2016). [DOI] [PubMed] [Google Scholar]
- 41.Roca-Cusachs P., Conte V., Trepat X., Quantifying forces in cell biology. Nat. Cell Biol. 19, 742–751 (2017). [DOI] [PubMed] [Google Scholar]
- 42.Ungai-Salánki R., et al. , A practical review on the measurement tools for cellular adhesion force. Adv. Colloid and Interface Sci. 269, 309–333 (2019). [DOI] [PubMed] [Google Scholar]
- 43.Khalilgharibi N., et al. , Stress relaxation in epithelial monolayers is controlled by the actomyosin cortex. Nat. Physics 15, 839–847 (2019). [DOI] [PMC free article] [PubMed] [Google Scholar]
- 44.Ogita G., et al. , Image-based parameter inference for epithelial mechanics. PLOS Comput. Biol. 18, e1010209 (2022). [DOI] [PMC free article] [PubMed] [Google Scholar]
- 45.Howard J., Mechanics of Motor Proteins and the Cytoskeleton (Sinauer Associates, 2001). [Google Scholar]
- 46.Chanet S., et al. , Actomyosin meshwork mechanosensing enables tissue shape to orient cell force. Nat. Commun. 8, 15014 (2017). [DOI] [PMC free article] [PubMed] [Google Scholar]
- 47.Liu Z., et al. , Mechanical tugging force regulates the size of cell-cell junctions. Proc. Natl. Acad. Sci. U.S.A. 107, 9944–9949 (2010). [DOI] [PMC free article] [PubMed] [Google Scholar]
- 48.Buckley C. D., et al. , The minimal cadherin-catenin complex binds to actin filaments under force. Science 346, 1254211 (2014). [DOI] [PMC free article] [PubMed] [Google Scholar]
- 49.Engl W., Arasi B., Yap L. L., Thiery J. P., Viasnoff V., Actin dynamics modulate mechanosensitive immobilization of E-cadherin at adherens junctions. Nat. Cell Biol. 16, 584–591 (2014). [DOI] [PubMed] [Google Scholar]
- 50.Kale G. R., et al. , Distinct contributions of tensile and shear stress on E-cadherin levels during morphogenesis. Nat. Commun. 9, 5021 (2018). [DOI] [PMC free article] [PubMed] [Google Scholar]
- 51.Collinet C., Rauzi M., Lenne P.-F., Lecuit T., Local and tissue-scale forces drive oriented junction growth during tissue extension. Nat. Cell Biol. 17, 1247–1258 (2015). [DOI] [PubMed] [Google Scholar]
- 52.Blanchard G. B., Murugesu S., Adams R. J., Martinez-Arias A., Gorfinkiel N., Cytoskeletal dynamics and supracellular organisation of cell shape fluctuations during dorsal closure. Development 137, 2743–2752 (2010). [DOI] [PubMed] [Google Scholar]
- 53.Guillot C., Lecuit T., Adhesion disengagement uncouples intrinsic and extrinsic forces to drive cytokinesis in epithelial tissues. Dev. Cell 24, 227–241 (2013). [DOI] [PubMed] [Google Scholar]
- 54.Khaliullin R. N., A positive-feedback-based mechanism for constriction rate acceleration during cytokinesis in Caenorhabditis elegans. eLife 7, e36073 (2018). [DOI] [PMC free article] [PubMed] [Google Scholar]
- 55.Lin S.-Z., Ye S., Xu G.-K., Li B., Feng X.-Q., Dynamic migration modes of collective cells. Biophys. J. 115, 1826–1835 (2018). [DOI] [PMC free article] [PubMed] [Google Scholar]
- 56.Nishizawa K., Lin S.-Z., Chardès C., Rupprecht J.-F., Lenne P.-F., Data for "Two-point optical manipulation reveals mechanosensitive remodeling of cell-cell contacts in vivo". Zenodo. 10.5281/zenodo.68678. Deposited 21 July 2022. [DOI] [PMC free article] [PubMed] [Google Scholar]
Associated Data
This section collects any data citations, data availability statements, or supplementary materials included in this article.
Supplementary Materials
Appendix 01 (PDF)
Diagonal pull manipulation A movie of diagonal pull manipulation, which corresponds to Fig. 1B in the main text (E-cad::GFP). The length change at 60 s post-manipulation is Δl60s = 1.13 μm. Total duration is 70 s (10 times fast forward). Red circles are the two positions of laser focus. Scale bar: 5 μm.
Simulation of diagonal pull manipulation A movie of numerical simulation of a diagonal pull manipulation using model D as described in the main text.
Fast shrinkage in direct push manipulation A movie of direct push manipulation, which corresponds to Fig. 3B (left) in the main text (E-cad::GFP). The junction was shrunk fast (7 s) after applying optical forces. Scale bar: 5 μm.
Slow shrinkage in direct push manipulation A movie of direct push manipulation which is corresponding to Fig. 3B (right) in the main text (E-cad::GFP). The junction was slowly shrunk (109 s) after force application. Scale bar: 5 μm.
direct push manipulation for a Rock-inhibited tissue A movie of direct push manipulation for a Rock-inhibited tissue, which corresponds to Fig. 4A in the main text (E-cad::GFP). The junction was not shrunk and escaped from optical manipulation. Scale bar: 5 μm.
Myosin II response during junction shrinkage A movie of direct push manipulation, which corresponds to Fig. 4C in the main text (Sqh::GFP, inverted contrast). Scale bar: 5 μm.
F-actin response during junction shrinkage A movie of direct push manipulation which is corresponding to Fig. S5 (Utrophin::GFP, inverted contrast). Scale bar: 5 μm.
Data Availability Statement
Images (tiff); excel sheets data have been deposited in Zenodo (https://doi.org/10.5281/zenodo.6867898) (56).