Abstract
Introduction
Interventional radiology (IR) uses minimally invasive procedures to diagnose and treat a wide range of diseases while minimizing morbidity, mortality, and cost (1). Demand for IR services is high, especially among patients experiencing high-level medical complexity. Approximately 8% of adult patients admitted to the hospital in the United States require at least one IR procedure (2). Yet, little remains known about the prevalence of and hospital characteristics associated with IR facility and service availability. In this retrospective cross-sectional study, we use a question introduced in the 2020 American Hospital Association annual survey to investigate the prevalence of and hospital characteristics associated with IR facility and service availability.
Materials and Methods
Our sample included general medical and surgical hospitals that responded to the 2020 American Hospital Association survey, which had a response rate of greater than 75% and provides data on a number of organizational characteristics for more than 6000 hospitals (3). We also acquired county-level population characteristics from the Health Resources & Services Administration’s 2020 Area Health Resource Files.
We excluded hospitals that did not answer the question regarding IR availability. Hospitals were asked to indicate if IR facilities and services were owned or provided by the hospital, by their health system in their local community, through an agreement with another provider in their local community, or not provided. We created a binary variable dichotomizing IR as available if hospitals indicated any choice other than not providing IR.
We used a multivariable logistic regression model to investigate associations between organizational characteristics and IR availability and to determine the percentage of hospitals with IR availability according to county and state and/or territory. Furthermore, we calculated the proportion of individuals living in counties without inpatient IR availability and estimated nearest distances between hospitals with and without IR availability. Statistical tests in RStudio (version 2022.02.3) used robust standard errors with significance defined at two-tailed α = .05, and distances were estimated using the sf package (4).
Results
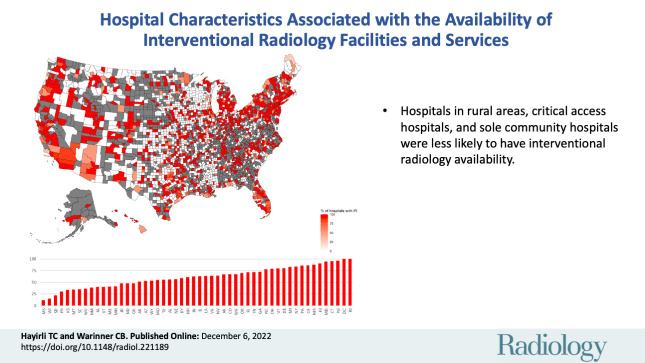
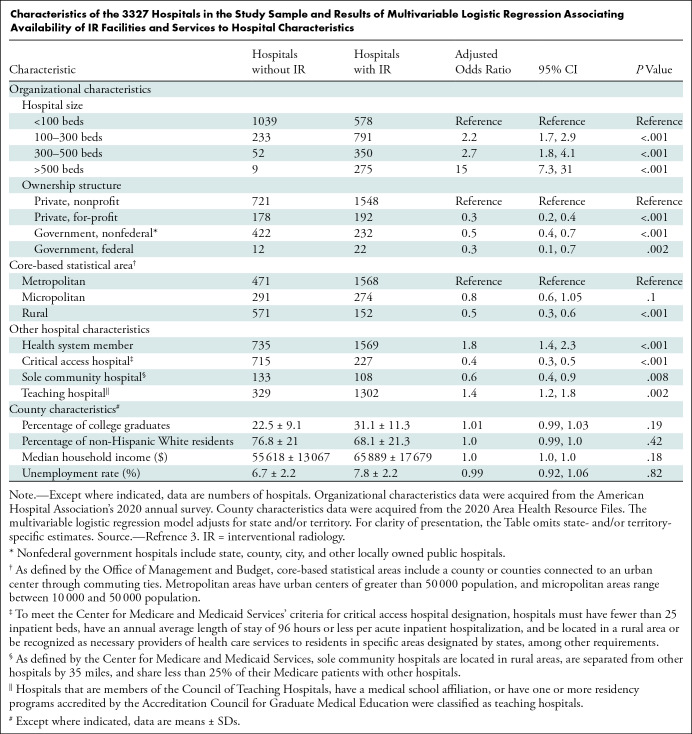
Our sample included 3327 hospitals that indicated whether IR facilities and services were available. Of the 3327 hospitals, 1994 (60%) reported IR as available (Table). After multivariable adjustment, larger, private nonprofit, health system member, and teaching hospitals were more likely to have IR available. Hospitals in rural areas, critical access hospitals, and sole community hospitals were less likely to have IR available. IR availability substantially varied by state and county, with 16 states or territories reporting availability in half or fewer than half of the hospitals (Figure). In 2020, an estimated 10.2% of the population (n = 30 274 146) included in the study sample lived in counties without IR availability. For hospitals without IR, the median distance to the nearest hospital with IR was 25 miles (IQR, 16–37 miles), ranging between less than a mile to 230 miles.
Characteristics of the 3327 Hospitals in the Study Sample and Results of Multivariable Logistic Regression Associating Availability of IR Facilities and Services to Hospital Characteristics
Intensity map shows the percentage of hospitals reporting availability of interventional radiology (IR) facilities and services according to county and state. Counties shaded in gray did not have any hospitals present in the sample. Counties in white had at least one hospital in the sample, none of which reported owning IR facilities and services. Increasing opacity denotes a higher percentage of hospitals reporting the availability of IR facilities and services. The bar graph presents the percentage of hospitals that reported IR as available by state and/or territory.
Discussion
Increasing availability of IR in the areas and types of hospitals identified in our study may improve outcomes for patients served at these hospitals (1). In areas where supply of interventional radiologists remains limited, general radiologists may be able to meet some of this demand (5). Studies have shown that small and rural hospitals have difficulty recruiting and retaining interventional radiologists, which results in unmet demand (6). Nonetheless, the ability of all radiologists to offer inpatient IR services remains limited by IR facility and service availability in hospitals.
A limitation of this study is that we relied on self-reported data and excluded nonreporting hospitals, which may result in biased estimates. Furthermore, the data set did not include information about the type and intensity of IR services provided, complexity of patients cared for, or outcomes that matter to patients. For instance, smaller, rural, or critical access hospitals may be less likely to care for patients requiring complex and intensive IR services. Therefore, future research should address the clinical and operational appropriateness of investing in hospital IR infrastructure.
Footnotes
T.C.H. is supported by training grant award number T32GM144273 from the National Institute of General Medical Sciences. The content is solely the responsibility of the authors and does not necessarily represent the official views of the National Institute of General Medical Sciences or the National Institutes of Health.
Disclosures of conflicts of interest: T.C.H. No relevant relationships. C.B.W. No relevant relationships.
References
- 1. Charalel RA , McGinty G , Brant-Zawadzki M , et al . Interventional radiology delivers high-value health care and is an Imaging 3.0 vanguard . J Am Coll Radiol 2015. ; 12 ( 5 ): 501 – 506 . [DOI] [PubMed] [Google Scholar]
- 2. Shah SS , Tennakoon L , O’Beirne E , Staudenmayer KL , Kothary N . The Economic Footprint of Interventional Radiology in the United States: Implications for Systems Development . J Am Coll Radiol 2021. ; 18 ( 1 Pt A ): 53 – 59 . [DOI] [PubMed] [Google Scholar]
- 3. American Hospital Association . AHA Annual Survey Database . Website. https://www.ahadata.com/aha-annual-survey-database. Accessed August 1, 2022 .
- 4. Pebesma EJ . Simple Features for R: Standardized Support for Spatial Vector Data . R J 2018. ; 10 ( 1 ): 439 – 446 . [Google Scholar]
- 5.Rosenkrantz AB, Friedberg EB, Prologo JD, Everett C, Duszak R Jr. Generalist versus Subspecialist Workforce Characteristics of Invasive Procedures Performed by Radiologists. Radiology 2018; 289(1):140–147. [DOI] [PubMed] [Google Scholar]
- 6. Friedberg EB , Corn D , Prologo JD , et al . Access to Interventional Radiology Services in Small Hospitals and Rural Communities: An ACR Membership Intercommission Survey . J Am Coll Radiol 2019. ; 16 ( 2 ): 185 – 193 . [DOI] [PubMed] [Google Scholar]


