

Abstract
This article reviews the recent progress in optical biosensors that use the label-free detection protocol, in which biomolecules are unlabeled or unmodified, and are detected in their natural forms. In particular, it will focus on the optical biosensors that utilize the refractive index change as the sensing transduction signal. Various optical label-free biosensing platforms will be introduced, including, but not limited to, surface plasmon resonance, interferometers, waveguides, fiber gratings, ring resonators, and photonic crystals. Emphasis will be given to the description of optical structures and their respective sensing mechanisms. Examples of detecting various types of biomolecules will be presented. Wherever possible, the sensing performance of each optical structure will be evaluated and compared in terms of sensitivity and detection limit.
Keywords: Optical biosensor, photonic biosensor, label free, refractive index
1. Introduction
Optical biosensors are a powerful detection and analysis tool that has vast applications in biomedical research, healthcare, pharmaceuticals, environmental monitoring, homeland security, and the battlefield [1]. They are immune to electromagnetic interference, capable of performing remote sensing, and can provide multiplexed detection within a single device. Generally, there are two detection protocols that can be implemented in optical biosensing: fluorescence-based detection and label-free detection. In fluorescence-based detection, either target molecules or biorecognition molecules are labeled with fluorescent tags such as dyes; the intensity of the fluorescence indicates the presence of the target molecules and the interaction strength between target and biorecognition molecules. While fluorescence-based detection is extremely sensitive, with the detection limit down to a single molecule [2], it suffers from laborious labeling processes that may also interfere with the function of a biomolecule. Quantitative analysis is challenging due to the fluorescence signal bias, as the number of fluorophores on each molecule cannot be precisely controlled [3]. In contrast, in label-free detection, target molecules are not labeled or altered, and are detected in their natural forms. This type of detection is relatively easy and cheap to perform, and allows for quantitative and kinetic measurement of molecular interaction. Additionally, as discussed later, some label-free detection mechanisms measure refractive index (RI) change induced by molecular interactions, which is related to the sample concentration or surface density, instead of total sample mass. As a result, the detection signal does not scale down with the sample volume. This characteristic is particularly attractive when ultrasmall (femtoliter to nanoliter) detection volume is involved and is advantageous over fluorescence-based detection whose signal usually depends on the total number of analytes in the detection volume or on the detection surface. Despite all these differences between fluorescence-based and label-free detection, both protocols are being widely used in optical sensors and provide vital and complementary information regarding interactions among biomolecules, which makes optical sensors more versatile than other types of sensing technologies such as surface acoustic wave and quartz crystal microbalance where only label-free detection can be implemented.
In this article, we will discuss label-free optical detection. Under this category, there exist a number of detection methods, including RI detection, optical absorption detection, and Raman spectroscopic detection. RI and absorption are the real and imaginary part of the more general complex RI constant and are related to each other via the Kronig-Kramers relations [4]. Raman detection is unique in that, on one hand, like RI and absorption detection, target molecules are not labeled; on the other hand, emitted Raman light is used for sensing, similar to fluorescence-based detection. Here we will further limit the scope of our article to RI based label-free detection. Optical absorption and Raman-based biosensing can be found elsewhere [5, 6]. Note that some of the RI based sensors can detect both the RI of bulk solution (refractometer) and the RI change induced by molecule binding (biosensor) whereas others can be used only for bulk solution RI detection. We will only discuss those that have been demonstrated for biosensing or have potential capability of biosensing.
For biosensor development, a number of aspects need to be considered, such as transduction signal generation (increase of signal and decrease of noise, etc.), fluidics design (sample injection and drainage, reduction of sample consumption, increase of analyte transport, reduction in detection time, etc.), surface immobilization chemistry (analyte capture efficiency, elimination of non-specific binding, etc.), detection format (direct binding, sandwich-type binding, and competitive binding, etc.), and data analysis (extraction of information regarding analyte concentration, binding kinetics, etc.). In this article, we will focus mainly on the transduction part with the emphasis on optical structures and their interactions with the analyte. Fig. 1 shows the generic configuration of a RI based optical label-free biosensor (label-free sensor, for short). Biorecognition molecules, such as antibodies, oligonucleotides, aptamers, or phages, are immobilized on the sensor surface. Initially, the sensor chamber is filled with the buffer solution. When target analytes bind to the biorecognition molecules, they replace buffer solution molecules within a few nanometers to a few thousands of nanometers from the surface. The target analytes have different RI than that of the buffer solution (for example, the RI for protein is 1.5 vs 1.33 for buffer solution), resulting in a RI change near the sensor surface, which can be detected optically as the sensing transduction signal. In most label-free optical sensors, the sensing light is concentrated near the sensor surface with an evanescent field exponentially decaying into the bulk solution with a characteristic decay length of a few tens to a few hundreds of nanometers. Therefore, it is capable of detecting the RI change induced by the analyte binding that is within the decay length. However, for those analytes that are not captured by the biorecognition molecules, and therefore, are far away from the sensing surface, the sensing signal decreases significantly. As a consequence, this evanescent sensing provides a means to distinguish actual target molecules from those that do not bind to the sensing surface but may still be present in bulk solution.
Figure 1.

Conceptual illustration of an optical label-free biosensor.
In sensor development, sensitivity is an important parameter to evaluate the sensor performance. Sensitivity is the magnitude of sensor transduction signal change in response to the change in analyte. Fundamentally, sensitivity is determined by the strength of light-matter interaction [7–9]. In most evanescent wave based sensors, it is determined by the fraction of light in solution or the light intensity at the sensor surface. Sensor detection limit (DL) is another important parameter to characterize the sensor performance. The DL can be deduced by taking into account the noise in the transduction signal, σ, i.e., the minimum resolvable signal: DL = σ/S, where S is the sensitivity. For an optical RI based label-free sensor, typically there are three ways to specify the DL. First, since all these sensors are sensitive to the RI change in bulk solution, DL in units of RIU (refractive index units) is naturally used to quantify the sensor performance, which enables a rough comparison of the sensing capability among different optical technologies and structures. The second way is to use surface mass density (or total mass) in units of pg/mm2 (or pg), which is what a biosensor actually measures. While experimentally surface mass density is difficult to determine accurately, it reflects the intrinsic detection capability of a sensor and can be used to evaluate or compare the sensor performance. The third way is to use sample concentration (in units of ng/ml or molarity). Sample concentration is quite useful and easy to determine from an experimental point of view, as no detailed information regarding the mass density on the surface is needed. However, the DL defined in this manner depends on the target molecule and its affinity to the biorecognition molecule on the surface, and therefore needs to be specified for each type of a biomolecule. These three DLs are correlated and the detailed relationship among them needs to be studied for each individual optical biosensor.
Improvement in the DL can be accomplished by increasing the sensitivity or reducing the noise level. Sensitivity can be enhanced by increasing the light-matter interaction. In most cases, this amounts to increasing the fraction of light near the sensing surface (examples of which will be shown later). For a label-free optical biosensor, the most commonly seen noise is from temperature fluctuations, which results in a thermo-optic effect (i.e., temperature-dependent RI changes) and a thermo-mechanic effect (e.g., thermal expansion) in both sensor substrate and buffer solution. A general approach to reduce the thermally-induced noise is to implement a temperature control such as a thermoelectric cooler to stabilize temperature. Another method is to balance the thermo-optic and thermo-mechanic effects. For example, most solvents have a negative thermo-optic coefficient, which can be explored to counteract the thermo-optic and thermo-mechanic effects of the solid substrate that have a positive coefficient. With an appropriate design, the temperature-induced noise can be significantly reduced [10–12]. A third method is to employ a reference channel, which is either built into the same sensor or placed on a different sensor nearby, to reduce so-called common-mode noise such as temperature related noise, bulk RI change, and non-specific binding. Through these methods, the sensor performance can be improved significantly.
In the past decade, optical sensor development has been a fascinating and fast-paced area. Various optical structures have been investigated for sensitive label-free detection. This article will review the recent advancement in optical label-free biosensors that are based on RI detection. We will select the following optical structures that we believe represent the majority of research activities in optical label-free sensor development: (1) Surface plasmon resonance based biosensors; (2) Interferometer based biosensors; (3) Optical waveguide based biosensors; (4) Optical ring resonator based biosensors; (5) Optical fiber based biosensors; and (6) Photonic crystal based biosensors. Note that it is common that an optical label-free sensor involves two or more optical structures mentioned above to enhance its sensing performance. The above selection and categorization are solely the authors’ choice. Emphasis will be given to the description of these optical structures and their respective sensing mechanisms. In particular, we will focus on the work done after 2000. Examples of detecting various types of biomolecules will be presented. Wherever possible, the sensing performance of each optical structure will be evaluated and compared in terms of sensitivity and DL (see Table 1).
Table 1 -.
Detection limits of various optical biosensors
| Technology platform | Optical structures | Analyte | Detection limit | Ref. |
|---|---|---|---|---|
|
| ||||
| Surface plasmon resonance | Surface plasmon resonance | Bulk solution | 10−5–10−8 RIU | [36–41] |
| Long range SPR | Bulk solution | 10−7–10−8 RIU | [43,45] | |
| Surface plasmon resonance imaging (SPRI) | Bulk solution | 10−5–10−7 RIU | [53–56] | |
| SPRI | Protein | 1 nM | [58] | |
| Optical heterodyne SPR | Protein | 0.2 nM | [59] | |
| Phase sensitive SPR | Protein | 1.3 nM | [60] | |
| Wavelength modulated SPR | DNA | 10 pM (Note 1) | [63] | |
| SPRI | DNA and RNA | 10 nM | [64] | |
| Flow injection SPR | DNA | 54 fM, 1.38 fM (Note 1) | [65,66] | |
| Angle modulated SPR | Protein (PSA) | 0.15 ng mL−1 (Note 1) | [67] | |
| SPR | Protein (CA19–9) | 66.7 unit mL−1 | [69] | |
| SPR | Protein (α-fetoprotein) | 50 ng mL−1 | [70] | |
| Prism-based SPR | Bacteria (E. coli) | 106 cfu mL−1 | [74] | |
| Salmonella yphimurium | 100 cfu mL−1 | [75] | ||
| BIAcore 2000 SPR | Bacteria | 25 cfu mL−1 | [76] | |
| Interferometer | Mach-Zehnder interferometer | Bulk solution | 10−7 RIU | [83] |
| Protein | 20 pg mm−2 | [82] | ||
| Young’s interferometer | Bulk solution | ~1 × 10⁻⁷ RIU | [89,90] | |
| Virus | 1000 particles mL−1 | [91] | ||
| Hartman interferometer | DNA | 4 ng mL−1 | [95] | |
| Protein | 5 ng mL−1, 0.1 ng mL−1 (Note 1) |
[95,96] | ||
| Virus | 107 pfu mL−1 | [95] | ||
| Bacteria | 5 × 10⁸ cfu mL−1, 5 × 10⁵ cfu mL−1 (Note 1) | [95] | ||
| Backscattering interferometer | ||||
| Porous silicon | DNA | 2 pM | [98] | |
| BioCD | Protein | 0.1 ng mL−1 | [100] | |
| Microchannel backscattering | Bulk solution | 7 × 10⁻⁹ RIU | [105] | |
| Protein | femto-mole (Note 2) | [103] | ||
| Protein | picomolar (Note 3) | [106] | ||
| Waveguide | Resonant mirror | Protein | ~0.1 pg mm−2 | [113] |
| Cell | 106 cells mL−1 | [108] | ||
| Metal-clad waveguide | Bacterial spore | ~105 spores mL−1 | [119] | |
| Cell | ~10 cells mm−2 (Note 2) | [121] | ||
| Reverse symmetry waveguide | Cell | 60 cells mm−2 (Note 2) | [123] | |
| Symmetrical metal-clad waveguide | Bulk solution | 2 × 10⁻⁷ RIU | [129] | |
| Ring resonator | Ring on a chip | Bulk solution | 10−4 to 10−7 RIU | [168,171,185,189] |
| DNA | ~100 nM | [186] | ||
| Protein | 20–250 pg mm−2, 0.1 nM | [168,173,190] | ||
| Bacteria | 105 cfu mL−1 | [186] | ||
| Dielectric microsphere | Bulk solution | 10−7 RIU | [144] | |
| DNA | 1 pg mm−2 | [134] | ||
| Protein | 10 pg mL−1 (trypsin), 1 unit mL−1 (thrombin) | [145,151] | ||
| Virus | ~1 pg mm−2 | [143] | ||
| Bacteria | 100 cfu mm−2 (Note 2) | [140] | ||
| Capillary opto-fluidic ring | Bulk solution | 10−6–10−7 RIU | [152] | |
| DNA | 4 pg mm−2, 10 pM | [163] | ||
| Protein | ~1 pg mm−2, 3 pM (Note 2) | [157] | ||
| Virus | 1000 particles mL−1 | [164] | ||
| Optical fiber | Fiber Bragg grating | Bulk solution | ~10−6 RIU | [204–209] |
| DNA | 0.7 μg mL−1, 0.1 μM | [209] | ||
| Long-period grating | Bulk solution | 10−4 RIU | [219] | |
| Protein | 2 μg mL−1 | [218] | ||
| Nanofiber | Bulk solution | 10−7 RIU | [223] | |
| Fiber coupler | Bulk solution | 4 × 10⁻⁶ RIU | [227] | |
| Protein | 0.5 μg mL−1 | [227] | ||
| Fiber Fabry-Perot cavity | Bulk solution | 10−5 RIU | [207,231] | |
| DNA | 76 μM, 1.7 ng | [229] | ||
| Protein | 25 μg mL−1 | [228] | ||
| Photonic crystal | 2-DPC | Bulk solution | 10−5 RIU | [240,241] |
| Protein | 0.4 pg mm−2 (Notes 2 and 4) | [240,241] | ||
| 2-D PC microcavity | Bulk solution | ~10−3 RIU | [234,235] | |
| Protein | 1 fg | [237] | ||
| PC waveguide | Protein | 0.15 μM | [239] | |
| 1-D PC microcavity array | Bulk solution | 7 × 10⁻⁵ RIU | [246] | |
| PCF | Bulk solution | 10−4RIU | [219] | |
Notes: (1) With gold nanoparticle amplification. (2) Adsorption result. (3) Binding takes place in free solution rather than on a solid substrate. (4) Results obtained after solution containing protein is dried.
2. Optical label-free biosensor structures
2.1. Surface plasmon resonance based biosensors
Surface plasmon resonance (SPR) was first demonstrated for biosensing in 1983 by Liedberg et al. [13]. Since then it has been extensively explored and has gradually become a very powerful label-free tool to study the interactions between the target and biorecognition molecules. The principle, development, and applications of SPR biosensors have been well described in several excellent review papers [14–17].
A surface plasmon wave (SPW) is a charge density oscillation that occurs at the interface of two media with dielectric constants of opposite signs, such as a metal (gold or silver) and a dielectric. There are four basic methods to excite the SPR, as shown in Fig. 2: prism coupling [18], waveguide coupling [19], fiber optic coupling [20], and grating coupling [21, 22]. In the prism coupling configuration (Fig. 2(A)), the incident light is totally reflected at the prism-metal interface and generates an evanescent field penetrating into the metal layer. At the resonant angle or resonant wavelength, the propagation constant of the evanescent field matches that of the SPW as described in Eq. (1), and as a result, the photon will be coupled into the SPW.
| (1) |
where is the incident wavelength, is the prism refractive index, is the incident angel and is the propagation constant of the SPW. Prism coupling is the most convenient SPR configuration and generally has the best sensing DL; however, the prism is bulky and it is difficult to integrate. Waveguide coupling offers a good alternative to the prism; it is robust and easy to integrate with other optical and electrical components. The light propagates in a waveguide through total internal reflection and generates an evanescent field at the waveguide-metal interface, which excites the SPW in the same way as in the prism configuration (Fig. 2(B)). Optical fibers are also used to excite the SPW in an easy and flexible way. As shown in Fig. 2(C), a small portion of the fiber is removed and then coated with a layer of metal film. Several different fiber optic SPR biosensor configurations have been developed based on side polished single-mode fiber (Fig. 2(D)) [23, 24], side-polished multimode fiber [25], polarization maintaining fiber [26], and D-shaped fiber [27]. Additionally, the SPW can be excited by grating coupling (Fig. 2(E)), which can be mass produced with low lost. In this way, a light wave is incident on a metallic grating. If the momentum of diffracted light parallel to the grating surface is the same as the propagation constant of the surface plasmon, the light will be coupled into the SPW as described in Eq. (2):
| (2) |
where is the dielectric medium RI, m is an integer representing the diffraction order and Λ is the grating period. However, with the grating coupling, the incident light directly illuminates the metal surface, therefore it requires the sample fluid and microfluidics to be optically transparent. The detection of the SPR change induced by the binding of target molecules to the sensing surface can be accomplished by monitoring the resonant angle [28], resonant wavelength [29] or resonant intensity change [30]. Recently, several groups also explored the detection of the changes in phase [31–33] or polarization [34].
Figure 2.

Various SPR sensor configurations. (A) Prism coupling. (B) Waveguide coupling. (C) Optical fiber coupling. (D) Side polished fiber coupling. (E) Grating coupling. (F) Long-range and short-range surface plasmon (LRSP and SRSP). Reprinted with permission from [15, 20, 24, 44].
The commercialized SPR sensors, as exemplified by the instrument from Biacore [35], are typically based on prism coupling and have a DL between 1×10⁻⁶ to 1×10⁻⁷ RIU and a mass surface density DL around 1 pg/mm2. An order of magnitude improvement in DL, i.e., 10−8 RIU, was achieved using a bicell photodetector instead of an array of photodetectors that is commonly employed in an SPR sensor [36]. For optical fiber coupled SPR biosensor, typically the DL is around 10−5 to 10−6 RIU [27, 37]. A better DL of 5–7×10⁻⁷ RIU has been achieved by multiple peak SPR fiber optic sensors [38] and by spectral interrogation in a side-polished single mode fiber using depolarized light [24]. In waveguide based SPR biosensors, the DL is usually from 10−5 to 10−6 RIU [29, 39]. For the grating coupling configuration, the DL ranges from 10−5 to 10−6 RIU [40, 41]. Besides the optical structures, detection methods also influence the detection limit. Phase detection has the best DL over other detection methods and it is typically about 10−7 RIU [33, 42].
Although these basic SPR structures have good DL that can satisfy most research requirements, there still exist two potential problems that will limit their applications in some fields. First, the evanescent field in those basic SPR structures only penetrates into the surrounding medium for about 100 nm, and thus it is very difficult to detect the large target molecules like cells and bacteria. Second, there is only one SPW to detect the RI change. It is impossible to differentiate the surface RI change and the bulk solution RI change. As a result, the sensing performance is deteriorated when detecting the target molecules in a complex solution such as blood samples. To overcome those two problems, a new optical structure has been developed, as illustrated in Fig. 2(F), where the metal layer is sandwiched by two dielectric layers with a similar RI [43–47]. Two new surface plasmon modes called long range surface plasmon (LRSP) and short range surface plasmon (SRSP) form, which are bound to both metal-dielectric interfaces. Using this dual mode of the LRSP and SRSP, the sensor is able to differentiate the background RI change and surface bound RI change [46]. Furthermore, the LRSP has a longer penetration length in the surrounding medium, making it suitable for cell and bacterium detection. The LRSP also exhibits an excellent DL as low as 2×10⁻⁷ to 2×10⁻⁸ RIU [43, 45].
There are many ultra sensitive SPR biosensors but most of them only can detect one analyte. For practical applications, there is an urgent need for the development of SPR biosensors capable of multi-analyte detection. SPR sensors based on multichannel structures [48, 49] could provide a method for detecting multiple analytes simultaneously, but they are not suitable for high throughput detection. The SPR imaging (SPRI) technique is so far the most promising tool for high throughput detection with a DL of approximately 10−5 RIU [50–53]. The typical SPRI sensor is based on prism coupling, in which monochromatic incident light is expanded, passes through a prism and strikes the interface of the thin film and a prism at the coupling angle, exciting a broad area of the sensing surface. The reflected light is imaged on a CCD camera. Similar to the micro-array technique, in SPRI the sensing chip is divided into many small sensing spots for detecting different analytes. A few other measurement methodologies were also developed for SPRI, such as dual wavelength SPRI system [54] and polarization contrast imaging [55] with DLs of 2×10⁻⁶ RIU respectively. Recently, 5×10⁻⁷ RIU was achieved with a compact SPRI system [56].
In the past few years, SPR and SPRI have been applied in molecular biology for the detection of proteins with a DL ranging from picomolar to nanomolar [56–61], and detection of DNA molecules [62–65] with the DL as low as 54 fM with a flow injection device [65] and as low as 1.38 fM when aided by signal amplification through gold nanoparticles [66]. SPR also provides sensitive and fast detection of cancer biomarkers [67–70] and other biomarkers [71–73] with the DL at ng/mL level for medical diagnosis. Additionally, SPR biosensors have been used for bacterial detection for environmental monitoring, food safety and homeland security with a DL ranging from 25 – 106 cfu/mL [74–76].
2.2. Interferometer based biosensors
2.2.1. Mach-Zehnder Interferometer
The operation principle of the integrated Mach-Zehnder interferometer (MZI) is illustrated in Fig. 3(A). Coherent, single frequency, single polarization light from a laser enters the single mode input waveguide and is split equally at a Y-junction. One branch has a window over the top of it allowing the evanescent field of that branch to interact with the sample while the reference arm is protected from the sample with a thick cladding layer. The two branches recombine at the output, resulting in interference, and a photodetector measures the intensity. Generally, the waveguide structure must be single polarization and single mode so that multimodal and cross-polarization interference do not appear at the output. A change in the RI at the surface of the sensor arm results in an optical phase change on the sensing arm and a subsequent change in the light intensity measured at the photodetector, as described by: , where , and are the RI change, the amplitude of wave vector, and the length of the sensing region, respectively. Typically, increasing the length of the sensing window increases the sensing signal. However, note that because of the cosine-dependent intensity function, the signal change is not easily resolvable near the maximum and minimum of the cosine function. This is one penalty of using the MZI device as a sensor as compared to sensors that have a linear intensity response.
Figure 3.
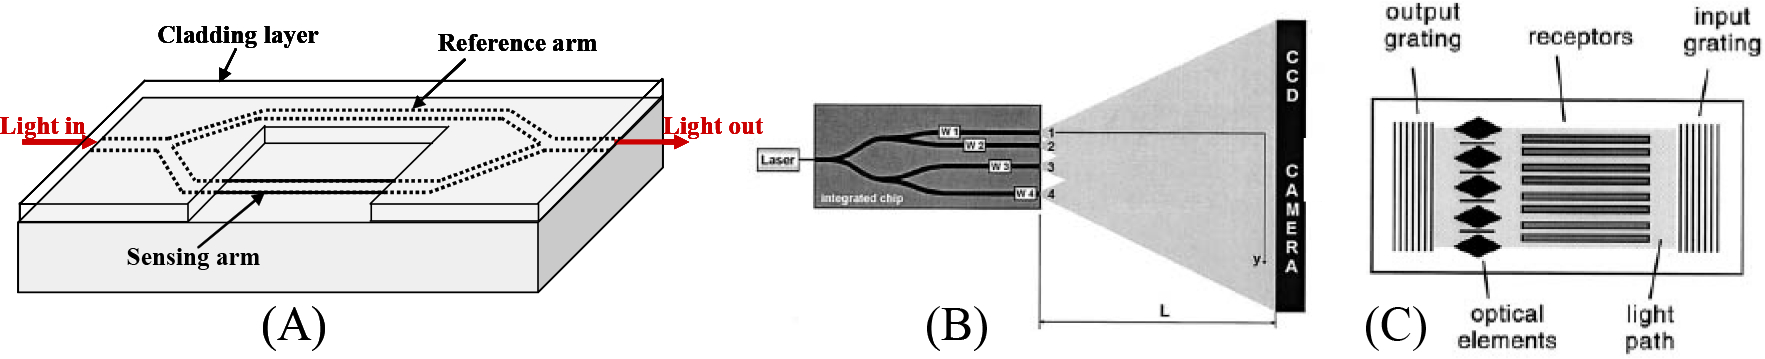
(A) Mach-Zehnder interferometer sensor. (B) Multichannel Young’s interferometer sensor. (C) Hartman interferometer sensor. Reprinted with permission from [90, 95].
The first biosensing demonstration using an integrated MZI was performed by Heideman et al. in 1993 [77]. The authors created a MZI on a silicon substrate with a Si3N4 waveguide and etched gratings for input/output coupling. The RI DL was experimentally determined to be around 5 × 10⁻⁶ RIU. An antibody for human chorionic gonadotropin (hCG) was adsorbed onto one channel, and hCG was then specifically detected. The experimental DL was 50 pM hCG. Nearly at the same time, Ingenhoff, et al., used in integrated MZI for the detection of monolayer formations of adsorbed biomolecules [78], and shortly thereafter, the same group made incremental improvements by optimizing the waveguide materials [79].
Waveguide technologies improved in the years that followed these pioneering demonstrations. Brosinger et al. [80] and Schipper et al. [81] utilized a SiON or Si3N4 waveguide with a ribbed structure on a silicon substrate. The measured RI DL was around 10−5 RIU, and the authors demonstrated sensitive detection of an IgG molecular monolayer [80]. Additionally, this work demonstrated that in principle, the reference arm of the MZI can be used to cancel out common mode noise terms, such as temperature modulations, RI changes, and non-specific adsorption. A fluidic system was constructed to allow different surface treatments on each arm so that the sensing arm was prepared for specific detection while the reference arm was prepared to cancel non-specific binding. However, it should be noted that because the surfaces of the sensing and reference arms are biologically different, it is expected that the non-specific adsorption onto each surface will be different. A follow-up to this work was later published by Weisser et al. [82], in which the authors claim detection of 1% of a streptavidin monolayer on the sensing surface using the same MZI design and a biotin biorecognition layer. This translates to a protein DL of 20 pg/mm2.
A number of engineering enhancements for integrated MZI sensors were incorporated in the work by Heideman and Lambeck [83]. As the authors demonstrated, applying a properly designed constant AC signal to the phase modulator reveals the quadrature points of the MZI’s sinusoidal output intensity response through a simple demodulation circuit. Recall that one drawback of the MZI structure is that the sinusoidal-based response results in a sensitivity loss at the maxima and minima of the cosine term. However, the quadrature points move continuously linearly during a sensing event, and thus tracking the quadrature points instead of the output intensity eliminates the problem of decreasing sensitivity at the maximum and minimum of the MZI sinusoidal response. With this and other engineering improvements, the authors showed a RI DL of 10−7 RIU. Despite the excellent bulk RI detection capability, to date, no actual biosensing has been demonstrated yet.
Another important design improvement is to enable larger waveguide core dimensions without sacrificing the single mode behavior or the sensitivity. The previously discussed waveguide core dimensions are on the order of 100 nm, which causes high loss at the input coupling interface. One well-studied waveguide architecture that can achieve single mode behavior with micrometer dimensions is the antiresonant reflective optical waveguide (ARROW). Furthermore, this structure uses a reflective cladding of alternating layers of high and low refractive indices to push more light above the surface of the waveguide, and thus the sensitivity is not sacrificed with the larger dimensions. The ARROW was first proposed in an integrated MZI by Jimenez et al. in 1996 [84], and was later implemented for biosensing by the same group [85]. Also, a unique ARROW-based MZI structure has been proposed by Hsu and Huang that utilizes a vertically stacked dual-core waveguide structure [86].
Further advancements to the integrated MZI functionality have been incorporated by Blanco et al. [87]. In this work, integrated MZI devices were fabricated on a wafer. Then, a microfluidic network was constructed on top of the wafer using CMOS compatible multilevel polymer assembly technology. This network effectively interfaces with external tubing and precisely delivers the sample to the sensing area. While this was the first demonstration of the integration of microfluidics onto the wafer, it is expected that this is ultimately required for the effective development of waveguide-based interferometry biosensors.
2.2.2. Young’s Interferometer
In parallel to the development of integrated MZI sensors, another interferometric technique based on an integrated Young’s Interferometer (YI) has been used in a similar way for biosensing. In a YI, the coherent, single mode, single polarization light at the input is split into a reference arm and a sensing arm. Instead of recombining the arms as in the MZI, the optical output of the two arms combines to form interference fringes on a detector screen, such as a CCD. The spatial intensity distribution, , along the detector screen, , is given by [88]:
| (3) |
where is the wavelength in vacuum, is the effective RI, represents a phase shift due to a RI change, and and are the distance between the two arms and the distance between the YI output and the screen, respectively. The equation shows that a phase change on the reference arm causes a shift in the position of the interference fringes, which can be analyzed quickly with a fast Fourier transform of the spatial intensity [88].
The first demonstration of an integrated YI for sensing was demonstrated by Brandenburg and Henninger in 1994 [88]. A follow-up to this work using the same design concept yielded a RI DL of 10−7 RIU [89]. This is equivalent to the highest performance from the MZI, as expected, as the sensing mechanisms are equivalent in the two interferometer designs. An enhancement to the basic design of the integrated YI was proposed by Ymeti et al. a few years later to enable multiplexed sensing [90]. As shown in Fig. 3(B), the design uses four waveguide branches, three for sensing and one for reference. The spacing between each sensing arm and the reference arm is unique and does not share any harmonics. It can be deduced from Eq. (3) that the frequency of the sinusoidal spatial intensity is dependent upon the spacing between the reference and sensing channel, and thus three unique spatial frequencies exist that can be resolved with Fourier analysis [90]. Within this work, the authors also optimized the design geometry and the signal processing techniques in an effort to minimize phase noise and inter-channel crosstalk. Ultimately, it was concluded that the RI DL of this device is slightly better than 10−7 RIU. These authors later demonstrated biosensing with this YI chip design [91]. Specific detection of herpes simplex virus type 1 (HSV-1) was performed using an anti-HSV-1 antibody immobilized on the interferometer surface, showing that 105 particles/mL in serum could be detected within only 30 minutes and that a DL of 103 particles/mL in phosphate buffered saline could be achieved.
A commercial product is currently available based on the integrated YI technique from Fairfield Scientific [92]. The product, called AnaLight ®, uses a polarization controller so that the two polarizations of light can sequentially probe the sample. This additional information enables the simultaneous measurement of analyte deposition quantification and RI measurement. Experimental demonstrations of the analysis of biotin/streptavidin binding utilizing the AnaLight have been published [93, 94].
2.2.3. Hartman Interferometer
A third and very similar interferometry configuration that has been used for biosensing is the Hartman interferometer (HI). In this configuration, functionalization molecules are patterned in strips on top of a planar waveguide, as shown in Fig. 3(C) [95]. Light is coupled into and out of the planar waveguide using gratings. Integrated optics is placed near the output of the chip to create interference between pairs of functionalized strips. In the first biosensing demonstration with the device, human chorionic gonadotropin (hCG) was detected down to concentrations of 5 ng/mL [95]. Also, detection down to 4 ng/mL of a 44-base-pair oligonucleotide with a 19-base-pair target sequence was demonstrated. The authors further demonstrated detection of Influenza A and Salmonella. In follow-up work, the authors performed detection of hCG, first in serum [96], and then in whole blood [97]. To reduce the non-specific adsorption signal, the authors used the reference channel for subtraction (an antibody that is not specific to hCG was immobilized onto the reference arm) and using biotin-(poly)ethylene glycol (PEG) as a blocking agent. Also, the authors were able to demonstrate detection of 0.1 ng/mL by using an amplification method. After the sample was run, antibodies targeting hCG labeled with metal nanoparticles were allowed to bind with the captured hCG [96, 97]. This caused an additional phase shift at the output that is larger than the phase shift due to the hCG molecules alone.
2.2.4. Backscattering Interferometry
Although the three interferometry techniques described thus far have differences in their design, the principle of detection is quite the same. A guided wave undergoes a phase change as its evanescent field interacts with the sample. Thus, all three designs ultimately have similar performance, as well as similar design constraints. Most notably, to produce a sensitive device, a long interaction length between guided wave and sample is necessary. As a result, the size of these interferometric structures is often measured in centimeters.
A separate class of interferometry-based biosensors exist called backscattering interferometry (BI). Some (but not all) BI implementations have achieved comparable performance as the previously described interferometry techniques while using a much smaller sensing area. Typically, a BI system consists of a coherent single wavelength laser focused onto a small sensing area and a detector to analyze the reflected intensity. Sub-wavelength structures on the sensing surface result in interference at the detector. Capture of proteins onto a selected part of the illuminated structure change the intensity on the detector due to a phase change of the reflection from this surface. This produces a sensing transduction signal.
This technique was used by Lin et al., who demonstrated one of the first implementations of this concept using a porous silicon sensor surface [98]. The top and bottom surfaces of the porous sensor serve as the reflecting surfaces. When analytes are specifically captured by biorecognition molecules immobilized inside the pores, a shift in the interference signal is observed. The authors show detection of 2 pM target DNA using this sensor.
A second use of the BI technique is the biological compact disk (BioCD) immunoassay [99, 100]. In this work, a reflective disk is patterned with biorecognition molecules, such as antibodies. The disk is then “read” by spinning it while a focused laser beam reflects off the disk surface and the antibody spots. The edges of the biomolecular spots result in an interference signal. The disk is then incubated with the sample. If the biorecognition spots capture proteins, the interference signal changes when the disk is read again after drying. The authors have demonstrated detection of 100 pg/mL of protein [100]. This technique may provide the capability for ultra-fast readout of thousands of sensors on the CD. The BioCD has been commercialized by QuadraSpec [101].
In a related technique, Chang et al. performed BI detection by patterning a reflective surface with strips of biorecognition molecules in a grating array which then capture polystyrene beads coated with the ligand [102]. In this work, the authors created strips of biotinylated BSA and then incubated the sensor surface in a solution with streptavidin coated beads. The resulting interference signal has the potential to provide a quantitative biological assay. The use of beads may serve as an excellent amplification mechanism.
In another use of backscattering interferometry, Markov et al. utilized the interference fringe pattern obtained from illuminating a simple, rectangular microfluidic channel from the top with a laser [103]. The walls of the microfluidic channel can be patterned with biorecognition molecules and then used to capture analytes from the sample. The authors showed that as target analytes were captured by the channel, the interference signal measured by an avalanche photodiode produced a sensing signal. As a biodetection example, the binding of IgG molecules by immobilized Protein A was demonstrated. Importantly, this design enables simple microfluidics with small sample volume. This group also demonstrated similar biosensing results using a capillary microfluidic channel [104]. This system had previously been shown to have a RI DL of 10−9 RIU when used in a dual capillary configuration with a reference channel [105]. Later, returning to the rectangular microfluidic channel concept, this group demonstrated the use of BI for detection of biomolecular interactions in free solution, as opposed to surface-based interactions only [106]. While the picomolar DL is similar to other surface-sensing techniques, this is the first known report of label-free detection of biomolecular interactions in free solution.
2.3. Optical waveguide based biosensors
In the previous section, we have discussed interferometer based biosensors, some of which employ waveguide structures as the sensing element. In this section, we will introduce a few new waveguide structures that have unique designs and distinctive characteristics in comparison with the conventional waveguides.
The resonant mirror (RM) design has been used as a biosensor sensor for over a decade [107–112]. In a resonant mirror, the mode is leaky at the waveguide-substrate boundary, in contrast to a conventional waveguide in which total internal reflection occurs at both waveguide-solution and waveguide-substrate boundaries. Fig. 4(B) shows the structure of the RM, where the high RI waveguide and the high RI substrate (or prism) are separated by a metal layer or a low loss and low RI dielectric layer. When the incident light is at the resonant angle, the light can be coupled strongly into the high-index waveguide layer and has a strong reflection at the output side of the RM. This resonant light travels along in the waveguide and has the evanescent field outside the waveguide. As a result, the resonant angle is sensitive to the RI change near the waveguide, which can be detected at the output side of the RM. Note that, unlike SPR, which operates only at the TM mode, RM supports both TE and TM modes, which have different resonant angles [107]. The RM based biosensor is commercialized by NeoSensors with a DL on the order of 0.1 pg/mm2 [113].
Figure 4.

Comparison of various waveguide structures.
Metal clad waveguide (MCWG) or metal clad leaky waveguide (MCLW) is another optical structure that involves a metal layer [114–121]. The structure of the MCWG is schematically shown in Fig. 4(C). Note that in the MCWG, the light is guided in a low RI layer and the metal layer works as a spacer to separate the low RI waveguide and the high RI substrate, and to push more light into the solution layer to increase the light-matter interaction and hence the sensitivity. There are two types of MCWGs, dip type and peak type [118]. When the imaginary part of the metal dielectric constant is small and the metal thickness is on the order of tens of nanometers, the MCWG is operated as a dip type, in which the reflection features a characteristic resonant dip. On the other hand, when the imaginary part of metal dielectric constant is high and the metal thickness is thin (only a few nanometers), the MCWG is operated as a peak type and a characteristic peak emerges in the reflection. Both the dip and peak can be used as a sensing signal in which the response is an angular shift due to changes of the RI of the solution layer. Although both dip and peak types of the MCWG have a lower sensitivity than SPR, they have a much narrower dip or peak, making them a competitive sensing technology to SPR [118].
The MCWG has much longer penetration depth than RM, SPR, and regular waveguide [115]. A comparison between RM and the MCWG shows the MCWG is three times more sensitive to the bulk RI change in the solution, indicating a much larger fraction of light in the evanescent field [116, 120]. Therefore, the MCWG is very suitable for detection of cells that are typically a few microns in size [115, 116, 119, 121]. Non-specific detection of cells has been carried out on both dip and peak type MCWG with a DL of 8–9 cells/mm2 [121]. A DL of 8×10⁴ spores/mL for Bacillus subtilis var. niger bacterial spores was also demonstrated in a peak-type waveguide sensor [119]. Lipid bilayer and interactions between protein and a lipid bilayer were studied with the dip type MCWG [114].
Reverse symmetry waveguides bear the similar design motivation, which is to push more light into solution to increase the light interaction with large biomolecules such as cells [122–125]. In the conventional waveguide geometry, the lower cladding layer has a RI higher than that of solution, which usually consists of water and has a RI of 1.33. Therefore, the waveguide mode has a light intensity more concentrated toward the lower cladding layer, thus leaving less light to interact with the analytes near to sensing surface. As shown in Fig. 4(D), in a reverse symmetry waveguide, nanoporous silica is used as a lower cladding layer. Nanoporous silica has a RI of 1.193, much lower than that of water. As a result, more light can be concentrated near the sensing surface to enhance the sensor sensitivity. Non-specific detection of E. Coli was demonstrated with reverse symmetry waveguides. The DL is estimated to be 60 cells/mm2 [123], a few hundreds times better than that in the RM [108].
Recently, a symmetrical metal-clad waveguide was also investigated theoretically and experimentally [126–129] (Fig. 4(E)). It is shown that ultrahigh-order modes can be excited through free space coupling. Those modes are sensitive to the RI and thickness change in the waveguide and can potentially be used for biosensing. Additionally, a large Goos–Hänchen shift was observed for the light incident upon the upper metal clad, which was recently employed for RI detection when the waveguide was replaced by a sample cell [129]. A DL of 2×10⁻⁷ RIU was reported. For the future work, it will be interesting to see its applications in biosensing.
2.4. Optical ring resonator based biosensors
Optical microring resonators are an emerging sensing technology that has recently been under intensive investigation [7, 10, 12, 130–190]. In a ring resonator, the light propagates in the form of whispering gallery modes (WGMs) or circulating waveguide modes [191–193], which result from total internal reflection of light along the curved boundary between the high and low refractive index (RI) media. Since the WGM and circulating waveguide mode can be calculated using Mie theory [191–193], for simplicity, we will use the term “WGM” to describe both types of modes. The WGM has the evanescent field present at the ring resonator surface and responds to the binding of biomolecules. In contrast to the straight waveguide, the effective light-analyte interaction length of a ring resonator sensor is no longer determined by the sensor’s physical size, but rather by the number of revolutions of the light supported by the resonator, which is characterized by the resonator quality factor, or the Q-factor. The effective length, , is related to the Q-factor by [194]: , where is the resonant wavelength and is the RI of the ring resonator. For example, for a ring resonator with a Q-factor of 106, n = 1.45, and nm, can be as long as 17 cm. Consequently, despite its small physical size, a ring resonator can deliver sensing performance similar or superior to a waveguide while using orders of magnitude less surface area and sample volume. Furthermore, due to the small size of ring resonators, high density sensor integration becomes possible.
The WGM spectral position, i.e., resonant wavelength, , is related to the RI through the resonant condition [191]: , where is the ring outer radius, is the effective RI experienced by the WGM, and is an integer. changes when the RI near the ring resonator surface is modified due to the capture of target molecules on the surface, which in turn leads to a shift in the WGM spectral position. Thus, by directly or indirectly monitoring the WGM spectral shift, it is possible to obtain both quantitative and kinetic information about the binding of molecules near the surface.
Ring resonators biosensors have so far been implemented in three major configurations (see Fig. 5): (1) Microfabricated ring-, disk-, or microtoroid-shaped resonators on a chip (Fig. 5(A)–(D)) [12, 165–168, 171–173, 175–181, 183–186, 189]; (2) stand-alone dielectric microspheres [130–147, 149, 151, 154, 169, 174, 182] (Fig. 5(E)); and (3) capillary based opto-fluidic ring resonators (OFRR) (Fig. 5(F)) [7, 10, 148, 150, 152–164, 170, 187]. The advantages of the chip-based ring resonator include potential of mass production and optoelectronic integration capabilities. However, except for a microtoroid, which has Q-factors larger than 108 after it undergoes thermal reflow to smoothen the resonator surface, they usually have relatively low Q-factors (typically 104 in water) due mainly to surface roughness [168, 171, 185]. Moreover, the fluidics needs to be fabricated separately and then mounted onto the ring resonator sensors through multiple complicated steps [185, 195], which may present many design challenges. In contrast, microsphere ring resonators possess much higher Q-factors (> 106) owing to the geometry and the extremely low surface roughness [194]. Microspheres of a few tens to a few hundred micrometers in diameter can easily be made by heating the end of an optical fiber by either an acetylene/hydrogen-oxygen torch or a CO2 laser. However, the major disadvantage of microsphere ring resonators is lack of mass production capability and difficulties in integration with fluidics, which requires a design of an external structure of channels and chambers [143]. The third design, the OFRR, has been recently introduced; it is based on a thin-walled capillary with a diameter of 50 – 200 μm and a wall thickness of a few micrometers [148, 153] and can be made by pulling a glass preform under heat [148]. The OFRR can support high Q-factor (~ 106) WGMs in its circular cross section that have the evanescent field inside the core to interact with the analytes flowing through the capillary, thus achieving dual use of the capillary as the sensor and the microfluidic channel.
Figure 5.

Various ring resonator biosensors. (A) Silicon-on-insulator ring resonator. (B) Polymer ring resonator. (C) Microtoroid. (D) Glass ring resonator array. (E) Microsphere. (F) Capillary based opto-fluidic ring resonator (OFRR). Reprinted with permission from [134, 161, 165, 185, 186].
Chip-based ring resonator sensors
Theoretically, in the limit of shot noise, the DL for RI is estimated to be on the order of 10−9 RIU [177]. However, the experimental results are still a few orders of magnitude away from it. A bulk RI sensitivity of 140 nm/RIU was achieved with a glass based ring resonator of 60 μm in radius with Q ~ 12,000 [171]. The DL was calculated to be 1.8×10⁻⁵ RIU [171]. Similarly, the DL of a polymer ring of 45 μm in radius with Q = 20,000 was estimated to be 5 × 10⁻⁵ RIU [168]. However, a better DL of 10−7 RIU was achieved in the same system by monitoring the intensity variation [168]. The DL for protein molecules is estimated to be 250 pg/mm2 [168].
In another work, a silicon-on-insulator (SOI) ring resonator on an area below 100 μm2 showed capability of detecting bulk RI change at a sensitivity of 70 nm/RIU with a DL of 7×10⁻⁵ RIU [185]. A DL of 10 ng/ml of avidin was reported on this device, which corresponds to only 1 fg molecular mass on the sensor due to the small size of the resonator [185]. Similar DL (0.1 nM, 6.8 ng/ml for avidin) was also achieved with a 2-mm diameter SixNy /SiO2 ring resonator [173]. DNA and bacteria detection were also demonstrated with the DL for E. Coli of 105 cfu/ml [186].
Recently, the slot-waveguide based ring resonator was developed, which has a larger light-analyte interaction and hence a higher sensitivity, as more light is present in the slot through which biomolecules flow [189, 190]. A slot-waveguide ring resonator showed a RI sensitivity of over 200 nm/RIU and a DL of 2×10⁻⁴ RIU [189], and an estimated protein DL of approximately 20 pg/mm2 [190].
Stand-alone microsphere based ring resonator sensors
While microsphere-based ring resonators have a lower RI sensitivity (20–50 nm/RIU) due to their relatively large size (~ 100 μm in diameter) [144], they benefit from a better spectral resolution resulting from much higher Q-factors (> 106) [131, 134, 144]. As a consequence, the DL on the order of 10−7 RIU can be achieved by directly monitoring the WGM spectral shift [144].
Streptavidin detection has been performed with microspheres. Binding stoichiometry of 1:1 between biotin-BSA and streptavidin was estimated from the magnitude of the WGM shift. Due to high Q-factors, small molecule (~ 50 Dalton) detection was predicted and experimentally demonstrated [131, 146]. Additionally, protease (such as trypsin) and thrombin detection were also carried out with microsphere sensors [145, 151]. DNA detection with microspheres was first demonstrated by Vollmer et al. [134] with a DL of 1 pg/mm2. The authors further showed the detection of single nucleotide polymorphisms (SNP) using two microspheres. As the ring resonator supports multiple resonant wavelengths and both TE and TM modes, two wavelengths were used in a microsphere sensor to independently determine both the thickness and the optical dielectric constant [136]. Furthermore, simultaneous use of TE and TM modes was employed to determine the orientation of biomolecules on the surface [142].
A comprehensive work on viral detection with a microsphere sensor that includes theoretical discussion as well as experimental results was published recently [143]. It predicts that the microsphere is capable of detecting virions down to a single particle. Experimental demonstration was performed with MS2 at a concentration of 109 pfu/ml. A DL for surface density of 2 pg/mm2 was deduced.
Capabilities of microspheres of detecting larger bioparticles, like bacteria, were theoretically studied and experimentally demonstrated through simple adsorption [140, 141]. The DL was estimated to be ~ 1.2 × 10² E.Coli/mm2, which corresponds to ~ 44 bacteria bound to the sphere. With the average dry weight of an E. coli cell ~ 0.28 pg, this corresponds to a DL for bacterial dry-mass loading of ~34 pg/mm2 [140]. Very recently, Brownian particles of a few tens to a few hundreds of nanometers were detected with a microsphere using the autocorrelation of resonance wavelength fluctuations [141].
Capillary-based opto-fluidic ring resonator sensors
A capillary based opto-fluidic ring resonator (OFRR) with an outer radius of 50 μm and a wall thickness of 2–3 μm typically has a RI sensitivity of around 50 nm/RIU, a Q-factor over 106, and a DL on the order of 10−7 RIU, which are similar to those in microspheres. Protein adsorption measurement was recently accomplished with the OFRR. The DL for BSA adsorption is approximately 3 pM, corresponding to a surface density of 0.5 pg/mm2 and a total mass of a few femto-grams [157]. The OFRR was also used for actual breast cancer biomarker (CA15–3) detection with a DL on the order of 1 Unit/ml, which is sufficiently sensitive to differentiate healthy women from breast cancer patients [196]. Quantitative detection of DNA sequences with base-mismatch studies have also been carried out using the OFRR. DNA concentration down to 10 pM was experimentally detected and the estimated mass density DL is 4 pg/mm2 [163].
The OFRR can also be employed for sensitive, rapid, on-line virus detection [164]. In this work, M13 filamentous bacteriophage was used as a safe model system. M13 is about 900 nm long and 10 nm wide and has similar molecular weight to serious human pathogens. The OFRR had a detection dynamic range of seven orders of magnitude (2×10³ – 2×10¹⁰ pfu/mL). The experimental DL was on the order of 1000 pfu/mL, which resulted in a WGM shift of a few pico-meters, well above the sensor noise level. Additionally, the circular nature of the capillary enables the efficient capture and rapid detection of the analyte. Detection can be completed within a few minutes, even at very low virus concentration. Detection of a few viruses may be achievable with this device.
2.5. Optical fiber based biosensors
2.5.1. Fiber Bragg grating and long period grating based biosensors
Fibers are a convenient material for optical sensor design because they can be inexpensive and provide easy and efficient signal delivery [197, 198]. Fiber Bragg gratings (FBGs), while developed as a tool for the telecommunications industry, have flourished as a versatile sensor with a wide breadth of applications. They are currently among the most popular of all fiber-based optical sensors for analyzing load, strain, temperature, vibration, and RI [199].
Illuminating the fiber with two focused intersecting laser beams, RI perturbations can be written into the fiber core that have periodicities (Λ) on the order of the wavelength [200]. The resulting structure functions as a band rejection filter, reflecting a narrow band of light at the Bragg wavelength according to the following relationship [201]:
| (4) |
where neff is the effective RI encountered by the fiber core mode. By monitoring , the system functions as a RI sensor, which serves as the foundation for biochemical sensing functionality.
In order to expose the evanescent field from the FBG, several strategies have been pursued. One approach is to create a surface grating on the side of the fiber [202–204]. This usually requires bending and polishing until the fiber’s core is exposed, and then a grating is physically patterned on that surface. This design has yielded devices with a RI sensitivity as high as 340 nm/RIU and a DL down to 2×10⁻⁶ [204]. More recently biosensing was also carried out with a D-shaped fiber patterned with a FBG (Fig. 6(A)) which shows a DL of 10−5 RIU [205, 206]. Another way of exposing the evanescent field involves chemically etching the optical fiber down to its core (see Fig. 6(B)) [207–210]. Chryssis et al. demonstrated a RI sensitivity of 1394 nm/RIU with a DL of 7×10⁻⁶ when the fiber was etched down to 3.4 μm in diameter [209]. Using the same sensor, 0.7 μg/mL target DNA was detected with 20 base strands, which corresponds roughly to 0.1 μM [209]. This is still below par for label-free DNA detection, but it appears to be only the first proof of concept on this work. In a fourth study, light-matter interaction was increased by inscribing FBGs into a microstructured fiber [211]. This configuration allows passage of sample solution through the holes where light intensity is high, allowing detection of 6×10⁻⁶ RIU.
Figure 6.

(A) D-shaped fiber with surface etched gratings. (B) FBG on an etched fiber. (C) Nanofiber loop. (D) Fiber-optic coupler biosensor. (E) Fiber Fabry-Perot cavity DNA sensor showing hollow segment. (F) Fiber Fabry-Perot cavity formed by two sets of FBGs. Reprinted with permission from [205, 207, 220, 227, 229].
Long period gratings (LPGs), have attracted a great deal of attention in recent years for biochemical sensing applications although the advantages of LPGs have been known since the early 1990’s [212, 213]. These devices are manufactured with periodicity on the order of 100 μm to 1 mm, three or four orders of magnitude larger than traditional FBGs. In an LPG, core modes couple into the cladding modes of the fiber [214]. The characteristic resonance condition is expressed differently for LPGs [215]:
| (5) |
where is the effective RI encountered by core modes, and is the effective RI encountered by cladding modes, which is affected by external RI. Because of this increased field intensity in the cladding of the fiber, the spectral position of the reflection peak becomes more sensitive to the RI change in the surrounding medium [216]. They therefore have the advantage of being able to sense the RI changes around the cladding without etching or complex structural design. Due to the large grating pitch, they are also far easier to manufacture. LPGs can also be customized by chemically etching the cladding material down in order to enhance the sensitivity [214, 217]. For example, in Ref. [217], a sensitivity of 172 nm/RIU was reached.
The earliest demonstration of biomolecule detection with LPGs was in 2000, when etched LPGs were used to detect antibodies [218], where goat anti-human IgG antibodies were linked to the fiber surface with glutaraldehyde and were then used to detect aqueous human IgG. These results showed repeatable detection down to 2 μg/mL with a dynamic range of 2–100 μg/mL. In 2007 Chen et al. were able to use etched LPGs for detection of hemoglobin [213]. In this work, the hemoglobin was allowed to adsorb non-specifically, yielding an estimated DL of around 0.005% for hemoglobin in water. This particular sensor utilized a dual-resonance measurement technique where at smaller grating periods two reflection maxima appear and may be measured relative to each other in order to achieve a better DL.
Photonic crystal fibers have been inscribed with LPG for detection of DNA and bulk RI very recently [9, 219]. The fibers used were 30 cm in length with a grating pitch of 700 μm. These experiments demonstrated oligonucleotide deposition inside the holes using poly-L-lysine with a DL of 10−4 RIU. The authors also observed high sensitivity to biomolecule deposition, with 1.4 nm of spectral shift per nanometer of DNA monolayer deposition. This configuration presents the greatest potential for microfluidic efficiency of any fiber grating technology to date.
Overall, FBG and LPG sensors are very attractive due to their simple design, low manufacturing costs, and high compatibility with standard optical fibers. Most applications, however, focus on physical and basic RI sensing, because they lend themselves so readily to these purposes. For biochemical detection, these sensors cannot compete with other types of optical sensors in terms of their DLs even though their sensitivities can exceed 100 nm/RIU. Virtually all of the published work focused on FBG and LPG biosensing has come out within the last decade, and much of it has been within the last five years. It is therefore reasonable to expect that there will be substantial advancements made in this field in the very near future.
2.5.2. Other optical fiber based label-free biosensors:
Aside from gratings, several other fiber-based technologies have been under development very recently that take advantage of optical fiber’s cost effectiveness and its waveguiding capabilities. One technology is the nanofiber shown in Fig. 6(C), a silica fiber that is pulled under heat to a diameter less than 1 μm [220, 221]. The nanofiber has a very large evanescent field outside of the fiber due to its small size, and therefore, is sensitive to the RI change. There are a few optical structures developed based on the nanofibers such as ring resonators, coils, and Mach-Zehnder interferometers [221–226]. It has been estimated that the DL for these sensors can approach 10−7 RIU [223] and the sensitivity can reach 700 nm/RIU with fiber radii of 300 nm [222, 224]. When used as the sensing element in a Mach-Zehnder interferometer, the nanofiber with a diameter of 400 nm and a sensing length of 1 mm can reach the DL of 4.2×10⁻⁴ monolayers of analytes [225].
Coupled optical fibers or fiber couplers, shown in Fig. 6(D), are another fiber-based biochemical sensor platform. In this case, two identical optical fibers are fused together and tapered to a diameter of 9 μm. The transmission spectrum is sinusoidal and shows a RI sensitivity close to 70 nm/RIU with a DL of 4×10⁻⁶ RIU [227]. Tazawa et al. demonstrated this sensor’s ability to detect streptavidin with concentrations between 0.5 and 2 μg/mL using covalent surface chemistries.
A third structure is fiber Fabry-Perot cavity based sensors formed by a short piece of hollow fiber, a slot sandwiched between two pieces of optical fiber, or a pair of FBGs (Fig. 6(E)) [228–232]. It can also be formed by a piece of tapered fiber between a pair of FBGs (Fig. 6(F)) [207]. The spectral reflectance of these devices is sensitive to the RI near the fiber tip or the fiber taper. A RI sensitivity of 71.2 nm/RIU and a DL of 1.4×10⁻⁵ RIU were demonstrated with a 5 mm long tapered fiber cavity [207]. This type of a device was also used to detect pig/anti-pig IgG with a concentration of 25 μg/mL [228] and 26-base ~ 76 μM oligonucleotide with a total surface mass of 1.7 ng [229]. Very recently, a slot fiber Fabry-Perot cavity showed a RI sensitivity in excess of 1000 nm/RIU [231, 232]. However, its applications in biosensing have yet to be demonstrated.
2.6. Photonic crystal based sensors
Photonic crystal (PC) biosensors are a novel type of label-free optical biosensing platform, which has been presented in the recent literature [8, 9, 219, 233–247]. A PC has a periodic dielectric structure with a periodicity on the order of a wavelength, from which forms the photonic bandgap. Therefore, the incident light whose wavelength lies within the photonic bandgap can not propagate through the PC and a wide bandgap emerges on the transmission (or reflection) spectrum. However, a photonic “defect” within the bandgap can be introduced by locally disturbing the PC’s periodic structure, leading to the formation of the defect mode. The light resonant with the defect mode can propagate in the PC. As a result, on the transmission (or reflection) spectrum, the defect mode appears as a relatively sharp peak within the bandgap. Since spectral position of the defect mode is highly sensitive to the change in the local environment around the “defect”, it can be used as the sensing transduction signal when the RI changes as a result of the binding of the molecules to the defect. Due to the strong light confinement provided by the photonic bandgap and the flexibility of adjusting the defect mode wavelength across the photonic bandgap by finely tuning the structural parameters, PC biosensors have received tremendous attention since the first demonstration of detecting RI change in both waveguide [233] and microcavity laser [234] configurations.
A two-dimensional photonic crystal microcavity biosensor, as illustrated in Fig. 7(A), is formed by introducing a point defect into the periodic microstructure, either by increasing or decreasing the central hole. The presence of molecules inside the central hole and the first layer of surrounding holes will cause a local RI change, which can be monitored as the spectral shift of the resonant wavelength of the PC microcavity. In 2004, Chow et al. demonstrated the detection of 0.002 ambient RI changes with a passive PC microcavity with a Q-factor around 400 [235]. The DL could be improved to 0.001 RIU with the optimized PC microcavity laser structure [234]. A polymer-coated PC microcavity was also demonstrated for the detection of micromolar concentrations of specific ions in liquid solutions [236]. Later in 2005, Lee and Fauchet for the first time demonstrated a PC microcavity biosensor that is capable of monitoring protein binding on the walls of the defect hole and quantitatively measuring the protein diameter [237]. The minimum amount of protein that can be detected by the device was approximately 2.5 fg. Shortly after, the same authors further improved the sensitivity down to ~1 fg by precisely delivering the targets to the defect area only. Detection of a single latex sphere with a diameter of 370 nm was achieved [238]. The PC microcavity had a sensing area of ~ 40 μm2, with an active sensing volume of ~ 0.15 μm3.
Figure 7.

Photonic crystal biosensor configurations. (A) Photonic crystal microcavity based biosensor. (B) Photonic crystal waveguide based biosensor. (C) Photonic crystal fiber based biosensor. (D) 1D photonic crystal resonators array for parallel detection. Reprinted with permission from [219, 238, 239, 246].
An optical biosensor based on light propagation through a PC waveguide (Fig. 7(B)) was presented by Skivesen et al. [239], where the cutoff wavelength of the PC waveguide was used as the indicator for surrounding RI changes. Concentrations of around 0.15 μM of BSA-solution were measured with excellent signal to noise ratio. However, compared to PC microcavity based biosensors, this PC waveguide biosensor suffers from relatively larger sensing area, which requires a larger sample volume.
A third class of PC biosensor is based on photonic crystal fiber (PCF), which is a fiber optic cable with air holes in the cross section (Fig. 7(C)). PCF is a promising sensing platform for two reasons. First, the air holes in the fiber can act as a simple fluidic channel to deliver the biological samples. Second, the unique light guiding mechanism of photonic crystal fiber ensures a strong light-matter interaction because of the large light-sample overlap. The array of air holes may hold a sample volume of a few nL/cm of the fiber, which is a desirable advantage for biosensing applications. Rindorf et al. recently demonstrated the detection of biomolecules using a long-period grating in a PCF, which has been discussed in the previous section [9, 219].
Cunningham et al. developed a unique type of PC biosensors that behaves as a narrowband wavelength reflectance filter, where the sensor reflects nearly 100% of the incident light at the resonant wavelength [240]. The sensor operates by measuring changes in the wavelength of reflected light as biochemical or cellular binding events take place on the surface. The sensor is able to detect a molecular surface density of 0.4 pg/mm2 (after solution containing the protein is dried) [241]. There are a number of advantages for this PC sensor structure. First, the sensor has a relatively good sensitivity as well as a large dynamic range, which enables it to measure biochemical entities from small size, such as biomolecular interactions [242, 243] to large size, such as live cells, cell membranes, virions and bacteria (also protein-cell interactions) [244]. Second, the sensor structure is compatible with standard microtiter plate-based and microarray-based infrastructures that are most widely used for high throughput biomolecular interaction analysis. Third, the sensor can be measured either in “single point mode” or “imaging mode”, which greatly increases the overall resolution and throughput of the system. Fourth, the sensors are inexpensively manufactured on plastic film. This group also showed that when the PC sensor is operated in the near ultraviolet wavelength range, the surface-sensitivity to bulk-sensitivity ratio will be enhanced over 4.5 times compared to the infrared range, which enables enhanced detection resolution for biomolecules on the biosensor surface and is very useful for small molecule detection or ultralow concentration detection [245]. This platform has now been commercialized by SRU Biosystems [248].
Mandal and Erickson recently demonstrated a novel opto-fluidic sensor array based on the use of arrays of 1D photonic crystal resonators and a single bus waveguide (Fig. 7(D)), which can perform highly parallel, label-free detection of biomolecular interactions [246]. The beauty of this structure is that each PC resonator adjacent to the bus waveguide is independent from all others, which greatly enhances the device’s multiplex detection capability. The simulation results predict that the DL is on the order of tens of attograms, and detection of 7×10⁻⁵ RIU was demonstrated experimentally.
In summary, while the development of PC-based label-free biosensor is still in its initial stage, based on the experimental demonstrations achieved to date, PC structures are a very promising biosensor platform. In PC biosensors, light can be concentrated or localized in a very small volume, thus achieving a large light-matter interaction with a volume down to femtoliters. Parallel detection is also possible. However, further investigations are still needed to improve the overall performance, such as surface chemistry, compatible microfluidics for efficient sample delivery, and detection procedures such as rinsing to minimize non-specific binding.
3. Outlook
In this article, we have overviewed recent progress in various optical biosensor structures for label-free detection. To date, some of them, like SPR, waveguides, and fiber gratings, are relatively mature and have even been commercialized. Others, such as ring resonators and photonic crystals, although still in their infancy, possess unique and advantageous properties over the state-of-the-art and may have great potential for next generation label-free biosensors. Eventually, the goals of label-free biosensors are to develop portable or hand-held devices that can provide laboratory grade sensing performance with low cost, low sample volume and total mass, and improved multiplexed detection capabilities. Towards this end, we envision that a few levels of integration may be needed. The first integration is on the optical sensor structure itself. For example, nana-fibers described in Section 2.5.2 can be coiled to make a ring resonator (Section 2.4) or to make an interferometer (Section 2.2). FBG or LPG structures (Section 2.5.1 and Section 2.5.2) can be inscribed onto a photonic crystal fiber (Section 2.6). Combination or integration of different optical structures onto the same sensor will leverage the advantages of each individual structure to achieve a better performance. In addition, different detection protocols like fluorescence and Raman spectroscopy can also be incorporated with the label-free detection to provide complementary sensing information. The second level of integration is between optical structures and microfluidics. Microfluidics has been under investigation for over a decade for lab-on-chip or micro total analysis systems. A particular area called “opto-fluidics” has recently drawn tremendous attention, which specifically addresses the issues of how microfluidics interfaces with optical detection [249–251]. A few examples have been given in this review, including optofluidic ring resonators (Section 2.4) and photonic crystal based LPG (Section 2.5.1). The last integration is to incorporate light sources (such as lasers) and detectors directly onto the same sensor chip [252, 253]. Currently, while miniaturization of sensors is underway, the light sources and detectors used for those sensors are still bulky. Integration of light sources, sensors, and detectors, as well as the corresponding on-board or on-chip optical and electronic controls (such as color filters and signal processors) will be a critical step towards achieving a truly hand-held device.
Acknowledgment
The authors gratefully thank the support from American Chemical Society Petroleum Research Fund (43879-G10), Wallace H. Coulter Early Career Award, NSF (ECCS-0729903), and NIH (5K25EB006011-02).
Footnotes
Publisher's Disclaimer: This is a PDF file of an unedited manuscript that has been accepted for publication. As a service to our customers we are providing this early version of the manuscript. The manuscript will undergo copyediting, typesetting, and review of the resulting proof before it is published in its final citable form. Please note that during the production process errors may be discovered which could affect the content, and all legal disclaimers that apply to the journal pertain.
References
- [1].Narayanaswamy R, Wolfbeis OS, Optical Sensors, Springer, New York, 2004. [Google Scholar]
- [2].Moerner WE, Proc. Nat. Acad. Sci, 104 (2007) 12596. [DOI] [PMC free article] [PubMed] [Google Scholar]
- [3].Cox WG, L SV, Biotechniques 36 (2004) 114. [DOI] [PubMed] [Google Scholar]
- [4].Jackson JD, Classical Electrodynamics, John Wiley & Sons, Hoboken, NJ, 1999. [Google Scholar]
- [5].Prasad PN, Introduction to Biophotonics, John Wiley & Sons, Inc., Hoboken, New Jersey, 2003. [Google Scholar]
- [6].Vo-Dinh T, Biomedical Photonics Handbook CRC Press, Boca Raton, Florida, 2003. [Google Scholar]
- [7].White IM, Fan X, Opt. Express, 16 (2008) 1020. [DOI] [PMC free article] [PubMed] [Google Scholar]
- [8].Mortensen NA, Xiao S, Pedersen J, Microfluid. Nanofluid, 4 (2008) 117. [Google Scholar]
- [9].Rindorf L, Bang O, Opt. Lett. 33 (2008) 563. [DOI] [PubMed] [Google Scholar]
- [10].Suter JD, White IM, Zhu H, Fan X, Appl. Opt, 46 (2007) 389. [DOI] [PubMed] [Google Scholar]
- [11].Han M, Wang A, Opt. Lett, 32 (2007) 1800. [DOI] [PubMed] [Google Scholar]
- [12].Armani AM, Kulkarni RP, Fraser SE, Flagan RC, Vahala KJ, Science, 317 (2007) 5839. [DOI] [PubMed] [Google Scholar]
- [13].Liedberg B, Nylander C, Lunström I, Sensors and Actuators, 4 (1983) 299. [Google Scholar]
- [14].Homola J, Yee SS, Gauglitz G, Sens. Actuators B Chem, 54 (1999) 3. [Google Scholar]
- [15].Homola J, Analytical and BioAnal. Chem, 377 (2003) 528. [DOI] [PubMed] [Google Scholar]
- [16].Hoa XD, Kirk AG, Tabrizian M, Biosens. Bioelectron, 23 (2007) 151. [DOI] [PubMed] [Google Scholar]
- [17].Homola J, Chemical Review, 108 (2008) 462. [DOI] [PubMed] [Google Scholar]
- [18].Matsubara K, Kawata S, Minami S, Appl. Opt, 27 (1988) 1160. [DOI] [PubMed] [Google Scholar]
- [19].Liedberg B, Lundström I, Stenberg E, Sens. Actuators B Chem, 11 (1993) 63. [Google Scholar]
- [20].Sharma AK, Jha R, Gupta BD, IEEE Sens. J, 7 (2007) 1118. [Google Scholar]
- [21].Yu F, Tian S, Yao D, Knoll W, Anal. Chem, 76 (2004) 3530. [DOI] [PubMed] [Google Scholar]
- [22].Alleyne CJ, Kirk AG, McPhedran RC, Nicorovici N-AP, Maystre D, Opt. Express, 15 (2007) 8163. [DOI] [PubMed] [Google Scholar]
- [23].Jorgenson RC, Yee SS, Sens. Actuators B Chem,12 (1993) 213. [Google Scholar]
- [24].Slavík R, Homola J, Čtyroký J, Brynda E, Sens. Actuators B Chem, 74 (2001) 106. [Google Scholar]
- [25].Lin H-Y, Tsai W-H, Tsao Y-C, Sheu B-C, Appl. Opt, 46 (2006) 800. [DOI] [PubMed] [Google Scholar]
- [26].Piliarik M, Homola J, Maníková Z, Čtyroký J, Sens. Actuators B Chem, 90 (2003) 236. [Google Scholar]
- [27].Chiu M-H, Wang S-F, Chang R-S, Opt. Lett, 30 (2003) 233. [DOI] [PubMed] [Google Scholar]
- [28].Manuel M, Vidal B, López R, Alegret S, Alonso-Chamarro J, Garces I, Mateo J, Sens. Actuators B Chem, 11 (1993) 455. [Google Scholar]
- [29].Dostálek J, Čtyroký J, Homola J, Brynda E, Skalský M, Nekvindová P, Špirková J, Škvor J, Schröfel J, Sens. Actuators B Chem, 76 (2001) 8. [Google Scholar]
- [30].Movet C, Harris RD, Maciag C, Luff BJ, Wilkinson JS, Piehler J, Brecht A, Gauglitz G, Abuknesha R, Ismail G, Analytica Chimica Acta, 338 (1997) 109. [Google Scholar]
- [31].Wu C-M, Pao M-C, Opt. Express, 12 (2004) 3509. [DOI] [PubMed] [Google Scholar]
- [32].Ho HP, Law WC, Wu SY, Lin C, Kong SK, Biosens. Bioelectron, 20 (2005) 2177. [DOI] [PubMed] [Google Scholar]
- [33].Naraoka R, Kajikawa K, Sens. Actuators B Chem, 107 (2005) 952. [Google Scholar]
- [34].Kruchinin AA, Vlasov YG, Sens. Actuators B Chem, 30 (1996) 77. [Google Scholar]
- [35].Website, http://www.biacore.com/lifesciences/index.html. [Google Scholar]
- [36].Tao NJ, Boussaad S, Huang WL, Arechabaleta RA, D’Agnese J, Review of Scientific Instruments, 70 (1999) 4656. [Google Scholar]
- [37].Slavík R, Homola J, Čtyroký J, Sens. Actuators B Chem, 54 (1999) 74. [Google Scholar]
- [38].Monzón-Hernández D, Villatoro J, Sens. Actuators B Chem, 115 (2006) 227. [Google Scholar]
- [39].Suzuki A, Kondoh J, Matsui Y, Shiokawa S, Suzuki K, Sens. Actuators B Chem, 106 (2005) 383. [Google Scholar]
- [40].Chien FC, Lin CY, Yih JN, Lee KL, Chang CW, Wei PK, Sun CC, Chen SJ, Biosens. Bioelectron, 22 (2007) 2737. [DOI] [PubMed] [Google Scholar]
- [41].Dostálek J, Homola J, Miler M, Sens. Actuators B Chem, 107 (2005) 154. [Google Scholar]
- [42].Nikitin PI, Grigorenko AN, Beloglazov AA, Valeiko MV, Savchuk AI, Savchuk OA, Steiner G, Kuhne C, Huebner A, Salzer R, Sensors and Actuators A, 85 (2000) 189. [Google Scholar]
- [43].Nenninger GG, Tobiška P, Homola J, Yee SS, Sens. Actuators B Chem, 74 (2001) 145. [Google Scholar]
- [44].Hastings JT, Guo J, Keathley PD, Kumaresh PB, Wei Y, Law S, Bachas LG, Opt. Express, 15 (2007) 17661. [DOI] [PubMed] [Google Scholar]
- [45].Slavík R, Homola J, Sens. Actuators B Chem, 123 (2007) 10. [Google Scholar]
- [46].Guo J, Keathley P, Hastings J, Opt. Lett. (2008). [DOI] [PubMed] [Google Scholar]
- [47].Hastings JT, IEEE Sens. J, 8 (2008) 170. [Google Scholar]
- [48].Dostálek J, Vaisocherová H, Homola J, Sens. Actuators B Chem, 108 (2005) 758. [Google Scholar]
- [49].Homola J, Lu HB, Nenninger GG, Dostálek J, Yee SS, Sens. Actuators B Chem, 76 (2001) 403. [Google Scholar]
- [50].Smith EA, Erickson MG, Ulijasz AT, Weisblum B, Corn RM, Langmuir, 19 (2003) 1486. [Google Scholar]
- [51].Fu E, Chinowsky T, Foley J, Weinstein J, Yager P, Review of Scientific Instruments, 75 (2004) 2300. [Google Scholar]
- [52].Wark AW, Lee HJ, Corn RM, Anal. Chem, 77 (2005) 3904. [DOI] [PubMed] [Google Scholar]
- [53].Shumaker-Parry JS, Campbell CT, Anal. Chem, 76 (2004) 907. [DOI] [PubMed] [Google Scholar]
- [54].Zybin A, Grunwald C, Mirsky VM, Kuhlmann J, Wolfbeis OS, Niemax K, Anal. Chem, 77 (2005) 2393. [DOI] [PubMed] [Google Scholar]
- [55].Piliarik M, Vaisocherová H, Homola J, Biosens. Bioelectron, 20 (2005) 2104. [DOI] [PubMed] [Google Scholar]
- [56].Chinowsky TM, Grow MS, Johnston KS, Nelson K, Edwards T, Fu E, Yager P, Biosens. Bioelectron, 22 (2007) 2208. [DOI] [PMC free article] [PubMed] [Google Scholar]
- [57].Tombelli S, Minunni M, Luzi E, Mascini M, Bioelectrochem, 67 (2005) 135. [DOI] [PubMed] [Google Scholar]
- [58].Lee HJ, Nedelkov D, Corn RM, Anal. Chem, 78 (2006) 6504. [DOI] [PubMed] [Google Scholar]
- [59].Kuo W-C, Chou C, Wu H-T, Opt. Lett, 28 (2003) 1329. [DOI] [PubMed] [Google Scholar]
- [60].Law W-C, Markowicz P, Yong K-T, Roy I, Baev A, Patskovsky S, Kabashin AV, Ho H-P, Prasad PN, Biosens. Bioelectron, 23 (2007) 627. [DOI] [PubMed] [Google Scholar]
- [61].Chinowsky TM, Quinn JG, Bartholomew DU, Kaiser R, Elkin JL, Sens. Actuators B Chem, 91 (2003) 266. [Google Scholar]
- [62].Li YJ, Xiang J, Zhou F, Plasmonics, 2 (2007) 79. [Google Scholar]
- [63].He L, Musick MD, Nicewarner SR, Salinas FG, Benkovic SJ, Natan MJ, Keating CD, Journal of American Chemical Society, 122 (2000) 9071. [Google Scholar]
- [64].Nelson BP, Grimsrud TE, Liles MR, Goodman RM, Corn RM, Anal. Chem, 73 (2001) 1. [DOI] [PubMed] [Google Scholar]
- [65].Song F, Zhou F, Wang J, Tao N, Lin J, Vellanowth RL, Morquecho Y, Laidman JW, Nucleic Acids Res, 30 (2002) e72. [DOI] [PMC free article] [PubMed] [Google Scholar]
- [66].Yao X, Li X, Toledo F, Lopez CZ, Gutova M, Momand J, Zhou F, Anal. Biochem, 354 (2006) 220. [DOI] [PubMed] [Google Scholar]
- [67].Besselink GAJ, Kooyman RPH, van Os PJHJ, Engbers GHM, Schasfoorta RBM, Anal. Biochem, 333 (2004) 165. [DOI] [PubMed] [Google Scholar]
- [68].Cao C, Kim JP, Kim BW, Chae H, Yoon HC, Yang SS, Sim SJ, Biosens. Bioelectron, 21 (2006) 2106. [DOI] [PubMed] [Google Scholar]
- [69].Chung JW, Bernhardt R, Pyun JC, Sens. Actuators B Chem, 118 (2006) 28. [Google Scholar]
- [70].Teramura Y, Iwata H, Anal. Biochem, 365 (2007) 201. [DOI] [PubMed] [Google Scholar]
- [71].Wei J, Mu Y, Song D, Fang X, Liu X, Bu L, Zhang H, Zhang G, Ding J, Wang W, Jin Q, Luo G, Anal. Biochem, 321 (2003) 209. [DOI] [PubMed] [Google Scholar]
- [72].Masson J-F, Obando L, Beaudoin S, Booksh K, Talanta, 62 (2004) 865. [DOI] [PubMed] [Google Scholar]
- [73].Miyashita M, Shimada T, Miyagawa H, Akamatsu M, Anal. Bioanal. Chem, 381 (2005) 667. [DOI] [PubMed] [Google Scholar]
- [74].Taylor AD, Yu Q, Chen S, Homola J, Jiang S, Sens. Actuators B Chem, 107 (2005) 202. [Google Scholar]
- [75].Oh B-K, Kim Y-K, Park KW, Lee WH, Choi J-W, Biosens. Bioelectron, 19 (2004) 1497. [DOI] [PubMed] [Google Scholar]
- [76].Waswa JW, Debroy C, Irudayaraj J, Food Process Eng J., 29 (2006) 373. [Google Scholar]
- [77].Heideman RG, Kooyman RPH, Greve J, Sens. Actuators B Chem, 10 (1993) 209. [Google Scholar]
- [78].Ingenhoff J, Drapp B, Gauglitz G, Fresenius J Anal. Chem, 346 (1993) 580. [Google Scholar]
- [79].Gauglitz G, Ingenhoff J, Fresenius. J. Anal. Chem, 349 (1994) 355. [Google Scholar]
- [80].Brosinger F, Freimuth H, Lacher M, Ehrfeld W, Gedig E, Katerkamp A, Spener F, Cammann K, Sens. Actuators B Chem, 44 (1997) 350. [Google Scholar]
- [81].Schipper EF, Brugman AM, Dominguez C, Lechuga LM, Kooyman RPH, Greve J, Sens. Actuators B Chem, 40 (1997) 147. [Google Scholar]
- [82].Weisser M, Tovar G, Mittler-Neher S, Knoll W, Brosinger F, Freimuth H, Lacher M, Ehrfeld W, Biosens. Bioelectron, 14 (1999) 405. [DOI] [PubMed] [Google Scholar]
- [83].Heideman RG, Lambeck PV, Sens. Actuators B Chem, 61 (1999) 100. [Google Scholar]
- [84].Jimenez D, Bartolome E, Moreno M, Munoz J, Dominguez C, Optical Communications, 132 (1996) 437. [Google Scholar]
- [85].Prieto F, Sepulveda B, Calle A, Llobera A, Domınguez C, Lechuga LM, Sens. Actuators B Chem, 92 (2003) 151. [Google Scholar]
- [86].Hsu S-H, Huang Y-T, Lightwave Technol J., 23 (2005) 4200. [Google Scholar]
- [87].Blanco FJ, Agirregabiria M, Berganzo J, Mayora K, Elizalde J, Calle A, Dominguez C, Lechuga LM, J. Micromech. Microeng, 16 (2006). [Google Scholar]
- [88].Brandenburg A, Henninger R, Appl. Opt, 33 (1994) 5941. [DOI] [PubMed] [Google Scholar]
- [89].Brandenburg A, Sens. Actuators B Chem, 39 (1997) 266. [Google Scholar]
- [90].Ymeti A, Kanger JS, Greve J, Lambeck PV, Wijn R, Heideman RG, Appl. Opt, 42 (2003) 5649. [DOI] [PubMed] [Google Scholar]
- [91].Ymeti A, Greve J, Lambeck PV, Wink T, Hovell S.W.F.M.v., Beumer TAM, Wijn RR, Heideman RG, Subramaniam V, Kanger JS, Nano Lett, 7 (2007) 394. [DOI] [PubMed] [Google Scholar]
- [92].Website, http://www.farfield-scientific.com/. [Google Scholar]
- [93].Cross GH, Reeves AA, Brand S, Popplewell JF, Peel LL, Swann MJ, Freeman NJ, Biosens. Bioelectron, 19 (2003) 383. [DOI] [PubMed] [Google Scholar]
- [94].Swann MJ, Peel LL, Carrington S, Freeman NJ, Anal. Biochem, 329 (2004) 190. [DOI] [PubMed] [Google Scholar]
- [95].Schneider BH, Edwards JG, Hartman NF, Clin. Chem, 43 (1997) 1757. [PubMed] [Google Scholar]
- [96].Schneider BH, Dickinson EL, Vach MD, Hoijer JV, Howard LV, Biosens. Bioelectron, 15 (2000) 13. [DOI] [PubMed] [Google Scholar]
- [97].Schneider BH, Dickinson EL, Vach MD, Hoijer JV, Howard LV, Biosens. Bioelectron, 15 (2000) 597. [DOI] [PubMed] [Google Scholar]
- [98].Lin VS-Y, Motesharei K, Dancil K-PS, Sailor MJ, Ghadiri MR, Science, 278 (1997) 840. [DOI] [PubMed] [Google Scholar]
- [99].Varma MM, Inerowicz HD, Regnier FE, Nolte DD, Biosens. Bioelectron, 19 (2004) 1371. [DOI] [PubMed] [Google Scholar]
- [100].Zhao M, Nolte D, Cho W, Regnier F, Varma M, Lawrence G, Pasqua J, Clin. Chem, 52 (2006) 2135. [DOI] [PubMed] [Google Scholar]
- [101].Website, http://www.quadraspec.com/index.php. [Google Scholar]
- [102].Chang C-L, Acharya G, Savran CA, Appl. Phys. Lett, 90 (2007) 233901. [Google Scholar]
- [103].Markov DA, Swinney K, Bornhop DJ, J. Am. Chem. Soc, 126 (2004) 16659. [DOI] [PubMed] [Google Scholar]
- [104].Sørensen HS, Larsen NB, Latham JC, Bornhop DJ, Andersen PE, Appl. Phys. Lett, 89 (2006) 151108. [Google Scholar]
- [105].Wang Z, Bornhop DJ, Anal. Chem, 77 (2005) 7872. [DOI] [PubMed] [Google Scholar]
- [106].Bornhop DJ, Latham JC, Kussrow A, Markov DA, Jones RD, Sorensen HS, Science, 317 (2007) 1732. [DOI] [PubMed] [Google Scholar]
- [107].Goddard NJ, Pollard-Knight D, Maule CH, Analyst, 119 (1994) 583. [Google Scholar]
- [108].Watts HJ, Lowe CR, Pollard-Knight DV, Anal Chem, 66 (1994) 2465. [DOI] [PubMed] [Google Scholar]
- [109].Goddard NJ, Singh K, Holmes RJ, Bastani B, Sens. Actuators B Chem, 51 (1998) 131. [Google Scholar]
- [110].Goddard NJ, Singh K, Hulme JP, Malins C, Holmes RJ, Sensors and Actuators A, 100 (2002) 1. [Google Scholar]
- [111].Buckle PE, Davies RJ, Kinning T, Yeung D, Edwards PR, Pollard-Knight D, Lowe CR, Biosens. Bioelectron, 8 (1993) 355. [Google Scholar]
- [112].Cush R, Cronin JM, Stewart WJ, Maule CH, Molloy J, Goddard NJ, Biosens. Bioelectron, 8 (1993) 347. [Google Scholar]
- [113].Website, www.neosensors.com. [Google Scholar]
- [114].Salamon Z, Tollin G, Biophys. J, 80 (2001) 1557. [DOI] [PMC free article] [PubMed] [Google Scholar]
- [115].Zourob M, Mohr S, Brown BJT, Fielden PR, McDonnell M, Goddard NJ, Sens. Actuators B Chem, 90 (2003) 296. [Google Scholar]
- [116].Zourob M, Mohr S, Fielden PR, Goddard NJ, Sens. Actuators B Chem, 94 (2003) 304. [Google Scholar]
- [117].Skivesen N, Horvath R, Pedersen HC, Sens. Actuators B Chem, 106 (2005) 668. [Google Scholar]
- [118].Skivesen N, Horvath R, Pedersen HC, Opt. Lett, 30 (2005) 1659. [DOI] [PubMed] [Google Scholar]
- [119].Zourob M, Mohr S, Brown BJT, Fielden PR, McDonnell MB, Goddard NJ, Anal. Chem, 77 (2005) 232. [DOI] [PubMed] [Google Scholar]
- [120].Zourob M, Goddard NJ, Biosens. Bioelectron, 20 (2005) 1718. [DOI] [PubMed] [Google Scholar]
- [121].Skivesen N, Horváth R, Thinggaard S, Larsen NB, Pedersen HC, Biosens. Bioelectron, 22 (2007) 1282. [DOI] [PubMed] [Google Scholar]
- [122].Horváth R, Pedersen HC, Larsen NB, Appl. Phys. Lett, 81 (2002) 2166. [Google Scholar]
- [123].Horváth R, Pedersen HC, Skivesen N, Selmeczi D, Larsen NB, Opt. Lett, 28 (2003) 1233. [DOI] [PubMed] [Google Scholar]
- [124].Skivesen N, Horváth R, Pedersen HC, Opt. Lett, 28 (2003) 2473. [DOI] [PubMed] [Google Scholar]
- [125].Horvath R, Pedersen HC, Skivesen N, Selmeczi D, Larsen NB, Appl. Phys. Lett, 86 (2005) 071101. [Google Scholar]
- [126].Li H, Cao Z, Lu H, Shen Q, Appl. Phys. Lett, 83 (2003) 2757. [Google Scholar]
- [127].Lu H, Cao Z, Li H, Shen Q, Appl. Phys. Lett, 85 (2004) 4579. [Google Scholar]
- [128].Chen L, Cao Z, Ou F, Li H, Shen Q, Qiao H, Opt. Lett, 32 (2007) 1432. [DOI] [PubMed] [Google Scholar]
- [129].Wang Y, Li H, Cao Z, Yu T, Shen Q, He Y, Appl. Phys. Lett, 92 (2008) 061117. [Google Scholar]
- [130].Serpenguzel A, Arnold S, Griffel G, Opt. Lett, 20 (1995) 654. [DOI] [PubMed] [Google Scholar]
- [131].Vollmer F, Braun D, Libchaber A, Khoshsima M, Teraoka I, Arnold S, Appl. Phys. Lett, 80 (2002) 4057. [Google Scholar]
- [132].Arnold S, Khoshsima M, Teraoka I, Holler S, Vollmer F, Opt. Lett, 28 (2003) 272. [DOI] [PubMed] [Google Scholar]
- [133].Teraoka I, Arnold S, Vollmer F, J. Opt. Soc. Am. B, 20 (2003) 1937. [Google Scholar]
- [134].Vollmer F, Arnold S, Braun D, Teraoka I, Libchaber A, Biophys. J, 85 (2003) 1974. [DOI] [PMC free article] [PubMed] [Google Scholar]
- [135].Noto M, Khoshsima M, Keng D, Teraoka I, Kolchenko V, Arnold S, Appl. Phys. Lett, 87 (2005) 223901 [Google Scholar]
- [136].Noto M, Vollmer F, Keng D, Teraoka I, Arnold S, Opt. Lett, 30 (2005) 510. [DOI] [PubMed] [Google Scholar]
- [137].Gaathon O, Culic-Viskota J, Mihnev M, Teraoka I, Arnold S, Appl. Phys. Lett, 89 (2006). [Google Scholar]
- [138].Teraoka I, Arnold S, J. Op. Soc. Am. B, 23 (2006) 1381. [Google Scholar]
- [139].Teraoka I, Arnold S, J. Op. Soc. Am. B, 23 (2006) 1434. [Google Scholar]
- [140].Ren H-C, Vollmer F, Arnold S, Libchaber A, Opt. Express, 15 (2007) 17410. [DOI] [PubMed] [Google Scholar]
- [141].Keng D, McAnanama SR, Teraoka I, Arnold S, Appl. Phys. Lett, 91 (2007). [Google Scholar]
- [142].Noto M, Keng D, Teraoka I, Arnold S, Biophys. J, 92 (2007) 4466. [DOI] [PMC free article] [PubMed] [Google Scholar]
- [143].Arnold S, Ramjit R, Keng D, Kolchenko V, Teraoka I, Faraday Discuss, 137 (2008) 65. [DOI] [PubMed] [Google Scholar]
- [144].Hanumegowda NM, Stica CJ, Patel BC, White IM, Fan X, Appl. Phys. Lett, 87 (2005) 201107. [Google Scholar]
- [145].Hanumegowda NM, White IM, Oveys H, Fan X, Sens. Lett, 3 (2005) 315. [Google Scholar]
- [146].White IM, Hanumegowda NM, Fan X, Opt. Lett, 30 (2005) 3189. [DOI] [PubMed] [Google Scholar]
- [147].Hanumegowda NM, White IM, Fan X, Sens. Actuators B Chem.: Chemical, 120 (2006) 207. [Google Scholar]
- [148].White IM, Oveys H, Fan X, Opt. Lett, 31 (2006) 1319. [DOI] [PubMed] [Google Scholar]
- [149].White IM, Oveys H, Fan X, Spectroscopy, 21 (2006) 36. [Google Scholar]
- [150].White IM, Oveys H, Fan X, Smith TL, Zhang J, Appl. Phys. Lett, 89 (2006) 191106. [Google Scholar]
- [151].Zhu H, Suter JD, White IM, Fan X, Sensors, 6 (2006) 785. [Google Scholar]
- [152].Fan X, White IM, Zhu H, Suter JD, Oveys H, SPIE Laser Resonators and Beam Control X, 6452 (2007) 6452. [Google Scholar]
- [153].Sumetsky M, Windeler RS, Dulashko Y, Fan X, Opt. Express, 15 (2007) 14376. [DOI] [PubMed] [Google Scholar]
- [154].White IM, Zhu H, Suter JD, Hanumegowda NM, Oveys H, Zourob M, Fan X, IEEE Sens. J, 7 (2007) 28. [Google Scholar]
- [155].White IM, Gohring J, Fan X, Opt. Express, 15 (2007) 17433. [DOI] [PMC free article] [PubMed] [Google Scholar]
- [156].White IM, Gohring J, Sun Y, Yang G, Lacey S, Fan X, Appl. Phys. Lett, 91 (2007) 241104. [DOI] [PMC free article] [PubMed] [Google Scholar]
- [157].Zhu H, White IM, Suter JD, Dale PS, Fan X, Opt. Express, 15 (2007) 9139. [DOI] [PubMed] [Google Scholar]
- [158].Zhu H, White IM, Suter JD, Zourob M, Fan X, Anal. Chem, 79 (2007) 930. [DOI] [PubMed] [Google Scholar]
- [159].Shopova SI, Zhu H, Fan X, Zhang P, Appl. Phys. Lett, 90 (2007) 221101. [Google Scholar]
- [160].Shopova SI, Cupps JM, Zhang P, Henderson EP, Lacey S, Fan X, Opt. Express, 15 (2007) 12735. [DOI] [PubMed] [Google Scholar]
- [161].Lacey S, White IM, Sun Y, Shopova SI, Cupps JM, Zhang P, Fan X, Opt. Express, 15 (2007) 15523. [DOI] [PubMed] [Google Scholar]
- [162].Shopova SI, White IM, Sun Y, Zhu H, Fan X, Frye-Mason G, Thompson A, S.-j. Ja, Anal. Chem, 80 (2008) 2232. [DOI] [PubMed] [Google Scholar]
- [163].Suter JD, White IM, Zhu H, Shi H, Caldwell CW, Fan X, Biosens. Bioelectron, 23 (2008) 1003. [DOI] [PubMed] [Google Scholar]
- [164].Zhu H, White IM, Suter JD, Zourob M, Fan X, Analyst, 132 (2008) 356. [DOI] [PubMed] [Google Scholar]
- [165].Armani AM, Vahala KJ, Opt. Lett, 31 (2006) 1896. [DOI] [PubMed] [Google Scholar]
- [166].Chao C-Y, Guo LJ, Appl. Phys. Lett, 83 (2003) 1527. [Google Scholar]
- [167].Chao CY, Guo LJ, Lightwave Technol J., 24 (2006) 1395. [Google Scholar]
- [168].Chao C-Y, Fung W, Guo LJ, IEEE J. Sel. Top. Quantum Electron, 12 (2006) 134. [Google Scholar]
- [169].Yang J, Guo LJ, IEEE J. Sel. Top. Quantum Electron, 12 (2006) 143. [Google Scholar]
- [170].Ling T, Guo LJ, Opt. Express, 15 (2007) 17424. [DOI] [PubMed] [Google Scholar]
- [171].Yalcin A, Popat KC, Aldridge JC, Desai TA, Hryniewicz J, Chbouki N, Little BE, King O, Van V, Chu S, Gill D, Anthes-Washburn M, Unlu MS, Ieee J Sel. Top. Quantum Electron, 12 (2006) 148. [Google Scholar]
- [172].Ksendzov A, Homer ML, Manfreda AM, Electron. Lett, 40 (2004). [Google Scholar]
- [173].Ksendzov A, Lin Y, Opt. Lett, 30 (2005) 3344. [DOI] [PubMed] [Google Scholar]
- [174].Rosenberger AT, Opt. Express, 15 (2007) 12959. [DOI] [PubMed] [Google Scholar]
- [175].Krioukov E, Opt. Lett, 27 (2002) 512. [DOI] [PubMed] [Google Scholar]
- [176].Krioukov E, Klunder DJW, Driessen A, Greve J, Otto C, Opt. Lett, 27 (2002) 1504. [DOI] [PubMed] [Google Scholar]
- [177].Krioukov E, Greve J, Otto C, Sens. Actuators B Chem, 90 (2003) 58. [Google Scholar]
- [178].Krioukov E, Klunder D, Driessen A, Grevea J, Otto C, Talanta, 65 (2005) 1086. [DOI] [PubMed] [Google Scholar]
- [179].Boyd RW, Heebner JE, Appl. Opt, 40 (2001) 5742. [DOI] [PubMed] [Google Scholar]
- [180].Boyd RW, Heebner JE, Lepeshkin NN, Park QH, Schweinsberg A, Wicks GW, Baca AS, Fajardo JE, Hancock RR, Lewis MA, Boysel RM, Quesada M, Welty R, Bleier AR, Treichler J, Slusher RE, J. Mod. Opt, 50 (2003) 2543. [Google Scholar]
- [181].Schweinsberg A, Hocde S, Lepeshkin NN, Boyd RW, Chase C, Fajardo JE, Sens. Actuators B Chem, 123 (2007) 727. [Google Scholar]
- [182].Nadeau JL, Ilchenko VS, Kossakovski D, Bearman GH, Maleki L, High-Q whispering-gallery mode sensor in liquids, in: Kudryashov AV (Ed.), Laser Resonators and Beam Control V, 2002, p. 172. [Google Scholar]
- [183].Blair S, Chen Y, Appl. Opt, 40 (2001) 570. [DOI] [PubMed] [Google Scholar]
- [184].Scheuer J, Green WMJ, DeRose GA, Yariv A, IEEE J. Sel. Top. Quantum Electron, 11 (2005) 476. [Google Scholar]
- [185].De Vos K, Bartolozzi I, Schacht E, Bienstman P, Baets R, Opt. Express, 15 (2007) 7610. [DOI] [PubMed] [Google Scholar]
- [186].Ramachandran A, Wang S, Clarke J, Ja SJ, Goad D, Wald L, Flood EM, Knobbe E, Hryniewicz JV, Chu ST, Gill D, Chen W, King O, Little BE, Biosens. Bioelectron, 23 (2008) 939. [DOI] [PubMed] [Google Scholar]
- [187].Zamora V, Díez A, Andrés MV, Gimeno B, Opt. Express, 15 (2007) 12011. [DOI] [PubMed] [Google Scholar]
- [188].Sumetsky M, Opt. Express, 15 (2007) 17449. [DOI] [PubMed] [Google Scholar]
- [189].Barrios CA, Gylfason KB, Sánchez B, Griol A, Sohlström H, Holgado M, Casquel R, Opt. Lett, 32 (2007) 3080. [DOI] [PubMed] [Google Scholar]
- [190].Barrios CA, Bañuls MJ, González-Pedro V, Gylfason KB, Sánchez B, Griol A, Maquieira A, Sohlström H, Holgado M, Casquel R, Opt. Lett, 33 (2008) 708. [DOI] [PubMed] [Google Scholar]
- [191].Chang RK, Campillo AJ, Optical Processes in Microcavities, World Scientific, Singapore, 1996. [Google Scholar]
- [192].Bohren CF, Huffman DR, Absorption and Scattering of Light by Small Particles, John Wiley & Sons, New York, 1998. [Google Scholar]
- [193].Vahala K, Optical Microcavities, World Scientific, Singapore, 2005. [Google Scholar]
- [194].Gorodetsky ML, Savchenkov AA, Ilchenko VS, Opt. Lett, 21 (1996) 453. [DOI] [PubMed] [Google Scholar]
- [195].Levy U, Campbell K, Groismanb A, Mookherjea S, Fainman Y, Appl. Phys. Lett, 88 (2006) 111107. [Google Scholar]
- [196].Fan X, White IM, Shopova S, Zhu H, Suter JD, Sun Y, Yang G, in: Matsko A(Ed.), Practical applications of microresonators in optics and photonics, Taylor and Francis, in press. [Google Scholar]
- [197].Udd E, Review of Scientific Instrumentation, 66 (1995) 4015. [Google Scholar]
- [198].Bosch ME, Sanchez AJR, Ojeda CB, Sensors, 7 (2007) 797. [Google Scholar]
- [199].Kersey AD, Davis MA, Patrick HJ, LeBlanc M, Koo KP, Askins CG, Putnam MA, Friebele EJ, Lightwave Technol J., 15 (1997) 1442. [Google Scholar]
- [200].Riant I, Physique CR, 4 (2003) 41. [Google Scholar]
- [201].Hill KO, Fujii Y, Johnson DC, Kawasaki BS, Appl. Phys. Lett, 32 (1978) 647. [Google Scholar]
- [202].Sorin WV, Shaw HJ, Lightwave Technol J., LT-3 (1985) 1041. [Google Scholar]
- [203].Farries MC, Ragdale CM, Reid DCJ, Electron. Lett, 28 (1992) 487. [Google Scholar]
- [204].Schroeder K, Ecke W, Mueller R, Willsch R, Andreev A, Measurement Science and Technology, 12 (2001) 757. [Google Scholar]
- [205].Smith KH, Ipson BL, Lowder TL, Hawkins AR, Selfridge RH, Schultz SM, Appl. Opt, 45 (2006) 1669. [DOI] [PubMed] [Google Scholar]
- [206].Lowder TL, Gordon JD, Schultz SM, Selfridge RH, Opt. Lett, 32 (2007) 2523. [DOI] [PubMed] [Google Scholar]
- [207].Liang W, Huang Y, Xu Y, Lee RK, Yariv A, Appl. Phys. Lett, 86 (2005) 151122. [Google Scholar]
- [208].Chryssis AN, Lee SM, Lee SB, Saini SS, Dagenais M, IEEE Photonics Technol. Lett, 17 (2005) 1253. [Google Scholar]
- [209].Chryssis AN, Saini SS, Lee SM, Yi H, Bentley WE, Dagenais M, IEEE J. Sel. Top. Quantum Electron, 11 (2005) 864. [Google Scholar]
- [210].Saini SS, Stanford C, Lee SM, Park J, DeShong P, Bentley WE, Dagenais M, IEEE Photonics Technol. Lett, 19 (2007) 1341. [Google Scholar]
- [211].Huy MCP, Laffont G, Dewynter V, Ferdinand P, Roy P, Auguste J-L, Pagnoux D, Blanc W, Dussardier B, 2007, Opt. Lett. (2007) 2390. [DOI] [PubMed] [Google Scholar]
- [212].Hill KO, Malo B, Vineberg KA, Bilodeau F, Johnson DC, Skinner I, Electron. Lett, 26 (1990) 1270. [Google Scholar]
- [213].Chen X, Zhou K, Zhang L, Bennion I, Appl. Opt, 46 (2007) 451. [DOI] [PubMed] [Google Scholar]
- [214].Shu X, Zhang L, Bennion I, Lightwave Technol J., 20 (2002) 255. [Google Scholar]
- [215].Burani N, Laegsgaard J, J. Opt. Soc. Am. B, 22 (2005) 2487. [Google Scholar]
- [216].Lee BH, Liu Y, Lee SB, Choi SS, Opt. Lett, 22 (1997) 1769. [DOI] [PubMed] [Google Scholar]
- [217].Chen N, Yun B, Cui Y, Appl. Phys. Lett, 88 (2006) 133902. [Google Scholar]
- [218].DeLisa MP, Zhang Z, Shiloach M, Pilevar S, Davis CC, Sirkis JS, Bentley WE, Anal. Chem, 72 (2000) 2895. [DOI] [PubMed] [Google Scholar]
- [219].Rindorf L, Jensen JB, Dufva M, Pedersen LH, Hoiby PE, Bang O, Opt. Express, 14 (2006) 8224. [DOI] [PubMed] [Google Scholar]
- [220].Tong L, Gattass RR, Ashcom JB, He S, Lou J, Shen M, Maxwell I, Mazur E, Nature, 426 (2003) 816. [DOI] [PubMed] [Google Scholar]
- [221].Sumetsky M, Dulashko Y, Hale A, Opt. Express, 12 (2004) 3521. [DOI] [PubMed] [Google Scholar]
- [222].Xu F, Horak P, Brambilla G, Opt. Express, 15 (2007) 7888. [DOI] [PubMed] [Google Scholar]
- [223].Xu F, Horak P, Brambilla G, Opt. Express, 15 (2007) 9385. [DOI] [PubMed] [Google Scholar]
- [224].Xu F, Pruneri V, Finazzi V, Brambilla G, Opt. Express, 16 (2008) 1062. [DOI] [PubMed] [Google Scholar]
- [225].Lou J, Tong L, Ye Z, Opt. Express, 13 (2005) 2135. [DOI] [PubMed] [Google Scholar]
- [226].Tong L, Lou J, Ye Z, Svacha GT, Mazur E, Nanotechnology, 16 (2005) 1445. [Google Scholar]
- [227].Tazawa H, Kanie T, Katayama M, Appl. Phys. Lett, 91 (2007) 113901. [Google Scholar]
- [228].Zhang Y, Shibru H, Cooper KL, Wang A, Opt. Lett, 30 (2005) 1021. [DOI] [PubMed] [Google Scholar]
- [229].Wang X, Cooper KL, Wang A, Xu J, Wang Z, Zhang Y, Tu Z, Appl. Phys. Lett, 89 (2006) 163901. [Google Scholar]
- [230].Zhang Y, Chen X, Wang Y, Cooper KL, Wang A, Lightwave Technol J., 25 (2007) 1797. [Google Scholar]
- [231].Wei T, Han Y, Tsai H-L, Xiao H, Opt. Lett, 33 (2008) 536. [DOI] [PubMed] [Google Scholar]
- [232].Wei T, Han Y, Li Y, Tsai H-L, Xiao H, Opt. Express, 16 (2008) 5764. [DOI] [PubMed] [Google Scholar]
- [233].Topol’ancik J, Bhattacharya P, Sabarinathan J, Yu PC, Appl. Phys. Lett, 82 (2003) 1143. [Google Scholar]
- [234].Loncar M, Scherer A, Qiu Y, Appl. Phys. Lett, 82 (2003) 4648. [Google Scholar]
- [235].Chow E, Grot A, Mirkarimi LW, Sigalas M, Girolami G, Opt. Lett, 29 (2004) 1093. [DOI] [PubMed] [Google Scholar]
- [236].Chakravarty S, Topol’ancik J, Bhattacharya P, Chakrabarti S, Kang Y, Meyerhoff ME, Opt. Lett, 30 (2005) 2578. [DOI] [PubMed] [Google Scholar]
- [237].Lee MR, Fauchet PM, Opt. Express, 15 (2007) 4530. [DOI] [PubMed] [Google Scholar]
- [238].Lee MR, Fauchet PM, Opt. Lett, 32 (2007) 3284. [DOI] [PubMed] [Google Scholar]
- [239].Skivesen N, Têtu A, Kristensen M, Kjems J, Frandsen LH, Borel PI, Opt. Express, 15 (2007) 3169. [DOI] [PubMed] [Google Scholar]
- [240].Cunningham B, Li P, Lin B, Pepper J, Sens. Actuators B Chem, 81 (2002) 316. [Google Scholar]
- [241].Li PY, Lin B, Gerstenmaier J, Cunningham BT, Sens. Actuators B Chem, 99 (2004) 6. [Google Scholar]
- [242].Lin B, Qiu J, Gerstenmeier J, Li P, Pien H, Pepper J, Cunningham B, Biosens. Bioelectron, 17 (2002) 827. [DOI] [PubMed] [Google Scholar]
- [243].Cunningham BT, Laing L, Expert Review of Proteomics, 3 (2006) 271. [DOI] [PubMed] [Google Scholar]
- [244].Lin B, Li P, Cunningham BT, Sens. Actuators B Chem, 114 (2006) 559. [Google Scholar]
- [245].Ganesh N, Block ID, Cunningham BT, Appl. Phys. Lett, 89 (2006) 023901. [Google Scholar]
- [246].Mandal S, Erickson D, Opt. Express, 16 (2008) 1623. [DOI] [PMC free article] [PubMed] [Google Scholar]
- [247].Konopsky VN, Alieva EV, Anal. Chem, 79 (2007) 4729. [DOI] [PubMed] [Google Scholar]
- [248].Website, http://www.srubiosystems.com/. [Google Scholar]
- [249].Monat C, Domachuk P, Eggleton BJ, Nat. Photon, 1 (2007) 106. [Google Scholar]
- [250].Psaltis D, Quake SR, Yang C, Nature, 442 (2006) 381. [DOI] [PubMed] [Google Scholar]
- [251].Erickson D, Microfluid. Nanofluid, 4 (2008) 1. [DOI] [PMC free article] [PubMed] [Google Scholar]
- [252].Thrush E, Levi O, Cook LJ, Deich J, Kurtz A, Smith SJ, Moerner WE, Harris JS, Sens. Actuators B Chem, 105 (2005) 393. [Google Scholar]
- [253].Lu M, Choi S, Wagner C, Eden J, Cunningham B, Appl. Phys. Lett. (2008, in press; ). [Google Scholar]