

Abstract
Introduction:
Cortico-cortical evoked potentials (CCEPs) resulting from single pulse electrical stimulation are increasingly used to understand seizure networks, as well as normal brain connectivity. However, we observed that when using depth electrodes, traditional measures of CCEPs amplitude using a referential montage can be falsely localizing, often to white matter.
Methods:
We pooled 27 linear electrode arrays targeting the amygdala, hippocampus or cingulate cortex from eight participants. Using postoperative imaging, we classified contacts as being in gray matter, white matter or bordering each, and measured the amplitude using the root-mean squared (RMS) deviation from baseline in either a referential, common average, bipolar or Laplacian montage
Results:
25/27 (93%) electrode contacts had a significantly higher mean amplitude when in gray matter than in white matter using a Laplacian montage, which was significantly more than the 12/27 (44%) electrodes when using a referential montage (p=0.0003, Fisher exact test). The area under the curve for a receiver operating characteristic classifying contacts as gray or white matter was significantly higher for either the Laplacian (0.79) or the bipolar montage (0.72) when compared to either the common average (0.56) or the referential montage (0.51) (p <= 0.005, bootstrap).
Conclusions:
Both the Laplacian and bipolar montage were superior to the common average or referential montage in localizing CCEPs to gray matter. These montages may be more appropriate for interpreting CCEPs when using depth electrodes than the referential montage, which has typically been used in prior studies of CCEPs with subdural grids.
Keywords: Cortico-cortical evoked potentials, single pulse electrical stimulation, stereoelectroencephalography, Laplacian montage, brain connectivity
In patients undergoing intracranial work-up for epilepsy surgery, both low and high frequencies are used for clinical stimulation mapping to reproduce typical semiology or map eloquent cortex1–3. When low-frequency (~1 Hz) electrical stimulation is used, waveforms distant from the site of stimulation are observed, referred to as cortico-cortical evoked potentials (CCEPs)4. As with scalp recordings, intracranial recordings of evoked potentials have reproducible components labeled by latency. The typically identified early feature of a CCEP is the early negative (N1) peak, occurring between 10 to 50 ms after the stimulus4. This is usually recorded using an extracranial electrode as reference4,5. Most published CCEPs studies have used subdural grid arrays, where there is a fixed orientation of the electrode to the pyramidal cells in the crest of a gyrus – the main contributor to the recorded field potential6. However, subdural grids are now less commonly used than the penetrating depth electrodes employed in the stereoelectroencephalographic (SEEG) method. It is not clear how best to measure CCEPs amplitude in SEEG, where the relative orientation of pyramidal cells to the depth electrodes is inconsistent, leading to greater variability of the observed waveforms. One solution is to use the root-mean-squared (RMS) deviation computed in a time window after the stimulus is given7.
To our knowledge, there has been no systematic investigation of the effect of the recording montage on the measurement of CCEPs amplitude (as pointed out in a recent review5). Both referential and bipolar montages are commonly used in the visual interpretation of SEEG8, though the bipolar montage may be more effective for detecting the low amplitude fast activity characteristic of seizure onset in SEEG9. Though not commonly used for SEEG analysis, the Laplacian montage can be computed for a given contact on a linear array by subtracting the average of the two adjacent contacts (see Methods below).
Our long-term goal is understanding how best to localize the cortical generators of CCEPs. However, this is made difficult by the lack of ground truth in vivo connectivity data from humans. In this paper, we focus on the more straight-forward question of whether CCEPs localize to gray matter, rather than white matter. The motivating observation was that CCEPs recorded in a referential montage have large fields that include white matter adjacent to the presumed cortical source, sometimes also including adjacent gray matter. We assume that white matter CCEPs are due to volume conduction. But such volume conduction will also confound any attempt at precise cortical localization of CCEPs. If the morphology of a volume-conducted waveform is constant but its amplitude decays with distance, then the waveform should be attenuated in a Laplacian montage. In this study, our hypothesis is that the bipolar and Laplacian montages will better localize CCEPs to gray matter rather than white matter, which we regard as a necessary (though not sufficient) step towards accurately localizing the cortical generator.
METHODS
Consent and Participants
Data were analyzed from 8 patients with medically resistant epilepsy undergoing SEEG evaluations. All eight patients consented prospectively to electrical stimulation for research purposes (Table 1). Inclusion criteria for this study were the presence of appropriately placed electrodes targeting amygdala, hippocampus, or cingulate gyrus medially in addition to neocortex laterally, with at least one contact in between that was clearly located in white matter. We excluded patients who had undergone a prior medial temporal lobe surgery. The consent documentation and research protocols were approved by the Emory University Institutional Review Board.
Table 1.
Patient characteristics.
| Pt ID | Age | R/L | Sex | Epilepsy | Imaging | Treatment |
|---|---|---|---|---|---|---|
| 1 | 32 | L | F | TLE | B/l Enceph | Laser L TP |
| 2 | 53 | R | F | TLE | B/l Enceph | Laser L TP |
| 3 | 42 | R | F | TLE | Ab L A/HC | Laser L Hc |
| 4 | 32 | R | F | TLE | B/l Enceph | Laser R TP |
| 5 | 26 | R | M | TLE | R DNET* | DBS |
| 6 | 41 | R | F | TLE | Normal | Laser L A/Hc |
| 7 | 49 | R | F | TLE | Normal | DBS |
| 8 | 30 | R | F | FLE | L frontal tumor | Pending |
From left to right, columns represent the patient ID (Pt ID), age, right or left-handedness (R/L), gender (Sex), broad type of epilepsy (Epilepsy), lesions seen on imaging (Imaging), and the treatment strategy (Treatment). Surgical outcome was not included (and is not pertinent for this study) as none of these patients have yet had one-year post-surgical follow-up.
Patient 5 had a prior surgery targeting a right-sided temporal pole DNET.
Abbreviations: amygdala (A), deep brain stimulation (DBS), dysembryoplastic neuroepithelial tumor (DNET), encephalocele (Enceph.), frontal lobe epilepsy (FLE), hippocampus (Hc), PET hypometabolism (PET), temporal lobe epilepsy (TLE), temporal pole (TP).
Data Acquisition
An SEEG approach was used with patients implanted according to hypotheses generated from the combination of semiologic analysis, long term video-EEG monitoring, MRI, PET and other clinical data. A schematic for the electrode configuration is shown (Figure 1). Two electrode types were used for this study: (1) AdTech reduced-diameter depth electrodes, typically with 10 contacts and either 4 or 5 mm inter-contact spacing (h), 2.28 mm contact length (l), and 0.86 mm diameter (d), yielding a contact surface area of 6.19 mm2 (AdTech Medical, WI); and (2) Dixi depth electrodes, typically with 15 contacts and h = 3.5 mm, l = 2 mm, and d = 0.8 mm, yielding a contact surface area of 5.03 mm2 (Dixi Medical, MI). Stereotactic robotic planning software and a stereotactic robotic assistant (ROSA Surgical Robot, Zimmer Biomet, FL) were used to guide electrode placement under general anesthesia. Recordings were acquired with a Natus Quantum amplifier (Natus Neurology Incorporated, WI). Recordings commenced extra-operatively the following day at 1 or 2 kHz and were increased to 2 or 4 kHz for the duration of stimulation studies to reduce filter ringing on the stimulation artifact. We did not apply any additional post-hoc software filtering to the recording, though the hardware includes a high-pass filter (not configurable below 0.1 Hz) and an anti-aliasing filter. Recordings were made with respect to a system reference selected from a four-contact depth electrode placed in the subgaleal plane near the vertex of the head. Stimulation studies were performed after spontaneous seizures had been captured and after medications were resumed.
Figure 1. Linear electrode array schematic.

The depth electrodes used in this study can be described by their diameter d, the contact length l, and the inter-contact spacing h, measured from the center of each contact. The raw voltage recorded (referenced to an extracranial electrode) for the contact of interest is denoted z0, and the two adjacent electrodes are denoted z0−h and z0+h. See text for details of the two brands of electrodes used, and definition of the Laplacian montage using these terms.
Stimulation Parameters
Single pulse electrical stimulation was performed using bipolar stimulation between adjacent SEEG contacts with a symmetrical biphasic charged-balanced waveform, without an interphase delay, with standard parameters12 using a Natus Nicolet Cortical Stimulator (Natus Neurology Incorporated, WI). Parameters for stimulation were 300 μs/phase pulse width delivered at 1 Hz for 10–20 seconds per train and stimulus intensity titrated in 1 mA increments from 1.0 mA up to a maximum current of 6.0 mA for AdTech electrodes and 5.0 mA for Dixi electrodes though we only analyzed the two runs with maximal charge from each stimulation site). The maximum charge density (6 mA * 0.3 mS / 0.0618 cm2 = 29 μC/cm2 for AdTech; 5 mA * 0.3 mS / 0.05 cm2 = 30 μC/cm2 for Dixi) was chosen to match the recommended safety limit extrapolated from clinical deep brain stimulation (30 μC/cm2)10. Stimulation was applied to a variety of contact pairs of clinical interest, including both the medial and lateral temporal lobe.
Contact Localization
We limited our evaluation to trajectories which sampled two independent cortical areas, with white matter interposed in between, to emphasize the differences between gray matter and white matter. We localized contacts using a preoperative volumetric MRI (3 Tesla T1 MPRAGE sequence) and a post-operative axial volumetric computed tomography (CT) with thin cuts (0.625 mm slice thickness). Co-registration of the MRI and CT was done using CranialSuite (Neurotargeting LLC, TN). Contacts were coded as being in gray-matter (1), white-matter (0), or in the border-zone between them (0.5). Neurophysiologic data was not reviewed during contact localization.
Recording montages
The referential montage was defined as the voltage difference between each contact of interest when compared to a reference electrode (see above, in our case a subgaleal electrode near the vertex of the head). The common average montage was the difference between the contact of interest and the average of the voltage on all artifact-free contacts. The bipolar montage for each timepoint was computed as the voltage difference between two adjacent contacts.
The Laplacian montage is an approximation of the Laplacian operator, meaning it is the second spatial derivative of the recorded voltage11. Though calculating a Laplacian montage on the curved surface of the scalp is more complicated, the calculation is straight-forward on a Cartesian grid with equal spacing. For the linear electrode array, the Laplacian montage is equivalent to the current source density (CSD) calculation frequently used in fundamental neurophysiology13. An expression for the second spatial derivative using three points is given below13 (Equation 1) using the terms defined in Figure 1.
We compute the Laplacian montage for a linear array to be the voltage of a given contact (compared to the reference), minus the average of the voltage on the two adjacent contacts (Equation 2). The Laplacian montage is proportional to the second spatial derivative (Equation 1), and they are equal if the Laplacian is multiplied by the normalization constant −2/h2.
| (1) |
| (2) |
Analysis
CCEPs amplitude was measured as the root-mean squared (RMS)7 deviation from baseline in a window from 10 ms after the stimulus artifact to 50 ms after the artifact. This window was chosen to contain the traditional N1 peak4 but exclude the ringing artifact induced by the stimulus, which lasted up to 10 ms in our recording configuration. To assess reproducibility, we repeated the analysis for a window from 10 ms to 100 ms after the stimulus artifact, which would include the downstroke of the N1 peak, but might also include part of the N2 peak. We included all CCEPs waveforms from all analyzed stimulation runs; we did not threshold them or dichotomize CCEPS into “present” or “absent.”
In our first analysis, we directly compared the referential to the Laplacian montage using the same contacts on each linear electrode array. The most medial and lateral contacts, where the Laplacian was not defined, were omitted from this analysis. We examined two stimulation runs for each stimulated contact pair (bipolar stimulation as above on the stimulated electrode) which had the highest delivered current (up to 6 mA for Dixi, up to 5 mA for AdTech). For each stimulation run, in either referential or Laplacian montage, we took the mean of the RMS CCEPs amplitude across all gray matter contacts, and tested whether it was larger than the mean RMS amplitude on white matter contacts. For this analysis, we did not include contacts classified as in the border-zone between gray and white matter. The statistical null hypothesis was that there was an equal likelihood of gray being larger than white matter, or white matter being larger than gray. In this null case, the number of runs with CCEPs amplitude larger on gray than white matter should follow a binomial distribution with n equal to the number of stimulation runs and the probability p of gray > white being 0.5. This allows us to generate a p-value for each linear electrode array as to whether the number of runs with CCEPs larger on gray matter was significantly greater than chance. We then pooled the p-values across all 27 analyzed electrodes and tested whether the proportion of electrodes where gray matter CCEPs were significantly greater (at p < 0.05) than white matter was different when using a reference or a Laplacian montage. We tested whether this difference in proportions was statistically significant using Fisher’s exact test.
The above analysis did not examine the bipolar montage, which mathematically localizes to the midpoint of a contact pair. For the second analysis, we classified the anatomical location of each bipolar contact pair, with respect to gray and white matter, as the average of the classification of those two individual contacts. For example, if (1) contact A is gray, and contact B border-zone, then contact pair A-B is gray; if (2) contact A is white, contact B border-zone, then contact pair A-B is white; if (3) contact A is gray, contact B white, then contact pair A-B is border-zone. We then quantified the mean RMS amplitude for each classification (white, border-zone, gray) using each montage (reference, common average, bipolar, Laplacian). We then tested whether the montage means were significantly different between the four classifications using a one-way ANOVA, and derived p-values for pairwise comparisons from this ANOVA analysis using the Tukey-Kramer test.
The above analysis is limited by the fact that differences in statistical significance may not themselves be significant14,15. Therefore, in our last analysis we directly compared how well the CCEP amplitude on each contact (or contact pair) discriminated gray versus white matter, based on our blinded review of the post-implantation MRI. We quantified this using the area under the curve (AUC) of a receiver-operator characteristic (ROC) plot when using each of the montages (reference, bipolar or Laplacian). We assessed the significance of a difference of AUC by performing a bootstrap analysis: we combined the data from two groups, and then performed 100,000 random permutations to create an empirical distribution for the difference in AUC under the null hypothesis that the groups are the same. There were 6 unique pairwise comparisons between the 4 different montages, so to account for multiple comparisons we applied a Bonferroni correction (p<0.0083 to achieve statistical significance).
Software and Data Sharing
All analysis was done using custom-written scripts using MATLAB (Version R2016b, Mathworks, MA). Our code used for analysis and datafiles containing the averaged CCEPs for each participant can be accessed in the following public depository: https://github.com/epilepsylab/CCEPs-Tools.
RESULTS
Across eight patients, we examined a total of 27 electrode arrays with 10–15 contacts each, yielding a total of 321 contacts analyzed: 169 of 321 (53%) contacts were classified (during blinded review of neuroimaging) as being in gray matter, 72 of 321 (22%) in white matter, and 80 of 321 (25%) in the border-zone between white and gray. Examples of averaged CCEPs from a single stimulation run are illustrated for a 10-contact AdTech electrode array (Figure 2) and a 15-contact Dixi electrode array (Figure 3). Note that there are CCEPs waveforms visible in white matter contacts (#6–8 in Figure 2, #6–9 in Figure 3) when using a referential montage, but that they are attenuated in a bipolar montage or Laplacian montage.
Figure 2. CCEPs recorded on a 10-contact electrode targeting amygdala in Patient 6.

Left: A T1 MRI co-registered with post-operative CT scan. For the electrode of interest, from medial to lateral, contacts #1–5 were classified as gray matter (highlighted in yellow, contacts 2–5 are in the amygdala), contacts #6–8 as white matter, and contacts #10 as gray matter (in the middle temporal gyrus). Contact #9 was classified as border-zone between white and gray matter. Middle: Averaged CCEPs are displayed in common average, referential, bipolar and Laplacian montage, when stimulating the anterior hippocampus. The baseline is shown (from 100 ms before to 1 ms before the stimulus). The stimulus itself (0 to 10 ms after the stimulus) is depicted as a gray bar. CCEPs are shown from 10 ms after the stimulus to 500 ms afterward. Stimulation was bipolar and biphasic, with pulse width 300 μS and current 6 mA. Note that in referential and common average montage, CCEPs are visible on every contact, including those in white matter (#6–8). However, the CCEPs waveforms in white matter are attenuated in the bipolar montage and abolished in the Laplacian montage. This appears to be a CCEP generated in the amygdala and propagating laterally. Right: A close-up of MRI/CT co-registration along the electrode trajectory, rotated and aligned with CCEPs.
Figure 3. CCEPs recorded on a 15-contact electrode targeting the hippocampus in Patient 1.
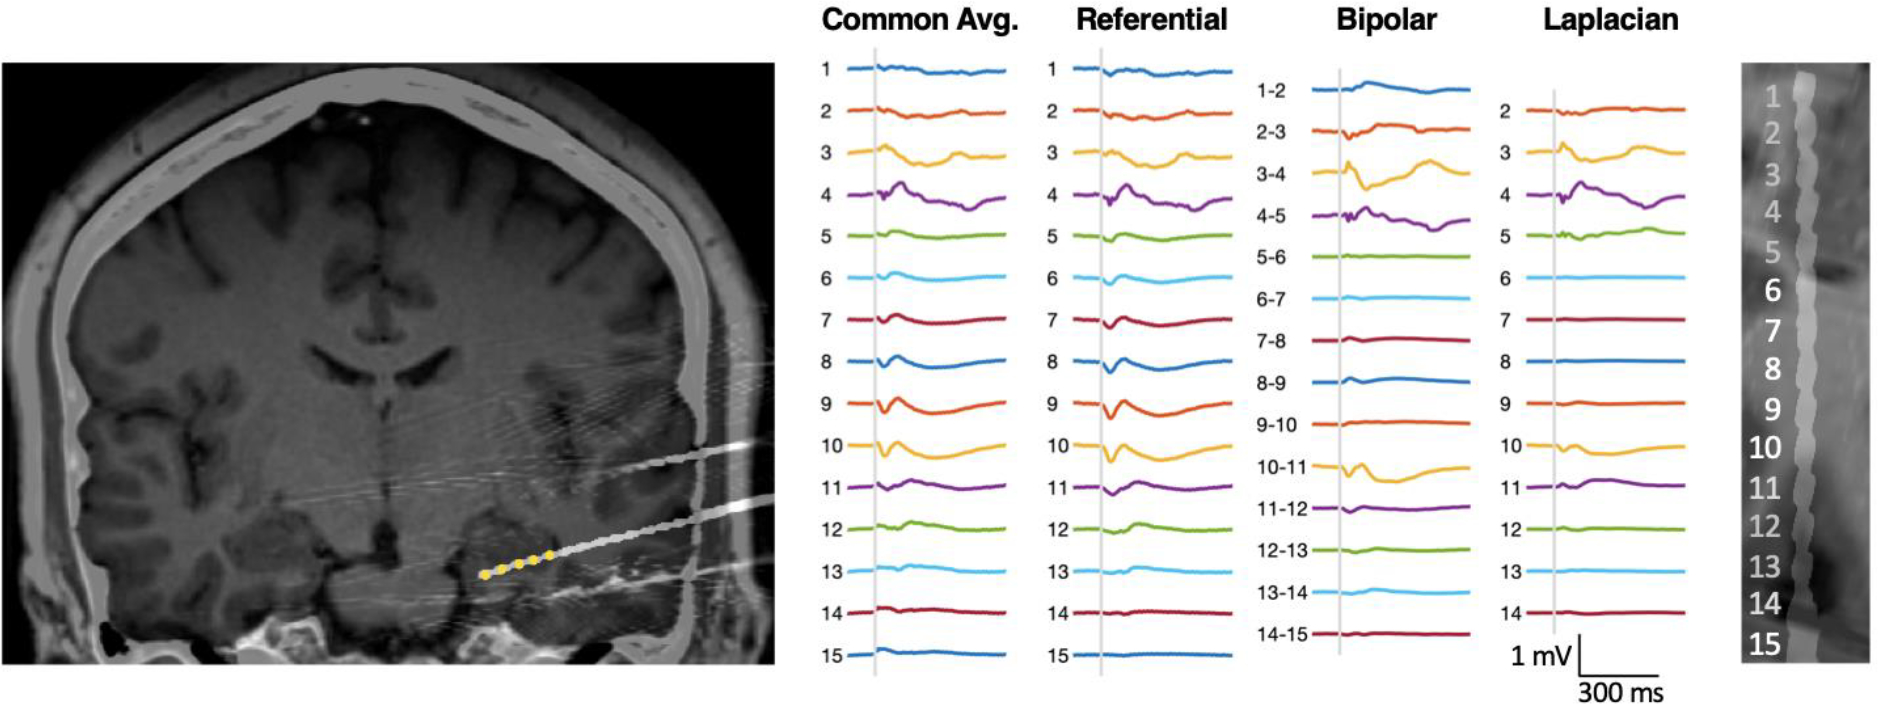
Left: A T1 MRI co-registered with post-operative CT scan. For the electrode of interest, from medial to lateral, contacts #1–5 were classified as gray matter (highlighted in yellow, contacts 1–5 are in the hippocampal formation), contacts #6–9 as white matter, and contacts #11–14 as gray matter (in the inferior temporal sulcus). Contact #10 was classified as in the border-zone between white and gray matter, and contact #15 was classified as outside of the brain (based on blinded review of neuro-imaging) and excluded from analysis. Middle: Averaged CCEPs are displayed in common average, referential, bipolar and Laplacian montage, when stimulating the temporal pole. The baseline is shown (from 100 ms before to 1 ms before the stimulus). The stimulus itself (0 to 10 ms after the stimulus) is depicted as a gray bar. CCEPs are shown from 10 ms after the stimulus to 500 ms afterward. Stimulation was bipolar and biphasic, with pulse width 300 μS and current 5 mA. Note that in common average and referential montage, CCEPs are visible on most contacts, including those in white matter (#6–9). However, the CCEPs waveforms in white matter are attenuated in the bipolar montage and abolished in the Laplacian montage. CCEPs appear to be generated independently in the hippocampus and lateral neocortex. Right: A close-up of MRI/CT co-registration along the electrode trajectory, rotated and aligned with CCEPs.
We tested whether CCEPs better discriminate gray from white matter using the Laplacian montage for each electrode array. For each stimulation run, we tested whether the CCEP amplitude was greater on gray matter than white matter. For the example in Figure 2, the mean RMS amplitude in referential montage for gray matter contacts #2–5 (85 μV) was less than the mean RMS amplitude on white matter contacts #6–8 (117 μV). However, in Laplacian montage the mean RMS amplitude for gray matter contacts #2–5 (46 μV) was larger than the mean RMS amplitude for white matter contacts #6–8 (11 μV). Across 94 stimulation runs, using the referential montage, only 29 of 94 runs had an RMS amplitude larger on gray matter than white matter (p = 0.99, binomial). In contrast, using the Laplacian montage 82 of 94 runs had an RMS amplitude larger on gray matter (p < 0.0001, binomial). For this electrode array, the Laplacian montage was significantly better than the referential montage at localizing gray matter.
Pooling across all 27 electrode arrays from all eight patients, 25 of 27 (93%) electrodes had a significantly higher (p < 0.05) mean RMS amplitude on gray matter than white matter when using the Laplacian montage, compared to only 12 of 27 (44%) electrodes when using the referential montage (Figure 4). The proportion of significant electrodes is itself significantly different between the Laplacian and reference montage (p = 0.0003, Fisher’s exact test).
Figure 4. CCEP amplitude is larger in gray matter when using Laplacian montage.

25 of 27 (93%) electrodes had a significantly higher (p < 0.05) mean RMS amplitude on gray matter than white matter when using the Laplacian montage. This proportion was significantly higher (p = 0.0003, Fisher’s exact test) than the 12 of 27 (44%) of electrodes with significantly higher gray matter RMS amplitude when using the traditional referential montage. Error bars indicate one standard error of the mean.
We next examined the ability of each montage (referential, common average, bipolar and Laplacian) to discriminate gray from white matter on individual contacts or contact-pairs (Figure 5). The mean CCEP amplitudes for each contact classification (gray, white, border-zone) and montage are given in Table 1 and displayed in Figure 5A. We used the AUC of the ROC curve to quantify how well each montage can discriminate gray from white matter. The AUC of the Laplacian montage was 0.79, which was significantly higher than the AUC for the common average montage of 0.56 (p < 0.0001, boot-strap) or the AUC for the referential montage of 0.51 (p < 0.0001, boot-strap). The AUC of the bipolar montage of 0.72 was also significantly higher than the common average (p = 0.005, boot-strap) or the referential montage (p < 0.0001, boot-strap). These comparisons remain statistically significantly after a Bonferroni correction is applied. However, the AUC of the Laplacian and bipolar montages were not significantly different (p = 0.19), and the AUC of the common average and referential montage were not significantly different (p = 0.37).
Figure 5. Bipolar and Laplacian montage better discriminate gray from white matter than reference.
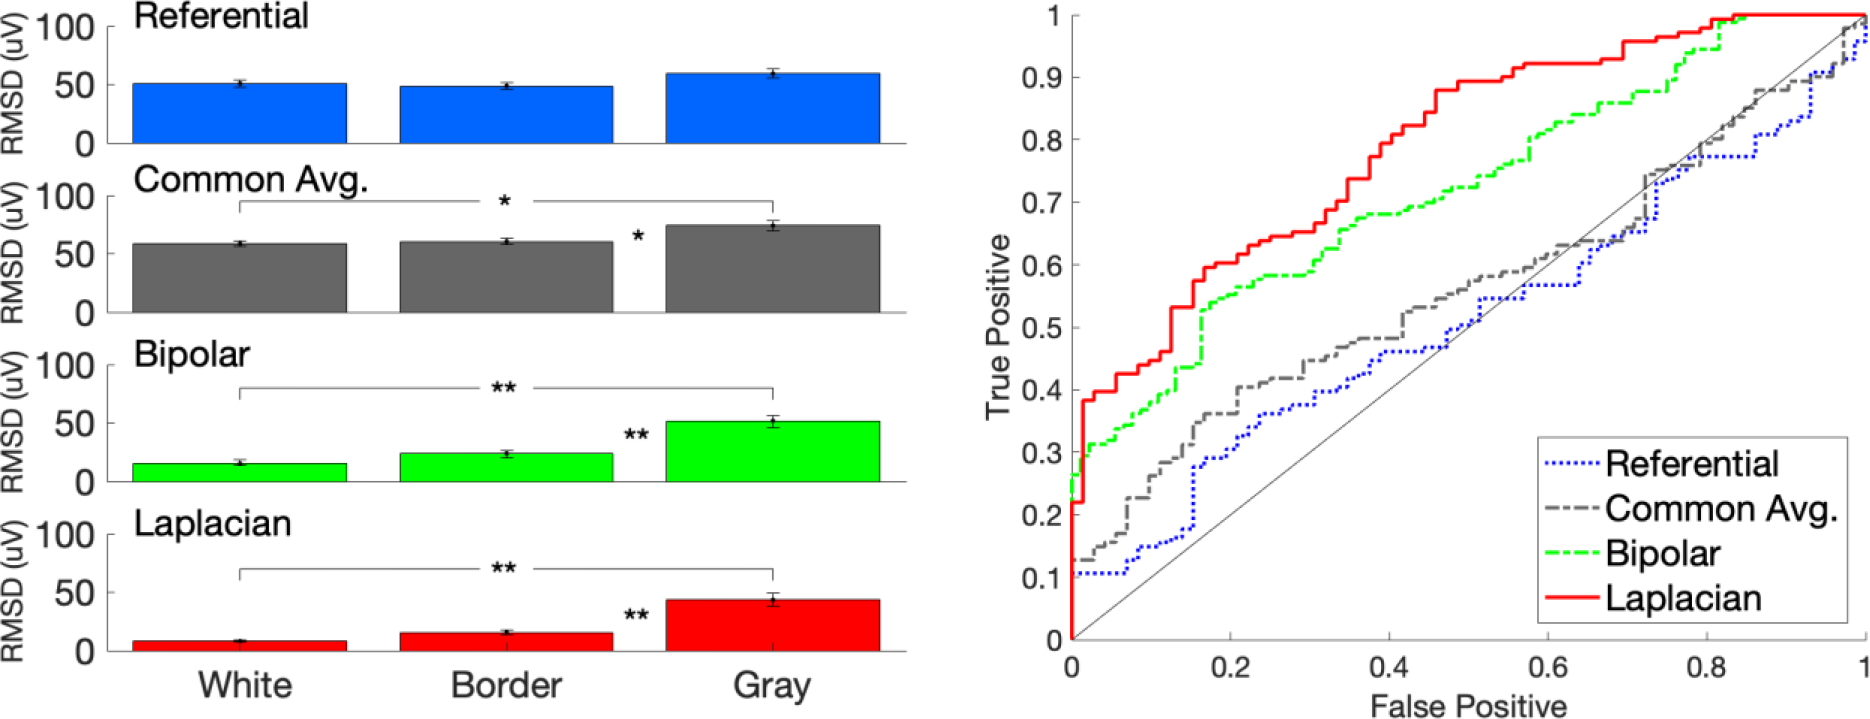
Left: The mean CCEP amplitude, measured as root-mean squared (RMS) deviation from baseline, is shown for white matter, border-zone, or gray matter when using either the referential, common average, bipolar, or Laplacian montage (** indicates p < 0.01, ANOVA pairwise comparison). Error bars indicate one standard error of the mean. Right: The ability of each montage to discriminate gray matter from white matter is quantified by receiver operator characteristic (ROC) curves, where the black dotted diagonal represents chance discrimination. The area under the curve (AUC) was significantly higher for the Laplacian (0.79) and the bipolar montages (0.72), when compared to the common average (0.56) or referential montages (0.51) (p <= 0.005, boot-strap).
To assess reproducibility, we repeated the analysis but calculated the RMS deviation in a window from 10 ms to 100 ms after the stimulus, in addition to the above window 10 to 50 ms. The results were nearly identical. 25/27 (93%) electrode contacts had a significantly higher mean amplitude when in gray matter than in white matter using a Laplacian montage, compared to 11/27 (41%) electrodes when using a referential montage (p < 0.0001, Fisher exact test). The AUC for classifying gray versus white matter was significantly higher for either the Laplacian (0.80) or the bipolar montage (0.74) when compared to either the common average (0.57) or the referential montage (0.54) (p <= 0.003, bootstrap).
DISCUSSION
In this study, we show that well-formed CCEPs can be seen on contacts located in white matter when using a referential montage with depth electrodes. This problem can be ameliorated by using a bipolar or Laplacian montage, as both were significantly better than a referential montage at discriminating gray matter from white matter (see Figure 5B). Our conclusion is that if CCEPs are being used with depth electrodes to understand cortico-cortical connectivity, then a bipolar or Laplacian montage is preferred for precise cortical localization. Using a referential montage could potentially confound connectivity analysis by incorrectly localizing the generator to adjacent gray matter. Our results are broadly consistent with a prior results by Schalk and colleagues that that the Laplacian montage better localizes focal neuronal activity seen during a motor task recorded using SEEG electrodes16. However, we are not aware of any prior studies testing the effect of recording montage on CCEPs amplitude.
We did not show a significant difference between the bipolar or Laplacian montage in gray-white discrimination. The bipolar montage is more commonly used in analysis of SEEG, particularly for the analysis of seizure onsets. However, the Laplacian montage has the advantage of localizing to a specific contact, rather than between a contact pair as in the bipolar montage. The Laplacian montage also has the advantage of showing the peak as a waveform with the same polarity as the referential montage (see Figure 2, contact 2 and Figure 3, contact 4), whereas as bipolar montage shows a phase reversal at the peak.
The Laplacian montage has the disadvantage of not being clearly defined at the endpoints, and thus could lead to a false negative if the peak of a spike waveform was at the edge of a linear array. One proposed solution from current source density analysis is to create extra hypothetical contacts beyond the endpoints which have the same voltage as the endpoints for use in computing the second derivative17. When using the Laplacian montages, it may be beneficial to also visualize CCEPs on the referential montage to better understand activity on the first and last contacts. For example, the largest CCEP in Figure 2 is contact 2 on Laplacian, but since there is no Laplacian defined on contact 1, it is not clear that this is the true peak. However, contact 2 clearly has the largest amplitude on the referential montage, clarifying that this is actually a local maximum.
There has previously been discussion regarding the choice of referential versus bipolar montage in relation to SEEG in general18, but we argue that the choice of montage is also of paramount importance when localizing CCEPs. While the scalp Laplacian can make large field potentials appear focal, the small size of regions of interest in SEEG (typically confined to cortical thickness at 1.5 to 4.5 mm) make the Laplacian montage an appealing candidate for examining evoked potentials in SEEG. In contrast, the extent of volume conduction can be dramatic when using a referential montage. For example, a CCEPs waveform noted in the amygdala on a Laplacian montage is still associated with a visible waveform 4 cm away on a referential montage (see Figure 2). Future CCEPs studies will need to take this effect into account, particularly if using penetrating depth electrodes. We did not analyze high frequency activity (HFA) riding on top of CCEPs19, though other studies have reported that HFA is increased inside the seizure onset zone20,21. However, we anticipate that the choice of recording montage would also affect the localization of HFA.
The interplay between CCEPs and distance is not fully understood. A few studies have reported that CCEPs amplitude is inversely proportional to the Euclidean distance between the stimulating and recording electrode22,23. However, this relationship has not been quantified, and Euclidean distance may underestimate the path traversed by axons in order to produce local evoked potentials. We hypothesize that simple heuristics may be useful –we conjecture that CCEPs larger than expected for their Euclidian distance from the stimulation site may reliably identify true anatomic connections. Ultimately, more work will be required for a deeper understanding of the components of the CCEPs, including modeling of how the dipole generator interacts with the conductive tissue of the brain and location of the recording depth electrode.
Table 2.
CCEP amplitude in gray vs. white matter by montage type.
| CCEP amplitude (μV) | T-test p-values | |||||
|---|---|---|---|---|---|---|
| White (W) | Border (B) | Gray (G) | W vs. B | W vs. G | B vs. G | |
| Referential | 51 | 49 | 59 | 0.95 | 0.32 | 0.15 |
| Common Avg | 59 | 61 | 74 | 0.96 | 0.02 | 0.04 |
| Bipolar | 15 | 24 | 52 | 0.65 | <0.0001 | 0.006 |
| Laplacian | 8 | 16 | 44 | 0.60 | <0.0001 | 0.0001 |
The first 3 columns give values for the mean CCEP root-mean squared (RMS) amplitude, computed for white matter (W), border-zone (B), or gray matter (G) when using either the referential, bipolar, or Laplacian montage. The last 3 columns give p-values for the ANOVA pairwise comparisons (using the Tukey-Kramer test) of the means between white matter and border-zone (W vs. B), border-zone and gray matter (B vs. G), and white matter and gray matter (W vs. G).
Acknowledgements
We would like to thank Dr. Robert Gross for serving as the senior mentor for the T32 grant which partially supported this work.
Funding.
This was work was supported by the T32 NS748019 (ASD), the Woodruff Foundation and K08 NS105929 (NPP), and R01 NS088748 (DLD).
Footnotes
Disclosures
Conflicts of Interest. NPP has served as a consult and is on the scientific advisory board of Dixi Medical USA. DLD has served as a consultant to Neuropace. and serves as the Core Lab Director of the Clinical Study of Stereotactic Laser Ablation of Temporal Lobe Epilepsy (SLATE) conducted by Medtronic. These companies manufacture products related to research described in this paper. The terms of these arrangements have been reviewed and approved by Emory University in accordance with its conflict of interest policies.
REFERENCES
- 1.Cuello Oderiz C, von Ellenrieder N, Dubeau F, et al. Association of Cortical Stimulation–Induced Seizure With Surgical Outcome in Patients With Focal Drug-Resistant Epilepsy. JAMA Neurol. 2019;76(9):1070. doi: 10.1001/jamaneurol.2019.1464 [DOI] [PMC free article] [PubMed] [Google Scholar]
- 2.Kovac S, Kahane P, Diehl B. Seizures induced by direct electrical cortical stimulation – Mechanisms and clinical considerations. Clinical Neurophysiology. 2016;127(1):31–39. doi: 10.1016/j.clinph.2014.12.009 [DOI] [PubMed] [Google Scholar]
- 3.Trébuchon A, Chauvel P. Electrical Stimulation for Seizure Induction and Functional Mapping in Stereoelectroencephalography: Journal of Clinical Neurophysiology. 2016;33(6):511–521. doi: 10.1097/WNP.0000000000000313 [DOI] [PubMed] [Google Scholar]
- 4.Matsumoto R, Kunieda T, Nair D. Single pulse electrical stimulation to probe functional and pathological connectivity in epilepsy. Seizure. 2017;44:27–36. doi: 10.1016/j.seizure.2016.11.003 [DOI] [PMC free article] [PubMed] [Google Scholar]
- 5.Prime D, Rowlands D, O’Keefe S, Dionisio S. Considerations in performing and analyzing the responses of cortico-cortical evoked potentials in stereo-EEG. Epilepsia. 2018;59(1):16–26. doi: 10.1111/epi.13939 [DOI] [PubMed] [Google Scholar]
- 6.Gloor P Neuronal generators and the problem of localization in electroencephalography: application of volume conductor theory to electroencephalography. Journal of Clinical Neurophysiology. 1985;2(4):327–354. [DOI] [PubMed] [Google Scholar]
- 7.Lega B, Dionisio S, Flanigan P, et al. Cortico-cortical evoked potentials for sites of early versus late seizure spread in stereoelectroencephalography. Epilepsy Research. 2015;115:17–29. doi: 10.1016/j.eplepsyres.2015.04.009 [DOI] [PubMed] [Google Scholar]
- 8.Isnard J, Taussig D, Bartolomei F, et al. French guidelines on stereoelectroencephalography (SEEG). Neurophysiologie Clinique. 2018;48(1):5–13. doi: 10.1016/j.neucli.2017.11.005 [DOI] [PubMed] [Google Scholar]
- 9.Grinenko O, Li J, Mosher JC, et al. A fingerprint of the epileptogenic zone in human epilepsies. Brain. 2018;141(1):117–131. doi: 10.1093/brain/awx306 [DOI] [PMC free article] [PubMed] [Google Scholar]
- 10.Cogan SF, Ludwig KA, Welle CG, Takmakov P. Tissue damage thresholds during therapeutic electrical stimulation. J Neural Eng. 2016;13(2):021001. doi: 10.1088/1741-2560/13/2/021001 [DOI] [PMC free article] [PubMed] [Google Scholar]
- 11.Hjorth B An on-line transformation of EEG scalp potentials into orthogonal source derivations. Electroencephalography and Clinical Neurophysiology. 1975;39(5):526–530. doi: 10.1016/0013-4694(75)90056-5 [DOI] [PubMed] [Google Scholar]
- 12.Ferree TC, Srinivasan R. Theory and Calculation of the Scalp Surface Laplacian. Technical report Electrical Geodesics, Inc. Published online 2000. [Google Scholar]
- 13.Freeman JA, Nicholson C. Experimental optimization of current source-density technique for anuran cerebellum. Journal of Neurophysiology. 1975;38(2):369–382. doi: 10.1152/jn.1975.38.2.369 [DOI] [PubMed] [Google Scholar]
- 14.Gelman A, Stern H. The Difference Between “Significant” and “Not Significant” is not Itself Statistically Significant. The American Statistician. 2006;60(4):328–331. doi: 10.1198/000313006X152649 [DOI] [Google Scholar]
- 15.Nieuwenhuis S, Forstmann BU, Wagenmakers E-J. Erroneous analyses of interactions in neuroscience: a problem of significance. Nat Neurosci. 2011;14(9):1105–1107. doi: 10.1038/nn.2886 [DOI] [PubMed] [Google Scholar]
- 16.Li G, Jiang S, Paraskevopoulou SE, et al. Optimal referencing for stereo-electroencephalographic (SEEG) recordings. NeuroImage. 2018;183:327–335. doi: 10.1016/j.neuroimage.2018.08.020 [DOI] [PMC free article] [PubMed] [Google Scholar]
- 17.Vaknin G, DiScenna PG, Teyler TJ. A method for calculating current source density (CSD) analysis without resorting to recording sites outside the sampling volume. Journal of Neuroscience Methods. 1988;24(2):131–135. doi: 10.1016/0165-0270(88)90056-8 [DOI] [PubMed] [Google Scholar]
- 18.Lachaux JP, Rudrauf D, Kahane P. Intracranial EEG and human brain mapping. Journal of Physiology-Paris. 2003;97(4–6):613–628. doi: 10.1016/j.jphysparis.2004.01.018 [DOI] [PubMed] [Google Scholar]
- 19.Crowther LJ, Brunner P, Kapeller C, et al. A quantitative method for evaluating cortical responses to electrical stimulation. Journal of Neuroscience Methods. 2019;311:67–75. doi: 10.1016/j.jneumeth.2018.09.034 [DOI] [PMC free article] [PubMed] [Google Scholar]
- 20.Kobayashi K, Matsumoto R, Matsuhashi M, et al. High frequency activity overriding cortico-cortical evoked potentials reflects altered excitability in the human epileptic focus. Clinical Neurophysiology. 2017;128(9):1673–1681. doi: 10.1016/j.clinph.2017.06.249 [DOI] [PubMed] [Google Scholar]
- 21.Kundu B, Davis TS, Philip B, et al. A systematic exploration of parameters affecting evoked intracranial potentials in patients with epilepsy. Brain Stimulation. 2020;13(5):1232–1244. doi: 10.1016/j.brs.2020.06.002 [DOI] [PMC free article] [PubMed] [Google Scholar]
- 22.Entz L, Tóth E, Keller CJ, et al. Evoked effective connectivity of the human neocortex: Evoked Effective Connectivity of Neocortex. Hum Brain Mapp. 2014;35(12):5736–5753. doi: 10.1002/hbm.22581 [DOI] [PMC free article] [PubMed] [Google Scholar]
- 23.Zhao C, Liang Y, Li C, et al. Localization of Epileptogenic Zone Based on Cortico-Cortical Evoked Potential (CCEP): A Feature Extraction and Graph Theory Approach. Front Neuroinform. 2019;13:31. doi: 10.3389/fninf.2019.00031 [DOI] [PMC free article] [PubMed] [Google Scholar]