Abstract
Activated B-cell-like diffuse large B-cell lymphomas (ABC-DLBCLs) are characterized by constitutive activation of nuclear factor κB driven by the B-cell receptor (BCR) and Toll-like receptor (TLR) pathways. However, BCR-pathway-targeted therapies have limited impact on DLBCLs. Here we used >1,100 DLBCL patient samples to determine immune and extracellular matrix cues in the lymphoid tumour microenvironment (Ly-TME) and built representative synthetic-hydrogel-based B-cell-lymphoma organoids accordingly. We demonstrate that Ly-TME cellular and biophysical factors amplify the BCR–MYD88–TLR9 multiprotein supercomplex and induce cooperative signalling pathways in ABC-DLBCL cells, which reduce the efficacy of compounds targeting the BCR pathway members Bruton tyrosine kinase and mucosa-associated lymphoid tissue lymphoma translocation protein 1 (MALT1). Combinatorial inhibition of multiple aberrant signalling pathways induced higher antitumour efficacy in lymphoid organoids and implanted ABC-DLBCL patient tumours in vivo. Our studies define the complex crosstalk between malignant ABC-DLBCL cells and Ly-TME, and provide rational combinatorial therapies that rescue Ly-TME-mediated attenuation of treatment response to MALT1 inhibitors.
Diffuse large B-cell lymphomas (DLBCLs) are aggressive tumours that are transcriptionally classified into activated B-cell-like (ABC) and germinal centre B-cell-like (GCB) subtypes or into subclasses based on coordinate genetic signatures1,2. ABC-DLBCL is associated with unfavourable clinical outcomes in ~40% of patients after frontline chemoimmunotherapy3,4, requiring the development of new targeted therapies. The growth of ABC-DLBCL cells depends on constitutive activation of nuclear factor κB (NF-κB) through dysregulation of the B-cell receptor (BCR) and toll-like receptor (TLR) pathways1,5, prompting investigations into inhibitors targeting these pathways6,7. Ibrutinib, an irreversible inhibitor of Bruton’s tyrosine kinase (BTK), displayed activity in clinical trials in ABC-DLBCL patients whose tumours harboured CD79 mutations, but produced responses in only 37% of ABC-DLBCL cases, with decreased efficacy in tumours exhibiting downstream mutations such as in caspase-recruitment-domain-containing protein 11 (CARD11)6. Unfortunately, the mechanisms through which ABC-DLBCLs are resistant to current therapies are not fully understood.
The BCR and TLR pathways are activated in part due to hallmark ABC-DLBCL mutations (for example, CD79A/B, myeloid differentiation primary response 88 (MYD88), CARD11, and others)8,9. However, the chronic signalling induced by these mutations is relatively weak and they serve as amplifiers of signals when the BCR is stimulated. The combination of CARD11, B-cell lymphoma/leukaemia 10 (BCL10) and mucosa-associated lymphoid tissue lymphoma translocation protein 1 (MALT1), referred to as the CBM complex10, integrates signals from BCR, TLR and phosphoinositide 3-kinase (PI3K) signalling pathways to activate NF-κB and presents a downstream target to bypass upstream mutations5. MALT1 is necessary for ABC-DLBCL proliferation and survival, inducing signalling as a scaffold protein in IκB kinase complex activation11 and as a human paracaspase that cleaves inhibitors of NF-κB5,10,12. MALT1 also has a structurally unique enzymatic pocket, offering the possibility of developing targeted inhibitors with high specificity, potentially impacting a broad range of ABC-DLBCL patients5,10,13. The irreversible MALT1 catalytic pocket inhibitor MI210 and a peptidomimetic inhibitor13 display activity against ABC-DLBCLs in vitro and in vivo. Compounds that inhibit MALT1 through an allosteric, reversible mechanism have also been reported14. Consequently, the MALT1 inhibitors are rapidly translating to first-in-human clinical trials (ClinicalTrials.gov identifier NCT03900598). However, lymphomas can engage feedback mechanisms through microenvironmental signatures15–17 that could limit the activity of signalling pathway inhibitors, including the MALT1 inhibitors5. Although we recognize that the lymphoid tumour microenvironment (Ly-TME) is composed of immune cells, stromal cells and extracellular matrix (ECM), we do not yet understand the impact of Ly-TME components on the CBM complex, their cooperation with constitutively active pathways in ABC-DLBCLs, or their effect on the efficacy of inhibitors and/or agonists aimed at suppressing these networks.
Here, we defined putative Ly-TME cues present in tumours from ABC-DLBCL patients. We hypothesized that complex growth signals from the Ly-TME amplify BCR and TLR signalling pathways in ABC-DLBCLs, causing attenuation of the therapeutic response to BCR pathway inhibitors. Using the molecular information from combined >1,100 patient samples across multiple cohorts, we developed synthetic-hydrogel-based lymphoma organoids to study individual and combinatorial contributions of Ly-TME cues to MALT1 signalling. We identified hydrogel conditions that sustain the survival of lymphomas and Ly-TME components that amplify BCR and TLR signalling, causing attenuation of the therapeutic response to MALT1 inhibitors. We used the hydrogel-based lymphoma organoids to define subsequent combination therapy regimens that overcome Ly-TME-mediated attenuation to MALT1 inhibition, which were consistent with an enhanced antitumour effect in vivo.
CD4 T cell and CD40L are abundant in ABC-DLBCLs
CD4+ T cells play a critical role in inducing B-cell activation in B-cell follicles through proteins in the immune synapse, including the CD40 ligand (CD40L), which interacts with CD40 expressed on B cells. CD40L is critical for B-cell differentiation in germinal centres and activates both canonical and non-canonical NF-κB signalling18–20. However, the effect of CD40L on ABC-DLBCL signalling and response to MALT1 inhibitors is not well understood. We found that CD4+ T cells were abundant in tissue biopsies of patients from the British Columbia Cancer Registry21 within both ABC-DLBCL (n = 96) and GCB-DLBCL (n = 163) subtypes (Fig. 1a,b). Analysis of RNA-sequencing profiles of ABC-DLBCLs (n = 242) and GCB-DLBCLs (n = 264) collected from 765 patients in the Hematologic Malignancies Research Consortium22 (HMRC, European Genome–Phenome Archive EGAS00001002606) demonstrated a high expression of CD40L and CD40 in whole-tumour tissues from both DLBCL subtypes (Fig. 1c,d). We verified these results in a second patient cohort from the National Cancer Institute (NCI) that included 243 ABC-DLBCLs and 138 GCB-DLBCLs1,9 (Supplementary Fig. 1a).
Fig. 1 |. CD4 T-cell abundance in ABC-DLBCLs and development of bioengineered lymphoma organoids.
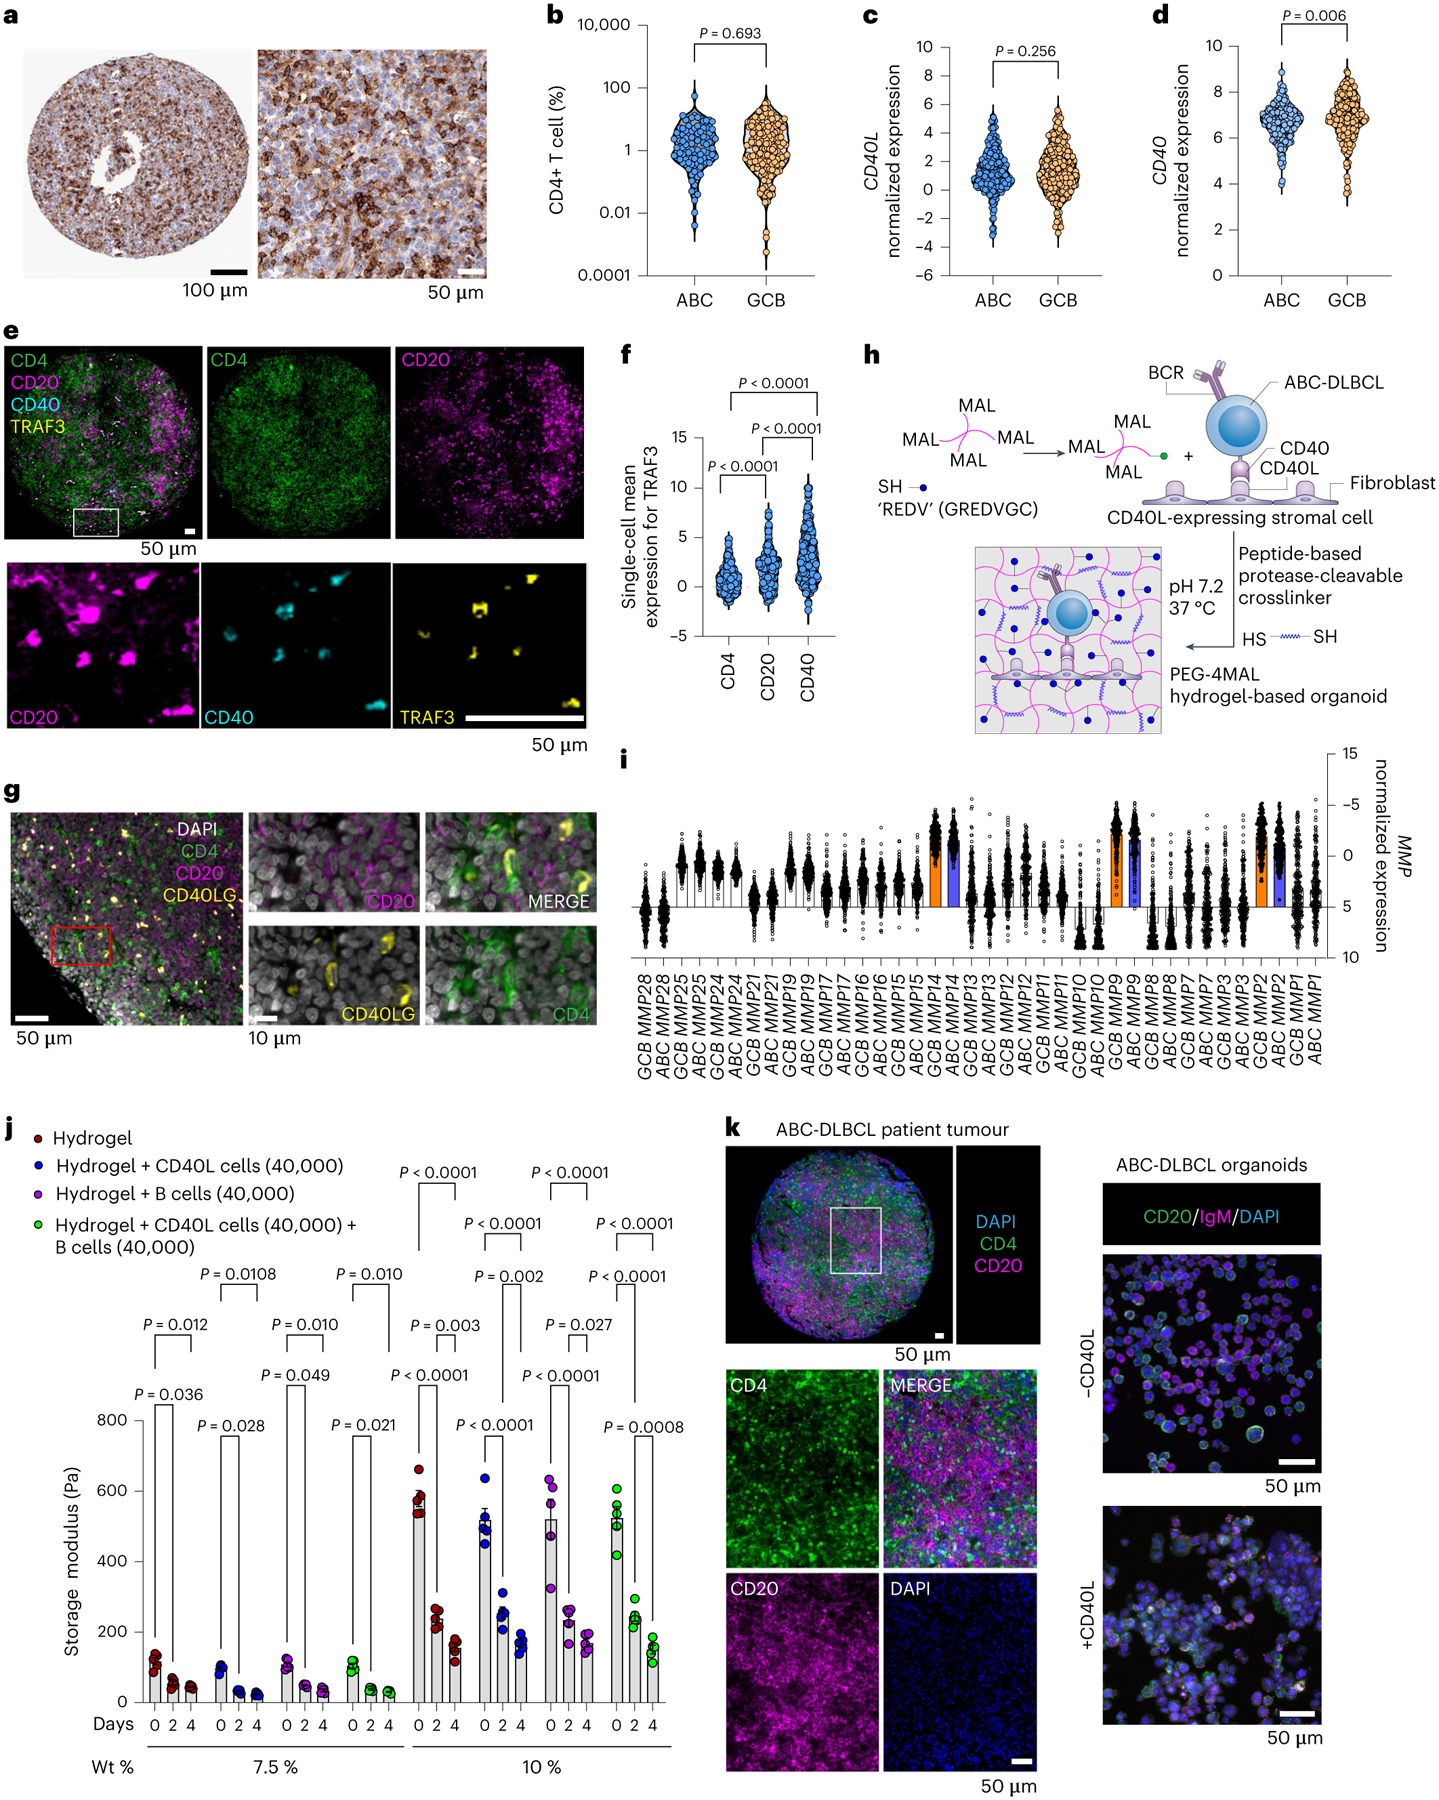
a, Immunohistochemistry of CD4+ T cells (brown) in ABC-DLBCL patient tissue biopsy. b, Violin plot of CD4+ cell percentage in ABC-DLBCL (n = 96) and GCB-DLBCL (n = 163) patient tissue biopsies. Two-tailed unpaired t-test. c,d, Gene expression of CD40L (c) and CD40 (d) in ABC-DLBCL (n = 242) and GCB-DLBCL (n = 264) patients from the HMRC cohort. Data were quantile normalized and log2 transformed. Two-tailed unpaired t-test. e, Immunofluorescence of an ABC-DLBCL tumour biopsy for CD4 (green), CD20 (magenta), CD40 (cyan) and TRAF3 (yellow). Images are representative of n = 5 primary tumour biopsies. f, Violin plot of single-cell mean expression of CD4, CD20 and CD40 for TRAF3+ cells for n = 5 primary tumour biopsies from ABC-DLBCL patients. One-way ANOVA with Tukey’s multiple comparison test. g, Immunofluorescence of an ABC-DLBCL tumour biopsy for CD4 (green), CD20 (magenta), CD40L (yellow) and DAPI (white). Images represent n = 5 primary tumour biopsies from ABC-DLBCL patients. h, Schematic of PEG-4MAL-hydrogel-based organoids with protease-degradable crosslinkers (spring) functionalized with adhesive peptides (blue). Hydrogels encapsulated lymphoma cells (blue) and stromal cells (purple). i, Distribution of gene expression of MMPs in primary human ABC-DLBCL (n = 242) and GCB-DLBCL (n = 264) samples from the HMRC cohort. Data represent mean ± s.e.m. and colour-coded MMPs are upregulated, with ABC-DLBCL in blue and GCB-DLBCL in orange. j, Storage modulus of hydrogels for different polymer densities. Two-way ANOVA with Tukey’s multiple comparison test. Data represent mean ± s.e.m., n = 5, where each dot represents a hydrogel. k, Left: immunofluorescence of an ABC-DLBCL tumor biopsy for CD4 (green), CD20 (magenta) and DAPI (blue). Images represent n = 5 primary tumor biopsies from ABC-DLBCL patients. Right: confocal microscopy maximum intensity projection of PEG-4MAL-hydrogel-based organoids with ABC-DLBCL cell line HBL1 (CD20, green), BCR (IgM, magenta) and nucleus (DAPI, blue). Images are representative of n = 3 organoids.
The CD40 signalling is mediated by tumor necrosis factor receptor-associated factor 3 (TRAF3) where the CD40 fragment binds as a hairpin loop across the surface of TRAF323. To confirm the expression of CD40 and TRAF3 in patient tumour biopsies, we performed cyclic immunofluorescence protein imaging and observed that TRAF3 was co-expressed in the cells that expressed CD20 and CD40 (Fig. 1e). Single-cell image analysis across five ABC-DLBCL tumour biopsies indicated that TRAF3 was highly expressed in cells that co-expressed CD20 and CD40 (Fig. 1f). Furthermore, CD40L-expressing CD4+ T cells were found in the vicinity of CD20-expressing cells (Fig. 1g).
Modular lymphoma organoids form patient tumour-like structure
To understand the role of CD40L in ABC-DLBCL growth and response to MALT1 inhibition, we engineered a stromal T-cell mimic, a mouse fibroblast transduced to express human CD40L on the surface (Supplementary Fig. 1b), and encapsulated these cells along with DLBCL cells in a synthetic hydrogel. The hydrogels were composed of maleimide end-functionalized 4-arm polyethylene glycol (PEG-4MAL)24,25. We functionalized the MAL groups of PEG-4MAL with cysteine-terminated, integrin-binding adhesive peptides through a Michael-type addition reaction24,26 (Fig. 1h). Since follicular dendritic cells in B-cell follicles express Vascular Cell Adhesion Molecule (VCAM-1)25,27, we initially used ‘REDV’ (GREDVGC) peptide, which mimics VCAM-1 for binding to integrin α4β1 (ref.28), including on B cells25. VCAM-1 was indeed expressed in both ABC- and GCB-DLBCL patient tumours (Supplementary Fig. 1c) and integrin β1 protein was expressed in most ABC-DLBCL cells (Supplementary Fig. 1d).
We crosslinked hydrogel macromer with protease-degradable crosslinker peptide and non-degradable crosslinker dithiothreitol (DTT) at a 1:1 ratio to maintain hydrogel stability and allow primary B-cell survival within the hydrogel matrix25. We used a protease-sensitive linker peptide ‘VPM’ (GCRDVPMS↓MRGGDRCG) for its high sensitivity to matrix metalloproteinases (MMPs), including MMP1, MMP2, MMP3, MMP7, MMP9 and MMP14, expressed in ABC-DLBCL patient samples in both the HMRC cohort and NCI cohorts (Fig. 1i and Supplementary Fig. 1e). We further chose PEG-4MAL for our studies because compared to other common PEG-functionalities, such as vinyl sulfone26 or acrylate29, PEG-4MAL supported the survival of CD19+ B-cell lymphomas (Extended Data Fig. 1).
To understand the mechanical properties of hydrogels, we performed rheology measurements on hydrogels engineered with 7.5 wt% and 10 wt% of PEG-4MAL polymer densities. The storage modulus of 10% gels (~580 Pa) was higher than that of 7.5% gels (~120 Pa), and in all conditions, the storage modulus reduced with time in culture (Fig. 1j). The inclusion of cells did not change the storage modulus compared to gels without cells. The loss modulus of hydrogels was ~9 Pa and ~26 Pa, respectively for 7.5 wt% and 10 wt% PEG-4MAL (Extended Data Fig. 2a). These findings indicate that the gels behave as elastic solids. Within the 7.5% PEG-4MAL hydrogels, the CD40L cells also maintained their expression of CD40L over several days (Extended Data Fig. 2b).
DLBCLs grow as diffuse structures with clustering of B cells, as indicated in ABC-DLBCL patient biopsy (Fig. 1k). When grown in PEG-4MAL hydrogels with CD40L-expressing cells, the ABC-DLBCL cells self-organized into organotypic clusters akin to patient tissues in contrast to tumors grown without CD40L-expressing cells (Fig. 1k and Supplementary Fig. 2a,b). Within PEG-4MAL hydrogels, DLBCLs were proximal to CD40L-expressing stromal cells (Supplementary Fig. 2c). Analysis of Ki67+ ABC-DLBCL cells (HBL1 and OCI-LY10) demonstrated significantly higher proliferative cells in REDV + CD40L-presenting organoids than in hydrogels functionalized with REDV or scrambled peptide REVD (Extended Data Fig. 2c). Lastly, the hydrogels could be serially passaged for at least ten week-long passages with >90% viability and sustained expression of pBTK (Extended Data Fig. 2d,e), indicating their potential for long-term culture.
CD40L attenuates MALT1 inhibitor response in patient DLBCLs
The presentation of CD40L by CD40L-transduced stromal cells in the hydrogels enhanced the viability of untreated DLBCL cells and reduced death mediated by MI2 (Fig. 2a and Supplementary Fig. 3a). MI2 doses of 125 nM and 2,000 nM effectively killed 84–99% of CD20 + HBL1 ABC-DLBCL cells, harbouring mutations CD79BMut/CARD11WT, in organoid conditions without CD40L-stromal cells. In contrast, cell death was limited to 11–16% in conditions that presented CD40L (Fig. 2a). MI2 did not affect the viability of CD40L-stromal cells (Supplementary Fig. 3b). Interestingly, the impairment in MALT1 inhibitor response in 3D hydrogel-based organoids was significantly higher than in 2D co-cultures of HBL1 and CD40L-stromal cells (Fig. 2b). The attenuation of MALT1 inhibitor was further observed in OCI-LY3 (CD79A/BWT/CARD11Mut) and OCI-LY10 (CD79AMut/CARD11WT) ABC-DLBCLs (Supplementary Fig. 3C), which are responsive to MALT1 inhibition5.
Fig. 2 |. T-cell signal amplifies BCR pathway and attenuates the therapeutic response to MALT1 inhibition in ABC-DLBCLs.
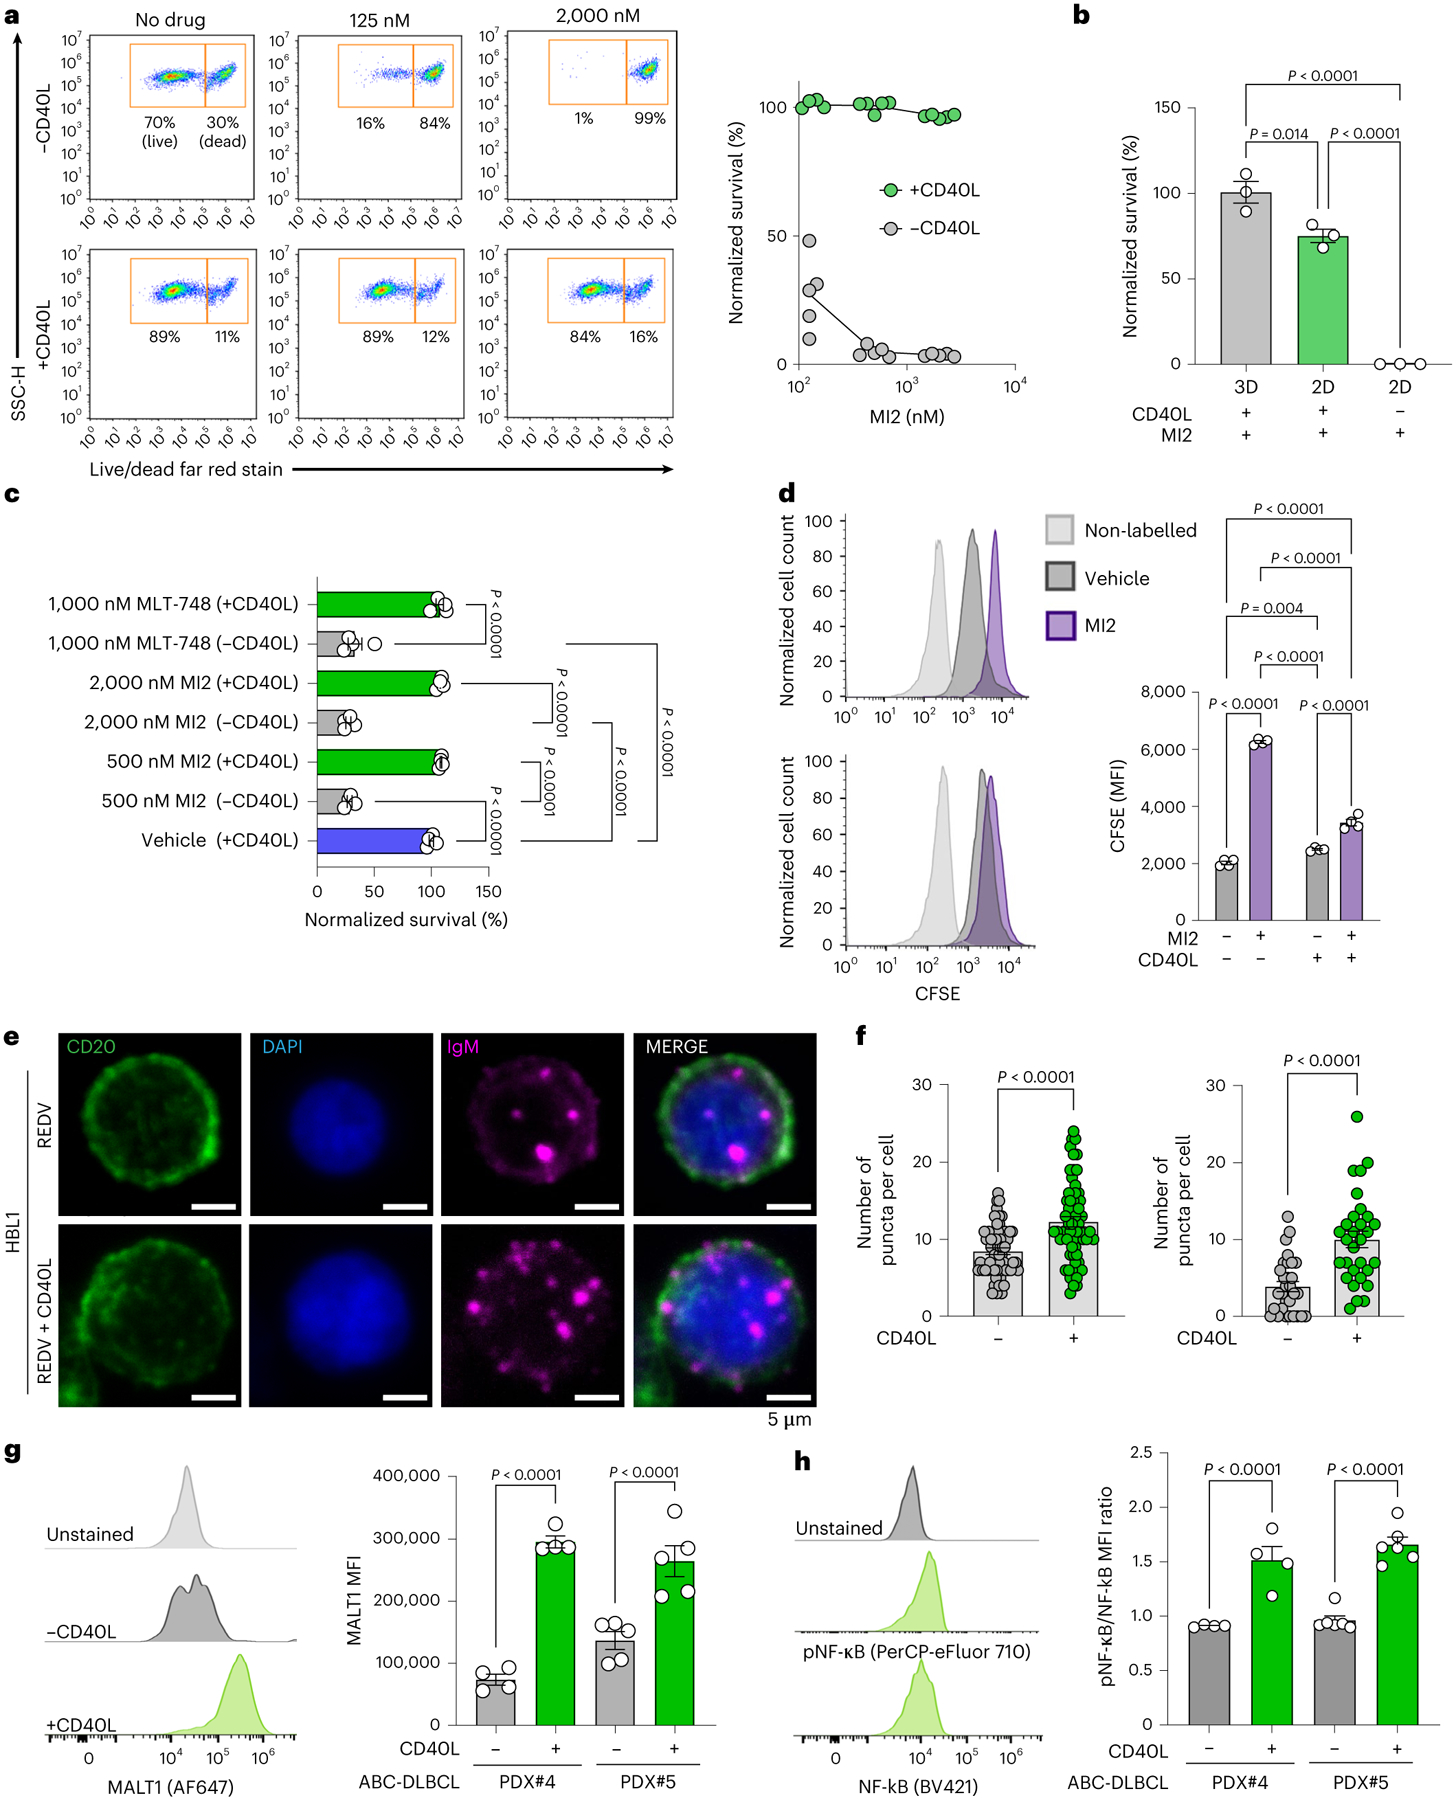
a, Left: flow cytometry gating of side scatter pulse height (SSC-H) versus live/dead. Right: survival (normalized to vehicle-treated) of ABC-DLBCL HBL1 cells cultured with or without CD40L-stromal cells after 48 h of culture and subsequent 48 h of treatment with increasing concentration of MALT1 inhibitor MI2 (n = 5). b, Survival (normalized to vehicle-treated) of human ABC-DLBCL HBL1 cells cultured in organoids or 2D with and without CD40L after 48 h culture, followed by 48 h treatment with 2,000 nM MALT1 inhibitor MI2. Two-tailed unpaired t-test (mean ± s.e.m., n = 3). c, Survival (normalized to vehicle-treated) of human ABC-DLBCL PDX#4 cultured in organoids with and without CD40L-expressing cells after 48 h culture, followed by 48 h treatment with 500 or 2,000 nM MI2 or 1,000 nM MLT-748. One-way ANOVA with Tukey’s multiple-comparison test (mean ± s.e.m., n = 4, PDX#4; n = 5, PDX#5). d, Proliferation after prelabelling cells with CFSE and subsequent 48 h culture, followed by 48 h treatment with 2,000 nM MI2. Left: flow cytometry histograms: HBL (top); HBL1 + CD40L (bottom). Right: quantification of CFSE for each culture condition. Two-tailed unpaired t-test (mean ± s.e.m., n = 4). MFI, median fluorescent intensity. e, BCR (magenta) puncta expression at the single-cell level on CD20 (green) expressing HBL1 in the presence or absence of CD40L-stromal cells, with DAPI (blue). Image representative of n = 5 hydrogels per condition. f, Number of BCR puncta per cell of ABC-DLBCL OCI-LY10 (left) and ABC-DLBCL HBL1 (right) cells cultured in ±CD40L-stromal cell conditions for 96 h. Two-tailed unpaired t-test (n = 5 hydrogels per cell line with 6 cells analysed per hydrogel for HBL1 and 12 cells analysed per hydrogel for OCI-LY10). g, Left: flow cytometry histograms. Right: MFI of MALT1 in human ABC-DLBCL PDX cells cultured in ±CD40L-stromal cell conditions for 96 h. Two-tailed unpaired t-test (mean ± s.e.m., n = 4 for PDX#4; n = 5 for PDX#5). h, Left: flow cytometry histograms. Right: ratio of MFI of pNF-κB/NF-κB in human ABC-DLBCL PDX cells cultured in ±CD40L-stromal cell conditions for 96 h. Two-tailed unpaired t-test (mean ± s.e.m., n = 4 for PDX#4; n = 5 for PDX#5). Each dot in a–d, g and h represents a hydrogel-based organoid.
To translate the findings from cell lines to patient tumours, we obtained a set of eight primary human DLBCL specimens from the Weill Cornell patient-derived xenograft (PDX) biorepository and engrafted them in NOD.Cg-rkdcscid Il2rgtm1Wjl/SzJ (NSG) mice. By reanalysing RNA-seq profiles (Gene Expression Omnibus (GEO) GSE14504315), we observed that five of these PDXs and original tumours maintained ABC-DLBCL-like signatures (Supplementary Fig. 4a), as well as the BCR and TLR pathway genes (Supplementary Fig. 4b). This cohort exhibited a similar pattern of CD40 expression (Supplementary Fig. 4c) as HMRC and NCI cohorts. Plating an ABC-DLBCL PDX specimen (PDX#4), validated for expression of integrin β1 protein (Supplementary Fig. 4d), in PEG-4MAL hydrogels revealed significantly reduced cell death when exposed to MI2 in the presence of CD40L (Fig. 2c). We further tested an allosteric MALT1 inhibitor, MLT-748, which binds MALT1 in the Trp580 pocket30. Similar to MI2, CD40L attenuated MLT-748 response (Fig. 2c). The attenuation of MALT1 inhibition response was validated across three PDXs (Extended Data Fig. 3a–c).
To understand the impact of CD40L on cell proliferation, we performed a dye dilution assay. CD40L-stromal cells attenuated the inhibitory effect of MI2 on cell proliferation (Fig. 2d). In contrast, HBL1 cells did not survive MALT1 inhibitor exposure when cultured with stromal cells that were not transduced to express CD40L (Extended Data Fig. 3d). Lastly, we confirmed that CD40L-mediated signalling can affect the efficacy of MALT1 inhibitors across species in dog patient-derived lymphomas (Supplementary Discussion, Supplementary Fig. 5 and Extended Data Fig. 3e), which are emerging comparative oncology models31.
CD40L induces BCR puncta and enhances pathway signalling
CD40 signalling drives NF-κB activation in cooperation with BCR pathway, as part of the classical immune synapse in B cells. In normal and malignant B cells, BCR clustering is associated with its activation and signalling8,32. Therefore, we investigated the effect of CD40L on BCR clustering and signalling. Exposure of HBL1 and OCI-LY10 ABC-DLBCL cells to CD40L induced a significant increase in the number of punctate IgM BCRs (Fig. 2e,f and Extended Data Fig. 4a). CD40L induced a higher level of MALT1 expression in three ABC-DLBCL PDXs (Fig. 2g and Extended Data Fig. 4b) and three cell lines (Extended Data Fig. 4c) compared with conditions without CD40L. Likewise, CD40L increased the expression of BCL10 (CBM signalosome complex) in ABC-DLBCL PDXs grown in hydrogel-based organoids (Extended Data Fig. 5a,b). The expression of pNF-κB, relative to NF-κB, increased significantly in all three ABC-DLBCL PDXs grown in hydrogel-based organoids (Fig. 2h and Extended Data Fig. 5c). To investigate whether the BCR and CD40 are co-localized in the BCR clusters, we performed confocal imaging analysis at a single-cell resolution level and observed that CD40 was mostly not co-localized within the BCR puncta (Extended Data Fig. 5d and Supplementary Fig. 6a). Interestingly, the CD40L presence led to increased expression of TRAF3 inside the ABC-DLBCL cells in contrast to organoids without CD40L-stromal cells (Extended Data Fig. 5e and Supplementary Fig. 6b). These findings highlight that the presentation of CD40L induces TRAF3 expression and correlates with TRAF3 expression in human ABC-DLBCL biopsies (Fig. 1d).
Integrin binding ligands modulate MALT1 signalling and inhibition
In addition to synaptic ligands such as CD40L, Ly-TME may also modulate drug responses through ECM and cellular ligands that bind to integrins33–37 on DLBCL cells. The interaction of α4β1 (very late antigen-4, VLA-4) with VCAM-1 enhances B-cell activation38,39 and promotes lymphoma survival and drug resistance40. Thus, we examined the RNA-seq profiles of DLBCL patients for the expression of genes relevant to ECM interactions in Ly-TME. We did not observe a significant difference in the expression of integrin genes between ABC-DLBCL and GCB-DLBCLs in the HMRC cohort (Fig. 3a). Yet, ITGA1, ITGA2, ITGA4, ITGA5, ITGA6 and ITGB1 genes were expressed at >2-fold normalized expression to all genes (Fig. 3b), which was further confirmed in the other cohorts (Supplementary Fig. 7a,b). We observed a >5-fold increase in ECM-related gene expression of VCAM-1, fibronectin, collagen and laminin in HMRC patient samples (Fig. 3b and Supplementary Fig. 7c). We further confirmed the expression of integrin αVβ3 proteins on human ABC-DLBCL PDXs using flow cytometry (Supplementary Fig. 7d).
Fig. 3 |. Integrin-binding ligands modulate MALT1 expression, activity and inhibition.
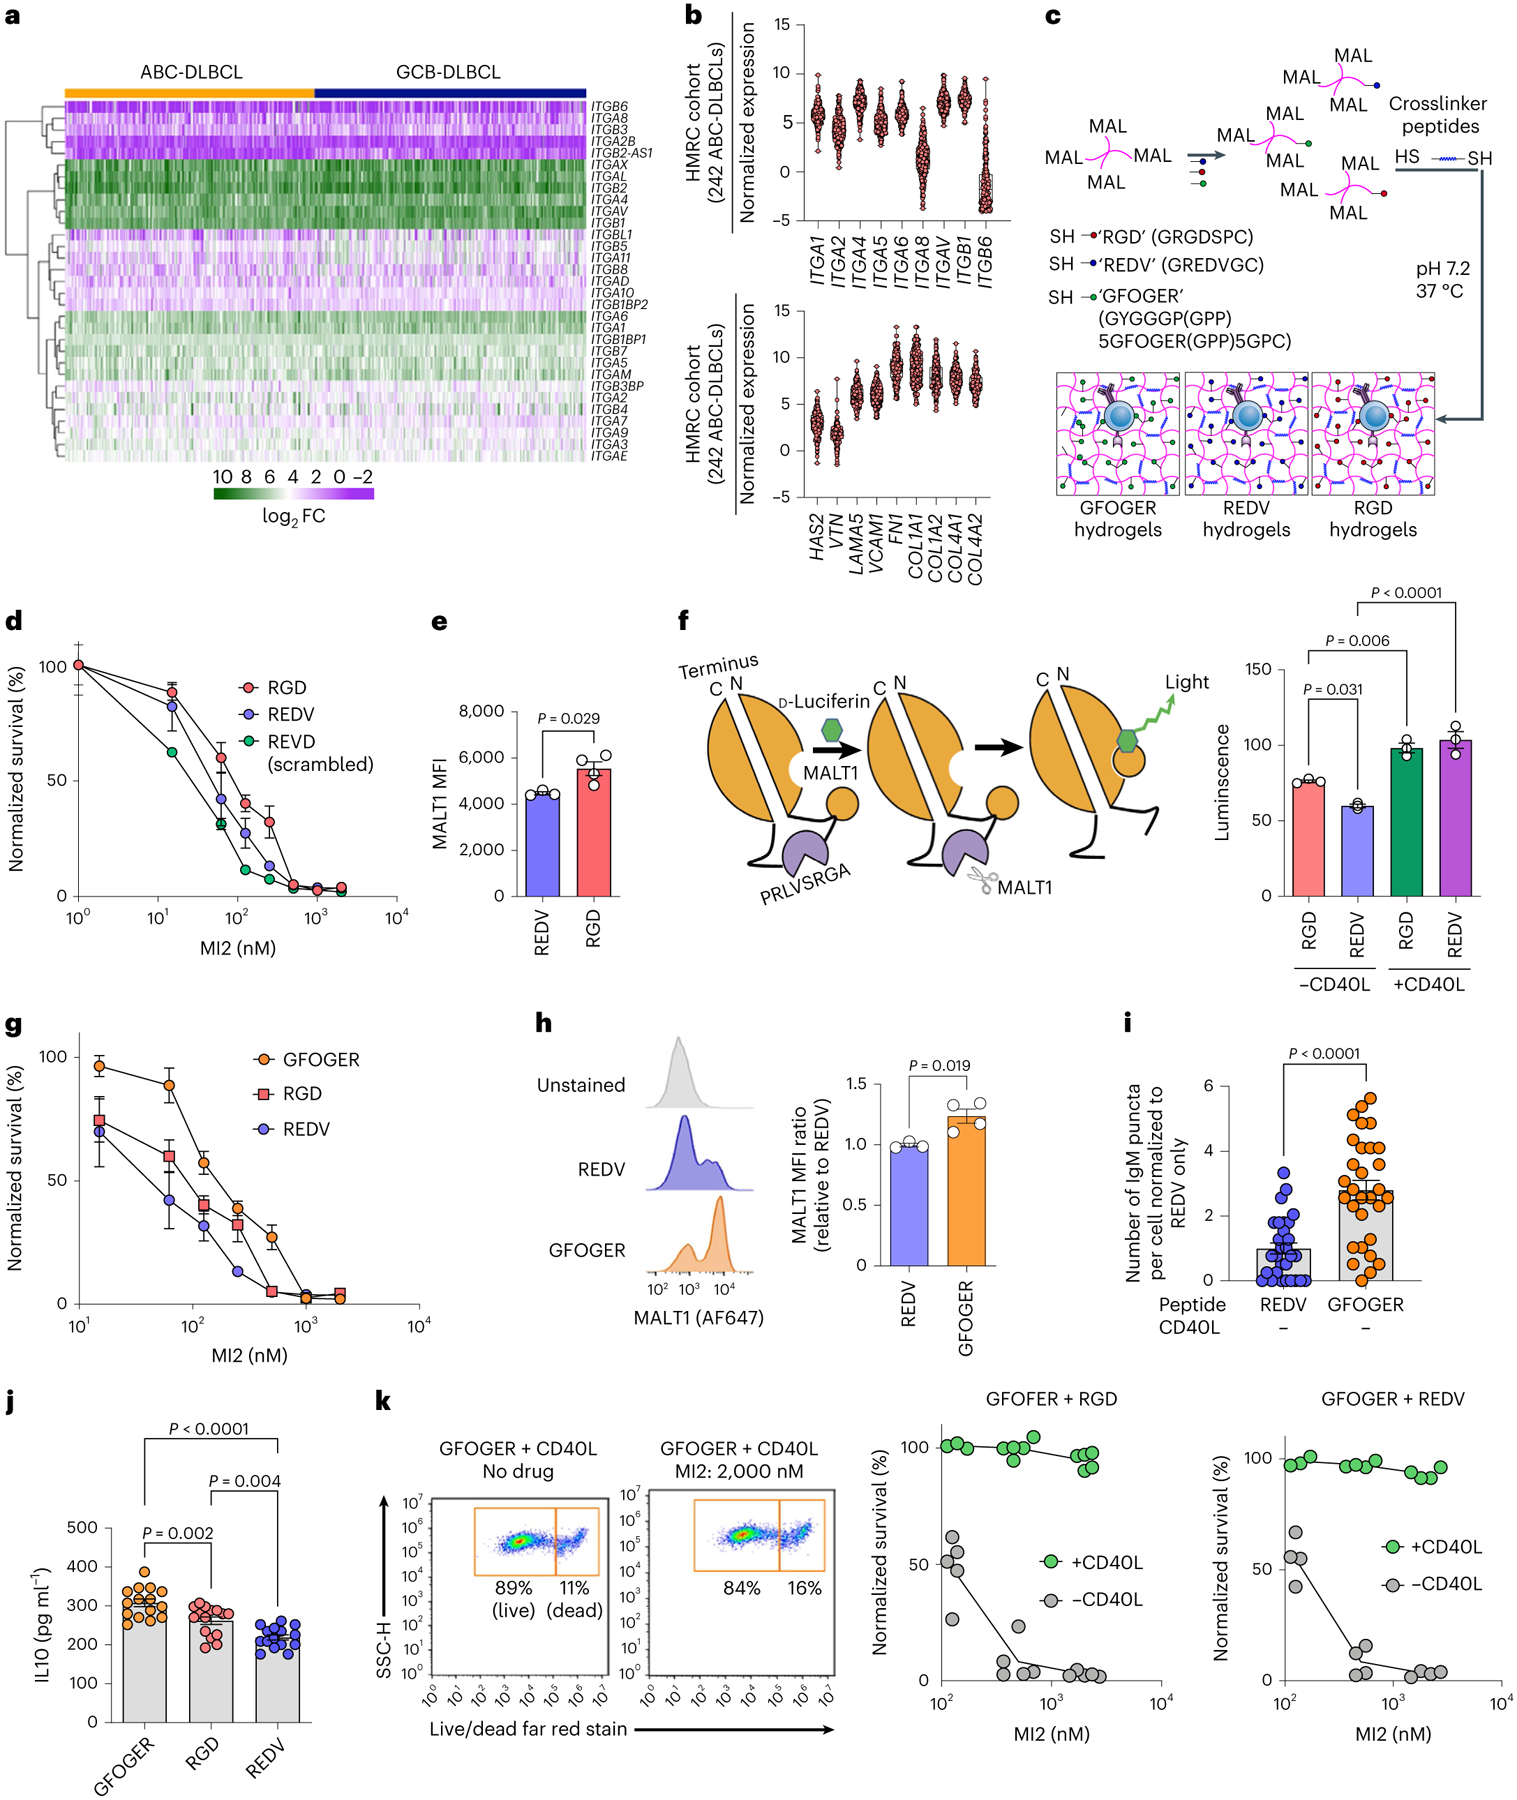
a,b, Heatmap (a) of integrin genes and violin plot (b) of integrin α and β subunits (top) and ECM (bottom) in human ABC-DLBCL (n = 242) and GCB-DLBCL (n = 264) patient tumours from the HMRC cohort. c, Schematic of PEG-4MAL-hydrogel-based organoids with protease-degradable crosslinkers functionalized with adhesive peptides RGD, REDV and GFOGER. d, Survival (normalized to vehicle-treated) of HBL1 cultured in either RGD (red) or REDV (blue) or scrambled REVD (green) peptide-functionalized hydrogels after 48 h of culture and subsequent 48 h of treatment with MALT1 inhibitor, MI2 (mean ± s.e.m., each dot is an average of n = 5 hydrogel-based organoids). e, MFI of MALT1 in HBL1 cells cultured in either RGD-functionalized (red) or REDV-functionalized (blue) hydrogel-based organoids for 96 h. Two-tailed unpaired t-test (mean ± s.e.m., n = 4). f, Left: schematic of MALT1-GloSensor reporter assay; right: MALT1 activity normalized to cell number after 96 h of culture in indicated conditions. One-way ANOVA with Tukey’s multiple-comparison test (mean ± s.e.m., n = 3). g, Survival (normalized to vehicle-treated) of HBL1 cells cultured in collagen-mimicking GFOGER-functionalized hydrogels compared with other peptides. The organoids were cultured for 48 h and underwent a subsequent 48 h of treatment with MI2 (means ± s.e.m., each dot is an average of n = 5 hydrogels). h, Representative flow cytometry histograms (left) and MFI of MALT1 (right) in HBL1 cells cultured under the indicated conditions for 96 h. Two-tailed unpaired t-test (mean ± s.e.m., n = 3 REDV; n = 4 GFOGER). i, Number of BCR puncta per cell (normalized to REDV-functionalized hydrogels) of HBL1 cells cultured in hydrogels. Two-tailed unpaired t-test (mean ± s.e.m., n = 5 hydrogels per cell line with six cells analysed from each hydrogel). j, IL10 secreted from HBL1 cells cultured under the indicated conditions for 96 h. One-way ANOVA with Tukey’s multiple-comparison test (mean ± s.e.m., n = 4). k, Gating schematic (left panels) and survival (normalized to vehicle-treated) (right panels) of HBL1 cells cultured in either GFOGER + RGD or GFOGER + REDV functionalized hydrogels (with or without CD40L-stromal cells) after 48 h of culture and a subsequent 48 h of MI2 treatment (mean ± s.e.m., n = 5 GFOGER + RGD and n = 4 GFOGER + REDV). Each dot in e, f, h and j represents a hydrogel-based organoid.
To determine whether individual Ly-TME-associated ECM ligands modulate ABC-DLBCL response to MALT1 inhibitors, we functionalized PEG-4MAL hydrogels with three different bio-adhesive peptides (Fig. 3c): ‘REDV’, fibronectin mimic ‘RGD’ (GRGDSPC)41, and collagen-1-mimicking peptide ‘GFOGER’ (GYGGGP(GPP)5GFOGER(GPP)5GPC, where O = hydroxyproline)33. GFOGER binds to multiple β1 integrin dimers including integrin α2β1 (ref.33). We first cultured DLBCLs in these hydrogels without CD40L-stromal cells for 48 h and then treated with MI2 for another 48 h. There was a modestly higher proportion of live ABC-DLBCL HBL1 cells in RGD-functionalized organoids (LD50, 87.1 nM) compared with in REDV-functionalized organoids (LD50, 46.5 nM), and markedly higher than scrambled peptide REVD-functionalized organoids (LD50, 24.5 nM) (Fig. 3d). OCI-LY3 cells also displayed an LD50 of ~3-fold higher in RGD-functionalized organoids than in REDV-functionalized organoids (Supplementary Fig. 8a). We then evaluated the effect of RGD- and REDV-functionalized hydrogels on MALT1 expression and activity. Protein expression of MALT1 and BCL10 was higher in RGD-functionalized organoids than in REDV-functionalized organoids (Fig. 3e and Supplementary Fig. 8b,c). To directly measure MALT1 proteolytic activity, we used OCI-LY3 DLBCL cells expressing a genetically modified firefly luciferase with a RelB MALT1 cleavage site sequence5,13 that only emits luminescence after a conformational change induced by MALT1 protease activity (Fig. 3f). In the absence of CD40L-stromal cells, RGD presentation led to DLBCL cells with increased MALT1 activity when compared with REDV presentation in hydrogels. In contrast, the presentation of CD40L in hydrogel cultures increased MALT1 activity compared with those without CD40L-stromal cells.
Interestingly, HBL1 cells cultured in GFOGER-functionalized organoids had an LD50 of 178.5 nM, approximately two-fold higher than that in RGD-functionalized organoids and almost four-fold than that in REDV-functionalized organoids (Fig. 3g). Similar to the CD40L conditions, GFOGER presentation increased MALT1 expression (Fig. 3h) and formed IgM BCR puncta (Fig. 3i and Supplementary Fig. 9a) in both HBL1 and OCI-LY10 cells.
To further assess the increased activity of MALT1, we examined interleukin IL10 secretion by DLBCL organoids in ECM-functionalized hydrogels. MALT1 induces the expression of IL10 in ABC-DLBCL, which in turn supports ABC-DLBCL survival and proliferation13. MI2 LD50 values and IL10 secretion values had the same ascending order (REDV < RGD < GFOGER), illustrating how Ly-TME-mediated IL10 secretion can affect MALT1 inhibitor efficacy (Fig. 3J). Combined presentation of GFOGER with RGD or REDV peptides in the same hydrogel yielded LD50 values in the intermediate ranges of each ligand (Supplementary Fig. 9b). However, CD40L inclusion overcame the ECM effect and led to significant impairment of MALT1 inhibitor response regardless of peptide presentations (Fig. 3k). These results highlight that crosstalk between the ECM and integrins on ABC-DLBCLs can enhance MALT1 signalling and dampen the efficacy of MALT1 inhibition; however, the ECM response in the absence of CD40L can be rescued by higher doses of MALT1 inhibitors. Interestingly, MI2 treatment did not kill MALT1hi-expressing cells in the presence of CD40L, suggesting that the CD40 pathway may be strongly amplifying cooperative signalling in ABC-DLBCLs (Supplementary Discussion and Extended Data Fig. 6a,b).
Ly-TME presentation increases cooperative signalling pathways
To determine the effect of GFOGER and CD40L presentation on cooperative signalling in ABC-DLBCLs, we performed RNA sequencing on HBL1 cells cultured in hydrogel-based organoids presenting peptides REDV, GFOGER or REDV with CD40L-stromal cells for 4 days. We performed differential expression (log10 FC > 1, P < 0.05 (FC, fold change)) analysis which revealed several differentially expressed genes in REDV + CD40L-presenting hydrogels, in contrast to REDV alone (Fig. 4a and Supplementary Discussion). Genes that were upregulated included ITGA4, CD40LG, MAPK Interacting Serine/Threonine Kinase 2 (MKNK2), Ribosomal Protein S6 Kinase Related (RSKR) and NFKB inhibitor α (NFKBIA). MKNK2 is involved in MAPK, AKT, ERK and TGF-β pathways, and is reported in DLBCLs42, whereas RSKR enables protein kinase activities43. The NFKBIA is a specific STAT3 target in ABC-DLBCL44.
Fig. 4 |. Microenvironment conditions that facilitate MALT1 inhibitor resistance enhance multiple signalling pathways.
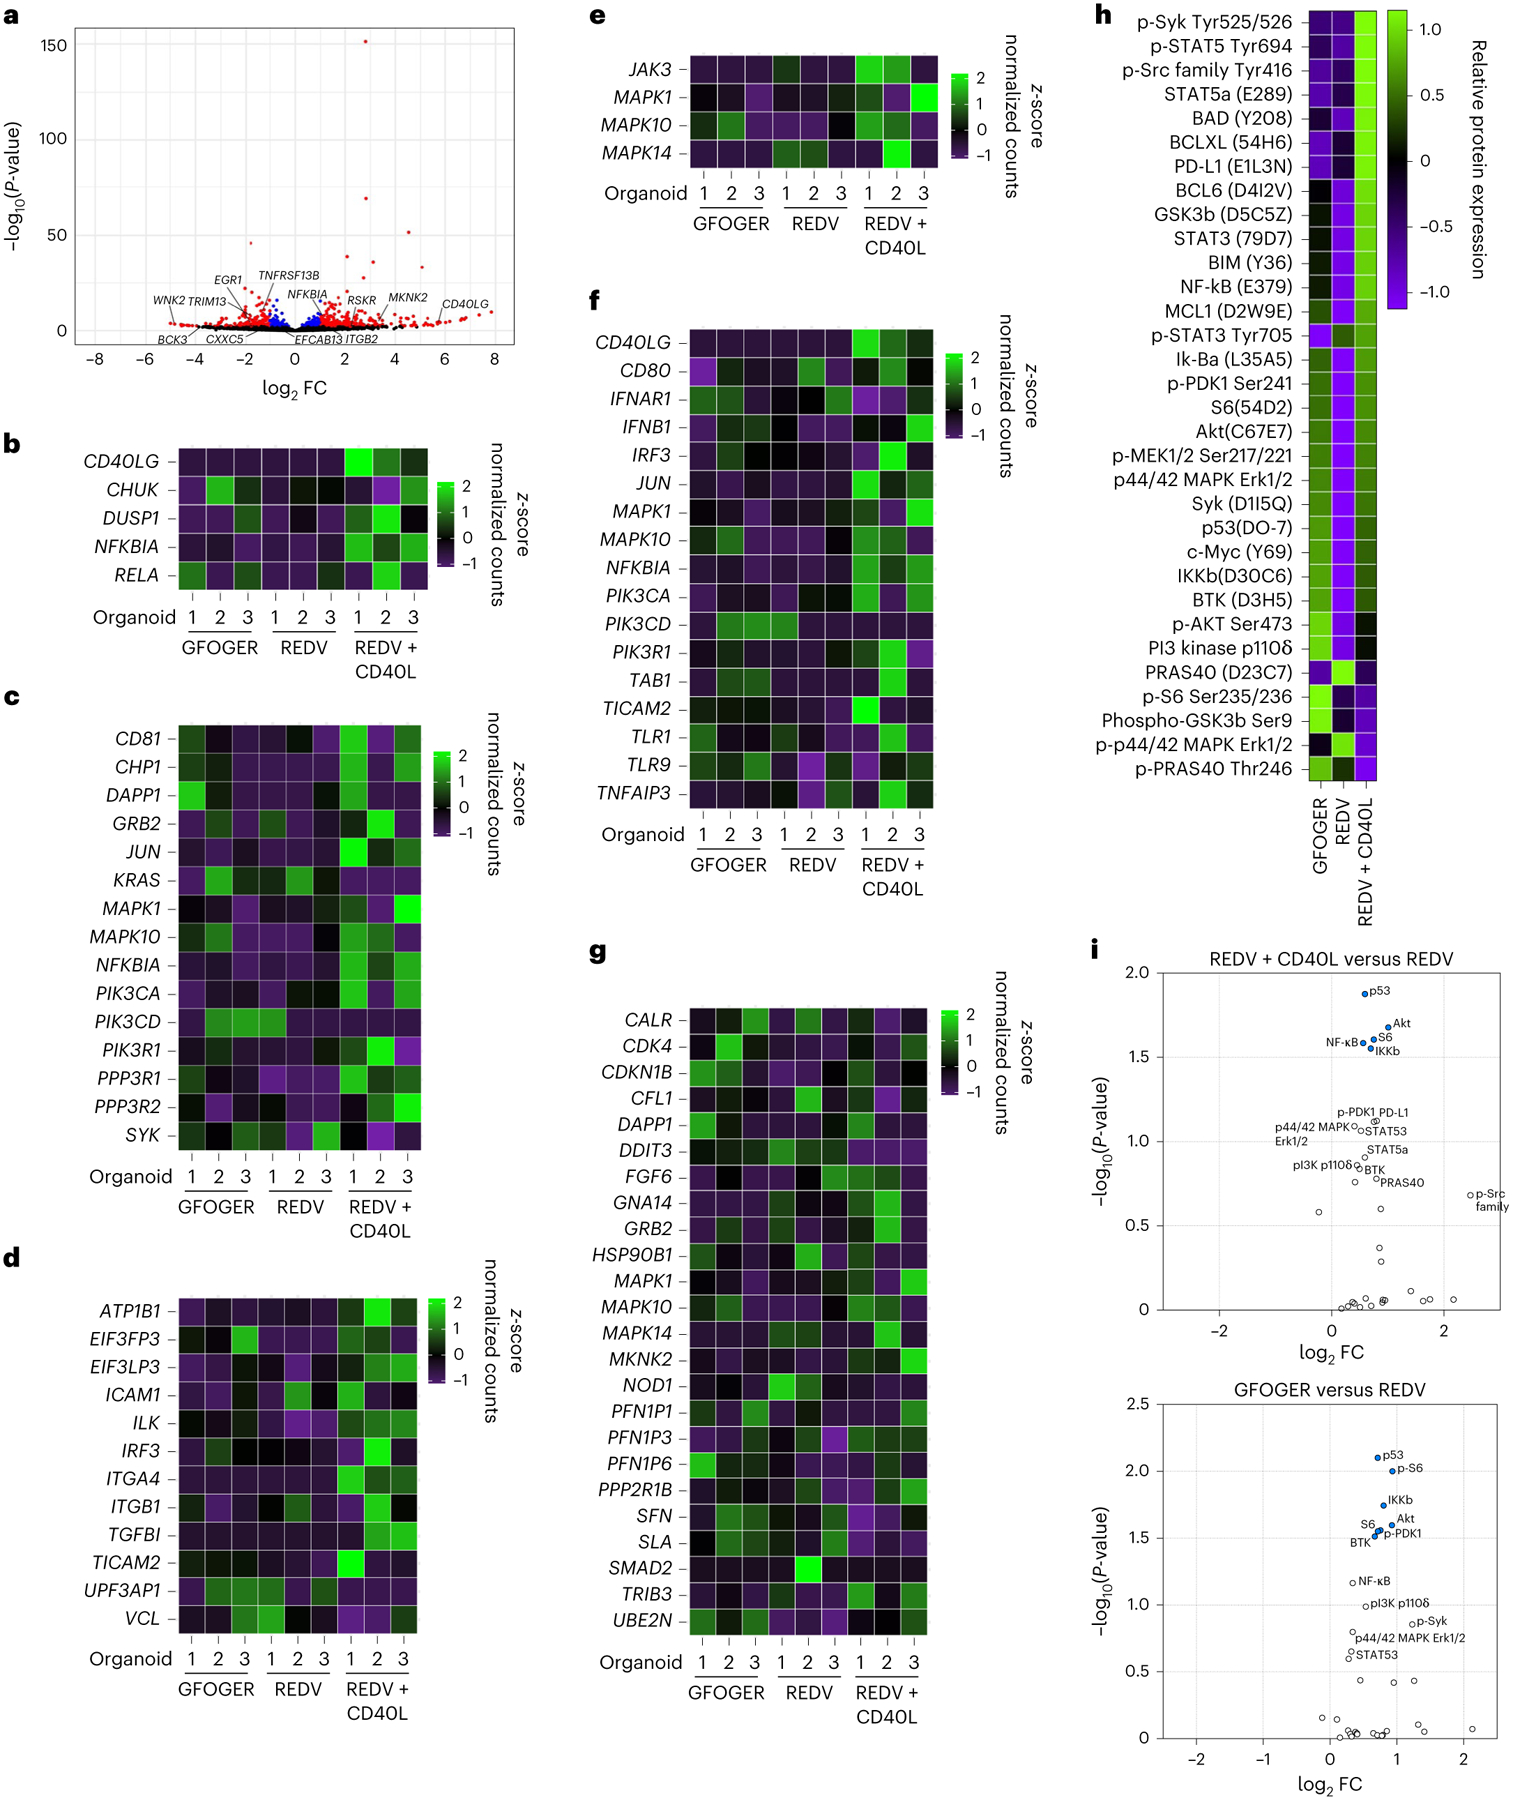
a, Volcano plot of statistical significance versus FC for genes from cells cultured in REDV-functionalized organoids with or without CD40L-stromal cells. Differential expressions with P < 0.05 are highlighted in blue and those with P < 0.05 and |log2 FC > 1| are shown in red. Results displayed in the volcano plot were calculated using the R package DESeq2 v.1.36.0, with the function DESeq() and the Wald test. No corrections to P-values were performed. b–g, Heatmaps displaying relative gene expression for various pathways CD40 (b), BCR (c), adhesion (d), STAT3 (e), TLR (f) and PI3k/AKT/mTOR (g), and measured by RNA sequencing, comparing HBL1 cells cultured in GFOGER-functionalized organoids, REDV-functionalized organoids or REDV-functionalized organoids with CD40L-stromal cells. Results indicate three replicates, with each replicate including cells pooled from ten hydrogel-based organoids. h, Heatmap displaying relative protein expression measured via NanoString nCounter SPRINT Profiler comparing HBL1 cells cultured in GFOGER-functionalized organoids, REDV-functionalized organoids or REDV-functionalized organoids with CD40L-stromal cells. Results indicate two replicates, with each replicate including at least 60 organoids. i, Volcano plot of statistical significance versus FC for proteins from cells cultured in REDV-functionalized organoids with CD40L-stromal cells (top) or GFOGER-functionalized organoids (bottom) in comparison to REDV-functionalized organoids without CD40L. Results indicate two replicates, with each replicate including at least 60 organoids. Statistical analysis involved NanoString’s Wald test, negative binomial generalized linear model, or log-linear model following the NanoString differential expression algorithm. Differentially expressed proteins with P < 0.05 are highlighted in blue.
An unbiased gene-set enrichment analysis (GSEA) on differentially expressed genes showed larger enrichment scores (Supplementary Tables 1 and 2) when comparing REDV ± CD40L presenting hydrogel conditions than in the REDV versus GFOGER-presenting conditions. We observed many gene sets with large normalized enrichment scores and P < 0.05, including those associated with B-cell maturation, inflammation and innate immunity, T cells, GTPases, apoptosis, CD40L, cell growth, protein kinases, TLR, MYD88, STAT3 (Signal Transducer and Activator of Transcription 3), and positive regulation of cell adhesion. Several enriched genes in these pathways are shown in Fig. 4b–g, suggesting that adhesive ligand subtypes partly regulate the BCR pathway, whereas the inclusion of CD40L increased the enrichment of a broader set of genes.
Based on the GSEA and pathway analysis, we next used the NanoString platform on HBL1 cells cultured in hydrogel-based organoids to quantify a set of 32 proteins involved in the BCR and TLR pathways. CD40L presentation in hydrogels functionalized with REDV upregulated 25 proteins compared with REDV-functionalized hydrogels alone (Fig. 4h,i), several of which are indicative of upregulation of the NF-κB complex, PI3K pathway and BCR pathway. Seventeen of these proteins were also upregulated in GFOGER-functionalized hydrogels. The six highest expressed proteins included NF-κB, p53, STAT3, S6 and pS6 (Extended Data Fig. 6c). These RNA-sequencing and protein NanoString results suggest that GFOGER- and CD40L-presentation induces multiple cooperative signalling pathways in ABC-DLBCLS, including the BCR-TLR superpathway.
Ly-TME regulates TLR9 and kinase pathways in DLBCL organoids
Chronic active BCR signalling in ABC-DLBCLs cooperates with TLR9 signalling through the assembly of an MYD88–TLR9–BCR signalosome1, which controls CBM complex assembly and NF-κB activity. We confirmed higher MYD88 expression in ABC-DLBCLs compared with GCB-DLBCLs in the HMRC cohort (Extended Data Fig. 7a). In the ABC-DLBCLs, MYD88 expression strongly correlated with survival genes IL10, LYN, LCK, PIK3CD and CARD11 (Extended Data Fig. 7b). However, it is not known how Ly-TME factors affect TLR9-MYD88 signalling.
We observed that the presence of either GFOGER- or CD40L-presentation induced TLR9 expression in ABC-DLBCL cell lines and PDXs (Fig. 5a,b, Extended Data Fig. 7c,d). We have previously shown that the stiffness of neoplastic lymph nodes is nearly two-fold higher than that of non-cancerous lymph nodes45. Therefore, we examined the effect of hydrogel stiffness on TLR9 in ABC-DLBCL PDX cells and observed that the TLR9 expression increased from 9,000 MFI for 7.5% gels to 11,300 MFI for 12.5% gels (Fig. 5c and Extended Data Fig. 7e). By keeping the adhesive ligand density the same and modulating hydrogel crosslinking density, we observed a significantly lower expression of TLR9 even in the presence of CD40L, further suggesting that hydrogel biophysical parameters influence TLR9 expression in ABC-DLBCLs. In contrast, ABC-DLBCL seeding density or perturbation of MALT1 with MI2 did not alter the expression of TLR9 (Extended Data Fig. 7f).
Fig. 5 |. CD40L, ECM and hydrogel stiffness regulate TLR9 and pSRC expression in PDX organoids.
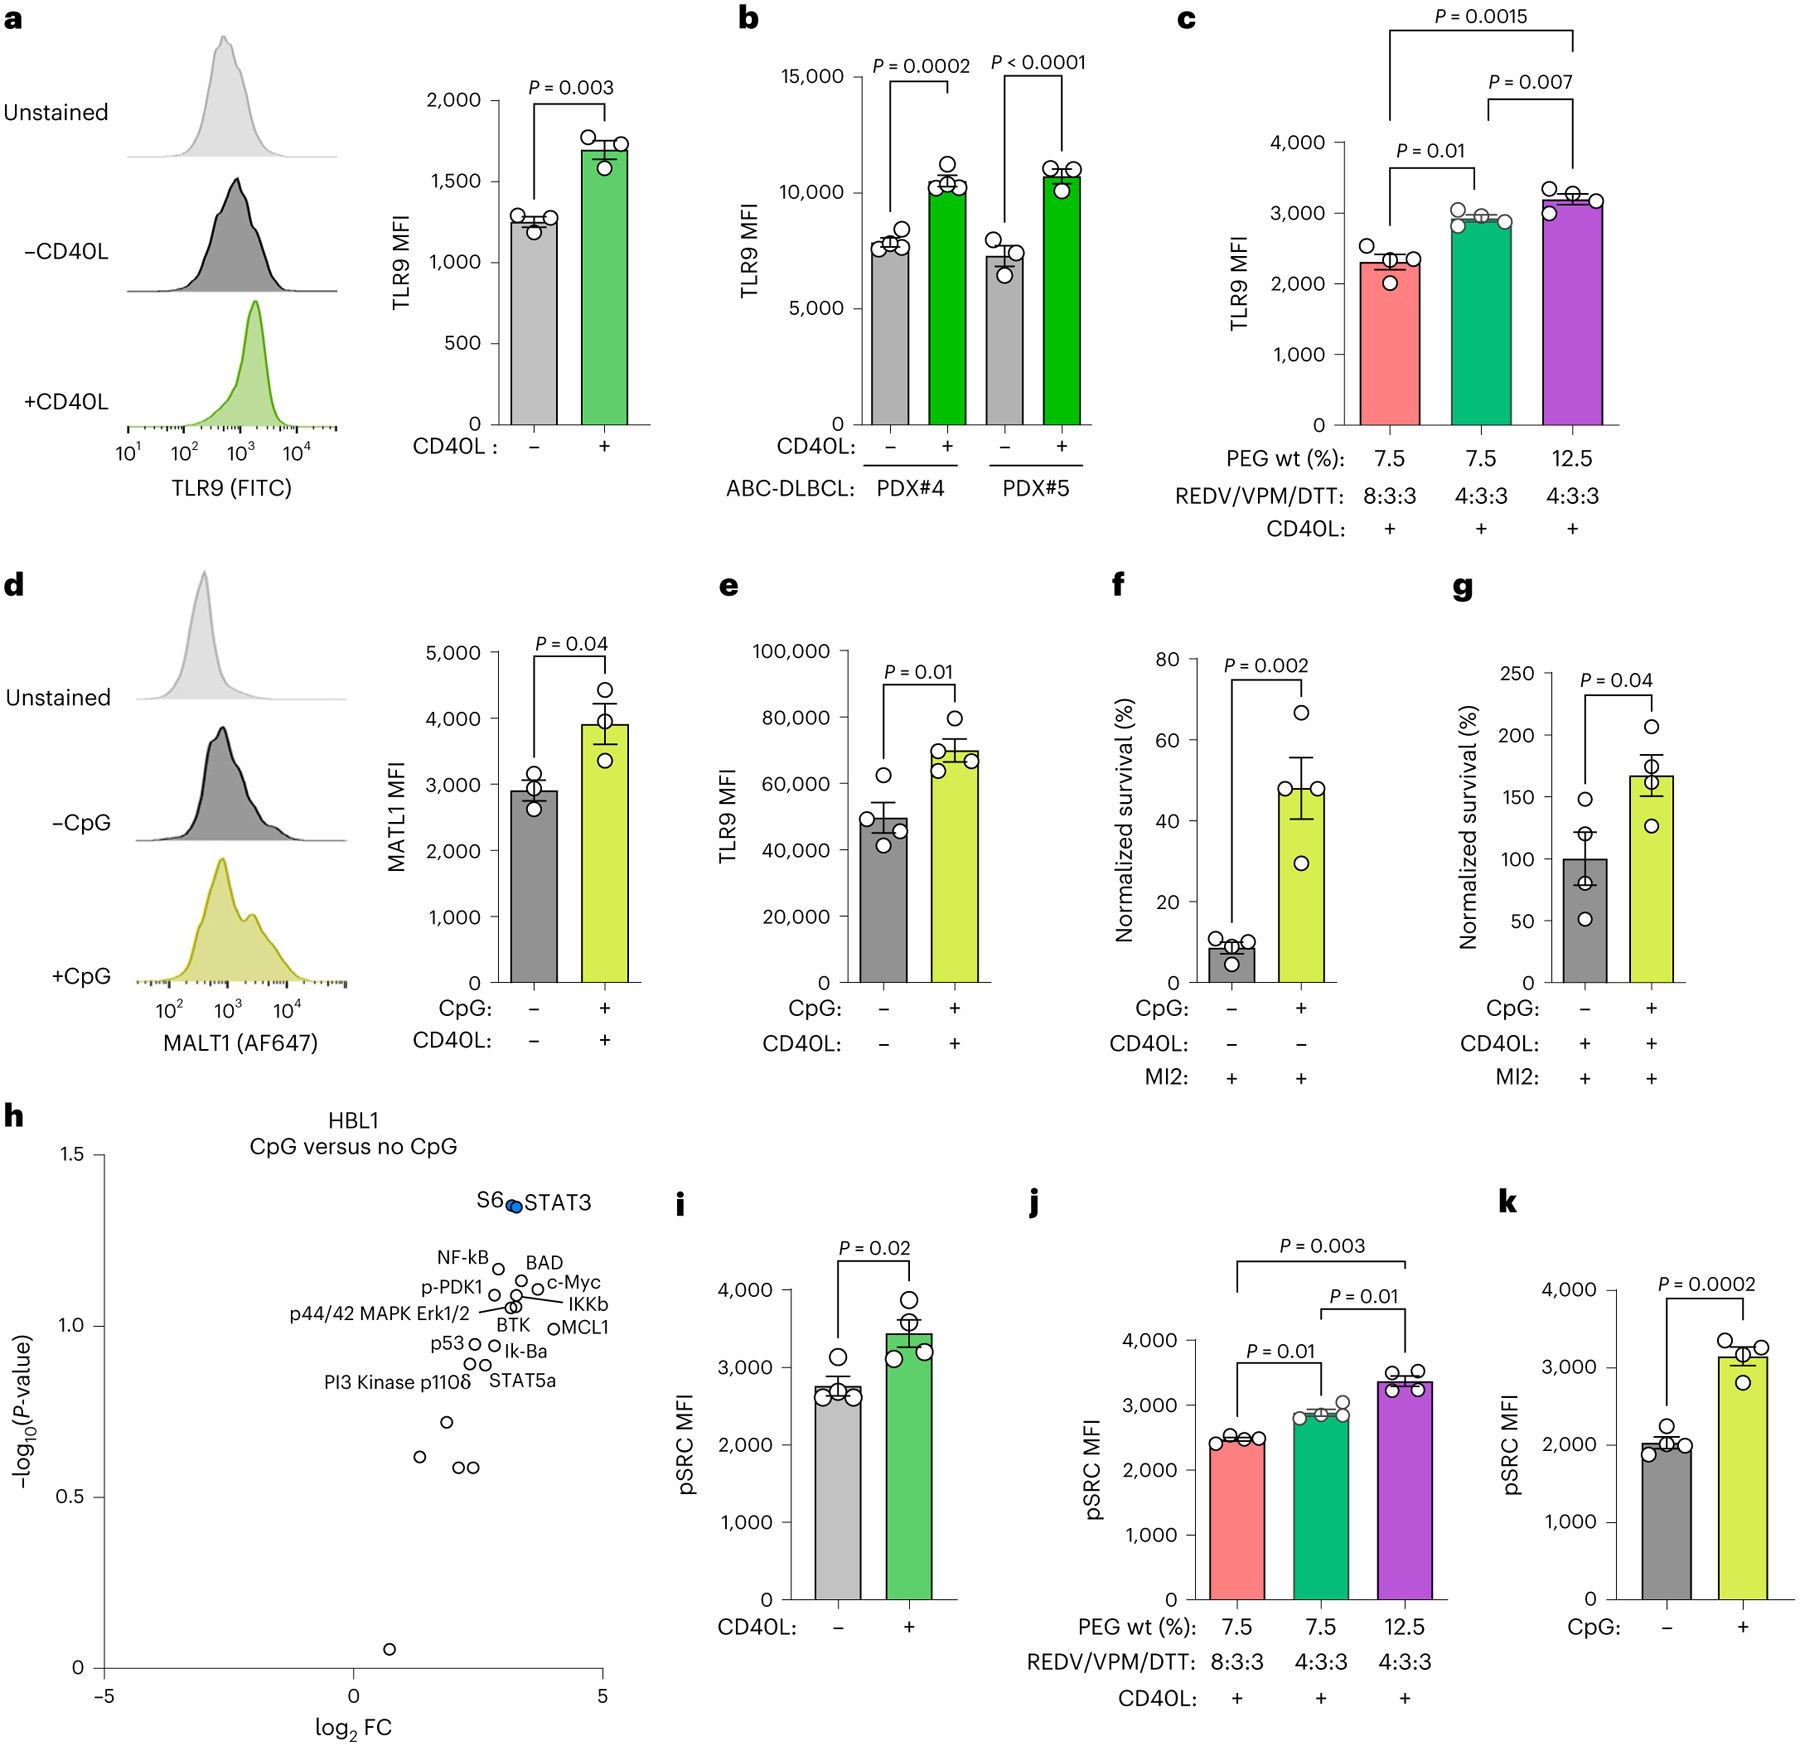
a, Representative flow cytometry histograms (left) and TLR9 MFI (right) for HBL1 cells cultured in ±CD40L-stromal cells conditions for 96 h. Two-tailed unpaired t-test (mean ± s.e.m., n = 3). b, TLR9 MFI for human ABC-DLBCL PDX cells cultured in ±CD40L-stromal cells conditions for 96 h. Two-tailed unpaired t-test (mean ± s.e.m., n = 4 PDX#4; n = 3 PDX#5). c, Effect of stiffness, modulated by indicated PEG-4MAL weight percent and the ratio of REDV to VPM and DTT crosslinkers, on TLR9 median fluorescent intensity of human ABC-DLBCL PDX#2 cells after 96 h culture. One-way ANOVA with Tukey’s multiple-comparison test (mean ± s.e.m., n = 4). d, Effect of 1 μM CpG addition on MALT1 expression in HBL1 cells cultured in REDV-functionalized hydrogel-based organoids for 96 h. Two-tailed unpaired t-test (mean ± s.e.m., n = 3). e, Effect of 1 μM CpG addition on TLR9 expression in HBL1 cells cultured in REDV-functionalized hydrogel-based organoids for 96 h. Two-tailed unpaired t-test (mean ± s.e.m., n = 4). f,g, Survival (normalized to vehicle-treated) of HBL1 cells (f) and human ABC-DLBCL PDX#2 cells co-cultured with CD40L-stromal cells (g) in REDV-functionalized hydrogel-based organoids with and without 1 μM CpG for 96 h, including 48 h of 2,000 nM MI2 treatment. Two-tailed unpaired t-test (mean ± s.e.m., n = 4). h, Volcano plot of FC for proteins in HBL1 cells cultured with 1 μM CpG in REDV-functionalized organoids (n = 3 replicates, each representing 60 organoids). The statistical analysis involved was similar to that in Fig. 4i. Differentially expressed proteins with P < 0.05 is highlighted in blue. i, Effect of CD40-stromal cells on pSRC expression in HBL1 cells cultured for 96 h. Two-tailed unpaired t-test (mean ± s.e.m., n = 4). j, Effect of stiffness, modulated by indicated PEG-4MAL weight percent and the ratio of REDV to VPM and DTT crosslinkers, on pSRC expression of human ABC-DLBCL PDX#2 cells after 96 h culture. One-way ANOVA with Tukey’s multiple-comparison test (mean ± s.e.m., n = 4). k, Effect of CpG on pSRC expression in HBL1 cells cultured for 96 h. Two-tailed unpaired t-test (mean ± s.e.m., n = 4). Each dot in a–g and i–k represents hydrogel-based organoids.
When treated with TLR9 agonist CpG oligonucleotides46, MALT1 and TLR9 expression increased in organoids (Fig. 5d,e and Extended Data Fig. 7g,h). Pre-stimulation with CpG, 48 h prior to and maintained during 2,000 nM MI2 treatment, resulted in significantly increased survival of HBL1 and PDXs but not OCI-LY3 (Fig. 5f,g and Extended Data Fig. 7i). The six most highly induced proteins induced by CpG treatment included NF-κB, p53, STAT3, S6 and pS6 (Extended Data Fig. 7j). Compared to unstimulated organoids, CpG resulted in S6 and STAT3 being upregulated and differentially expressed (Fig. 5h).
In ABC-DLBCLs, Src/Abl family kinases propagate chronic active BCR signalling, and a pan-Src kinase inhibitor dasatinib is active against 50% of DLBCLs47. We observed that the presence of CD40L-stromal cells increased pSRC expression in HBL1, OCI-LY3 and OCI-LY10 ABC-DLBCL cells (Fig. 5i and Extended Data Fig. 8a). Additional biophysical Ly-TME parameters, such as stiffness, proportionally increased pSRC in ABC-DLBCL PDXs (Fig. 5j and Extended Data Fig. 8b). CpG stimulation also increased pSRC expression, suggesting crosstalk between TLR9 and Src kinase signalling in hydrogel-based organoids (Fig. 5k and Extended Data Fig. 8c). Collectively, these data suggest that CD40L and tissue biophysical parameters regulate TLR and SRC family kinases in DLBCLs.
Combinatorial inhibition of MALT1 with kinases kills DLBCLs
Because the CD40L and TLR9 stimulation modulated Src activation, we measured ABC-DLBCL survival after treatment with increasing doses of dasatinib or masitinib, which are specific inhibitors of LYN, FYN, BLK and LCK48. Exposure to CD40L resulted in a significant increase in LD50 for HBL1 cells in organoids treated with either dasatinib (1471 nM) or masitinib (9.6 μM), in contrast to organoids without CD40L (dasatinib, 779 nM; masitinib, 4.8 μM) (Supplementary Fig. 10a,b). However, unlike the MALT1 inhibitor, HBL1 survival declined in the presence of CD40L with increasing drug doses of dasatinib and masitinib. Combinatorial treatment of MI2 with dasatinib or masitinib significantly reduced the viability of ABC-DLBCL cells by ~30–40% with respect to vehicle-treated or single Src inhibitor-treated cultures, even in the presence of CD40L or both CpG and CD40L (Fig. 6a and Supplementary Fig. 10c,d). In contrast, CpG alone did not induce cell death (Supplementary Fig. 10e).
Fig. 6 |. Combinatorial treatment with cooperative signalling pathway inhibitors rescues MALT1 inhibitors in organoids and in vivo.
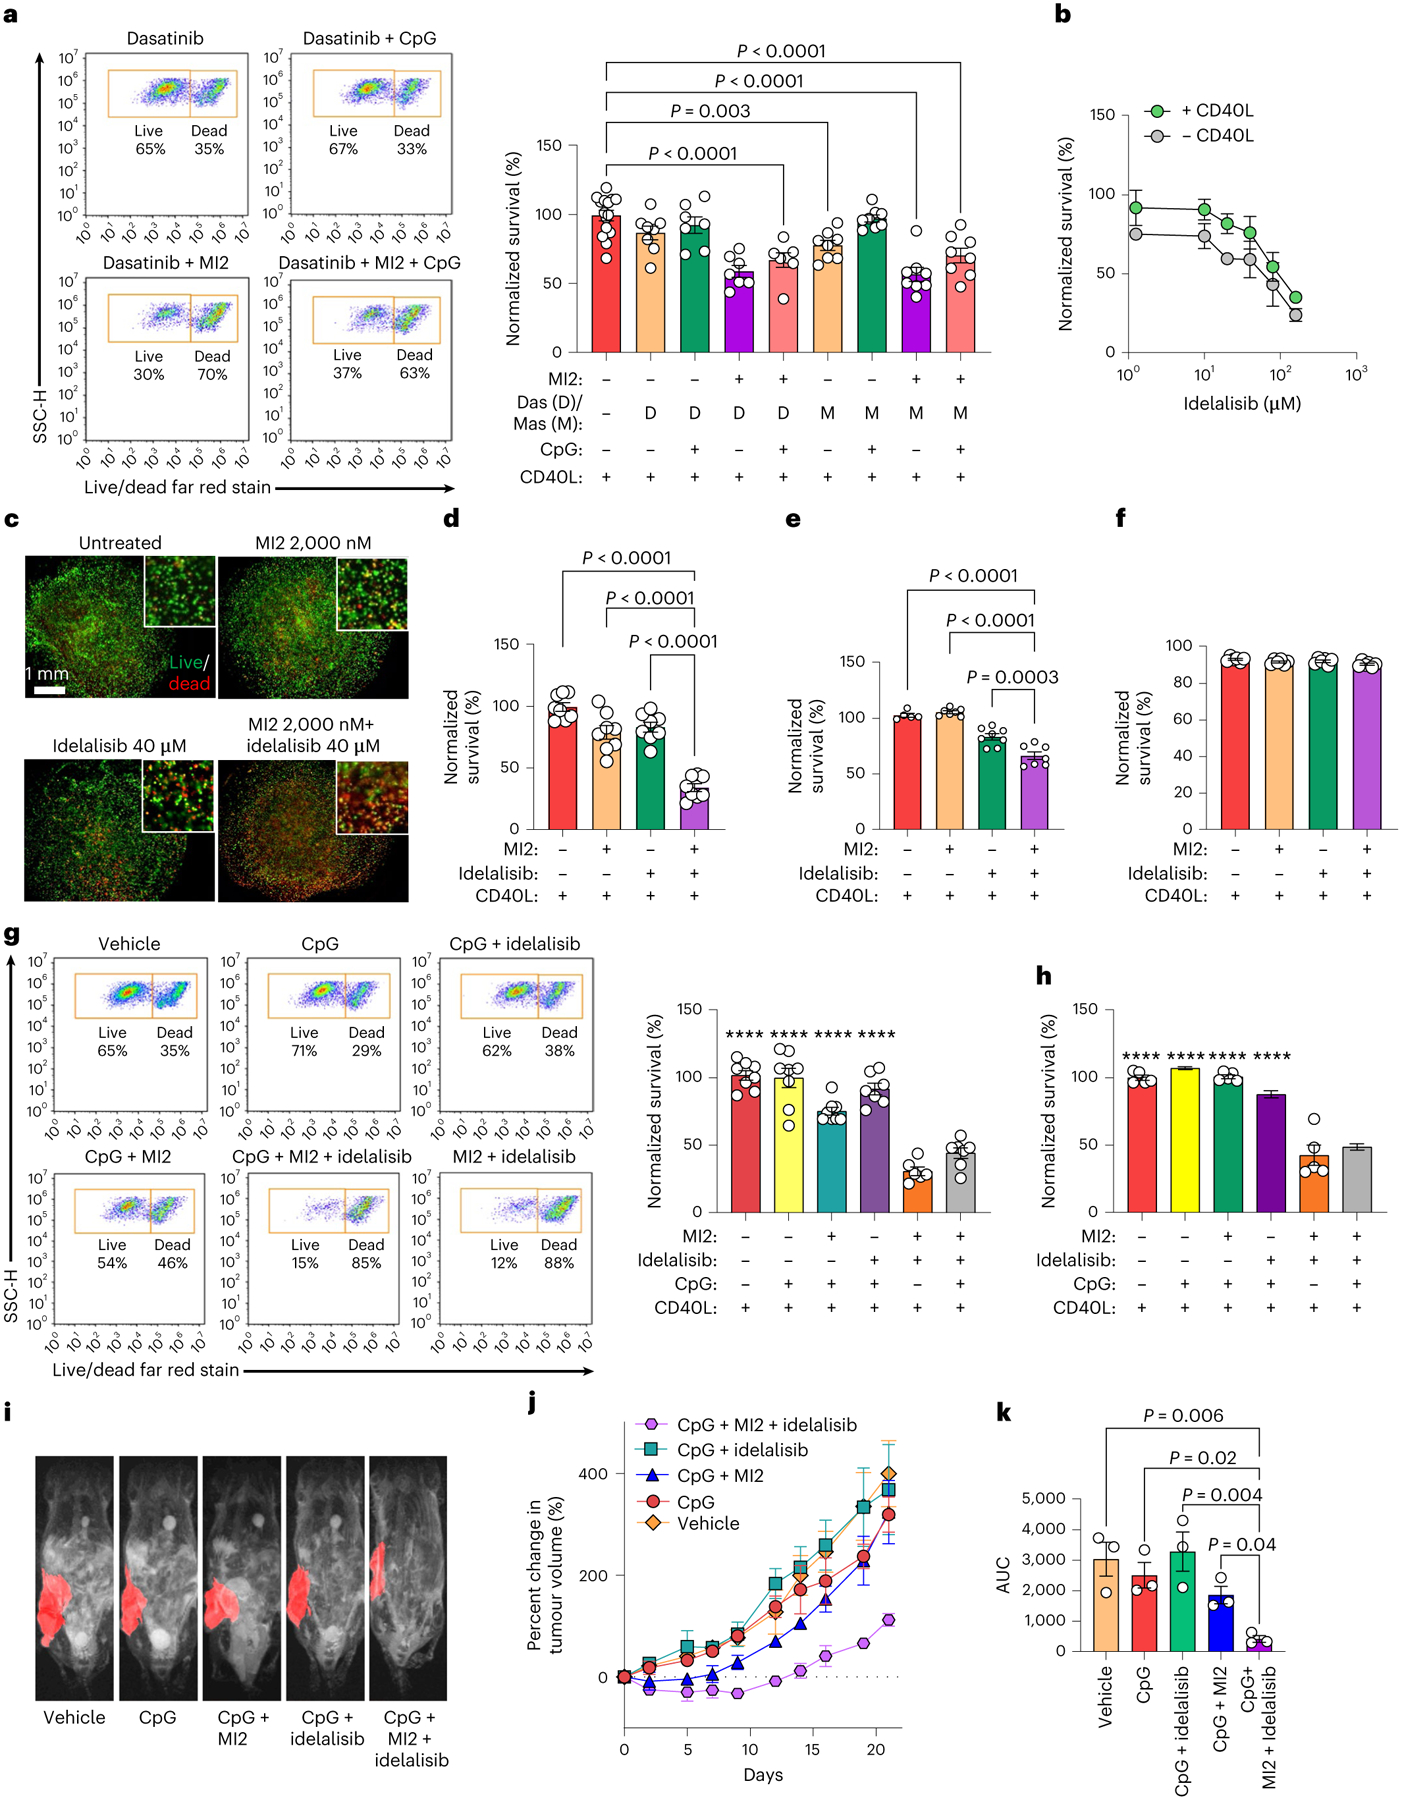
a, Survival (normalized to vehicle-treated) of HBL1 cells cultured with CD40L-stromal cells for 96 h, treated for 96 h with 1 μM CpG and 48 h with 2,000 nM MI2, 1,600 nM dasatinib (Das) and/or 5,000 nM masitinib (Mas). One-way ANOVA with Dunnett’s multiple-comparison test against vehicle (mean ± s.e.m., n = 7 for dasatinib + MI2, dasatinib + CpG and dasatinib + MI2 + CpG; n = 6 for other treatment groups; n = 15 for vehicle). b, Survival (normalized to vehicle-treated) of HBL1 cells after 48 h of culture in REDV-functionalized organoids and 48 h of treatment with idelalisib (mean ± s.e.m., n = 4). c, Fluorescent images depicting survival of human PDX cells cultured with CD40L-stromal cells for 48 h and subsequent 48 h of indicated treatment (live, calcein, green; dead, ethidium homodimer, red). Images representative of n = 5 organoids. d–f, Survival (normalized to vehicle-treated) of HBL1 cells (d), PDX#4 cells (e) and GCB-DLBCL OCI-LY7 cells (f) cultured with CD40L-stromal cells in REDV-functionalized organoids for 96 h, with 48 h of treatment with vehicle, 2,000 nM MI2, 40 μM idelalisib, or both drugs. One-way ANOVA with Dunnett’s multiple-comparison test against the idelalisib + MI2 group (mean ± s.e.m., PDX: n = 5 for vehicle, n = 7 for MI2, and n = 8 for remaining treatments; n = 8 for HBL1; n = 6 for OCI-LY7). g,h, Survival (normalized to vehicle-treated) for HBL1 cells (g) and human PDX#4 cells (h) cultured with CD40L-stromal cells after 96 h culture in REDV-functionalized organoids with CD40L-stromal cells, where ± indicate 48 h 2,000 nM MI2 treatment or 40 μM idelalisib treatment, and/or 96 h 1 μM CpG treatment. One-way ANOVA with Dunnett’s multiple-comparison test against idelalisib + MI2 group (mean ± s.e.m., ****P < 0.0001 against idelalisib + MI2 group, HBL1: n = 6 for idelalisib + MI2, n = 7 for idelalisib + CpG and idelalisib + CpG + MI2; n = 8 for remaining treatments; n = 5 for PDX). i–k, MRI images depicting implanted human PDXs (i), the percentage change in PDX volumes (j) and the area under the curve (AUC) (k) for treatment groups. Mice were treated daily with 1 mg per kg (body weight) CpG intratumorally and 25 mg per kg (body weight) MI2 and/or 40 mg per kg (body weight) idelalisib intraperitoneally. Results indicate representative MRI or the mean ± s.e.m. of n = 3. One-way ANOVA with Holm–Šídák’s multiple-comparison test.
With partial response from Src kinase inhibitors, we explored PI3K inhibition as an alternative based on Nanostrong analysis. PI3K inhibitors can synergize with MALT1 inhibitors5. Therefore, we tested the efficacy of idelalisib, a PI3Kδ-specific inhibitor clinically approved for the treatment of indolent lymphomas49, alone or in combination with MI2 in ABC-DLBCL organoids. The LD50 values for idelalisib were increased 2-fold under CD40L conditions in organoids (96.6 μM) (Fig. 6b). Dual MI2 and idelalisib treatment resulted in ~65% killing and significantly reduced the viability of the ABC-DLBCL cell line (Fig. 6c,d), human and canine PDXs (Fig. 6e and Extended Data Fig. 9a) compared with single inhibitor and vehicle-treated cultures in the presence of CD40L. In contrast, GCB DLBCL cell line OCI-LY7 did not show cell death under these treatment conditions (Fig. 6f and Extended Data Fig. 9b).
We next evaluated the efficacy of dual PI3K/MALT1 inhibition with additional TLR9 stimulation and observed that the efficacy of combination treatment against ABC-DLBCL cell lines or primary human specimens was not significantly diminished by CpG pretreatment (Fig. 6g,h and Extended Data Fig. 9c). Both HBL1 and OCI-LY10 showed similar efficacy of combination treatment but OCI-LY3 was not responsive to PI3K inhibition, a finding supported by previous reports5.
We then evaluated whether combination therapy in the context of TLR9 stimulation is effective in vivo by engrafting human ABC-DLBCL cells in immunocompromised NOD.Cg-Prkdcscid Il2rgtm1Wjl/SzJ (NSG) mice. After tumours reached ~200 mm3, mice were randomly assigned into five arms (n = 3 per group): vehicle, CpG, CpG and MI2, CpG and idelalisib, and CpG with MI2 and idelalisib. We treated the mice daily with 1 mg per kg (body weight) CpG intratumorally as well as 25 mg per kg (body weight) MI2 and/or 40 mg per kg (body weight) idelalisib intraperitoneally. Treatment did not lead to significant changes in body weight (Supplementary Fig. 11). Idelalisib had minimal impact on tumour growth, whereas MI2 significantly reduced tumour growth. Moreover, the combination of MI2 with idelalisib induced a more potent antilymphoma response (Fig. 6i,j). The area under the curve for the combinatorial MI2 and idelalisib treatment was significantly smaller than those of the other treatment conditions (Fig. 6k). Collectively, these data indicate that MALT1-targeted therapy is greatly enhanced by targeted therapies that suppress Ly-TME signals that would otherwise attenuate the response to MALT1 inhibitors. Lastly, we demonstrate that in addition to MALT1-targeted therapy, BTK inhibitors are also impacted by Ly-TME, as elucidated by hydrogel-based organoids, and the therapeutic response of BTK inhibitors is significantly enhanced by targeted therapies that overcome cooperative Ly-TME signals (Supplementary Discussion and Extended Data Fig. 10).
Outlook
Bioengineered lymphoid tissue models built with biomaterials can enable the structural and functional recreation of healthy and malignant immune tissues50. Our findings underscore the importance of Ly-TME in ABC-DLBCL treatment and highlight the need to develop biomaterials with specific polymer functionalities that sustain ex vivo survival of lymphoid tumours and enable modelling of key interactions between Ly-TME and therapeutics. Ultimately, a more thorough understanding of ABC-DLBCL’s interactions with its Ly-TME will enable the identification of clinically relevant biomarkers to better classify patients in terms of prognosis or responsiveness to specific interventions.
Online content
Any methods, additional references, Nature Portfolio reporting summaries, source data, extended data, supplementary information, acknowledgements, peer review information; details of author contributions and competing interests; and statements of data and code availability are available at https://doi.org/10.1038/s41563-023-01495-3.
Methods
Ethics oversight
The research conducted in this report complies with relevant ethical regulations from Weill Cornell Medicine’s institutional review board-approved protocol 1410015560A002 and Institutional Animal Care and Use Committee (IACUC)-approved protocol 2014–0024, and Cornell’s IACUC protocol number 2017–0035. Canine primary lymphoma samples were obtained following informed consent by owners and xenografted under Cornell IACUC protocol numbers 2005–0151 and 2017–0035.
Polymers and peptides
PEG-4MAL with 20 kDa molecular weight and ≥90% purity and PEG-4ACR with 21 kDa and >97% were purchased from Laysan Bio (catalogue numbers 4arm-PEG-MAL-20k-1g, 4arm-PEG-ACRL-20k-1g). PEG-4VS with 20 kDa molecular weight and >90% purity was purchased from Sigma Aldrich (catalogue number JKA7025–1G). Peptides (>95% purity) were custom purchased from AAPPTec and included collagen 1 mimic ‘GFOGER’ (GYGGGP(GPP)5GFOGER(GPP)5GPC, where O = hydroxyproline), fibronectin/vitronectin mimic ‘RGD’ (GRGDSPC), VCAM1 mimic ‘REDV’ (GREDVGC), control scrambled peptide (GRDGSPC) and protease-sensitive crosslinker (GCRDVPMS↓MRGGDRCG). The non-degradable crosslinker DTT was purchased from Sigma Aldrich (catalogue number DTT-RO). All components were reconstituted in 0.01 M HEPES (Thermo Fisher, catalogue number 15630080), pH 7.4.
Chemical compounds
Mitomycin C was purchased from Santa Cruz Biotechnology (catalogue number SC-3514A). Idelalisib, dasatinib, masitinib and ibrutinib were purchased from Selleckchem (catalogue numbers S2226, S1021, S1064, S2680, respectively). MI2 was purchased from Tocris Bioscience (catalogue number 4848), and the allosteric MALT1 inhibitor MLT-748 (Selleckchem, catalogue number S8898) was obtained from one of the authors (A.M.). Previously listed chemicals were reconstituted in DMSO. CpG ODN 2395 was purchased from InvivoGen (catalogue number tlrl-2395) and reconstituted in endotoxin-free water.
Cell culture
Cell lines OCI-LY3, OCI-LY7, OCI-LY10 and HBL1 were obtained from one of the authors (A.M.). OCI-LY3, OCI-LY7 and OCI-LY10 were originally provided by the University Health Network, Toronto, and transferring scientist Dr. Mark Minden. OCI-LY3 and OCI-LY10 were cultured in Iscove’s medium (Thermo Fisher, catalogue number 12440061) supplemented with 20% FBS (Thermo Fisher, catalogue number 26140079), and HBL1 was cultured in Roswell Park Memorial Institute (RPMI) 1640 medium (Thermo Fisher, catalogue number 11875119) supplemented with 10% FBS and 10 mM HEPES (Thermo Fisher, catalogue number 15630080). All ABC-DLBCL cells were grown in the presence of penicillin G/streptomycin (Thermo Fisher, catalogue number 15140163) and 2 mM l-glutamine (Thermo Fisher, catalogue number 35–050-061). CD40L-stromal cells, genetically modified mouse fibroblast L cells to express human CD40 ligand, were obtained from one of the authors (H.U.) and cultured in RPMI supplemented with 10% FBS and 80 μg ml−1 geneticin (Thermo Fisher, catalogue number 10131027). All cells were grown at 37 °C in a humidified atmosphere of 5% CO2.
Human primary samples and patient-derived xenografts
Four patient cohorts were studied: the HMRC cohort, the NCI cohort, the British Columbia (BC) cohort and the Weill Cornell cohort.
HMRC cohort.
This cohort, published by Reddy et al.22, contains tumour biopsies (N = 1,001), paired-normal tissue (N = 400) and clinical information from adult and paediatric patients with de novo DLBCL treated with a standard, rituximab-containing regimen. Tissue and clinical data were obtained from institutions participating in the HMRC, as detailed in Reddy et al.22, including Emory University. RNA-sequencing was performed in 775 patients for whom adequate material was available; 313 and 331 separate patients were respectively classified as ABC and GCB DLBCL. Cases were anonymized, shipped to Duke University and processed in accordance with a protocol approved by the institutional review board at Duke University. Clinical data, including initial response to therapy, overall survival, gender, age, stage, performance status and number of extranodal sites, were collected on nearly all cases, as detailed in Reddy et al.22.
RNA-seq alignment (.bam) files were downloaded from the European Genomics Archive (EGA), dataset ID EGAD00001003600. Featurecounts51 was used to summarize the gene expression in terms of fragment counts. Samples with an expression of fewer than 12,000 genes (N = 173) were omitted to remove any biases due to technical or biological artefacts. The remaining samples were classified into the cell of origin groups ABC (N = 242), GCB (N = 264) and unclassified (N = 86) using the supplementary data from Reddy et al.22. Filtering was done using edgeR52 to remove genes that had little to no expression with c.p.m. (counts per million) less than 1.26 (approximately 15 counts). Post filtering, a voom transformation53 was applied to make the empirical distribution of the RNA-seq data closer to a normal distribution for further analysis. Additionally, data were quantile normalized and log2 transformed. Finally, a linear model was fit, and an empirical Bayes moderated test was carried out using limma53. Differentially expressed genes were identified using an absolute FC threshold of 1, and an FDR-adjusted P-value cut-off of 0.05. Genes of interest were visualized using heatmaps, employing the Euclidean clustering method for the genes using the R package pheatmap54. Pearson’s correlations for the genes of interest in the ABC samples were calculated using function rcorr as implemented in the R package Hmisc (Harrell Miscellaneous. R package version 4.4–2) and plotted using the function corrplot as implemented in the R package corrplot (version 0.84).
NCI cohort.
This cohort was obtained from the Genomic Data Center (GSE99276) and with approval from the NCBI dbGaP controlled access portal.
BC cohort.
This cohort contains 347 diagnostic tissue biopsies from the British Columbia Cancer population-based registry of patients with de novo DLBCL treated uniformly with R-CHOP21. All patients were 16 years of age or older and details of the patient cohort are described in Ennishi et al.21. Within this cohort, patients were respectively classified as ABC and GCB DLBCL. Immunohistochemistry (IHC) was performed on formalin-fixed, paraffin-embedded tissue biopsies on tissue microarrays using the Benchmark XT platform. Anti-CD4 (clone SP35, Ventana) and anti-PD1 (clone MRQ-22, Cell Marque) antibodies were used for evaluation of the T-cell tumour microenvironment and scanned with an Aperio ScanScope XT at 20× magnification (v.12.1.0; Aperio Technologies).
Cornell cohort.
This cohort was obtained from Dr. G. Inghirami and raw data of RNA-seq profiles were reanalysed from Weill Cornell’s GEO GSE14504315 to identify and define ABC versus GCB DLBCLs. Deidentified patient samples were obtained with informed consent and xenografted under Weill Cornell Medicine’s institutional review board-approved protocol 1410015560A002 and IACUC-approved protocol 2014–0024. PDXs were first established in female and male NSG B2M mice (NOD.Cg-B2mtm1Unc Prkdcscid Il2rgtm1Wjl/SzJ). These PDXs were then serially propagated into NOD.Cg-Prkdcscid Il2rgtm1Wjl/SzJ (NSG) mice (Jackson Laboratory). Molecular and clinical details of these tumours are described in Kotlov et al.15. Primary samples and PDXs were classified into the cell-of-origin groups ABC and GCB DLBCL based on RNA-seq15.
Hydrogel-based organoid fabrication
Organoids were formed in synthetic hydrogels made of PEG-4MAL (or PEG-4VS or PEG-4ACR) with typically a 7.5% (w/v) macromer concentration. PEG-4MAL was first functionalized at pH 7.4 with thiolated adhesive peptides RGD, REDV, GFOGER, or control peptide REVD or RDG for 30 min at 37 °C. While RGD and REDV were used at 3 mM concentration, due to size constraints, GFOGER was functionalized at lower molarity (1 mM), with all additional maleimide sites occupied by the scrambled control peptide to make up for 3 mM total peptide concentration. This decrease in molarity did not significantly alter the MI2 LD50 of HBL1 cells in RGD- or REDV-functionalized hydrogel-based organoids. Protease-sensitive crosslinker (VPM) and non-degradable crosslinker (DTT) were combined at a 1:1 molar ratio and adjusted to pH 6. Briefly, before combining the polymer and crosslinker, cell mixtures were suspended in the crosslinker solution. When using cell lines, cell mixtures included 40,000 ABC-DLBCL cells with or without 40,000 CD40L-expressing stromal cells. For PDX samples, mixtures included 80,000–200,000 PDX cells with or without 50,000 CD40L cells. After mixing, cell-crosslinker solutions were immediately injected into an equal amount of functionalized PEG-4MAL located in a well of a non-treated 96-well plate. The ensuing droplet was mixed via pipetting and cured for 15 min at 37°C. Appropriate media was added post-incubation to begin organoid cultures. The media was replenished every 2 days. In some experiments, organoid biophysical parameters were modulated by varying PEG-4MAL wt% or the ratio of adhesive peptide to crosslinker.
Hydrogel rheology
Hydrogels (20 μl) were cast on Parafilm and allowed to polymerize. Hydrogels were then swollen in complete media for a minimum of 2 h at 37 °C prior to rheological analysis for the day 0 measurements. Hydrogels continued to be incubated at 37 °C in complete media for later time points. As rheology is a destructive test, individual samples were made for each time point. Rheological measurements were made using a Modular Compact Rheometer 302 stress-controlled rheometer (Anton Paar) with a 10 mm diameter, 2° cone and plate geometry (CP10–2 measuring cone, Anton Paar). Hydrogel samples were loaded onto the rheometer plate, the cone was lowered, and the excess hydrogel sample was trimmed. PBS was added near the sample to prevent dehydration during the measurement. Storage (G′) and loss (G″) moduli were determined by averaging the measurements within the linear range of an oscillatory angular frequency sweep (ω = 1–10 rad s−1) at a strain of 4% (determined to be within the linear viscoelastic range of the hydrogel by an oscillatory strain amplitude sweep).
Flow cytometry
At the end of the desired culture time, organoids were washed with PBS and enzymatically digested in 125 U ml−1 type I collagenase (Worthington Biochemical, catalogue number LS004194) for 1 h at 37 °C. Buffer-containing serum was added at the end of this incubation to terminate the enzymatic activity. Organoid debris was removed using 96-well MultiScreen Mesh Filter Plates (EMD Millipore, catalogue number MANMN6010), and the ensuing cells were resuspended in FACS buffer (PBS with calcium and magnesium, 2% FBS, 1% penicillin G/streptomycin and 5 mM EDTA). Cells were first stained with antibodies against cell surface antigens and incubated in the dark on ice for 1 h. For intracellular antigens, cells were then fixed and permeabilized using the eBioscience Foxp3/Transcription Factor staining buffer (Thermo Fisher, catalogue number 00–5523-00) set or BD Phosflow fix buffer (BD, catalogue number 557870) when antigen phosphorylation was of interest. After fixation, cells were incubated in permeabilization buffer with antibodies against intracellular antigens for 1 h on ice. Cells were analysed using an Accuri C6 or Beckman Coulter CytoFlex S flow cytometer. Data were analysed using FlowJo software (10.8.1) using positive and negative controls; gating strategies are shown in Fig. 2 and in the Supplementary and Extended Figures.
The following antibodies were used: anti-BCL10 (AF488; clone EP606Y; Abcam, catalogue number ab200318), anti-CD20 (FITC, PE, PE-Cy7, APC; clone 2H7; Thermo Fisher, catalogue numbers 11–0209-42, 12–0209-42, 25–0209-42, 17–0209-42, respectively), anti-MALT1 (AF647; clone EP603Y; Abcam, catalogue number ab217071), anti-phospho-BTK (PE; clone M4G3LN; Thermo Fisher, catalogue number 12–9015-42), BTK (PE; clone 53/BTK; BD, catalogue number 558527), phospho-NFkB p65 (PerCP-eFluor 710; clone B33B4WP; Thermo Fisher, catalogue number 46–9863-42), NFkB (BV421; clone K10–895.12.50; BD, catalogue number 56446), phospho-S6 (Ser235/236) (AF647; clone D57.2.E; Cell Signaling Technology, catalogue number 4851S), phosphor-SRC (Tyr418) (PE; clone SC1T2M3; Thermo Fisher, catalogue number 12–9034-42), Invitrogen Anti-CD29 (integrin beta 1) Monoclonal (APC; clone TS2/16; eBioscience, Thermo Fisher, catalogue number 17–0299-42), Invitrogen Anti-CD51/CD61 (integrin alpha v beta 3) Monoclonal (FITC; clone 23C6; eBioscience, Thermo Fisher, catalogue number 11–0519-42), anti-CD40L (BV421; clone 4–31; Biolegend, catalogue number 310824), anti-CD19 (FITC; clone eBio1D3; Invitrogen, catalogue number 11–0193-85) and TLR9 (FITC, PE, APC; eB72–1665; Thermo Fisher, catalogue numbers 12–9099-82 and 17–9099-82, respectively). Additional stains included CellTrace carboxyfluorescein succinimidyl ester (CFSE) (Thermo Fisher, catalogue number C34554) to measure cell proliferation as well as LIVE/DEAD fixable stains (Green Dead Cell, Far Red Dead Cell, Aqua Dead Cell; Thermo Fisher, catalogue numbers L23101, L10120, L34957) or propidium iodide (Thermo Fisher, catalogue number P1304MP) to measure cell viability. All antibodies and viability stains were validated by their respective manufacturers and utilized at the manufacturer’s recommended dilution; in the event of no clear recommendation a dilution of 1:200 was used. Antibodies were also validated for use using positive and negative control samples with dilutions and conditions based on the manufacturer’s recommendation or our previous experience. For flow, all antibodies were titrated using cells positive for the antibody marker.
Drug treatment
Organoids were fabricated, and cells were allowed to interact with the surrounding environment for 48 h prior to treatment with any inhibitors. MI2, MLT-748, idelalisib, dasatinib and masitinib were then added for 48 h. Ibrutinib treatment was conducted for 72 h. For experiments with CpG, 1 μM CpG was added immediately after organoid fabrication. CpG was replenished after 48 h prior to any additional intervention. After the desired treatment time, organoids were then degraded as previously described. Cells were subsequently stained with CD20 and LIVE/DEAD fixable stains and analysed via flow cytometry. Live CD20+ cell numbers were normalized to vehicle-treated organoids, and LD50 values were calculated using GraphPad Prism 9 software. To visualize live and dead cells in organoids, separate organoid samples that had undergone the desired treatment regimen were washed with PBS without calcium and magnesium and stained in 4 nM calcein AM and 4 nM ethidium homodimer (Thermo Fisher, catalogue numbers 65–0853-78, 15585011, respectively) in media for 45 min at 37°C. The staining solution was then replaced with fresh media, and organoids were directly imaged for live (green) and dead (red) populations on a Nikon TE200U microscope.
Protein quantification
For secreted proteins, media surrounding each organoid was saved and pooled after the entirety of the organoid culture, with media changes occurring every 2 days. Secreted proteins were then measured via ELISA following the manufacturer’s protocols. To measure IL10 secreted from organoid culture, Peprotech’s human IL10 ABTS ELISA development kit and ABTS ELISA buffer kit were used (catalogue numbers 900-K21 and 900-K00, respectively). To understand changes in the PI3K-BCR-TLR super-pathway protein components, protein expression was quantified via the NanoString nCounter SPRINT Profiler after hybridization of protein lysates with the nCounter Vantage 3D Protein Heme Panel for Lystate (NanoString, catalogue number VRXC-HEME-12). In preparation for the protein lysate, organoids were degraded and filtered as detailed previously. Before protein quantification, HBL1 cells were pooled from at least 60 organoids and purified via negative selection with anti-CD40L magnetic beads. For one sample, cells from at least 60 organoids were pooled together. Regardless of CD40L cell inclusions, all samples were incubated with biotinylated anti-human CD40L (clone 24–31; BioLegend, catalogue number 310814). After incubation, CD40L-expressing stromal cells were removed using EasySep Human Biotin Positive Selection Kit II (STEMCELL Technologies, catalogue number 17663) by following the manufacturer’s protocol for negative selection. As per the NanoString protocol for protein processing for lysate samples, purified cells were lysed in SDS lysis buffer followed by detergent removal via Pierce Detergent Removal spin columns (Thermo Fisher, catalogue number 87777). Protein lysate was then quantified via Pierce protein determination kits (Thermo Fisher, catalogue number 23225). Protein lysates were prepared, hybridized to the heme panel protein tag set, and loaded into the nCounter SPRINT Profiler as per the manufacturer’s instructions. The resulting data were analysed with NanoString’s nSolver 4.0 software. Protein counts were normalized to the geometric means of positive controls and select housekeeping probes to adjust for technical variation in analyte abundance and analyte quality. nSolver analysis was then used to form several outputs, including overall protein expression, differentially expressed genes, heatmaps via z-score transformation and agglomerative clustering, and pathway scores, which were calculated as the first principal component of the pathway genes’ normalized expression.
Patient-derived tumour xenograft in mice
Viably frozen (90% FBS and 10% DMSO) previously established human PDX samples were obtained from one of the authors (G.I.) at Weill Cornell Medicine. Immunodeficient male or female NOD.Cg-rkdcscid Il2rgtm1Wjl/SzJ (NSG) mice breeding pairs (8–10 weeks old) were purchased from Jackson Laboratories (catalogue number 005557), bred to expand colonies and were then implanted subcutaneously with viably frozen PDX tumour fragments into the left flank under 2.5% isoflurane anaesthesia. Prior to implantation, tumour fragments were washed with sterile PBS and then minced into pieces fine enough to pass through an 18 gauge needle. Tumour pieces were separated into 2 mm3 volumes and drawn into a 1 ml syringe along with 200 μl PBS. This was then injected subcutaneously into the left flank just in front of the hind limb. Tumours were allowed to grow to a volume of no greater than 2,000 mm3 before passaging into subsequent mice. The same procedure was used during each passage into new mice, using tumour fragments obtained from the previous passage. Treatment was initiated when tumours reached an average size of 200 mm3. After tumors reached ~200 mm3, mice were randomly assigned into five arms (n = 3 per group): vehicle; CpG; CpG and MI2; CpG and idelalisib; and CpG with MI2 and idelalisib. Depending on the treatment arm, MI2 (25 mg per kg (body weight)) and/or idelalisib (40 mg per kg (body weight)) were administered intraperitoneally daily, and CpG (1 mg per kg (body weight)) was administered intratumorally. Tumour size was measured with a digital caliper 2–3 times a week. Tumour volumes were calculated using the following formula: smallest diameter2 × largest diameter × 0.5. The maximum tumour size/burden permitted by the IACUC committee was 2,000 mm3 and was not exceeded. The study was performed in accordance with Cornell’s IACUC-approved protocol 2017–0035.
RNA sequencing
The organoids were fabricated with 40,000 HBL1 cells with or without 40,000 CD40L-presenting stromal cells, and crosslinked by 50% VPM peptide and 50% DTT. After 4 days of organoid culture, cells were collected from ten organoids per condition (10 μl per organoid) to stain with anti-CD40L (Biotin; clone MK13A4; Thermo Fisher, catalogue number BMS153BT) for negative selection by beads (Thermo Fisher, catalogue number 11533D) and anti-CD20 (Biotin; clone 2H7; Thermo Fisher, catalogue number 13–0209-82) for positive selection by FACS sorter. Sorted lymphoma cells were lysed and RNA collected by TRIzol. Samples were run on Illumina NovaSeq in the S1 mode to generate paired-end 100 bp reads. Reads were trimmed while converting raw files to fastq files using bcl2fastq. Quality control of RNA-seq datasets was performed by FastQC. The reads were aligned to the National Center for Biotechnology Information (NCBI) genome browser build hg38 using TopHat v.2.1.1 and reads were counted within features using HTSeq v.2.0.1. Differential expression analysis was done with DESeq2 v.1.36.0 in R v.4.2.0. Differentially expressed genes were considered significant if the adjusted P-value was <0.05 and log2 FC was >1. All differentially expressed genes, ranked by log2 FC, were used in gene set enrichment analysis (GSEA). The gene set databases used were: H, hallmark gene sets; C1, positional gene sets; C2, curated gene sets; C3, regulatory target gene sets; C4, computational gene sets; C5, ontology gene sets; C6, oncogenic signature gene sets; C7, immunologic signature gene sets; C8, cell type signature gene sets.
Cyclic immunofluorescence
The ABC-DLBCL biopsy samples55 were acquired from Dr. W. Tam at Weill Cornell Medicine. Before proceeding with the tissue staining, all tissues were baked for 2 h in a 60 °C oven to ensure that the tissues are fully adhered to the slide and to preserve the tissue integrity across the staining and bleaching cycles. The tissues were deparaffinized using xylene dipping and rehydrated using descending concentrations of ethanol (100%, 95%, 80%, 70% and 50%). Finally, the tissues were washed with deionized water three times for 5 min each with gentle agitation. Heat-induced antigen retrieval was performed under basic conditions (pH 9) using 1× Dako’s 10× antigen retrieval solution (catalogue number S2367) in deionized water. The pressure cooker was set on the highest pressure setting and the timer was set for 15 min. The samples were left in the antigen retrieval solution for an additional 20 min at room temperature. Then, protein blocking was performed using Dako’s ready-to-use protein buffer (catalogue number X090930–2) for 30 min at room temperature. For each antibody in the panel, the antibodies were validated using immunofluorescence (IF) on normal human tonsil tissues (Biomax). The antibody concentration had to be in the range of 0.5–2 mg ml−1. Abcam Alexa Fluor conjugation kits (catalogue numbers ab236553, ab269820 and ab269823) were used to tag fluorescent probes to the antibodies. The conjugation protocol starts by adding 1 μl of the modifier to 10 μl of the antibody stock. This 11 μl mixture is then transferred to the AlexFluor of interest (for example, AF488, AF555, AF647) and incubated in the dark for 15 min. Finally, 1 μl of the quencher is added to the mixture. The conjugated antibodies can be used as soon as 5 min after the conjugation. For an additional verification step, the conjugated antibodies were validated on normal human tonsil tissues and compared to the pre-conjugation results. After the conjugations and the validations, the multiplexed panel is designed for cyclic immunofluorescence. This involved cycles of antibody staining, imaging, bleaching and additional staining. The number of markers visualized in each cycle was maximized without having spectral overlap between the fluorophores conjugated to the antibodies. The fluorophores were inactivated with a bleaching step between cycles using 4.5% H2O2 and 24 nM NaOH mix in PBS. This mix was incubated with the tissues for 1 h at room temperature in the presence of white light. The tissues were then washed three times with 1× PBS for 5 min each using gentle agitation to remove any residual bleaching solution. The following antibodies were used: CD4 (AF647; EPR6855; Abcam, catalogue number ab196147), CD20 (AF488; L26; Thermo Fisher, catalogue number 50–0202-82), CD40 (AF488; D8W3N; Cell Signaling Technology, catalogue number 40868S), CD40LG (AF647; D5J9Y; Cell Signaling Technology, catalogue number 15094), TRAF3 (AF488; 12H13L59; Thermo Fisher; catalogue number 700121). All antibodies were initially validated by the manufacturer and used according to the manufacturer’s recommended dilutions.
For data analysis, the multiplex imaging cycle shift was corrected using a fast Fourier transform algorithm where the cross-correlation between two images is calculated to get translational offsets. First, multicore region images are registered and each single-core multiplex image is cropped using the DAPI channel. The individual core multicycle DAPI channel images are registered for fine-tuning. After registration, single cells were segmented using a deep learning algorithm56 with DAPI marker for nuclei segmentation and combined CD20 and CD4 markers for cytosol segmentation. Single-cell mean expression levels are extracted from the single-cell masks with marker intensity images and the z-score normalized for analysis.
Organoid imaging
After 4 days in culture, organoids were fixed in 4% paraformaldehyde (Electron Microscopy Sciences, catalogue number 15710) for 15 min at room temperature. Cells were permeabilized with 0.5% Triton-X 100 (Sigma, catalogue number 93443–500 ml) for 30 min. Organoids were resuspended in 20% normal donkey serum (Abcam, catalogue number AB747525ML) for blocking for 30 min. The primary antibody staining solution was added and incubated overnight at 4 °C. Organoids were incubated in secondary antibody staining solution with DAPI (Sigma, catalogue number D9542–10MG) and phalloidin (Alexa Fluor 555; Thermo Fisher, catalogue number A34055) for 4 hours (h) at 4 °C. Organoids were imaged on Zeiss LSM700, Zeiss LSM710 or LSM900 confocal microscopes. Images were analysed with Zeiss Zen software, and IgM puncta were counted manually on maximum intensity projections of single-cell z-stack images. Primary antibodies used for staining include anti-IgM (clone SA-DA4; Thermo Fisher, catalogue number 14–9998-82), anti-CD20 (clone SP32; Thermo Fisher, catalogue number MA5–16334), anti-CD40 (polyclonal; Thermo Fisher, catalogue number PA5–32325) and anti-TRAF3 (clone 12H13L59; Thermo Fisher, catalogue number 700121). Secondary antibodies include donkey anti-rabbit IgG (Alexa Fluor Plus 488; Thermo Fisher, catalogue number A-21206) and donkey anti-mouse IgG (Alexa Fluor plus 647; Thermo Fisher, catalogue number A-31571). Antibodies were also validated for use using positive and negative control samples with dilutions and conditions based on the manufacturer’s recommendation or our previous experience. The absence of a primary antibody was used for validating staining for all antibodies tested for imaging.
Statistics and reproducibility
All studies were replicated three times and results were consistent across independent experimental runs, with the exception of the NSG mice in vivo tumour implantation studies that were performed once due to the associated costs and previous experience with published work5. Investigators were blinded during imaging analyses, mouse experiments and drug response tests. Blinding was performed without providing information of the type of organoids or treatment groups. Randomization was only performed in in vivo studies. Sample sizes of organoids were selected based on statistical power calculations and previous experience with these metrics5,57–60. The sample size of animal studies was based on published work5. No data from intact hydrogels or animal studies were excluded. All statistical analysis was performed using GraphPad Prism 9 software. Data are generally presented as mean ± s.e.m., with figure legends indicating specific statistical tests, including two-tailed unpaired Student t-test or one-way or two-way ANOVA, with indicated multiple comparison tests. Individual data points and distributions are included in plots and data distribution was assumed to be normal but this was not formally tested.
Reporting summary
Further information on research design is available in the Nature Portfolio Reporting Summary linked to this article.
Extended Data
Extended Data Fig. 1 |. Hydrogel functionality modulates the survival of B cell lymphomas.
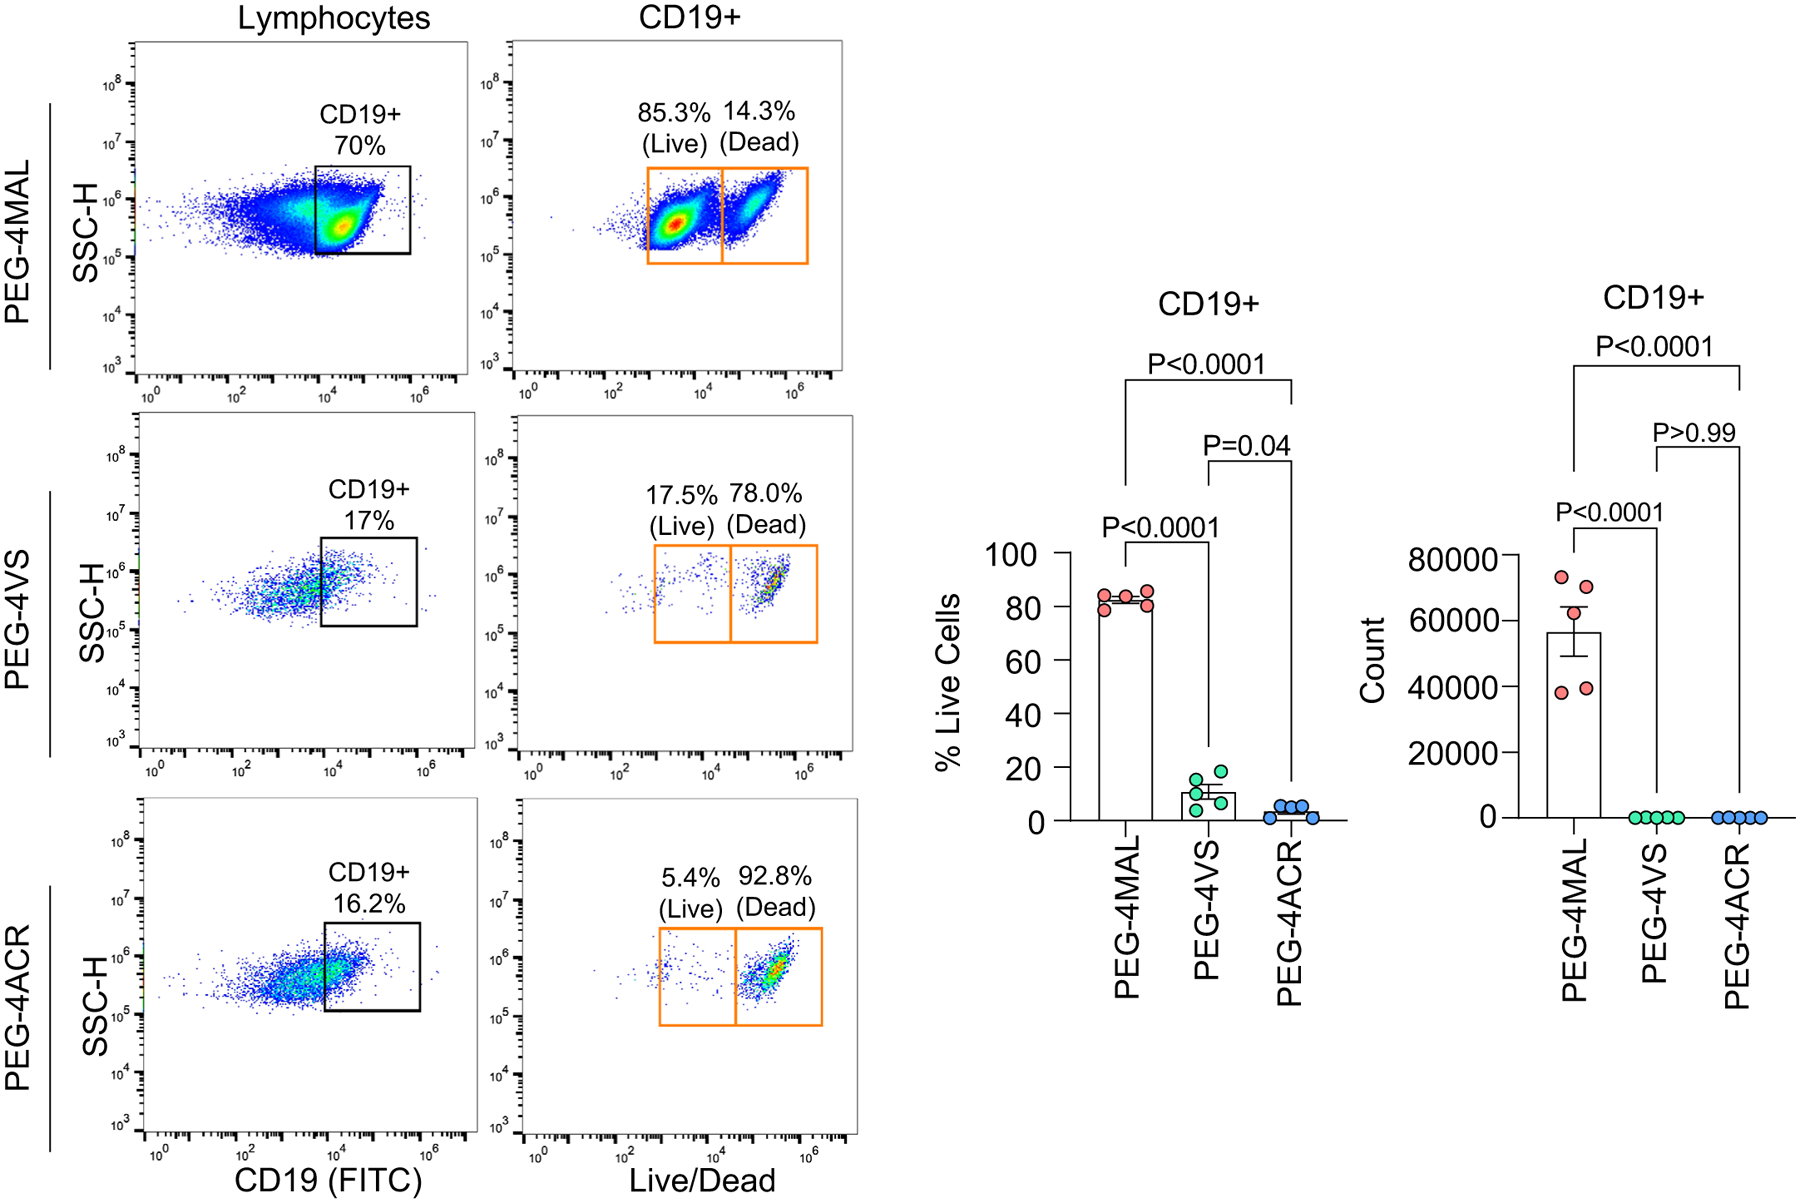
Left: Flow cytometry gating. Right: Percent and count of live CD19 + WEHI B cell lymphoma cells cultured in hydrogels with PEG-4MAL, PEG-4VS, and PEG-4ACR functionalities after 48 h of culture. One-way ANOVA with Tukey’s multiple-comparison test (mean ± s.e.m., n = 5, where each dot represents a hydrogel).
Extended Data Fig. 2 |. Characterization of hydrogel-based organoid cultures.
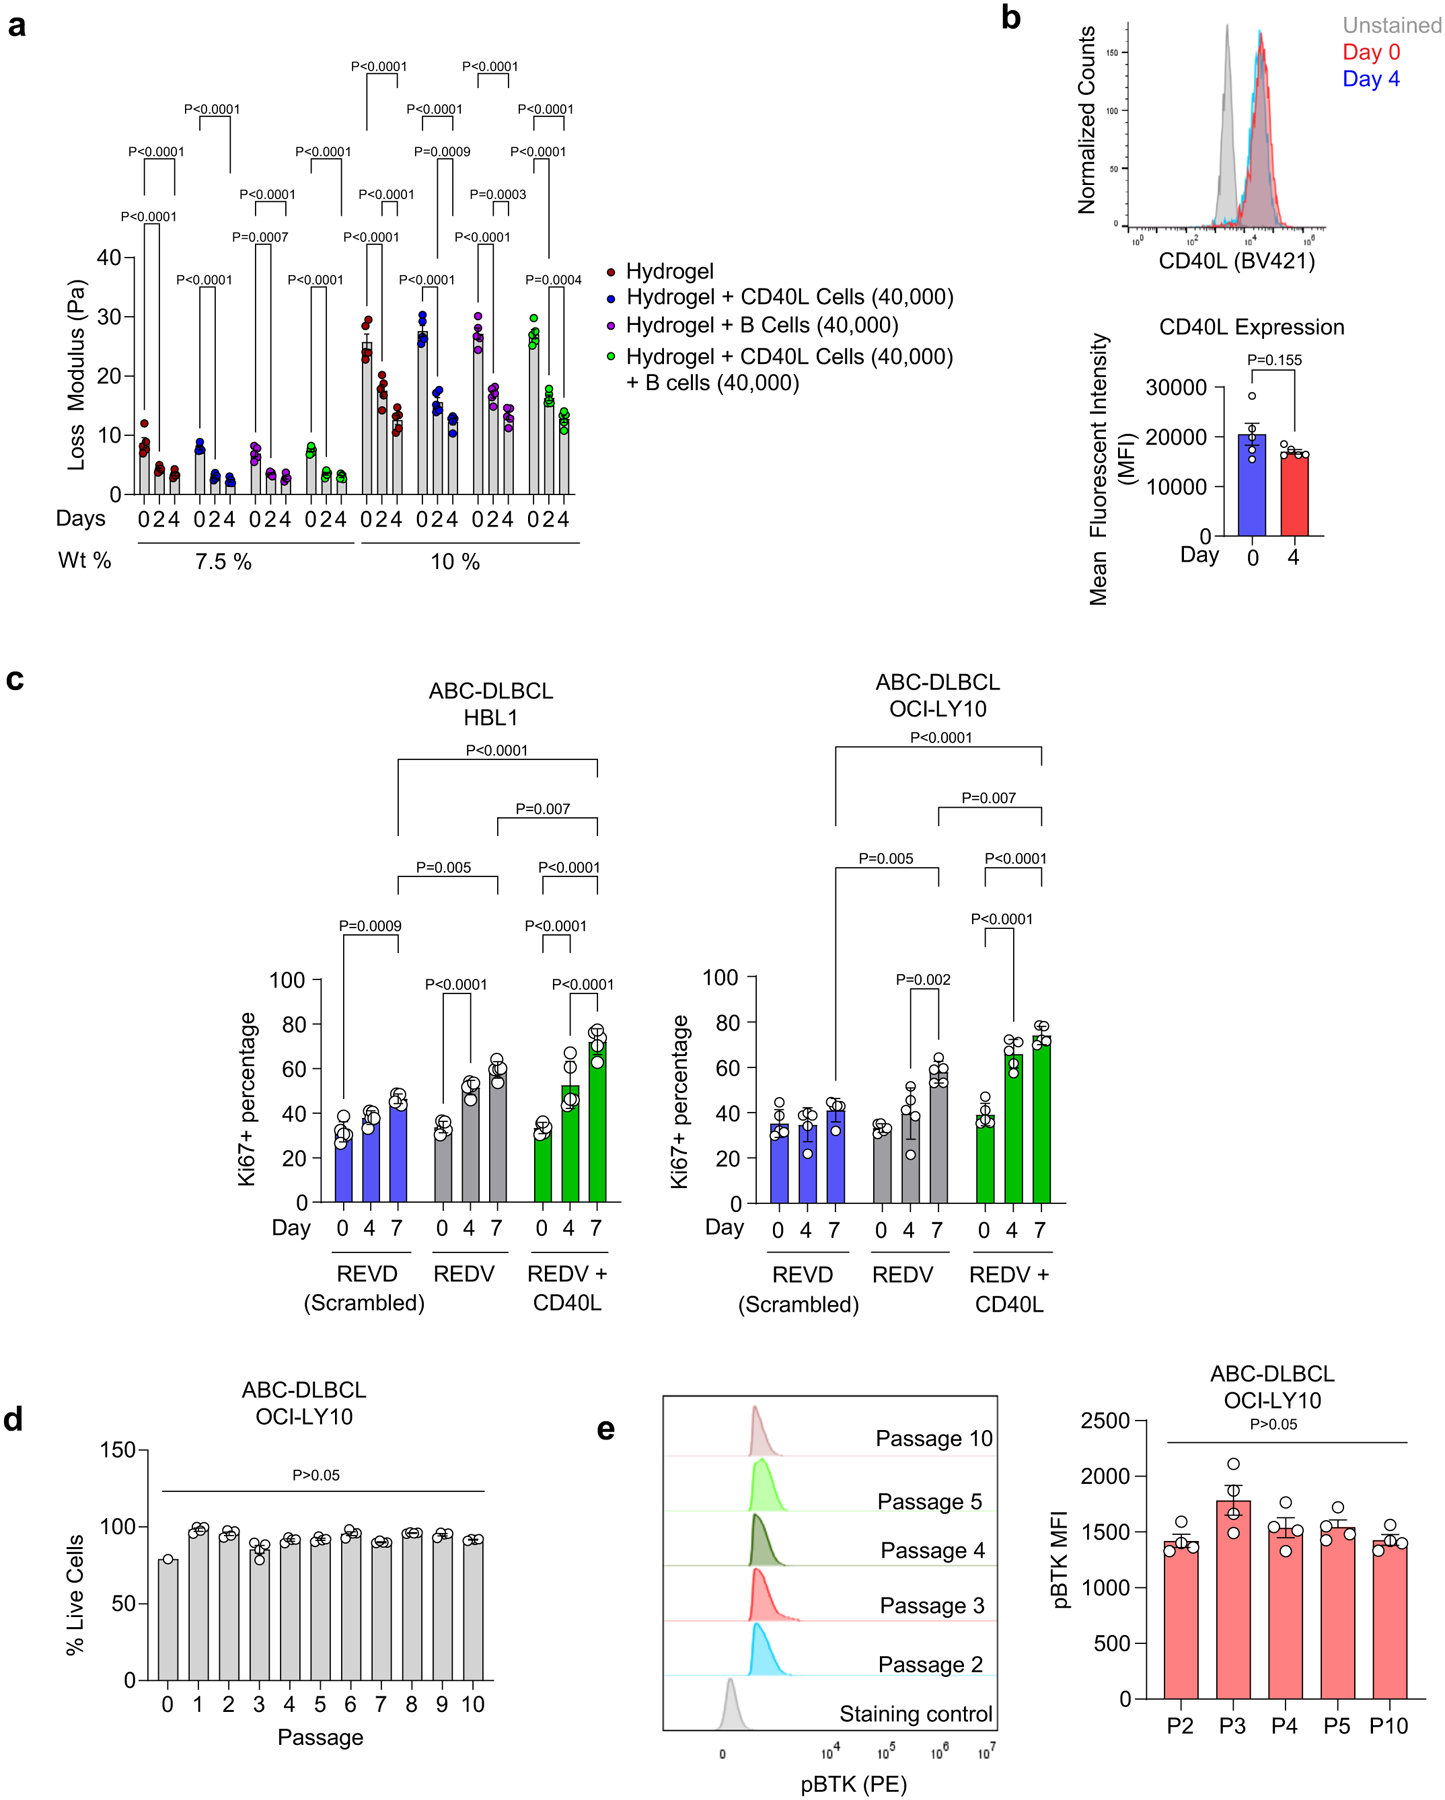
a, Loss modulus of hydrogels with and without cells for different macromer densities. Two-way ANOVA with Tukey’s multiple-comparison test (mean ± s.e.m., n = 5). b, Expression of CD40L on mitomycin-treated CD40L-stromal cells over 4 days of hydrogel culture. Two-tailed unpaired t-test (mean ± s.e.m., n = 5). c, Percentage of Ki67 + HBL1 and OCI-LY10 grown for 7 days in REDV, REDV + CD40L, or REVD-functionalized organoids. One-way ANOVA with Tukey’s multiple-comparison test (mean ± s.e.m., n = 5). d-e, Long-term passaging. (d) Flow cytometry tracked viability at each passage (mean ± s.e.m., n = 4). (e) Left: pBTK histogram at passages 2, 3, 4, 5, and 10 gated for live cells. Right: pBTK MFI value at passages 2, 3, 4, 5, and 10. Organoids passaged after 96 h of culture. One-way ANOVA with Tukey’s multiple-comparison test (mean ± s.e.m., n = 4). Each dot in a–e represents a hydrogel-based organoid.
Extended Data Fig. 3 |. T cell signal attenuates the therapeutic response to MALT1 inhibition in human and canine ABC-DLBCLs.
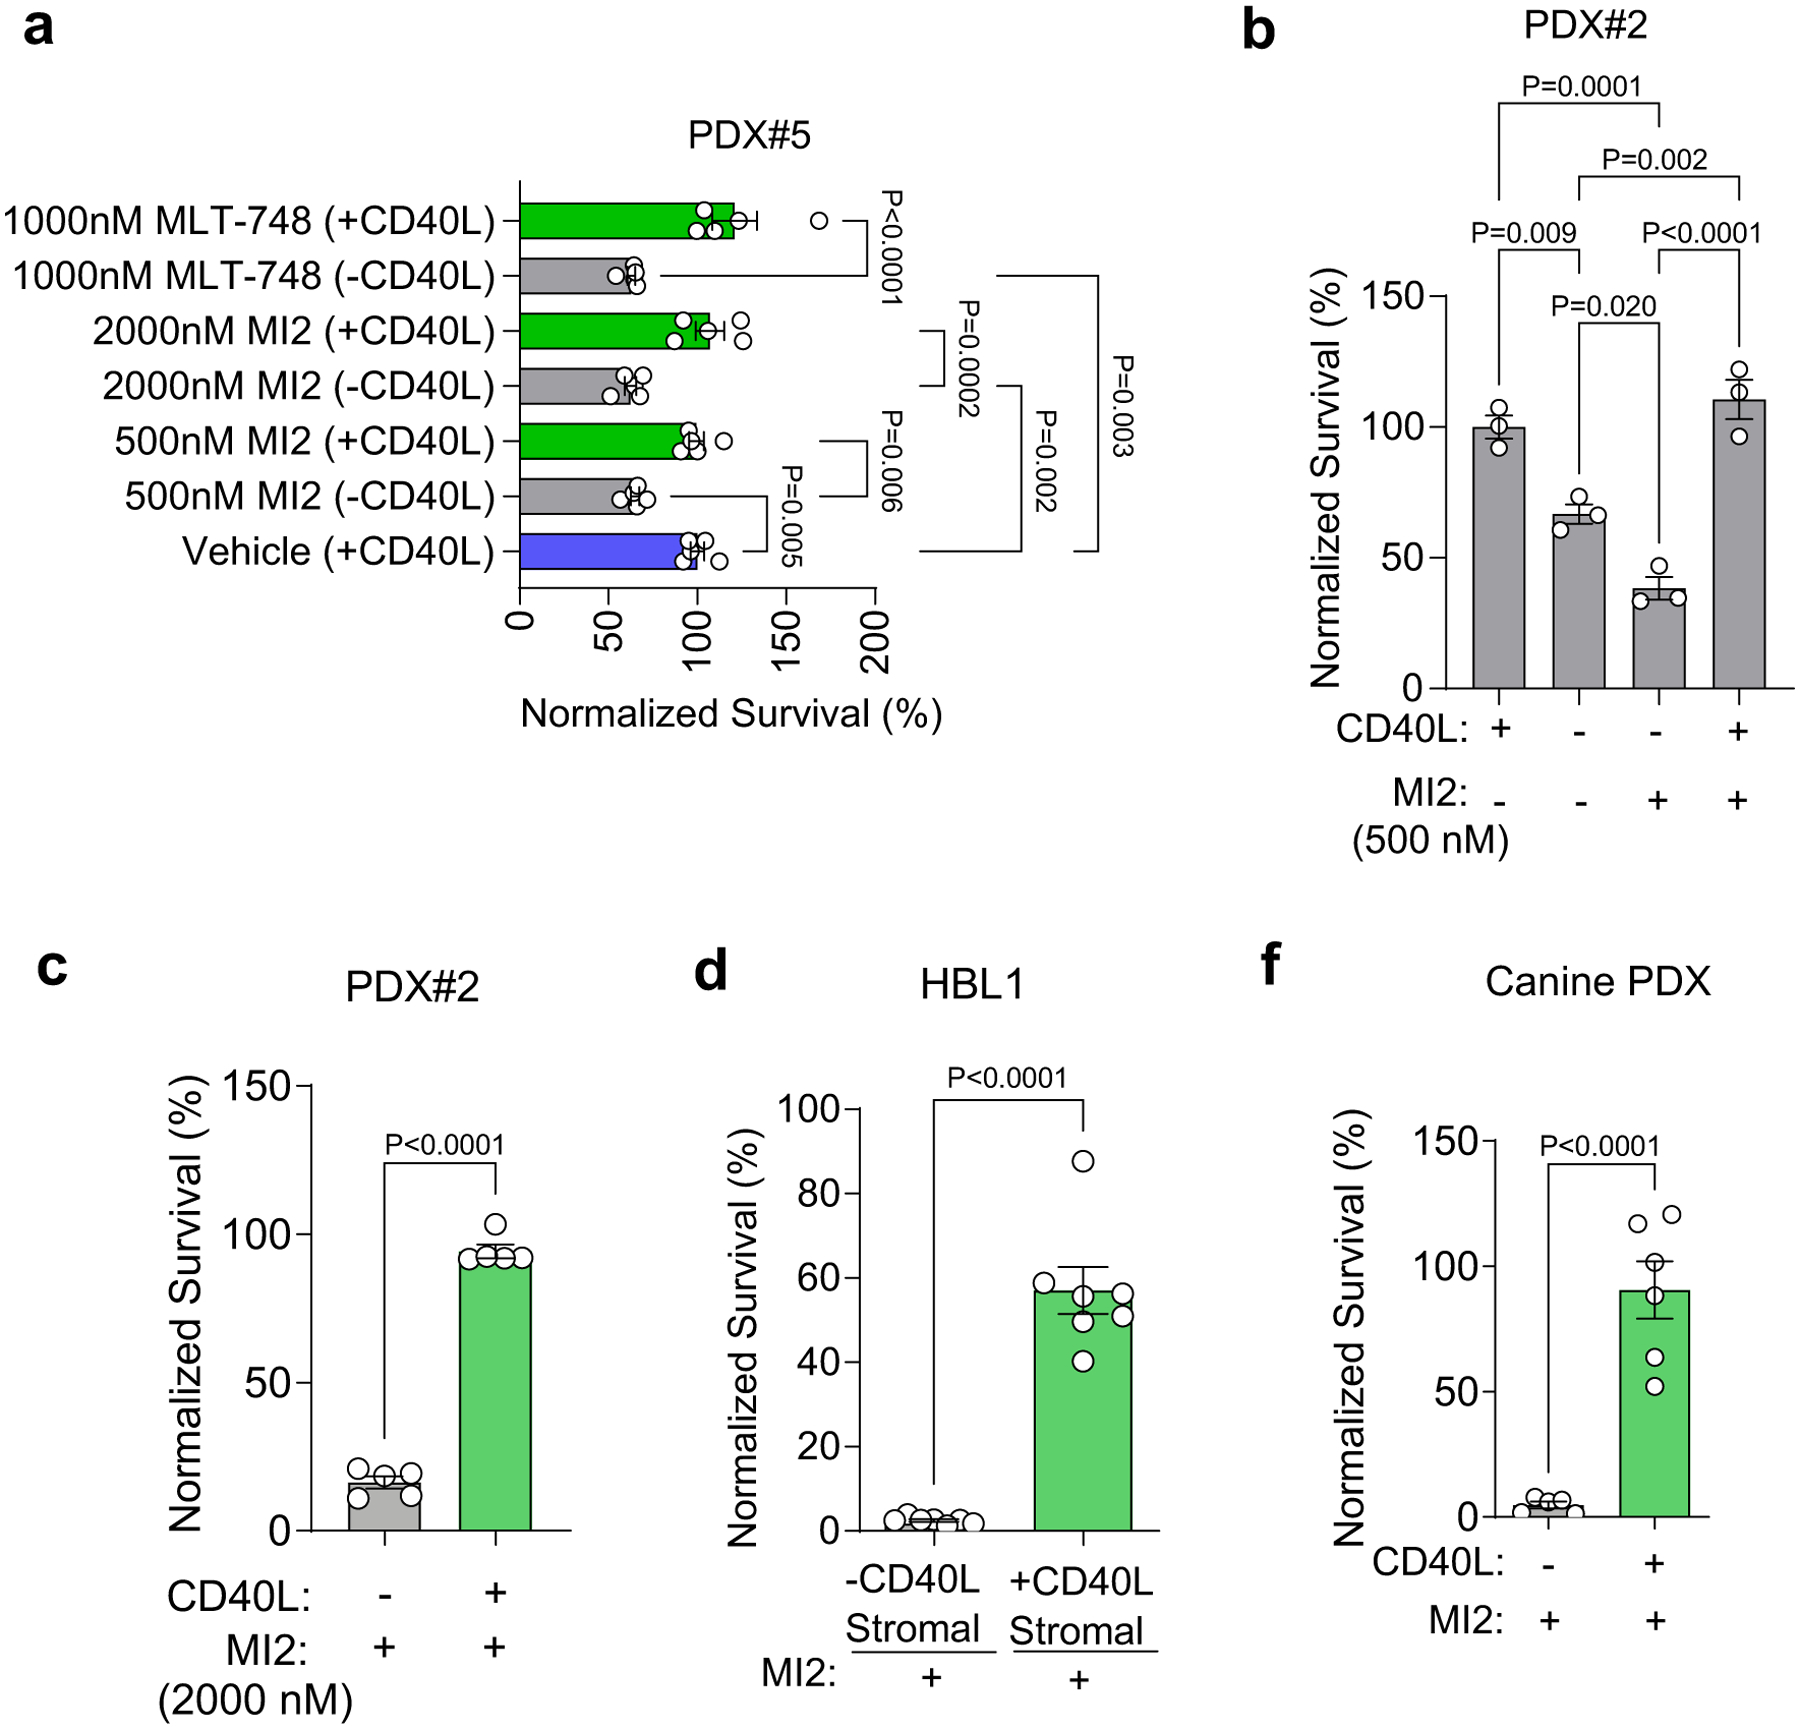
a, Survival (normalized to vehicle-treated) of human ABC-DLBCL PDXs cultured in organoids with and without CD40L after 48-h culture, followed by 48-h treatment with 500 or 2000 nM MI2 treatment or 1000 nM MLT-748 MALT1 inhibitor compound. One-way ANOVA with Tukey’s multiple-comparison test (mean ± s.e.m., n = 4, PDX#4; n = 5, PDX#5, where each dot is a hydrogel-based organoid). b-c, Survival (normalized to vehicle-treated) human ABC-DLBCL PDX cells cultured in organoids with and without CD40L after 48-h culture, followed by 48-h treatment with MALT1 inhibitor MI2 at 500 nM (b) and 2000 nM (c) treatment. One-way ANOVA with Tukey’s multiple-comparison test (b) and two-tailed unpaired t-test (c), (mean ± s.e.m., n = 3 for (b), n = 5 for (c), where each dot is a hydrogel-based organoid). d, Survival (normalized to vehicle-treated) of HBL1 cells cultured in organoids with baseline stromal cell and CD40L-transduced stromal cell after 48-h culture, followed by 48-h treatment with 500 nM MI2 treatment. Two-tailed unpaired t-test (mean ± s.e.m., n = 7). e, Survival (normalized to vehicle-treated) of canine PDX cells cultured in organoids with and without CD40L-stromal cells after 48-h culture, followed by 48-h treatment with 2000 nM MI2 treatment. Two-tailed unpaired t-test (mean ± s.e.m., n = 5 for -CD40L and n = 6 for +CD40L).
Extended Data Fig. 4 |. Characterization of hydrogel-based organoids.
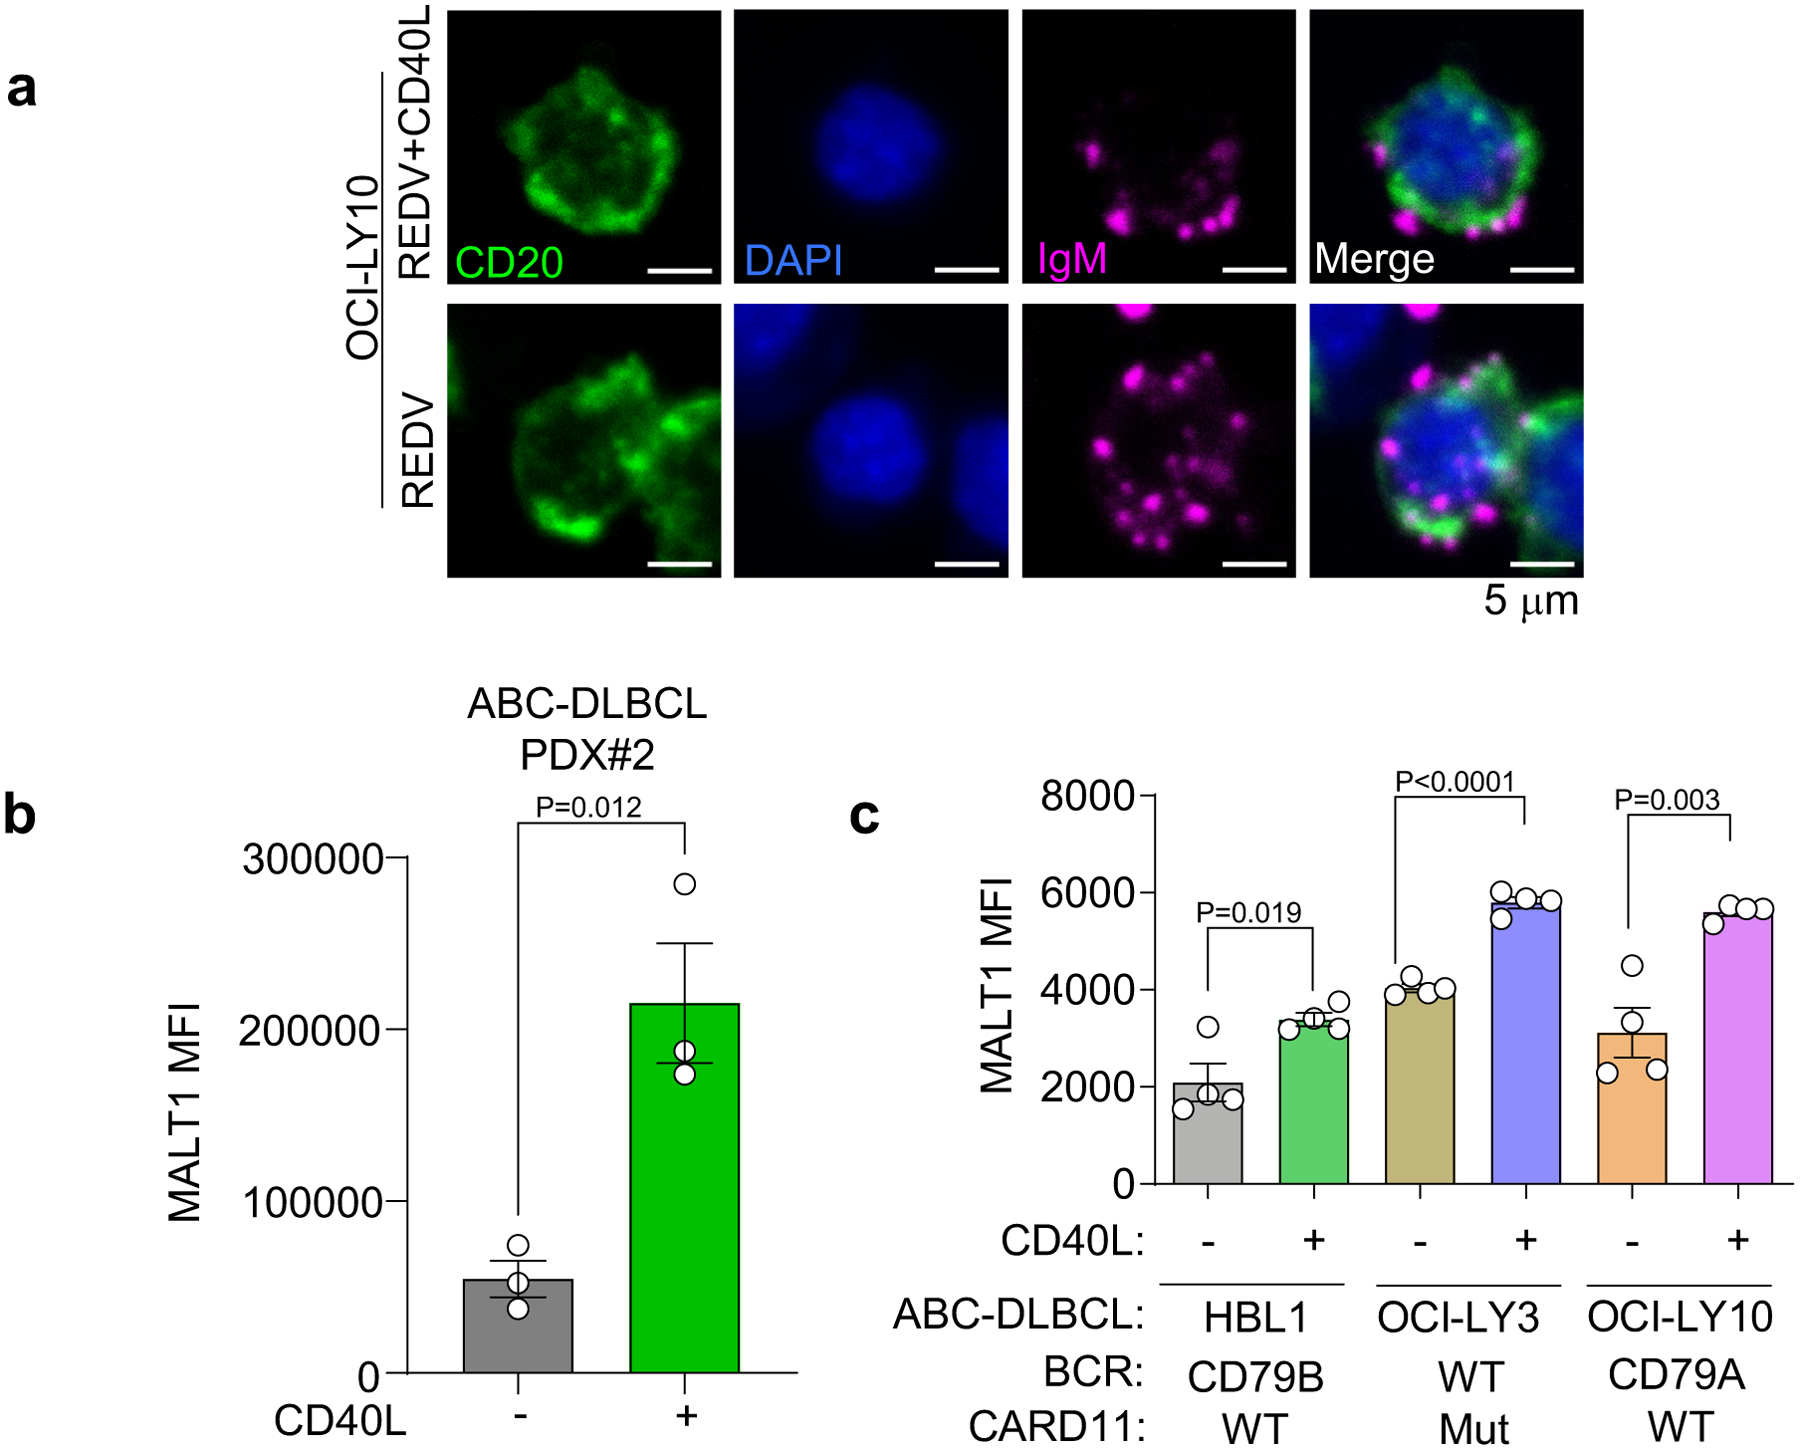
a, BCR (magenta) puncta expression at the single-cell level on CD20 (green) expressing OCI-LY10 in the presence or absence of CD40L-stromal cells, with DAPI (blue). Data representative of n = 5 hydrogels for each condition. b, Median fluorescent intensity (MFI) of MALT1 in human ABC-DLBCL PDX cells cultured in ±CD40L-stromal cell conditions for 96 h. Two-tailed unpaired t-test between two groups within a cell line (mean ± s.e.m., n = 3, where each dot is a hydrogel-based organoid). c, MFI of MALT1 in human ABC-DLBCL cell lines cultured in ±CD40L-stromal cell conditions for 96 h. Two-tailed unpaired t-test between two groups within a cell line (mean ± s.e.m., n = 4, where each dot is a hydrogel-based organoid).
Extended Data Fig. 5 |. Expression of BCR pathway proteins in ABC-DLBCL organoids.
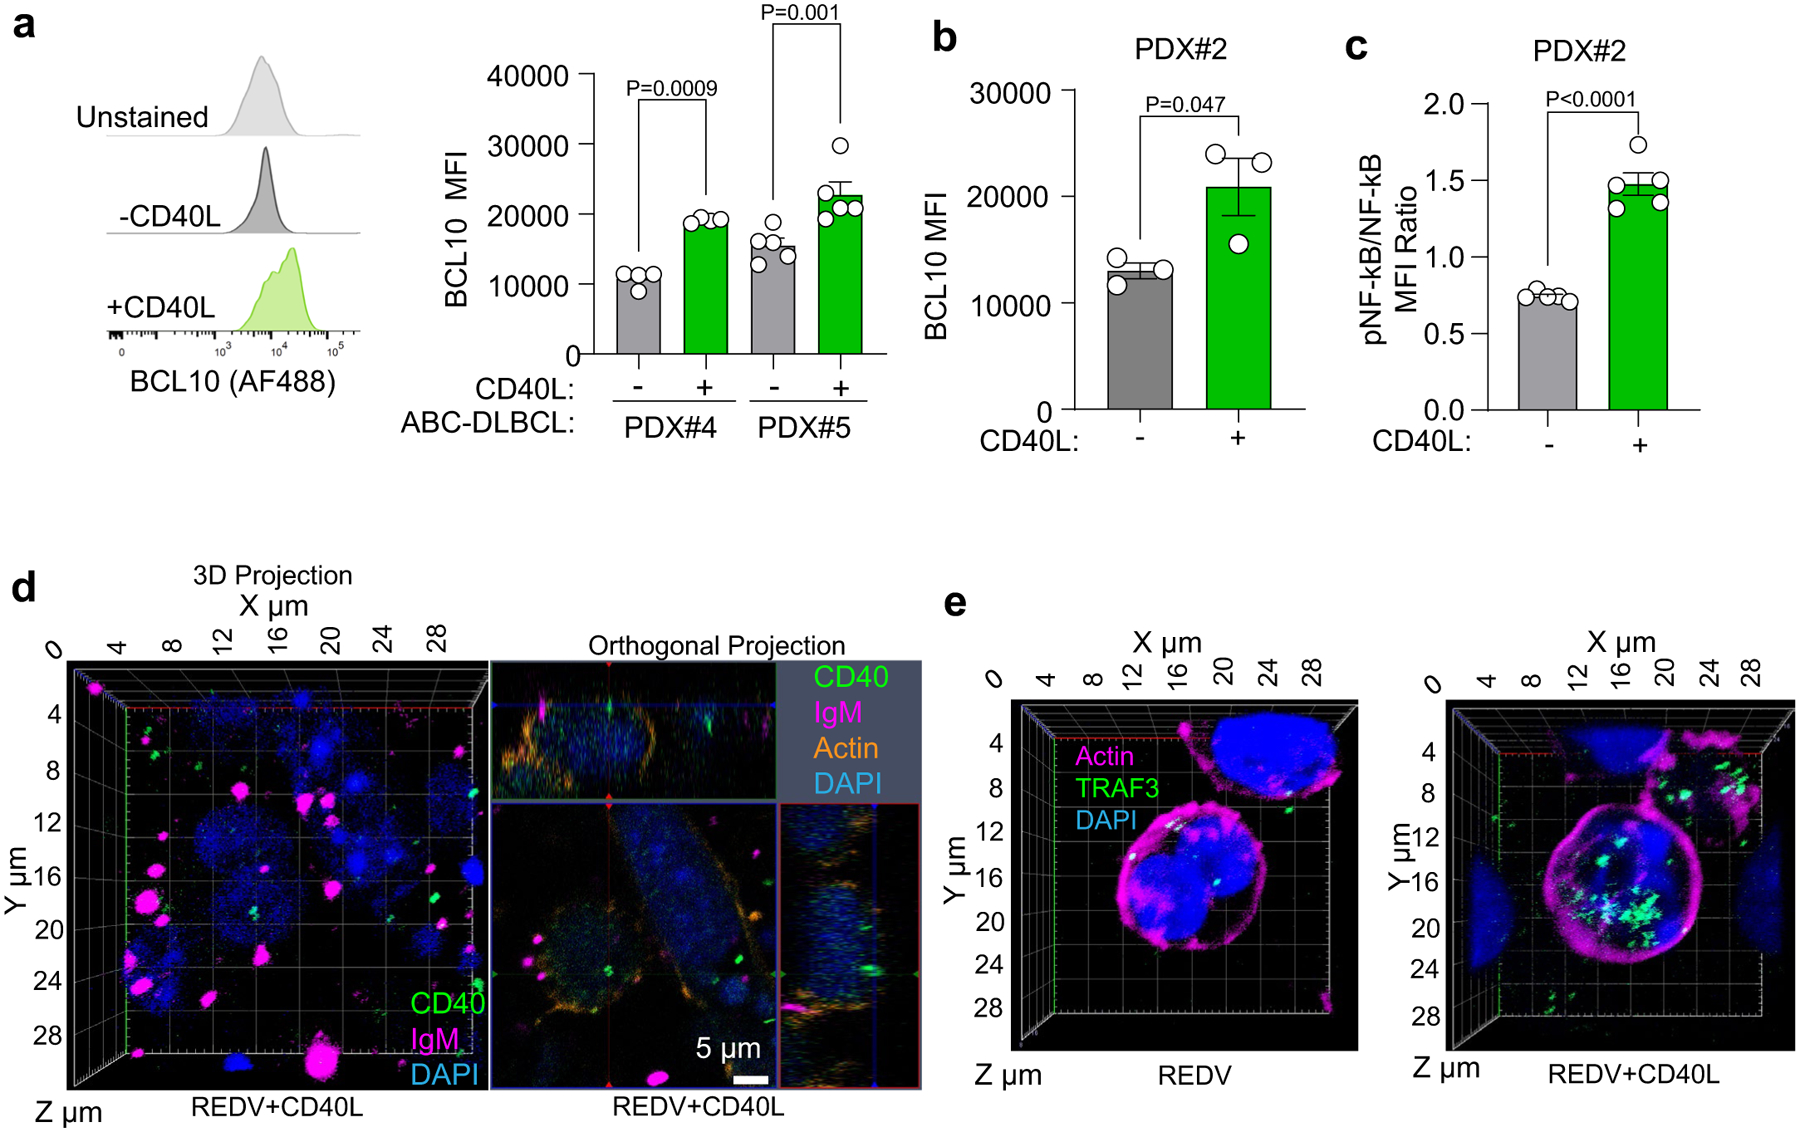
a, Left: Representative flow cytometry histograms. Right: Median fluorescent intensity (MFI) of BCL10 in human PDX cells cultured in ±CD40L-stromal cell conditions for 96 h. Two-tailed unpaired t-test (mean ± s.e.m., n = 4 for PDX#4; n = 5 for PDX#5; where each dot is a hydrogel-based organoid). b, MFI of BCL10 in human ABC-DLBCL PDX cells cultured in ±CD40L-stromal cell conditions for 96 h. Two-tailed unpaired t-test between two groups within a cell line (mean ± s.e.m., n = 3, where each dot is a hydrogel-based organoid). c, Ratio of MFI of pNF-κB/NF-κB in human ABC-DLBCL PDX cells cultured in ±CD40L-stromal cell conditions for 96 h. Two-tailed unpaired t-test (mean ± s.e.m., n = 5 for PDX#2). d, CD40 (green) spatial localization relative to IgM BCR (magenta) puncta in HBL1 ABC-DLBCLs grown in REDV-functionalized hydrogels in the presence of CD40L-stromal cells. Left: 3D projection of IgM BCR, DAPI (blue), and CD40. Right: Orthogonal projection with IgM BCR, DAPI, and actin (orange). Data representative of n = 3 organoids. e, 3D projection of spatial expression of TRAF3 (green) in HBL1 ABC-DLBCLs grown in REDV-functionalized hydrogels in the presence or absence of CD40L-stromal cells, with DAPI (blue) and actin (magenta). Data representative of n = 3 organoids.
Extended Data Fig. 6 |. Single-cell MALT1 fluorescent intensity and protein count.
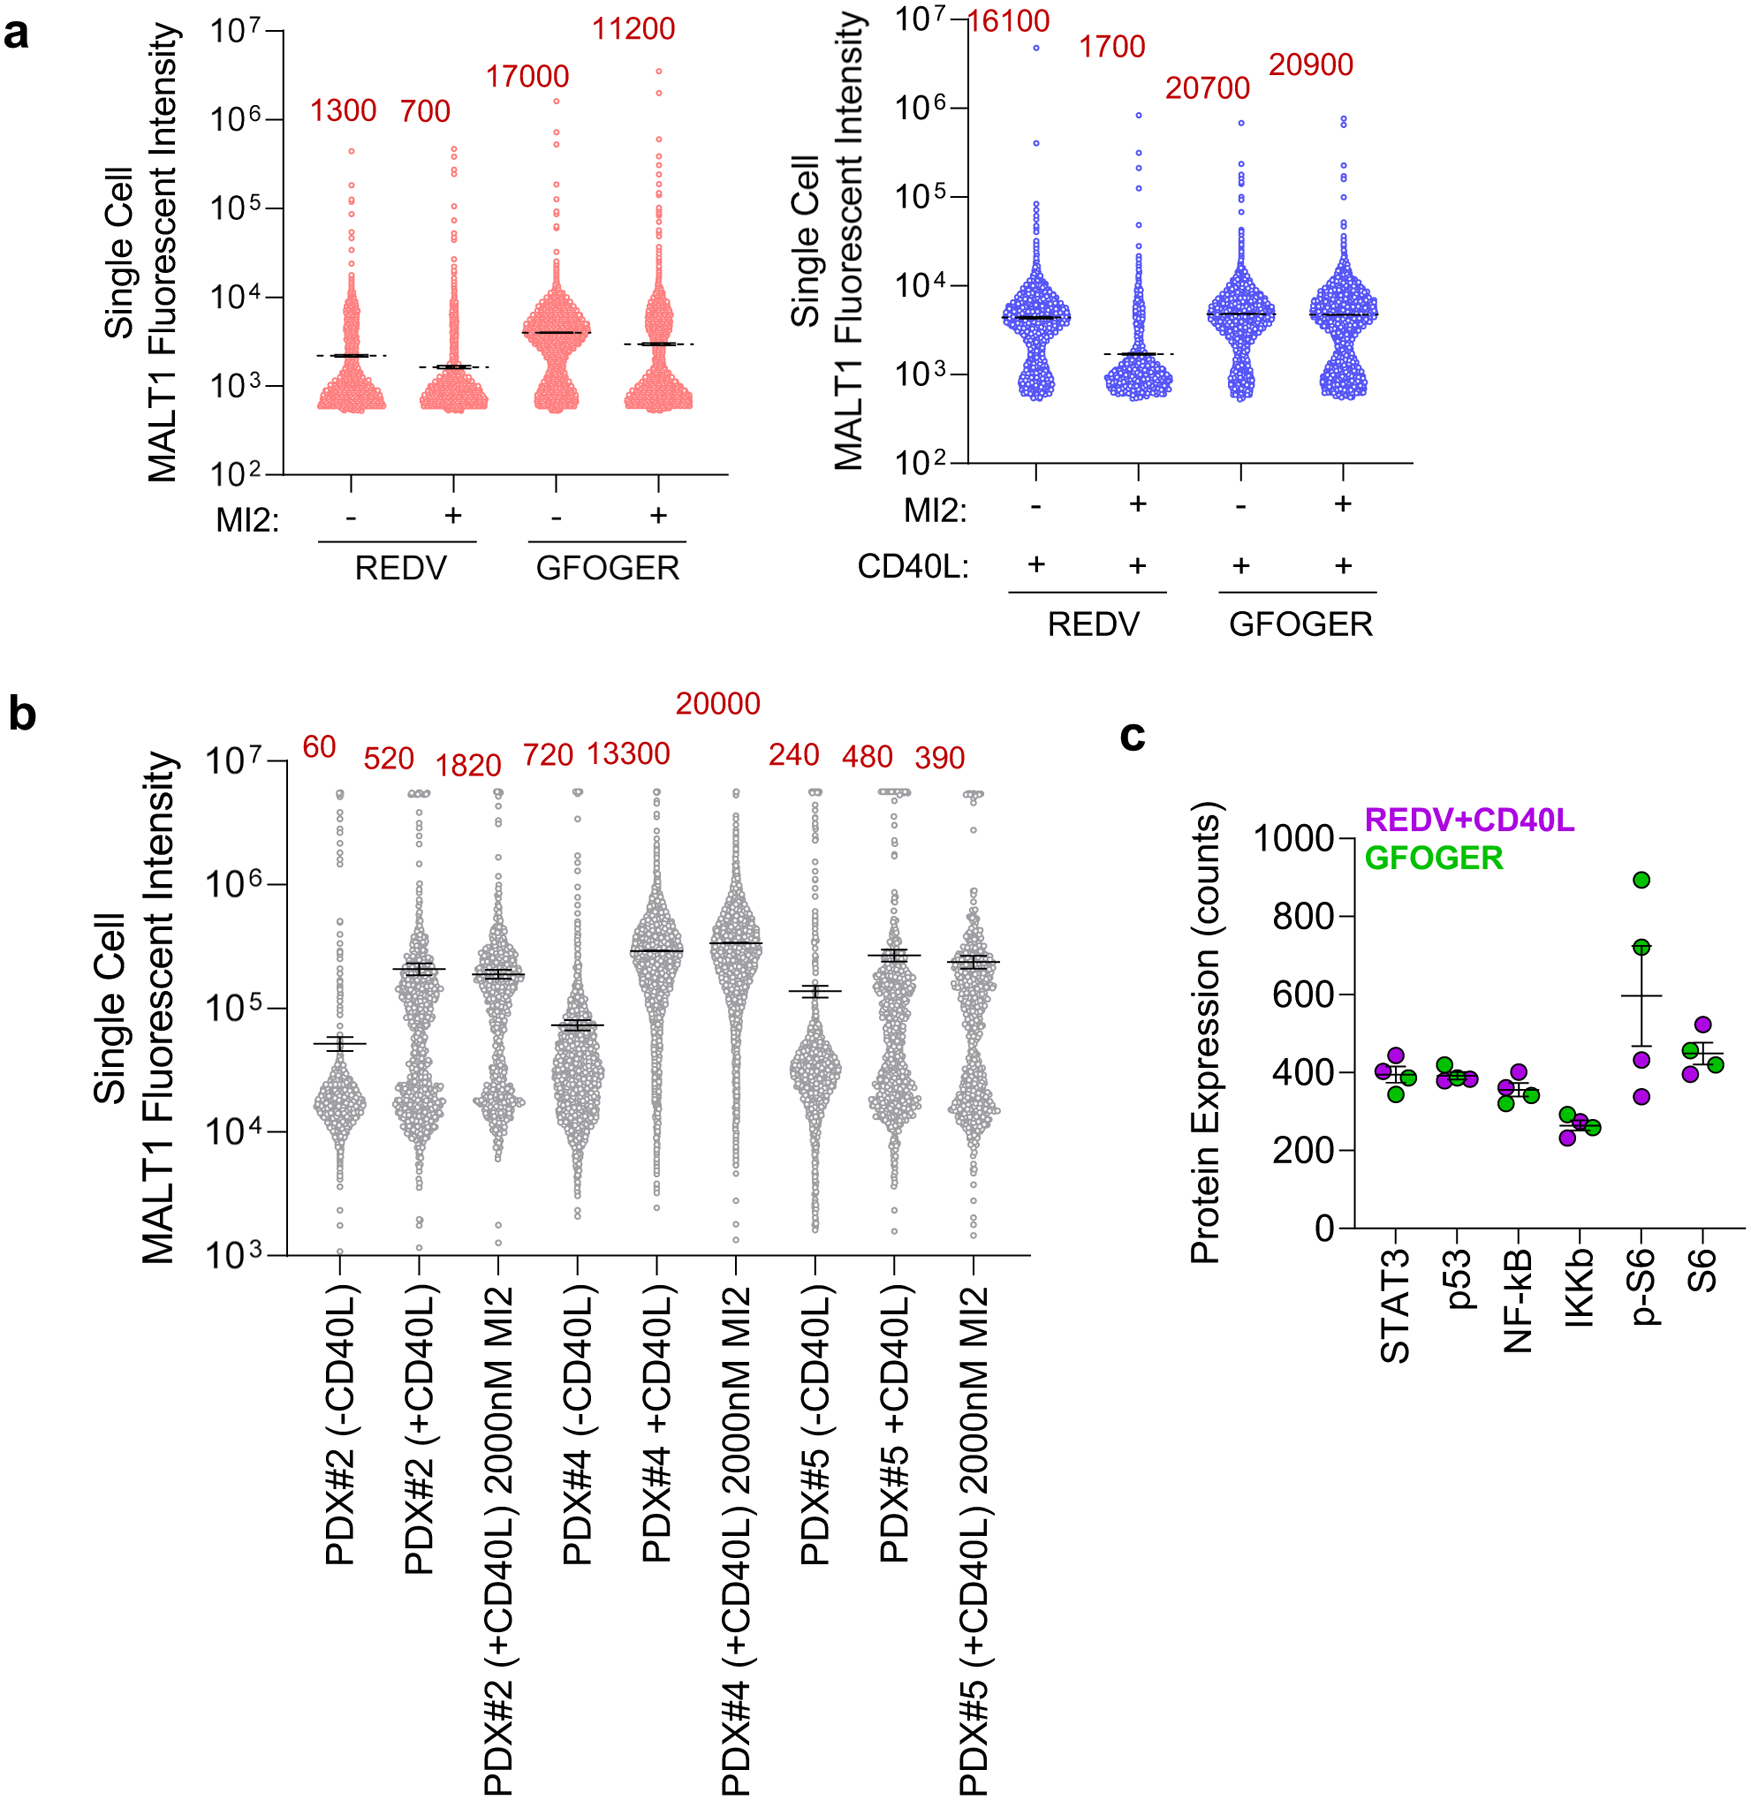
a, Distribution of fluorescent intensity of HBL1 cells from six separate organoids for MALT1 after 48 h of culture in indicated conditions and subsequent 48 h of MI2 treatment. Total number of cells is indicated in red. Organoids without (left) and with CD40L-stromal cells (right) were respectively treated with 250 nM and 2000 nM MI2. b, Distribution of fluorescent intensity of ABC-DLBCL PDXs from six separate organoids for MALT1 after 48 h of culture in indicated conditions and subsequent 48 h of MI2 treatment. Organoids without and with CD40L-stromal cells were respectively treated with 2000 nM MI2. c, Protein expression of the six highest expressed proteins, from NanoString analysis in Fig. 4, in cells cultured in GFOGER-functionalized organoids and REDV-functionalized organoids with CD40L-stromal cells. Results indicate mean ± s.e.m. of two replicates, with each replicate including at least 60 organoids.
Extended Data Fig. 7 |. CD40L, ECM, and hydrogel stiffness regulate TLR9 and pSRC expression in PDX organoids.
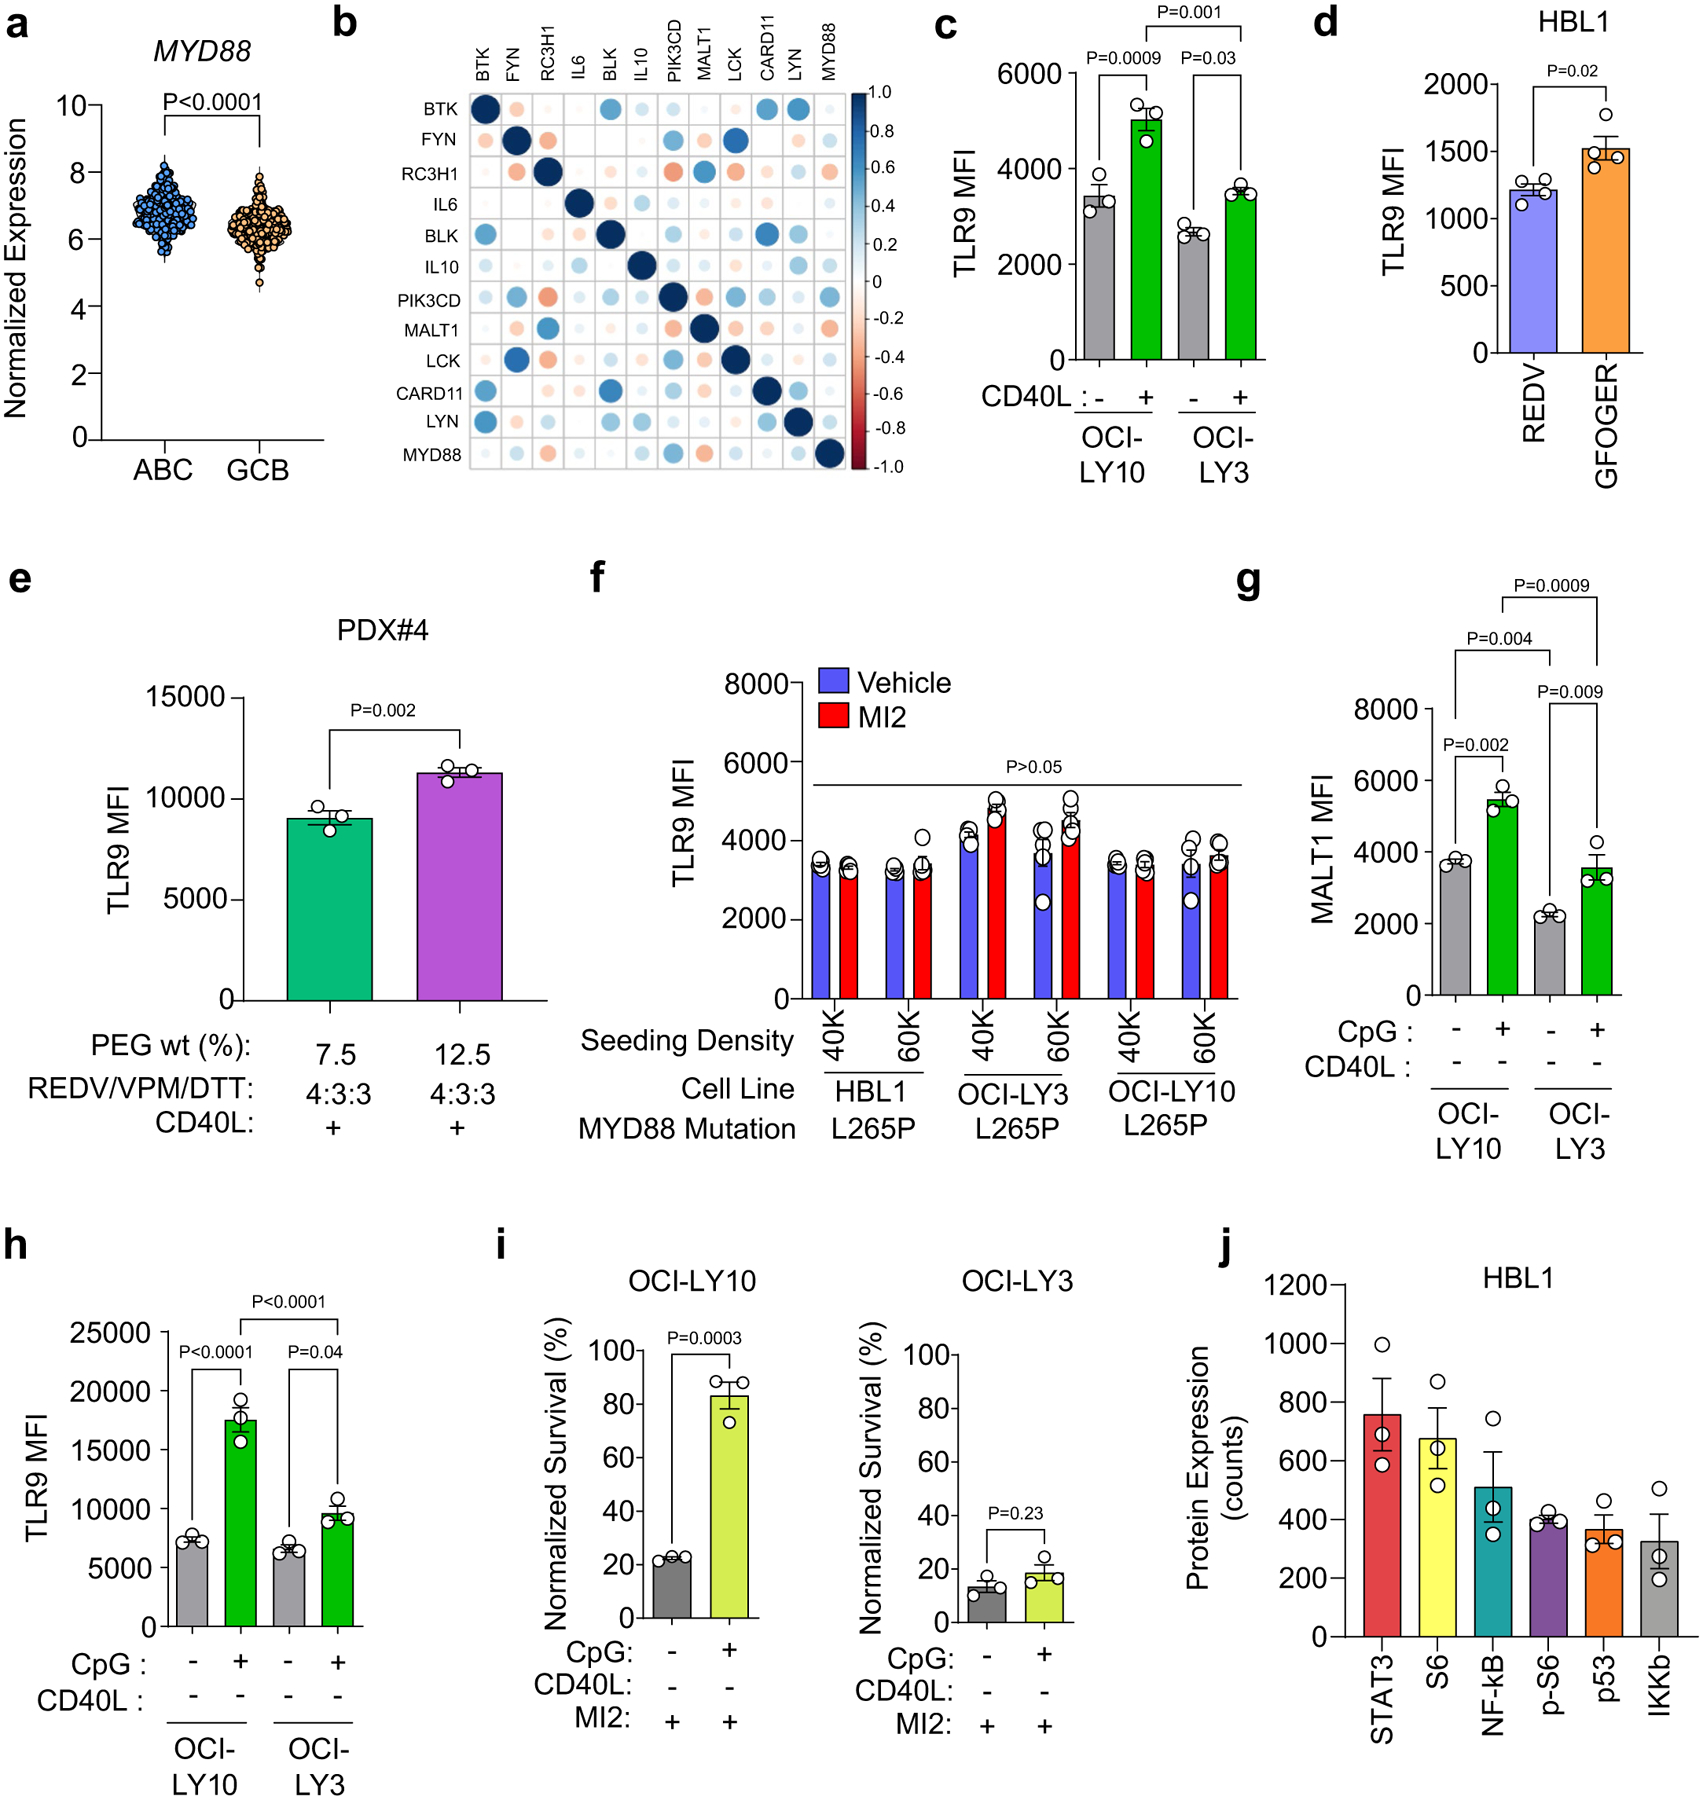
a, Gene expression of MYD88 in ABC-DLBCL (n = 242) and GCB-DLBCL (n = 264) patients from the HMRC cohort. Data were quantile normalized and log2 transformed. Two-tailed unpaired t-test. b, Pearson’s correlations for the genes of interest in the ABC-DLBCL (n = 242) samples. c, TLR9 median fluorescent intensity (MFI) for OCI-LY10 and OCI-LY3 cells cultured in ± CD40L-stromal cells conditions for 96 h. One-way ANOVA with Tukey’s multiple-comparison test (mean ± s.e.m., n = 3). d, TLR9 MFI for human ABC-DLBCL HBL1 cells cultured in REDV or GFOGER-functionalized organoids without CD40L-stromal cells for 96 h. Two-tailed unpaired t-test (mean ± s.e.m., n = 4). e, Effect of stiffness, modulated by indicated PEG-4MAL macromer densities (w/v%) at 4:3:3 REDV to VPM and DTT crosslinkers, on TLR9 in human PDX cells after 96-h culture Two-tailed unpaired t-test (mean ± s.e.m., n = 5) f, TLR9 MFI for human ABC-DLBCL cells cultured in REDV-presenting hydrogels for 96 h with different cell seeding density. In indicated groups (red), MI2 was added at 2000 nM for the last 48 h of culture. Two-tailed unpaired t-test for each cell line (mean ± s.e.m., n = 5). g-h, Effect of 1 μM CpG addition on MALT1 (g) and TLR9 (h) expression in cells cultured in REDV-functionalized hydrogel-based organoids for 96 h. One-way ANOVA with Tukey’s multiple-comparison test (mean ± s.e.m., n = 3). i, Survival (normalized to vehicle-treated) of OCI-LY10 and OCI-LY3 cells cultured in REDV-functionalized hydrogel-based organoids without and with 1 μM CpG for 96 h, including 48 h of 2000 nM MI2 treatment. Two-tailed unpaired t-test (mean ± s.e.m., n = 3). j, Protein expression of the six highest expressed proteins measured via NanoString nCounter SPRINT Profiler in HBL1 cells after 96-h culture in REDV-functionalized organoids with 1 μM CpG. mean ± s.e.m., n = 3 replicates each representing 60 organoids.
Extended Data Fig. 8 |. pSRC median fluorescent intensity for human ABC-DLBCL cell lines and PDX cells cultured in indicated conditions for 96 h.
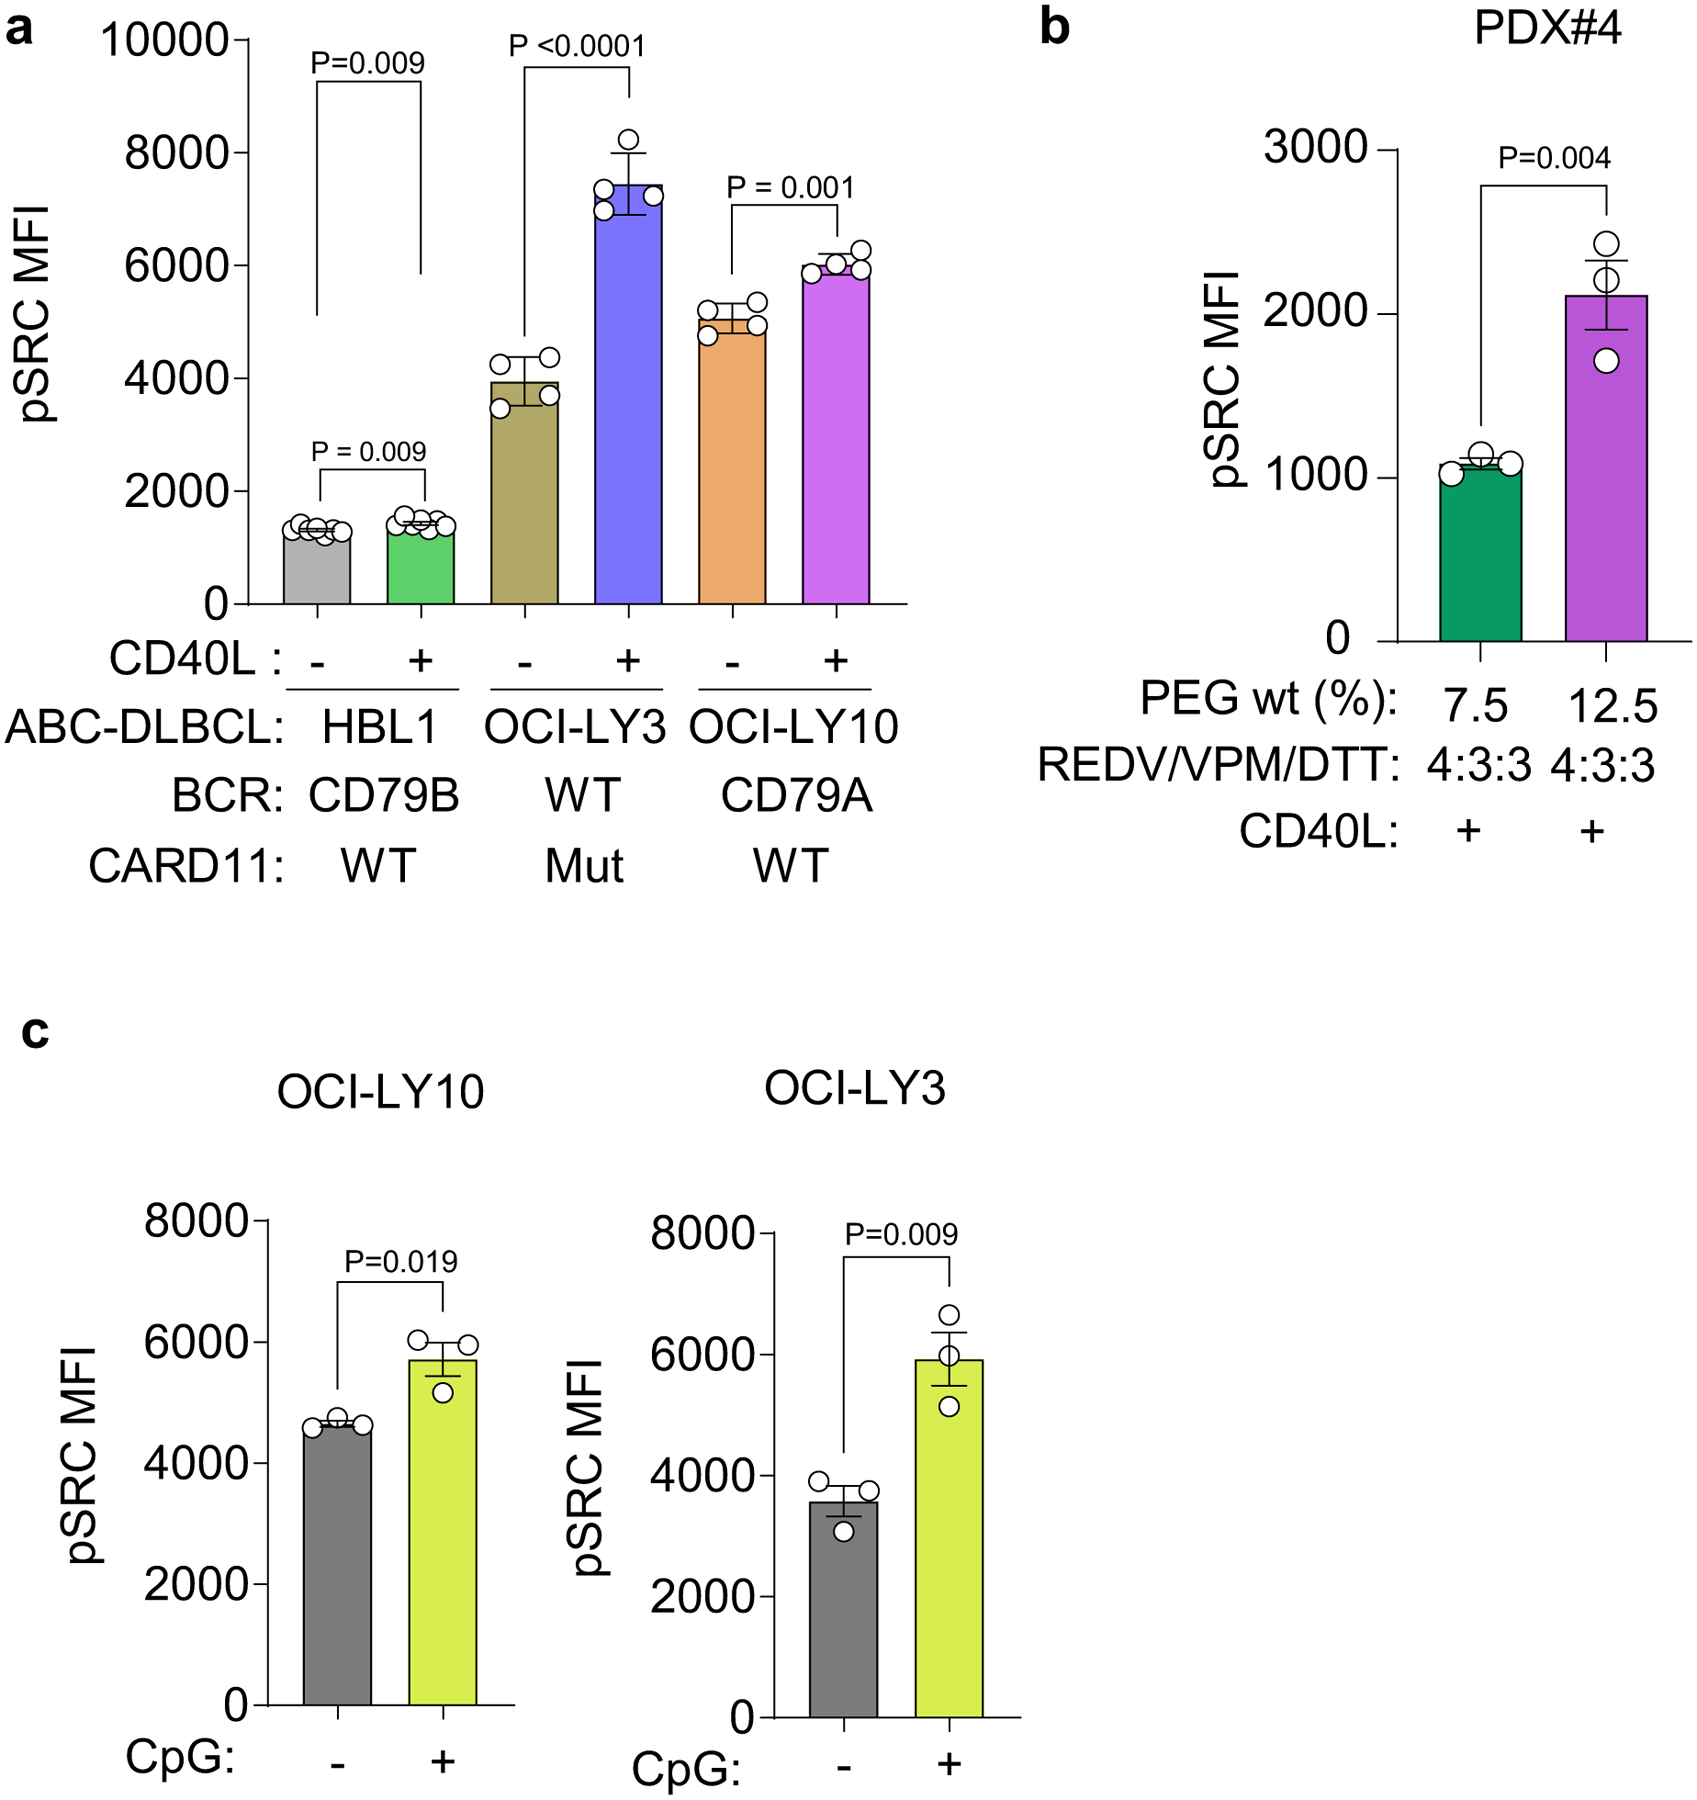
a, pSRC median fluorescent intensity (MFI) in HBL1 (n = 7), OCI-LY3 (n = 4), and OCI-LY10 (n = 4) cell lines grown in REDV-functionalized hydrogel-based organoids with or without CD40L-expressing stromal cells. Two-tailed unpaired t-test (mean ± s.e.m.), where each dot is a hydrogel-based organoid. b, pSRC MFI in human ABC-DLBCL PDX cells grown in REDV-functionalized hydrogel-based organoids with CD40L-expressing stromal cells at different hydrogel polymer densities (stiffnesses). Two-tailed unpaired t-test (mean ± s.e.m., n = 3, where each dot is a hydrogel-based organoid). c, Effect of 1 μM CpG addition on pSRC MFI in OCI-LY3 and OCI-LY10 cells cultured for 96 h. Two-tailed unpaired t-test (mean ± s.e.m., n = 3, where each dot is a hydrogel-based organoid).
Extended Data Fig. 9 |. Combinatorial treatment with cooperative signalling pathway inhibitors rescues MALT1 inhibitors in organoids.
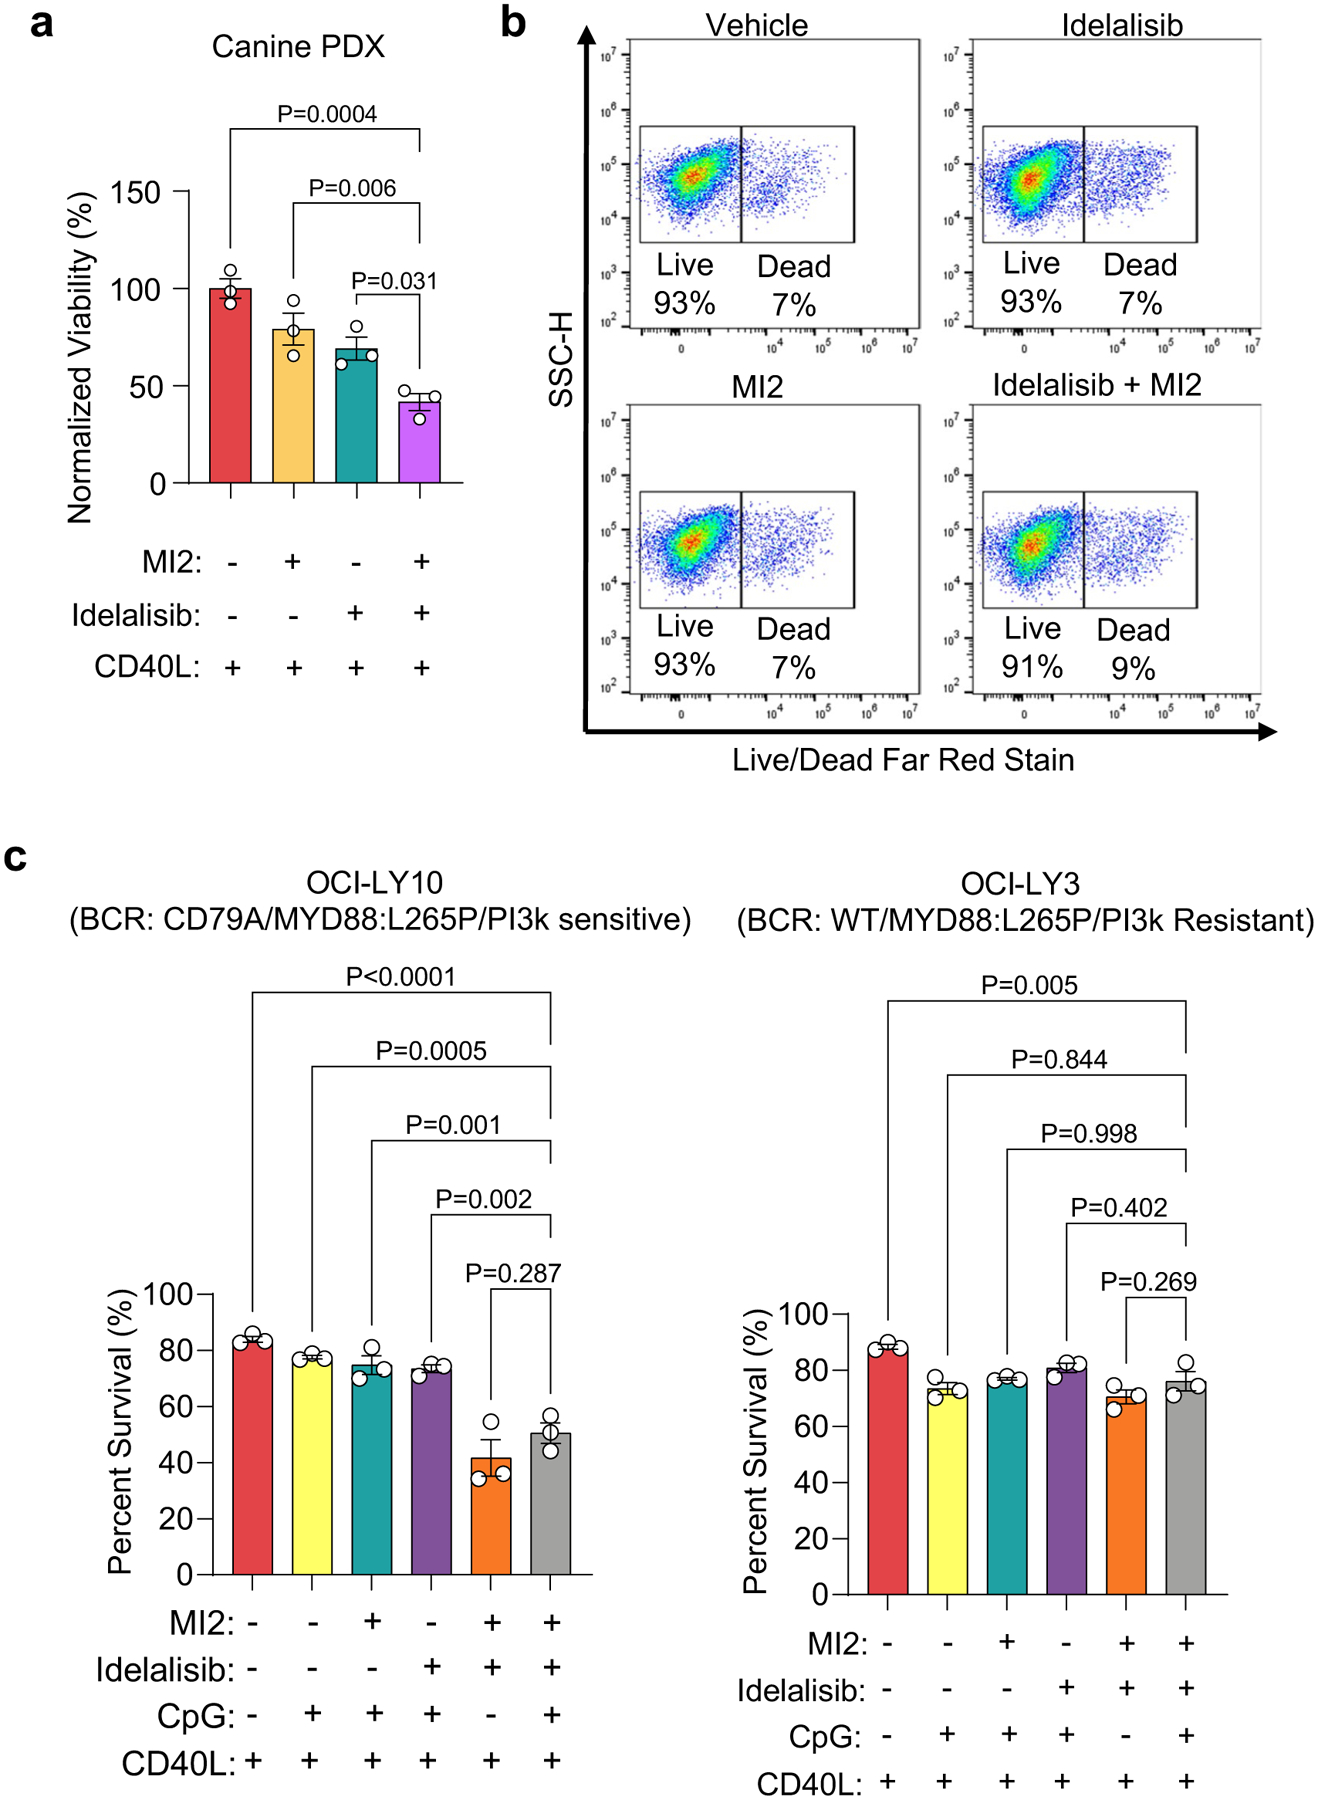
a, Survival (normalized to vehicle-treated) of canine PDX cells cultured with CD40L-stromal cells in REDV-functionalized organoids for 96 h, with 48 h of treatment with vehicle, 2000 nM MI2, 1 μM idelalisib, or both drugs. One-way ANOVA with Dunnett’s multiple-comparison test against the idelalisib+MI2 group (mean ± s.e.m., n = 5, where each dot is a hydrogel-based organoid). b, Representative flow cytometry gating depicting survival of GCB-DLBCL OCI-LY7 cells cultured with CD40L-stromal cells in REDV-functionalized organoids for 96 h, with 48 h of treatment with vehicle, 2000 nM MI2, idelalisib, or both MI2 and idelalisib. Cells were treated with 40 μM idelalisib. Representative of n = 6 hydrogel-based organoid). c, Survival (normalized to vehicle-treated) of OCI-LY10 cells and OCI-LY3 cells after 96-h culture in REDV-functionalized organoids with CD40L-stromal cells, where + /− indicate 48-h 2000 nM MI2 treatment, 48-h 40 μM idelalisib treatment, and/or 96-h 1 μM CpG treatment. One-way ANOVA with Dunnett’s multiple-comparison test with reference to combination MI2 and idelalisib treated culture (orange), (mean ± s.e.m., n = 3, where each dot is a hydrogel-based organoid).
Extended Data Fig. 10 |. Ly-TME attenuates BTK inhibitor response and combinatorial treatment with cooperative signalling pathway inhibitors rescues BTK inhibitor response.
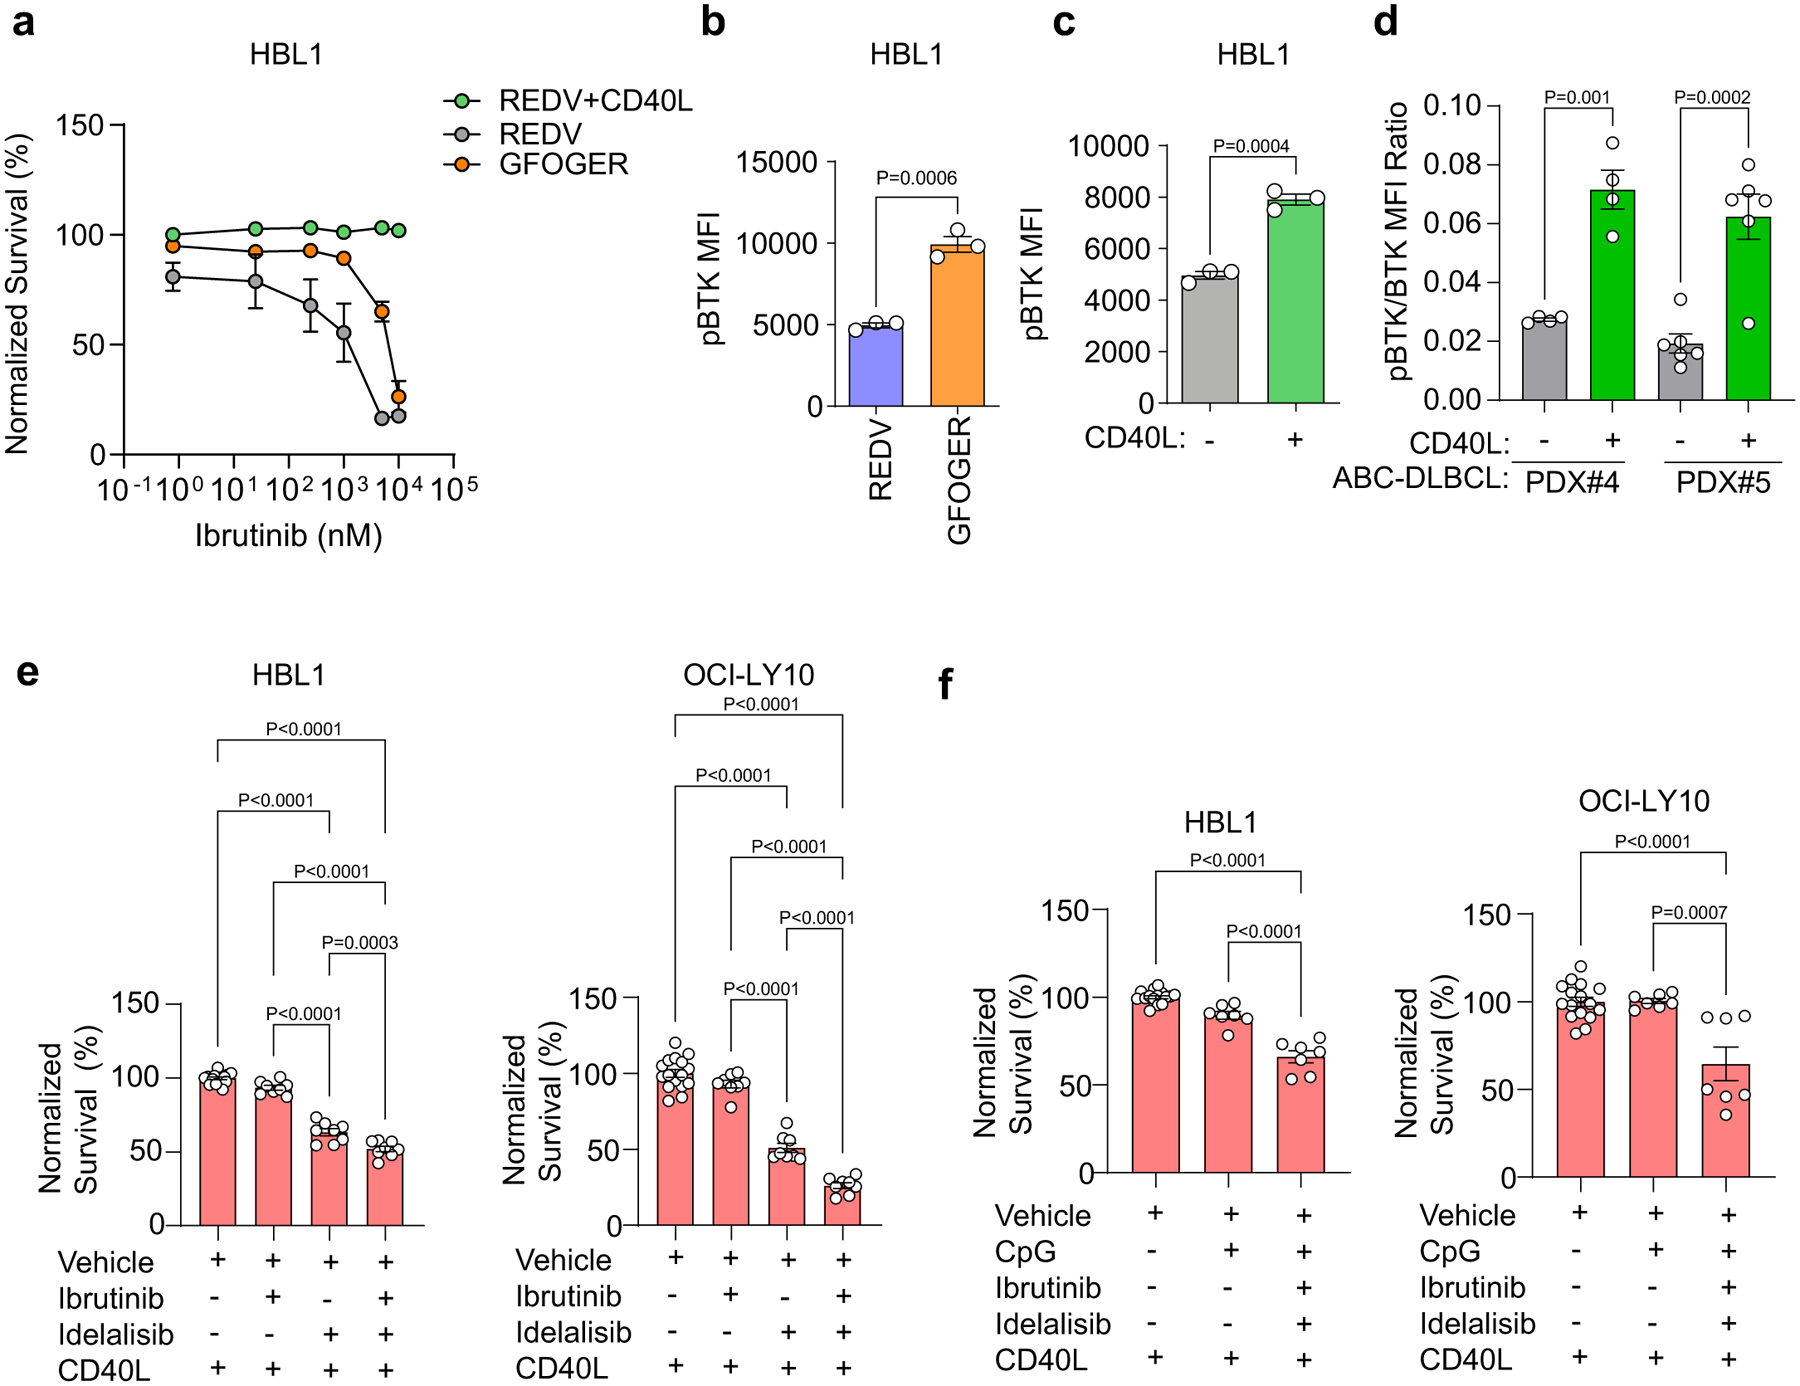
a, Survival (normalized to vehicle-treated) of HBL1 cells cultured in indicated conditions after 48 h of culture and subsequent 48 h of treatment with increasing concentration of BTK inhibitor, ibrutinib. Results indicate the mean ± s.e.m. of six replicates. b, Median fluorescent intensity of pBTK in HBL1 cells cultured in either REDV-(blue) or GFOGER (orange)-functionalized organoids for 96 h. Two-tailed unpaired t-test (mean ± s.e.m., n = 3). c, Median fluorescent intensity of pBTK in HBL1 cells cultured in REDV-functionalized hydrogels-based organoids with or without CD40L expressing stromal cells, for 96 h. Two-tailed unpaired t-test (mean ± s.e.m., n = 3). d, Ratio of median fluorescent intensity (right) of pBTK/BTK in human PDX cells cultured in ±CD40L-stromal cell conditions for 96 h. Two-tailed unpaired t-test (mean ± s.e.m., n = 4 for PDX#4; n = 5 for PDX#5). e, Survival (normalized to vehicle-treated) for HBL1 (left) and OCI-LY10 (right) cells after 96-h culture in REDV-functionalized organoids with CD40L-stromal cells, treated for 48-h with 1000 nM BTK inhibitor ibrutinib and 40 μM PI3K inhibitor idelalisib. One-way ANOVA with Tukey’s multiple-comparison test (mean ± s.e.m., n = 8 treatment group, n = 16 vehicle group). f, Survival (normalized to vehicle-treated) for HBL1 (left) and OCI-LY10 (right) cells after 96-h culture in REDV-functionalized organoids with CD40L-stromal cells, treated for 48-h with 1000 nM ibrutinib and 40 μM idelalisib, and/or treated with 1 μM CpG for 96-h. One-way ANOVA with Tukey’s multiple-comparison test (mean ± s.e.m., n = 7 treatment group, n = 16 vehicle group).
Supplementary Material
Acknowledgements
We acknowledge financial support from the US National Cancer Institute (5R01CA238745-03 awarded to A.S., 1R01CA266052-01A1 awarded to A.S. and J.L.K), the Wellcome Leap HOPE program awarded to A.S., the US NIH/National Institute of Allergy and Infectious Diseases (NIAID) (5R01AI132738-05 awarded to A.S.), the Innovative Molecular Analysis Technology programme of the US National Cancer Institute (NIH R33-CA212968-03 awarded to A.S.), the US Department of Defense (grant number W81XWH-17-1-0215, awarded to A.S.), and the Terry Fox Research Institute (grant numbers 1023 and 1061, awarded to C.S. and D.W.S.). Research reported in this publication was supported in part by the Bioinformatics and Systems Biology shared resource of the Winship Cancer Institute of Emory University and NIH/NCI under award number P30CA138292. We thank K. Richards and T. Pierpont for kindly providing canine PDXs for research and J. Cyster for kindly sharing the WEHI cells. The opinions, interpretations, conclusions and recommendations are those of the authors and are not necessarily endorsed by the funding agencies.
Competing interests
A.S. received research support from 3M. A.M. receives research support from Janssen Pharmaceuticals and serves as a consultant to Epizyme and Constellation. L.F. is currently an employee of Janssen Research & Development, LLC. The other authors declare no competing interests.
Footnotes
Extended data is available for this paper at https://doi.org/10.1038/s41563-023-01495-3.
Supplementary information The online version contains supplementary material available at https://doi.org/10.1038/s41563-023-01495-3.
Data availability
The raw RNA-seq data on organoids are available in the GEO database under accession code GSE209551. Remaining patient RNA sequencing data are available publicly through the Hematologic Malignancies Research Consortium (HMRC, European Genome–Phenome Archive EGAS00001002606), the National Cancer Institute (NCI) Genomic Data Center (GSE99276) and with approval from the NCBI dbGaP controlled access portal, and Weill Cornell’s Gene Expression Omnibus (GEO) GSE145043. The remaining data are available within the article, supplementary information or source data file. Due to very large file sizes and volumes of data, the remaining raw data supporting the findings of this study are available from the corresponding author on a reasonable request. Source data are provided with this paper.
References
- 1.Phelan JD et al. A multiprotein supercomplex controlling oncogenic signalling in lymphoma. Nature 560, 387–391 (2018). [DOI] [PMC free article] [PubMed] [Google Scholar]
- 2.Chapuy B et al. Molecular subtypes of diffuse large B cell lymphoma are associated with distinct pathogenic mechanisms and outcomes. Nat. Med 24, 679–690 (2018). [DOI] [PMC free article] [PubMed] [Google Scholar]
- 3.Roschewski M, Staudt LM & Wilson WH Diffuse large B-cell lymphoma-treatment approaches in the molecular era. Nat. Rev. Clin. Oncol 11, 12–23 (2014). [DOI] [PMC free article] [PubMed] [Google Scholar]
- 4.Lenz G et al. Oncogenic CARD11 mutations in human diffuse large B cell lymphoma. Science 319, 1676–1679 (2008). [DOI] [PubMed] [Google Scholar]
- 5.Fontan L et al. Identification of MALT1 feedback mechanisms enables rational design of potent antilymphoma regimens for ABC-DLBCL. Blood 137, 788–800 (2021). [DOI] [PMC free article] [PubMed] [Google Scholar]
- 6.Wilson WH et al. Targeting B cell receptor signaling with ibrutinib in diffuse large B cell lymphoma. Nat. Med 21, 922–926 (2015). [DOI] [PMC free article] [PubMed] [Google Scholar]
- 7.Young RM & Staudt LM Targeting pathological B cell receptor signalling in lymphoid malignancies. Nat. Rev. Drug Disco 12, 229–243 (2013). [DOI] [PMC free article] [PubMed] [Google Scholar]
- 8.Young RM, Phelan JD, Wilson WH & Staudt LM Pathogenic B-cell receptor signaling in lymphoid malignancies: new insights to improve treatment. Immunol. Rev 291, 190–213 (2019). [DOI] [PMC free article] [PubMed] [Google Scholar]
- 9.Schmitz R et al. Genetics and pathogenesis of diffuse large B-cell lymphoma. N. Engl. J. Med 378, 1396–1407 (2018). [DOI] [PMC free article] [PubMed] [Google Scholar]
- 10.Fontan L et al. MALT1 small molecule inhibitors specifically suppress ABC-DLBCL in vitro and in vivo. Cancer cell 22, 812–824 (2012). [DOI] [PMC free article] [PubMed] [Google Scholar]
- 11.Sun L, Deng L, Ea CK, Xia ZP & Chen ZJ The TRAF6 ubiquitin ligase and TAK1 kinase mediate IKK activation by BCL10 and MALT1 in T lymphocytes. Mol. Cell 14, 289–301 (2004). [DOI] [PubMed] [Google Scholar]
- 12.Hailfinger S et al. Malt1-dependent RelB cleavage promotes canonical NF-kappaB activation in lymphocytes and lymphoma cell lines. Proc. Natl Acad. Sci. USA 108, 14596–14601 (2011). [DOI] [PMC free article] [PubMed] [Google Scholar]
- 13.Fontan L et al. Specific covalent inhibition of MALT1 paracaspase suppresses B cell lymphoma growth. J. Clin. Invest 128, 4397– 4412 (2018). [DOI] [PMC free article] [PubMed] [Google Scholar]
- 14.Nagel D et al. Pharmacologic inhibition of MALT1 protease by phenothiazines as a therapeutic approach for the treatment of aggressive ABC-DLBCL. Cancer Cell 22, 825–837 (2012). [DOI] [PubMed] [Google Scholar]
- 15.Kotlov N et al. Clinical and biological subtypes of B-cell lymphoma revealed by microenvironmental signatures. Cancer Discov 11, 1468–1489 (2021). [DOI] [PMC free article] [PubMed] [Google Scholar]
- 16.Wright GW et al. A probabilistic classification tool for genetic subtypes of diffuse large B cell lymphoma with therapeutic implications. Cancer Cell 37, 551–568 e514 (2020). [DOI] [PMC free article] [PubMed] [Google Scholar]
- 17.Scott DW & Gascoyne RD The tumour microenvironment in B cell lymphomas. Nat. Rev. Cancer 14, 517–534 (2014). [DOI] [PubMed] [Google Scholar]
- 18.Elgueta R et al. Molecular mechanism and function of CD40/CD40L engagement in the immune system. Immunol. Rev 229, 152–172 (2009). [DOI] [PMC free article] [PubMed] [Google Scholar]
- 19.Ito D et al. CD40 ligand is necessary and sufficient to support primary diffuse large B-cell lymphoma cells in culture: a tool for in vitro preclinical studies with primary B-cell malignancies. Leuk. Lymphoma 53, 1390–1398 (2012). [DOI] [PMC free article] [PubMed] [Google Scholar]
- 20.Nojima T et al. In-vitro derived germinal centre B cells differentially generate memory B or plasma cells in vivo. Nat. Commun 2, 465 (2011). [DOI] [PubMed] [Google Scholar]
- 21.Ennishi D et al. Molecular and genetic characterization of MHC deficiency identifies EZH2 as therapeutic target for enhancing immune recognition. Cancer Discov. 9, 546–563 (2019). [DOI] [PubMed] [Google Scholar]
- 22.Reddy A et al. Genetic and functional drivers of diffuse large B cell lymphoma. Cell 171, 481–494.e415 (2017). [DOI] [PMC free article] [PubMed] [Google Scholar]
- 23.Ni CZ et al. Molecular basis for CD40 signaling mediated by TRAF3. Proc. Natl Acad. Sci. USA 97, 10395–10399 (2000). [DOI] [PMC free article] [PubMed] [Google Scholar]
- 24.Phelps EA et al. Maleimide cross-linked bioactive PEG hydrogel exhibits improved reaction kinetics and cross-linking for cell encapsulation and in situ delivery. Adv. Mater 24, 64–70 (2012). 62. [DOI] [PMC free article] [PubMed] [Google Scholar]
- 25.Graney PL et al. Organoid polymer functionality and mode of Klebsiella pneumoniae membrane antigen presentation regulates ex vivo germinal center epigenetics in young and aged B cells. Adv. Funct. Mater 30, 2001232 (2020). [DOI] [PMC free article] [PubMed] [Google Scholar]
- 26.Lutolf MP & Hubbell JA Synthesis and physicochemical characterization of end-linked poly(ethylene glycol)-co-peptide hydrogels formed by Michael-type addition. Biomacromolecules 4, 713–722 (2003). [DOI] [PubMed] [Google Scholar]
- 27.Rodda LB et al. Single-cell RNA sequencing of lymph node stromal cells reveals niche-associated heterogeneity. Immunity 48, 1014–1028 e1016 (2018). [DOI] [PMC free article] [PubMed] [Google Scholar]
- 28.Massia SP & Hubbell JA Vascular endothelial cell adhesion and spreading promoted by the peptide REDV of the IIICS region of plasma fibronectin is mediated by integrin α 4 β 1. J. Biol. Chem 267, 14019–14026 (1992). [PubMed] [Google Scholar]
- 29.Rydholm AE, Bowman CN & Anseth KS Degradable thiol-acrylate photopolymers: polymerization and degradation behavior of an in situ forming biomaterial. Biomaterials 26, 4495–4506 (2005). [DOI] [PubMed] [Google Scholar]
- 30.Quancard J et al. An allosteric MALT1 inhibitor is a molecular corrector rescuing function in an immunodeficient patient. Nat. Chem. Biol 15, 304–313 (2019). [DOI] [PubMed] [Google Scholar]
- 31.Richards KL et al. Gene profiling of canine B-cell lymphoma reveals germinal center and postgerminal center subtypes with different survival times, modeling human DLBCL. Cancer Res. 73, 5029–5039 (2013). [DOI] [PMC free article] [PubMed] [Google Scholar]
- 32.Tolar P, Hanna J, Krueger PD & Pierce SK The constant region of the membrane immunoglobulin mediates B cell-receptor clustering and signaling in response to membrane antigens. Immunity 30, 44–55 (2009). [DOI] [PMC free article] [PubMed] [Google Scholar]
- 33.Clark AY et al. Integrin-specific hydrogels modulate transplanted human bone marrow-derived mesenchymal stem cell survival, engraftment, and reparative activities. Nat. Commun 11, 114 (2020). [DOI] [PMC free article] [PubMed] [Google Scholar]
- 34.Arnaout MA, Mahalingam B & Xiong JP Integrin structure, allostery, and bidirectional signaling. Annu. Rev. Cell Dev. Biol 21, 381–410 (2005). [DOI] [PubMed] [Google Scholar]
- 35.Bellis SL Advantages of RGD peptides for directing cell association with biomaterials. Biomaterials 32, 4205–4210 (2011). [DOI] [PMC free article] [PubMed] [Google Scholar]
- 36.Knight CG et al. Identification in collagen type I of an integrin alpha2 beta1-binding site containing an essential GER sequence. J. Biol. Chem 273, 33287–33294 (1998). [DOI] [PubMed] [Google Scholar]
- 37.Zeltz C & Gullberg D The integrin-collagen connection—a glue for tissue repair? J. Cell Sci 129, 653–664 (2016). [DOI] [PubMed] [Google Scholar]
- 38.Arana E, Harwood NE & Batista FD Regulation of integrin activation through the B-cell receptor. J. Cell Sci 121, 2279–2286 (2008). [DOI] [PubMed] [Google Scholar]
- 39.Carrasco YR & Batista FD B-cell activation by membrane-bound antigens is facilitated by the interaction of VLA-4 with VCAM-1. EMBO J. 25, 889–899 (2006). [DOI] [PMC free article] [PubMed] [Google Scholar]
- 40.Weekes CD, Kuszynski CA & Sharp JG VLA-4 mediated adhesion to bone marrow stromal cells confers chemoresistance to adherent lymphoma cells. Leuk. Lymphoma 40, 631–645 (2001). [DOI] [PubMed] [Google Scholar]
- 41.Headen DM et al. Local immunomodulation Fas ligand-engineered biomaterials achieves allogeneic islet graft acceptance. Nat. Mater 17, 732–739 (2018). [DOI] [PMC free article] [PubMed] [Google Scholar]
- 42.Landon AL et al. MNKs act as a regulatory switch for eIF4E1 and eIF4E3 driven mRNA translation in DLBCL. Nat. Commun 5, 5413 (2014). [DOI] [PMC free article] [PubMed] [Google Scholar]
- 43.Manning G, Whyte DB, Martinez R, Hunter T & Sudarsanam S The protein kinase complement of the human genome. Science 298, 1912–1934 (2002). [DOI] [PubMed] [Google Scholar]
- 44.Zheng M et al. A mix of S and ΔS variants of STAT3 enable survival of activated B-cell-like diffuse large B-cell lymphoma cells in culture. Oncogenesis 4, e184 (2016). [DOI] [PMC free article] [PubMed] [Google Scholar]
- 45.Apoorva FNU et al. Lymph node stiffness-mimicking hydrogels regulate human B-cell lymphoma growth and cell surface receptor expression in a molecular subtype-specific manner. J. Biomed. Mater. Res. A 105, 1833–1844 (2017). [DOI] [PubMed] [Google Scholar]
- 46.Ohto U et al. Structural basis of CpG and inhibitory DNA recognition by Toll-like receptor 9. Nature 520, 702–705 (2015). [DOI] [PubMed] [Google Scholar]
- 47.Scuoppo C et al. Repurposing dasatinib for diffuse large B cell lymphoma. Proc. Natl Acad. Sci. USA 116, 16981–16986 (2019). [DOI] [PMC free article] [PubMed] [Google Scholar]
- 48.Battistello E et al. Pan-SRC kinase inhibition blocks B-cell receptor oncogenic signaling in non-Hodgkin lymphoma. Blood 131, 2345–2356 (2018). [DOI] [PMC free article] [PubMed] [Google Scholar]
- 49.Gopal AK et al. PI3Kδ inhibition by idelalisib in patients with relapsed indolent lymphoma. N. Engl. J. Med 370, 1008–1018 (2014). [DOI] [PMC free article] [PubMed] [Google Scholar]
- 50.Kim S, Shah SB, Graney PL & Singh A Multiscale engineering of immune cells and lymphoid organs. Nat. Rev. Mater 4, 355–378 (2019). [DOI] [PMC free article] [PubMed] [Google Scholar]
- 51.Liao Y, Smyth GK & Shi W featureCounts: an efficient general purpose program for assigning sequence reads to genomic features. Bioinformatics, 30(7):923–30 (2014). [DOI] [PubMed] [Google Scholar]
- 52.Robinson MD, McCarthy DJ & Smyth GK edgeR: a Bioconductor package for differential expression analysis of digital gene expression data. Bioinformatics, 26(1), 139–140 (2010); 10.1093/bioinformatics/btp616 [DOI] [PMC free article] [PubMed] [Google Scholar]
- 53.Ritchie ME, Phipson B, Wu D, Hu Y, Law CW, Shi W & Smyth GK limma powers differential expression analyses for RNA-sequencing and microarray studies. Nucleic Acids Res, 43(7), e47 (2015); 10.1093/nar/gkv007 [DOI] [PMC free article] [PubMed] [Google Scholar]
- 54.Kolde R pheatmap: Pretty Heatmaps. R package version 1.0.12 (2019). [Google Scholar]
- 55.Shen Y et al. Oncogenic role of the SOX9–DHCR24–cholesterol biosynthesis axis in IGH-BCL2+ diffuse large B-cell lymphomas. Blood 139, 73–86 (2022). [DOI] [PMC free article] [PubMed] [Google Scholar]
- 56.Stringer C, Wang T, Michaelos M & Pachitariu M Cellpose: a generalist algorithm for cellular segmentation. Nat Methods 18, 100–106 (2021). [DOI] [PubMed] [Google Scholar]
- 57.Apoorva F et al. How biophysical forces regulate human B cell lymphomas. Cell Rep. 23, 499–511 (2018). [DOI] [PMC free article] [PubMed] [Google Scholar]
- 58.Purwada A et al. Ex vivo engineered immune organoids for controlled germinal center reactions. Biomaterials 63, 24–34 (2015). [DOI] [PMC free article] [PubMed] [Google Scholar]
- 59.Purwada A et al. Ex vivo synthetic immune tissues with T cell signals for differentiating antigen-specific, high affinity germinal center B cells. Biomaterials 198, 27–36 (2019). [DOI] [PMC free article] [PubMed] [Google Scholar]
- 60.Purwada A, Shah SB, Beguelin W, Melnick AM & Singh A Modular immune organoids with integrin ligand specificity differentially regulate ex vivo B cell activation. ACS Biomater. Sci. Eng 3, 214–225 (2017). [DOI] [PubMed] [Google Scholar]
Associated Data
This section collects any data citations, data availability statements, or supplementary materials included in this article.
Supplementary Materials
Data Availability Statement
The raw RNA-seq data on organoids are available in the GEO database under accession code GSE209551. Remaining patient RNA sequencing data are available publicly through the Hematologic Malignancies Research Consortium (HMRC, European Genome–Phenome Archive EGAS00001002606), the National Cancer Institute (NCI) Genomic Data Center (GSE99276) and with approval from the NCBI dbGaP controlled access portal, and Weill Cornell’s Gene Expression Omnibus (GEO) GSE145043. The remaining data are available within the article, supplementary information or source data file. Due to very large file sizes and volumes of data, the remaining raw data supporting the findings of this study are available from the corresponding author on a reasonable request. Source data are provided with this paper.


