

Abstract
A full understanding of the characteristics of Covid-19 patients with a better chance of experiencing poor vital outcomes is critical for implementing accurate and precise treatments. In this paper, two different advanced data-driven statistical approaches along with standard statistical methods have been implemented to identify groups of patients most at-risk for death or severity of respiratory distress. First, the tree-based analysis allowed to identify profiles of patients with different risk of in-hospital death (by Survival Tree-ST analysis) and severity of respiratory distress (by Classification and Regression Tree-CART analysis), and to unravel the role on risk stratification of highly dependent covariates (i.e., demographic characteristics, admission values and comorbidities). The ST analysis identified as the most at-risk group for in-hospital death the patients with age > 65 years, creatinine 1.2 mg/dL, CRP 25 mg/L and anti-hypertensive treatment. Based on the CART analysis, the subgroups most at-risk of severity of respiratory distress were defined by patients with creatinine level 1.2 mg/dL. Furthermore, to investigate the multivariate dependence structure among the demographic characteristics, the admission values, the comorbidities and the severity of respiratory distress, the Bayesian Network analysis was applied. This analysis confirmed the influence of creatinine and CRP on the severity of respiratory distress.
Subject terms: Statistics, Nephrology, Infectious diseases
Introduction
It has been reported that patients with underlying disease are more likely to contract Coronavirus disease 19 (Covid-19) and become critically ill1,2. Older age, cardiovascular and kidney comorbidities, are among the most important risk factors influencing the virus–host interaction and the clinical outcome of Covid-193,4. Understanding the relationship between comorbidities, therapy, and Covid-19 mortality is needed to efficiently guide clinical and public health interventions. Moreover, fully understanding the characteristics of Covid-19-related severity of respiratory distress is also necessary for an early identification and precise treatment5.
In this paper we aim at evaluating the effect of Covid-19 risk factors not only on in-hospital death but also on severity of respiratory distress. The novelty of our approach is to consider as severity outcome the variable SOFA (Sequential Organ Failure Assessment)6 defined on respiratory system according to 5 increasing levels of severity, a measure that accounts for the real individual Covid-19 evolution rather than for external factors. Indeed, very often Covid-19 severity outcome has been evaluated by means of Intensive Care Unit (ICU) binary outcome which may be misleading being affected both by the epidemic wave strength as well as by the ICU regional health policies. To this extent, our goal is to identify risk profiles of patients that might develop different severity of Covid-19 disease.
To pursue these aims, two different advanced statistical approaches were performed, along with standard statistical methods such as Cox and logistic regression analyses. The first data-driven approach, tree-based analysis, allowed to identify profiles of patients with different risks of in-hospital death and severity respiratory distress, and to unravel the role of highly dependent covariates on risk stratification. The second approach, the Bayesian Network analysis, was used to further explore the relationships among demographic characteristics, comorbidities, admission values and the severity of respiratory distress and to investigate the multivariate dependence structure.
Materials and methods
Study population
A single-center observational prospective cohort, the COVID-BioB study, was implemented at the IRCCS San Raffaele Scientific Institute in Milan, Italy.
Full description of patient management and clinical protocols were previously published7.
We included in the present study patients admitted to our hospitals from March 2 to April 25, 2020, with at least one plasma creatinine value measured during SARS-CoV-2 infection. A total of 392 consecutive patients were included in the present analysis. All patients aged 18 years or older, admitted to the IRCCS San Raffaele Scientific Institute with confirmed SARS-CoV-2 infection were consecutively enrolled in the COVID-BioB study. Diagnosis of SARS-CoV-2 infection was based on a positive real-time reverse-transcriptase polymerase chain reaction (RT-PCR) from a nasopharyngeal and/or throat swab or high clinical and radiological suspicion of Covid-19 pneumonia7.
The study was approved by the IRCCS San Raffaele Hospital Ethics Committee (protocol no. 34/int/2020) and was registered on ClinicalTrials.gov (NCT04318366).
For patients able to provide a signed informed consent at the time of hospital admission, written informed consent was obtained before data collection. Otherwise, patients consented as soon as they were able to sign. This study is reported in compliance with the STROBE statement8.
All methods were carried out in accordance with relevant guidelines and regulations.
Data collection and definitions
Data were collected from medical charts review and entered in a dedicated COVID-BioB study electronic case record form (eCRF). The demographic characteristics, laboratory data and medications were extracted from electronic medical records. Before analysis data were cross-checked with medical charts and verified by data managers and clinicians for accuracy. The date of clinical observation start (baseline) was defined as the day of Emergency Department admission7.
Baseline serum creatinine was defined as the most recent available creatinine value in the previous 6 months in a stable clinical condition if available (21%) or the last value available previous discharge. For dead subjects, the minimum creatinine value during hospitalization after SARS-CoV-2 infection was selected. The acute kidney failure (AKI) was defined as a 50% increase in serum creatinine from baseline according to the KDIGO criteria9. Patients were defined as history of hypertension (HYP) if hypertension was reported in their medical history or if they were chronically treated at least one anti-hypertensive drug.
PaO2/FiO2 was used as an indicator of the severity of respiratory distress; it was recoded in 5 classes defined as by SOFA score6,10,11 (S1 Table).
Statistical methods
Standard and advanced statistical techniques have been applied to identify the factors associated with an increased/decreased risk of in-hospital death and severity respiratory distress expressed as SOFA score. Along with standard Cox regression models, Survival Tree (ST) analysis has been implemented to identify risks factors associated with Covid-19 outcomes within a data-driven approach. The procedure allows to uncover profile of patients with different risk of in-hospital death and to disentangle the role of highly dependent covariates on risk stratification. The iterative ST algorithm selects the best predictors with the best thresholds aiming at identifying homogeneous subgroups of patients with similar survival outcome12. To account for overfitting, in the tree-building phase, a constraint was imposed by fixing the minimum number of observations in any terminal node at 20. This choice was motivated by the need to have enough observations in the nodes to properly carry out further analyses. Following ST analysis, the Kaplan–Meier method was used to estimate overall survival for each risk profile, and log-rank test has been applied to compare survival among groups of patients defined based on the risk profile12.
The variables used in the Cox regression models and ST analysis were the demographic characteristics and the admission values [i.e., age, sex, BMI, C-reactive protein (CRP) and creatinine], the comorbidities [i.e., coronary artery disease (CAD), diabetes, chronic obstructive pulmonary disease (COPD), malignancy (NPL), mean arterial blood pressure (MBP), AKI, HYP], the reduction of anti-hypertensive therapy after hospitalization and the severity of respiratory distress (expressed as PaO2/FiO2 and SOFA score).
Taking advantage of the ST analysis, the procedure was applied to also identify a cutoff value for the SOFA score to obtain a binary version of the score itself to be used in successive analyses.
To investigate the effects of comorbidities on severity of respiratory distress, univariate and multivariable logistic regression models were performed considering the same covariates as before (i.e., age, sex, BMI, CRP creatinine, CAD, diabetes, COPD, NPL, AKI, MBP, HYP and the reduction of anti-hypertensive therapy after hospitalization). Stepwise variable selection procedure was applied to identify a smaller set of relevant predictors.
In order to identify patients’ profiles with different risk of respiratory distress, based on the same covariates entered in the logistic regression model, another data-driven approach was used within the Classification and Regression Tree (CART) methodology which implements a form of binary recursive partitioning. A minimum number of observations in each terminal node was set at 20 to ensure sufficient observations in the nodes and to properly carry out further analyses.
Finally, also a Bayesian Network (BN) approach was used to explore the dependence structure among all variables included in the CART analysis. BNs are probabilistic graphical models showing the relationship among variables through a set of nodes, which are the variables, and arcs, which represent the relationships between them; the nodes that are not connected represent variables that are conditionally independent of each other. The directionality of the arcs is such that no directed cycles are included in the graph. Hence, BNs are considered as directed acyclic graphs (DAGs) and the parameters of the model represent the conditional probability distributions of each node for each combination of values of the preceding node(s)13.
The purpose of using BN in this research is to learn dependence structure directly from data, while excluding some directions among variables that are not feasible. The network structure has been estimated from data by a hill climbing algorithm with Akaike information criterion score functions.
This approach is essential to uncover complex interrelationships among variables and to gain a better insight into mechanisms involved in Covid-19 disease progression. While CART analysis reports best predictors and best splits allowing to classify patients based on their outcome, BN approach is here reported to integrate previous analyses highlighting how variables are related within the whole multivariate structure. Moreover, BNs allow for a better interpretation of results obtained from multivariate logistic and CART model, enabling to deeply investigate the role of some covariates on the outcome, thus evaluating how the conditioning on one or more variable impact and propagate on other variables in the network.
When we set a value of one or more variables in the network, we update the conditional probability distributions to reflect it. This updating is known as evidence propagation. Based on the estimated network, different possible scenarios can be examined by inserting and propagating new evidence on one or more variables throughout the network. Various diagnostic checks have been performed to investigate the effects of evidence on the distribution of a target variable using “what-if” sensitivity scenarios14.
Risks were reported as hazard ratios (HRs) or odds ratios (OR) along with their 95% Cis (Wald computation). A P value < 0.05 was considered significant. All analyses were performed using R statistical software (version 4.0.4; https://cran.r-project.org/index.html). The R package rpart was used to implement ST and CART analyses. The procedure applies the LeBlanc and Crowley splitting rule. The R packages bnlearn15 and gRain16 were used to learn the network and perform the inference required to calculate the conditional probabilities.
Results
Demographic and clinical characteristics of 392 patients included in the study are shown in Table 1. In our cohort, during in-hospital stay (median 10 days, IQR 15–6 days) 95 deaths occurred. The mean age of patients was 66 years, 75% were male and 37% have reduced anti-hypertensive therapy during the hospitalization (Table 1).
Table 1.
Demographic and clinical characteristics of study patients with SARS-CoV-2 infection.
| N | ||
|---|---|---|
| Anthropometric measurements | ||
| Males (n, %) | 392 | 293 (74.7) |
| Age at recruitment (yrs) | 392 | 65.65 ± 13.1 |
| Age at recruitment > 65 years (n, %) | 392 | 207 (52.8) |
| BMI (kg/m2) | 309 | 27.05 ± 4.7 |
| Underweight and normal BMI (n, %) | 114 (36.9) | |
| Overweight BMI (n, %) | 309 | 129 (41.7) |
| Obese BMI (n, %) | 66 (21.4) | |
| Clinical history | ||
| CAD (n, %) | 381 | 103 (27.0) |
| HYP (n, %) | 381 | 202 (53.0) |
| Diabetes (n, %) | 381 | 68 (17.8) |
| COPD (n, %) | 386 | 28 (7.2) |
| NPL (n, %) | 381 | 54 (14.2) |
| Admission values | ||
| MBP (mmHg) | 373 | 91.08 ± 11.93 |
| CRP (mg/L) | 270 | 79.75 (31.7–139.9) |
| Creatinine (mg/dL) | 392 | 1.01 (0.82–1.23) |
| SatO2 (%) | 340 | 94 (91–96) |
| PaO2/FiO2 (mmHg) | 304 | 290.5 (223.2, 328.6) |
| AKI (n, %) | 380 | 21 (5.5) |
| In-hospital values | ||
| Reduced anti-hypertensive therapy | 274 | 101 (36.9) |
| Outcomes | ||
| In-hospital mortality (n, %) | 392 | 95 (24.2) |
| SOFA = 0 (≥ 400 mmHg) (n, %) | 7 (2.3) | |
| SOFA = 1 (< 400 mmHg) (n, %) | 128 (42.1) | |
| SOFA = 2 (< 300 mmHg) (n, %) | 304 | 107 (35.2) |
| SOFA = 3 (< 200 mmHg and MV) (n, %) | 35 (11.5) | |
| SOFA = 4 (< 100 mmHg and MV) (n, %) | 27 (8.9) | |
| SOFA > 2 (n, %) | 304 | 62 (20.4) |
Continuous variables were reported as mean ± SD whereas categorical variables as total frequencies and percentages. Skewed variables are presented as median (interquartile range).
CAD coronary artery disease, HYP history of hypertension or use of at least one anti-hypertensive drug, COPD chronic obstructive pulmonary disease, NPL malignancy, CRP C-reactive protein, MBP mean arterial blood pressure, SatO2 peripheral arterial oxygen saturation, AKI acute kidney failure, MV, mechanical ventilation.
SOFA score was evaluated on PaO2/FiO2 values (where PaO2 partial pressure of arterial oxygen and FiO2 fraction of inspired oxygen).
Risk of in-hospital death
Univariate and multivariable Cox regression analyses were reported in Supplementary Materials (S2 Table and S3 Table). The multivariable model fitted using stepwise selection show that older age (> 65 years), HYP, presence of COPD, higher values of creatinine and SOFA score > 2 were associated with a higher risk of death.
To uncover natural and homogeneous groups of subjects with similar survival outcome, we applied ST analysis that considered all baseline characteristics and comorbidities at admission and, for reduced anti-hypertensive therapy, the change during hospitalization. The ST analysis selected age, creatinine, SOFA score (> 2), sex, CRP, and HYP (Fig. 1A).
Figure 1.

ST analysis and Kaplan–Meier curves and log-rank test. (A) ST analysis and (B) Kaplan–Meier curves and log-rank test for the three risk groups obtained from the ST analysis based on their HR computed in the final nodes. The low-risk group includes those patients falling in final nodes with an HR lower than 0.5 (n = 139, 36%), patients in the medium-risk group are those with an HR between 0.5 and 1 (n = 139, 36%), and patients in the high-risk groups are those with an HR higher than 1 (n = 110, 28%). The P value associated with the log-rank test is also displayed.
The main discriminant was age, with a favourable outcome in patients ≤ 65 years old. The second discriminant was creatinine. In younger patients, creatinine levels > 1.2 mg/dL was associated with unfavourable outcome regardless of gender. In patients with > 65 years old only if simultaneously creatinine levels were < 1.2 mg/dL and CRP < 25 mg/L the individual risk was equal to 0.29. Conversely, when CRP levels were higher than 25 mg/L and patients is a hypertensive individual, the risk increased to 2.1. On the other hand, the higher risk of in-hospital death was observed in patients with creatinine levels ≥ 1.2 mg/dL (HR = 2.7): as expected a higher risk was observed when patients underwent mechanical ventilation (i.e., SOFA score > 2) reaching an HR of 3.7.
Thus, the ST analysis identified the different patterns associated with different clinical outcomes. The concordance index of the Cox model considering the nine groups identified by the final nodes is equal to 0.778. Based on the HR in the final nodes, leaves were grouped to obtain three risk stratification categories (Fig. 1B): HR lower than 0.5 (n = 139, 36%), HR between 0.5 and 1 (n = 139, 36%), and HR higher than 1 (n = 110, 28%), showing a marked difference in terms of survival (P < 0.001; Fig. 1B).
Risk of severity of respiratory distress
ST analysis for SOFA and in-hospital death identified a cutoff equal to 2 (i.e., PaO2/FiO2 < 300 mmHg), corresponding to the need of mechanical ventilation (at admission 20% of patients had SOFA score > 2). Then SOFA score was dichotomized considering value of 2.
To investigate the role of comorbidities in increasing risk of mechanical ventilation, univariate and multivariable logistic regressions were performed. Age > 65 years, history of hypertension and higher levels of CRP and creatinine were associated with an increased risk of mechanical ventilation (S4 Table). After stepwise selection, the fully adjusted model comprised only age and CRP levels, both of which were positively associated with the risk of mechanical ventilation (Table 2).
Table 2.
Significant associations resulting from stepwise selection on multivariable logistic regression (n = 216, events = 37).
| OR | 95% CI | p-value | ||
|---|---|---|---|---|
| LB | UB | |||
| Age at recruitment > 65 yrs (yes vs. no) | 2.50 | 1.11 | 5.62 | 2.67 × 10⁻² |
| CRP (per 10 mg/L) | 1.09 | 1.04 | 1.14 | 2.81 × 10⁻⁴ |
CRP C-reactive protein.
Outcome: SOFA > 2; covariates: age, sex, BMI, CRP, creatinine, CAD, diabetes, COPD, NPL, MBP, AKI, HYP and the reduction of anti-hypertensive therapy after hospitalization.
In order to define the patient profile at higher risk of mechanical ventilation, CART analysis was carried out. In this case, a creatinine level below 1.2 mg/dL defined subgroups of patients with the lowest risk of adverse outcomes (probability of being SOFA > 2 = 0.14) (Fig. 2).
Figure 2.
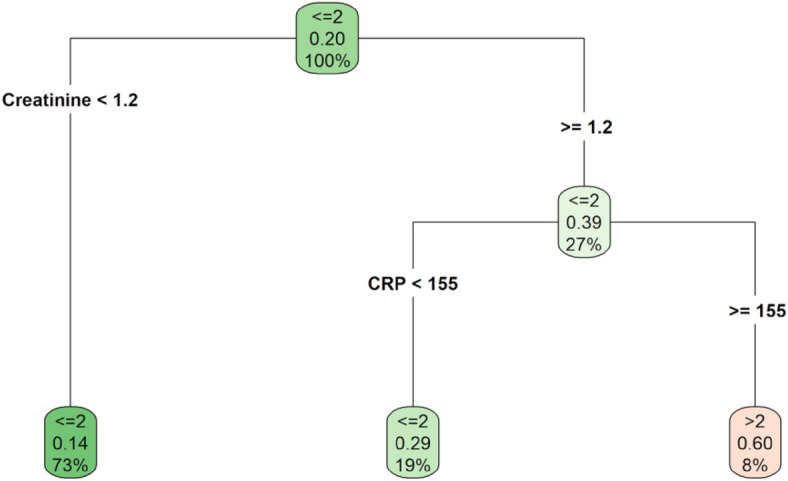
Classification regression tree. Outcome: SOFA > 2; covariates: age, sex, BMI, CRP, creatinine, CAD, diabetes, COPD, NPL, MBP, AKI, HYP and the reduction of anti-hypertensive therapy during hospitalization.
Among the patients with creatinine ≥ 1.2 mg/dL, the individual risk was 0.29 in patients with CRP levels lower than 155 mg/L and 0.60 in those with CRP levels greater than 155 mg/L. The accuracy rate of the estimated CART is equal to 81.25%.
To further explore the relationships among demographic characteristics, comorbidities, admission values and the severity of respiratory distress, BNs were applied to investigate their multivariate dependence structure. The resulting network is shown in Fig. 3 where the variables are represented in the network nodes together with its corresponding marginal probability table, expressed as percentage.
Figure 3.

Bayesian Network Model for SOFA with marginal probability tables expressed in percentage. Outcome: SOFA > 2; covariates: age, sex, BMI, CRP, creatinine, CAD, diabetes, COPD, NPL, MBP, AKI, HYP and the reduction of anti-hypertensive therapy after hospitalization.
Moving through the network from one node to another it is possible to evaluate which variables influence directly or indirectly the target ones. For example, SOFA (the severity of respiratory distress) is directly affected by creatinine and CRP, and it is indirectly influenced by many other variables, such as gender and HYP which showed a direct effect on creatinine and CAD and NPL which showed a direct effect on CRP. Identifying which features have a direct or indirect influence on the target variable is of particular importance to better understand how risks factors affect Covid-19 outcomes and to plan and to develop improvement strategies.
Once the model has been estimated, a key feature of the BN approach is that it provides the opportunity to assess alternative hypothetical scenarios. From the clinical point of view, it is interesting to evaluate which factors produce an increasing effect on the risk of severity of respiratory distress. By fixing CRP at the maximum level (≥ 155 mg/L), the probability to observe SOFA > 2 increases from 0.16 to 0.31 (Fig. 4) while by fixing both CRP at the maximum level (≥ 155 mg/L) and creatinine ≥ 1.2 mg/dL the probability to observe SOFA > 2 increases to 0.41 (Fig. 4). This finding emphasizes the role of BNs not only in measuring the dependence structure but also in highlighting the sign and strength of the interaction among risk factors by means of conditional probabilities.
Figure 4.

Hypothetical scenarios. Conditioned on CRP ≥ 155 mg/L and conditioned on CRP ≥ 155 mg/L and creatinine ≥ 1.2 mg/dL.
Discussion
In Covid-19 patients one major hurdle have been how to define patients’ severity. Indeed, many classifications (like binary classification for ICU admission, or level of respiratory impairments) suffer from being affected by specific emergency in hospitalization and difficulty. The main goal of this paper was to profile Covid-19 patients with respect to disease severity with an integrated statistical approach relying on machine learning and Bayesian networks to investigate general dependence structure of the data.
This allowed us to stratify patients with respect to their risk of experiencing worst outcome (i.e., in-hospital death and severity of respiratory distress). Results obtained with different approaches were consistent in confirming not only the well-known strong association between older age, CRP, SOFA score and death in Covid-1917 but also in founding a lower creatinine cutoff (i.e., 1.2 mg/dL) than the currently found in literature18,19. This suggests a Covid-19 specific threshold in creatinine which is lower than the common threshold of severe chronic kidney disease, thus spreading light on a possible new crucial role of creatinine as early predictor of severe Covid-19 disease. The selected threshold equal to 1.2 mg/dL coincides with the threshold of attention for nephrologists for incoming kidney impairment (typically a creatinine level greater than 1.2 mg/dL for women and greater than 1.4 mg/dL for men, corresponding to approximately eGFR less than 60 ml/min/1.73 m2)9.
Another important finding that emerged from these analyzes is the role of the SOFA score, assessed both as exposure and as outcome. It is well known that SOFA score is associated with mortality in Covid-1920 and when it was considered as prognostic factor in ST, the cut-off value (i.e., > 2) identified in literature was confirmed21. On the other hand, when SOFA score was evaluated as outcome, creatinine level less than 1.2 mg/dL identified the group of patients with low risk of severe respiratory distress. These results were also confirmed by BN analyses.
The multilayer definition of risk defined by the ST and CART analyses represents a framework to implement the principles of precision medicine in the management of the Covid-19 pandemic and can be used to identify patients at risk in the context of clinical trials or public health interventions. Prognostic factors (stand-alone or combined in risk assessment models) may guide the stratification of patients with SARS-CoV-2 infectious disease based on their risk of severe respiratory distress or death. This risk stratification may subsequently guide optimized management and resource utilization strategies in the care of these patients.
Supplementary Information
Acknowledgements
The authors wish to thank the COVID-BioB study group, namely Andrea Andolina, Martina Baiardo Redaelli, Giorgia Bigai, Alba Bigoloni, Giorgia Borio, Simona Bossolasco, Elena Bruzzesi, Maria Grazia Calabrò, Stefania Calvisi, Diana Canetti, Valentina Canti, Jacopo Castellani, Barbara Castiglioni, Ludovica Cavallo, Massimo Cernuschi, Matteo Chiurlo, Marta Cilla, Elena Cinel, Paola Cinque, Caterina Conte, Valentina Da Prat, Anna Danise, Rebecca De Lorenzo, Antonio Dell’Acqua, Raffaele Dell’Acqua, Emanuel Della Torre, Liviana Della Torre, Gaetano Di Terlizzi, Iulia Dumea, Federica Farolfi, Marica Ferrante, Claudia Frangi, Luca Fumagalli, Gabriele Gallina, Bruno Germinario, Nicola Gianotti, Monica Guffanti, Hamid Hasson, Francesca Lalla, Marco Lanzillotta, Raffaele Li Voti, Emanuela Messina, Chiara Molinari, Elena Moizo, Marco Montagna, Giulia Morsica, Silvia Nozza, Maria Pascali, Alessandro Patrizi, Marina Pieri, Antonella Poloniato, Dario Prestifilippo, Giuseppe Ramirez, Martina Ranzenigo, Jacopo Sapienza, Federico Seghi, Giuseppe Tambussi, Chiara Tassan Din, Stefano Turi, Caterina Uberti-Foppa, Paolo Betti, Romina Bucci, Paola Casanova and Concetta Vinci. A special thanks to Laura Galli for her precious suggestions and supportive comments.
Author contributions
C.L., P.R.Q., A.C. and C.D.S. conceived the study. C.L., P.R.Q. and A.C. supervised the study and data curation. R.D.L., M.S. and L.C. contributed to data collection. C.D.S., M.G.S. and F.C. developed statistical approaches and performed statistical analysis. C.L., P.R.Q., A.C., C.D.S., M.G.S. and F.C. discussed the results. C.L., C.D.S., M.G.S. and F.C. wrote the paper. All authors critically revised the paper and approved its final version.
Data availability
The datasets analyzed during the current study available from the corresponding author on reasonable request.
Competing interests
The authors declare no competing interests.
Footnotes
Publisher's note
Springer Nature remains neutral with regard to jurisdictional claims in published maps and institutional affiliations.
These authors contributed equally: Federica Cugnata and Maria Giovanna Scarale.
Supplementary Information
The online version contains supplementary material available at 10.1038/s41598-023-32089-3.
References
- 1.Sanyaolu A, Okorie C, Marinkovic A, et al. Comorbidity and its impact on patients with COVID-19. SN Compr. Clin. Med. 2020 doi: 10.1007/s42399-020-00363-4. [DOI] [PMC free article] [PubMed] [Google Scholar]
- 2.Alyammahi SK, Abdin SM, Alhamad DW, Elgendy SM, Altell AT, Omar HA. The dynamic association between COVID-19 and chronic disorders: An updated insight into prevalence, mechanisms and therapeutic modalities. Infect. Genet. Evol. 2021;87:104647. doi: 10.1016/j.meegid.2020.104647. [DOI] [PMC free article] [PubMed] [Google Scholar]
- 3.Menon T, Gandhi SAQ, Tariq W, Sharma R, Sardar S, Arshad AM, Adhikari R, Ata F, Kataria S, Singh R. Impact of chronic kidney disease on severity and mortality in COVID-19 patients: A systematic review and meta-analysis. Cureus. 2021;13(4):e14279. doi: 10.7759/cureus.14279. [DOI] [PMC free article] [PubMed] [Google Scholar]
- 4.ERA-EDTA Council. ERACODA Working Group Chronic kidney disease is a key risk factor for severe COVID-19: A call to action by the ERA-EDTA. Nephrol. Dial. Transplant. 2021;36(1):87–94. doi: 10.1093/ndt/gfaa314. [DOI] [PMC free article] [PubMed] [Google Scholar]
- 5.Suri JS, Agarwal S, Gupta SK, et al. A narrative review on characterization of acute respiratory distress syndrome in COVID-19-infected lungs using artificial intelligence. Comput. Biol. Med. 2021;130:104210. doi: 10.1016/j.compbiomed.2021.104210. [DOI] [PMC free article] [PubMed] [Google Scholar]
- 6.Vincent JL, de Mendonca A, Cantraine F, Monero R, Takala J, Suter PM, Sprung CL. Use of the SOFA score to assess the incidence of organ dysfunction/failure in intensive care units: Results of a multicenter, prospective study, Working group on sepsis-related problems of the European Society of Intensive Care Medicine. Crit. Care Med. 1996;26(11):1793–1800. doi: 10.1097/00003246-199811000-00016. [DOI] [PubMed] [Google Scholar]
- 7.Lanzani C, Simonini M, Arcidiacono T. Role of blood pressure dysregulation on kidney and mortality outcomes in COVID-19. Kidney, blood pressure and mortality in SARS-CoV-2 infection. J. Nephrol. 2021;34:305–314. doi: 10.1007/s40620-021-00997-0. [DOI] [PMC free article] [PubMed] [Google Scholar]
- 8.von Elm E, Altman DG, Egger M, Pocock SJ, Gøtzsche PC, Vandenbroucke JP, STROBE Initiative The Strengthening the Reporting of Observational Studies in Epidemiology (STROBE) statement: Guidelines for reporting observational studies. J. Clin. Epidemiol. 2008;61(4):344–349. doi: 10.1016/j.jclinepi.2007.11.008. [DOI] [PubMed] [Google Scholar]
- 9.Levey AS, Eckardt KU, Tsukamoto Y, Levin A, Coresh J, Rossert J, De Zeeuw D, Hostetter TH, Lameire N, Eknoyan G. Definition and classification of chronic kidney disease: A position statement from kidney disease: Improving Global Outcomes (KDIGO) Kidney Int. 2005;67(6):2089–2100. doi: 10.1111/j.1523-1755.2005.00365.x. [DOI] [PubMed] [Google Scholar]
- 10.Pandharipande PP, Shintani AK, Hagerman HE, et al. Derivation and validation of SpO2/FiO2 ratio to impute for PaO2/FiO2 ratio in the respiratory component of the Sequential Organ Failure Assessment Score. Crit. Care Med. 2009;37:1317–1321. doi: 10.1097/CCM.0b013e31819cefa9. [DOI] [PMC free article] [PubMed] [Google Scholar]
- 11.Shannon F, Tran A, Taljaard M, Cheng W, Rochwerg B, Seely AJE, Perry JJ. Prognostic accuracy of the quick sequential organ failure assessment for mortality in patients with suspected infection. Ann. Intern. Med. 2018;168(4):266–275. doi: 10.7326/M17-2820. [DOI] [PubMed] [Google Scholar]
- 12.Cippà PE, Cugnata F, Ferrari P, Brombin C, Ruinelli L, Bianchi G, Beria N, Schulz L, Bernasconi E, Merlani P, Ceschi A, Di Serio C. A data-driven approach to identify risk profiles and protective drugs in COVID-19. Proc. Natl. Acad. Sci. 2021;118(1):e2016877118. doi: 10.1073/pnas.2016877118. [DOI] [PMC free article] [PubMed] [Google Scholar]
- 13.Pearl J. Causality: Models, Reasoning, and Inference. Cambridge University Press; 2000. [Google Scholar]
- 14.Cugnata F, Kenett RS, Salini S. Bayesian networks in survey data: Robustness and sensitivity issues. J. Qual. Technol. 2016;48:253–264. doi: 10.1080/00224065.2016.11918165. [DOI] [Google Scholar]
- 15.Scutari M. Learning Bayesian Networks with the bnlearn R Package. J. Stat. Softw. 2010;35(3):1–22. doi: 10.18637/jss.v035.i03. [DOI] [Google Scholar]
- 16.Højsgaard S. Graphical Independence Networks with the gRain Package for R. J. Stat. Softw. 2012;46(10):1–26. [Google Scholar]
- 17.Cheng Y, Luo R, Wang K, Zhang M, Wang Z, Dong L, Li J, Yao Y, Ge S, Xu G. Kidney disease is associated with in-hospital death of patients with COVID-19. Kidney Int. 2020;97(5):829–838. doi: 10.1016/j.kint.2020.03.005. [DOI] [PMC free article] [PubMed] [Google Scholar]
- 18.Shi S, Qin M, Shen B, Cai Y, Liu T, Yang F, Gong W, Liu X, Liang J, Zhao Q, Huang H, Yang B, Huang C. Association of cardiac injury with mortality in hospitalized patients with COVID-19 in Wuhan, China. JAMA Cardiol. 2020;5(7):802–810. doi: 10.1001/jamacardio.2020.0950. [DOI] [PMC free article] [PubMed] [Google Scholar]
- 19.Price-Haywood EG, Burton J, Fort D, Seoane L. Hospitalization and mortality among black patients and white patients with Covid-19. N. Engl. J. Med. 2020;382(26):2534–2543. doi: 10.1056/NEJMsa2011686. [DOI] [PMC free article] [PubMed] [Google Scholar]
- 20.Zhou F, Ting Yu, Ronghui Du, Fan G, Liu Y, Liu Z, et al. Clinical course and risk factors for mortality of adult inpatients with COVID-19 in Wuhan, China: A retrospective cohort study. Lancet. 2020;395:1054–1062. doi: 10.1016/S0140-6736(20)30566-3. [DOI] [PMC free article] [PubMed] [Google Scholar]
- 21.Izcovich A, Ragusa MA, Tortosa F, LavenaMarzio MA, Agnoletti C, Bengolea A, Ceirano A, Espinosa F, Saavedra E, Sanguine V, Tassara A, Cid C, Catalano HN, Agarwal A, Foroutan F, Rada G. Prognostic factors for severity and mortality in patients infected with COVID-19: A systematic review. PLoS ONE. 2020;15(11):e0241955. doi: 10.1371/journal.pone.0241955. [DOI] [PMC free article] [PubMed] [Google Scholar]
Associated Data
This section collects any data citations, data availability statements, or supplementary materials included in this article.
Supplementary Materials
Data Availability Statement
The datasets analyzed during the current study available from the corresponding author on reasonable request.