

Abstract
Mitochondrial dysfunction has been indicated in neurodegenerative and other disorders. The mitochondrial complex I (MC-I) of the electron transport chain (ETC) on the inner membrane is the electron entry point of the ETC and is essential for the production of reactive oxygen species. Based on a recently identified β-keto-amide type MC-I modulator from our laboratory, an 18F-labeled positron emission tomography (PET) tracer, 18F-2, was prepared. PET/CT imaging studies demonstrated that 18F-2 exhibited rapid brain uptake without significant wash out during the 60 min scanning time. In addition, the binding of 18F-2 was higher in the regions of the brain stem, cerebellum, and midbrain. The uptake of 18F-2 can be significantly blocked by its parent compound. Collectively, the results strongly suggest successful development of MC-I PET tracers from this chemical scaffold that can be used in future mitochondrial dysfunction studies of the central nervous system.
Keywords: brain uptake, mitochondrial complex I (MC-I), positron emission tomography (PET), radiotracer, Alzheimer’s disease
Graphical Abstract:

INTRODUCTION
Alzheimer’s disease (AD) is a neurodegenerative disorder characterized by a progressive deterioration of cognitive functions. Approximately, 1 in 10 individuals over the age of 65 suffers from AD, a figure set to increase to 1 in 3 over the age of 85.1 Although numerous studies have been dedicated to understanding the mechanisms leading to AD,2–5 the exact etiology of AD remains elusive. Among the studied pathogenic factors, mitochondrial dysfunctions in brain cells have been suggested to play critical roles in the ultimate development of AD.6–9 Mitochondria are dynamic organelles that control cellular energy production, redox signaling, and cell survival.10 The bioenergetic function of mitochondria is executed by the electron transport chain (ETC) via oxidative phosphorylation and aerobic adenosine triphosphate (ATP) production. The ETC is ubiquitously expressed throughout the inner mitochondrial membrane and consists of mitochondrial complexes I–V. Among the five ETC complexes, mitochondrial complex I (MC-I) is the entry point for electrons into the ETC and catalyzes electron transfer from nicotinamide adenine dinucleotide to ubiquinone.11 Accrued evidence indicates that the MC-I abnormalities decrease cellular energy production and mitochondrial respiration in the brain, which have been recognized as an essential contributor to AD.12,13 Furthermore, mitochondria are the major organelles that produce the majority of reactive oxygen species (ROS) through MC-I and MC-III.14–16 Recent studies have indicated the pathological roles of mitochondrial ROS in the central nervous system (CNS) inflammatory responses.17 Genetic studies from Alzheimer’s Disease Neuroimaging Initiative (ADNI) also revealed the increased risk of AD development with mutations of MC-I.18,19
While mitochondrial dysfunction has shown essential roles in AD, much is still debated and their contributions to disease development remain elusive. Therefore, a quantitative and noninvasive monitoring of MC-I in the human brain under healthy and pathological conditions would be valuable to help understand the contributions of MC-I dysfunction to disease pathology and to serve both diagnostic and therapeutic purposes. In this regard, positron emission tomography (PET) would be an ideal method for imaging the biological functions of MC-I. PET has been developed to visualize molecular targets in inaccessible tissues, particularly in the brain, therefore offering distinct advantages for AD-related research.20 Given the roles of MC-I in the production of ATP, ROS, its link to neuroinflammation and involvement in the development of neurodegenerative disorders including AD, MC-I might serve as a meaningful biomarker for mitochondrial dysfunction, neuroinflammation, and oxidative stress. Consequently, PET radiotracers of MC-I will be valuable for both fundamental and translational research. Indeed, over the past few years, considerable efforts have been implemented toward developing MC-I PET radiotracers, and early attempts using rotenone and dihydrorotenol as potential PET radiotracers to image MC-I have been conducted in animal models.21,22 Recently, several chemically distinct PET radiotracers have been developed and tested to image MC-I in preclinical studies including 18F-BMS, 18F-BCPP-EF, 18F-BCPP-BF, and 11C-BCPP-EM (Figure 1).23–35 Among them, 18F-BCPP-EF is being evaluated in clinical studies in healthy individuals and AD patients.36–39 These radiotracers also target the rotenone binding site of MC-I and show relatively high nonspecific binding in the brain. Given that multiple sites exist within MC-I and they have different roles in the production of ROS and ATP, novel PET radiotracers of MC-I that target sites other than the rotenone site are needed to help understand its pathological roles and facilitate therapeutic development.
Figure 1.
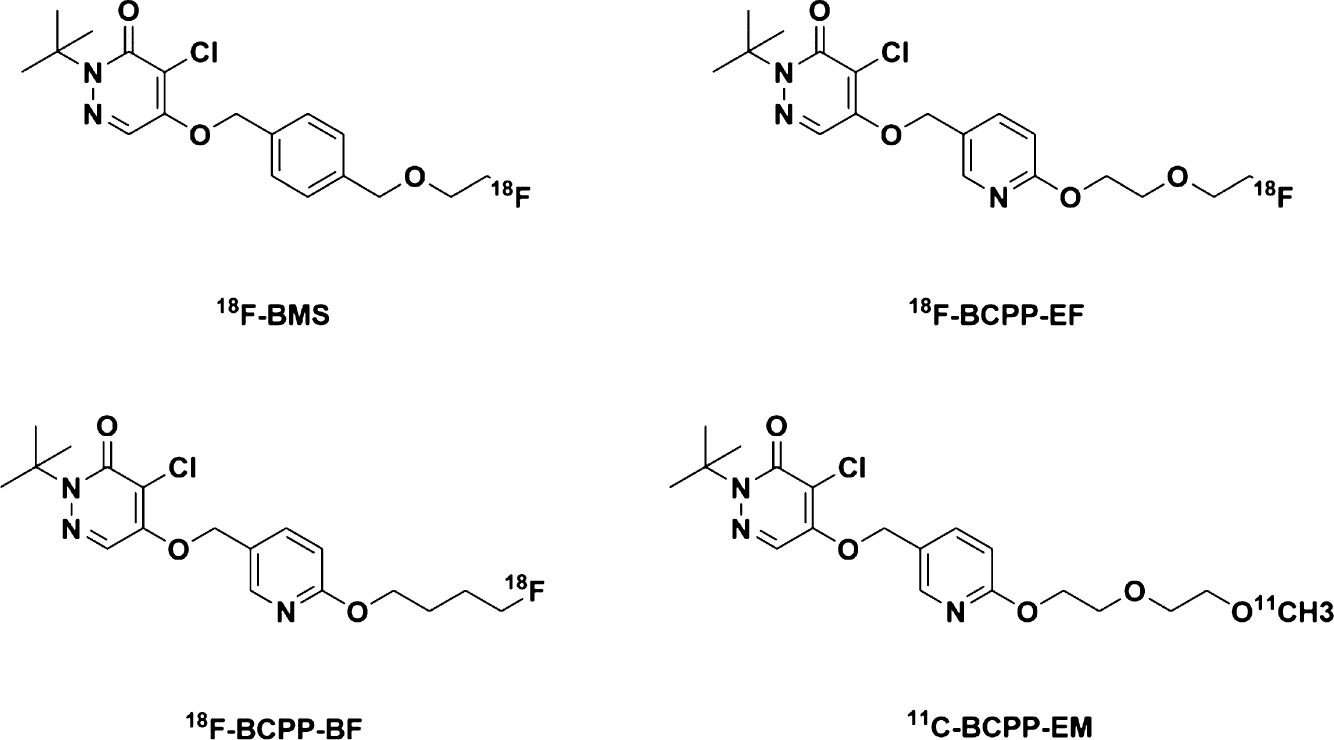
Chemical structures of 18F-BMS, 18F-BCPP-EF, 18F-BCPP-BF, and 11C-BCPP-EM.
Recently, our group has successfully developed a lead compound, ZCM-I-1 (Figure 2), showing promising neuroprotective activities both in vitro and in vivo in preclinical AD models.40,41 Mechanistic studies revealed that this lead compound selectively modulates the function of MC-I by binding to the MC-I flavin mononucleotide (FMN) site, representing a novel mechanism of action.42 Inspired to further investigate the pathological roles of MC-I in AD and other neurodegenerative disorders, herein, we describe the development of a PET radiotracer of ZCM-I-1 as a potential living brain imaging tool.
Figure 2.

Chemical structures of rationally designed lead compound ZCM-I-1 and analog 2.
RESULTS AND DISCUSSION
Before we start the attempt for radiolabeling of ZCM-I-1, we further confirmed its interaction with MC-I using a cellular thermal shift assay (CESTA).43,44 Mouse brain mitochondria and MC-I were isolated and purified following the procedures that we described recently.42 As shown in Figure 3A, upon incubation with ZCM-I-1, the stability of NDUFV1, the subunit of the FMN binding site and the major protein labeled by a photoaffinity labeling probe of ZCM-I-1,42 from the MC-I was increased from the range of 54 to 67.3 °C, as evidenced by the Western blotting results. Collectively, the CESTA results suggested the physical interaction of ZCM-I-1 with the brain MC-I.
Figure 3.

(A and B) Protein stability of the NDUFV1 subunit of complex I. Mouse brain mitochondrial complex I was incubated with (A) ZCM-I-1 or (B) compound 2 (1 μM) for 1 h. The proteins were resolved by SDS-PAGE and probed by the anti-NDUFV1 antibody. The image represents results from one of the three independent experiments. (C) MST binding of compound 2 to MC-I.
Next, radiochemistry was attempted for ZCM-I-1 to develop a suitable PET radiotracer. By analyzing the chemical structure of ZCM-I-1, the logic consideration for radiolabeling would be the 5-OCH3 group on the indole ring with a –O11CH3 to maintain the intact structure of ZCM-I-1 and its physicochemical properties and favorable pharmacology toward MC-I.42–44 However, synthetically, multistep radiochemistry, including –OH or –NH protection and deprotection reactions, is needed, and this challenge will hinder the future clinical applications. Our recent structure–activity relationship (SAR) studies of ZCM-I-1 demonstrated that a 4-F analog of ZCM-I-1 (compound 2, Figure 2) exhibits comparable protective potency in the phenotypic screening assay.45 The CESTA also supported its physical interaction with the NDUFV1 subunit of MC-I (Figure 3B). We also measured the binding affinity of this compound to the purified MC-I from the bovine heart using the microscale thermophoresis (MST) assay,46 taking advantage of the autofluorescence of MC-I.47 As shown in Figure 3C, compound 2 binds to the MC-I with a KD of approximately 500 nM. Therefore, taking advantage of the presence of a 4-F substituent on compound 2, we decided to make an 18F-labeled radiotracer, 18F-2 (Scheme 1). An ruthenium-mediated radiofluorination method was employed to convert ZCM-I-1 to afford 18F-2 by using air-stable ruthenium complex CpRu(COD)Cl, chloroimidazolium chloride, and 18F-fluoride as reported.48 Specifically, ZCM-I-1 was first activated by CpRu(COD)Cl to form an η6 π-coordinated ruthenium–phenol complex, which was used to elute 18F-fluoride off an anion exchange cartridge by the subsequent addition of chloroimidazolium chloride. The elution efficiency of 18F-fluoride achieved 89 ± 6% (n = 5). After adding solvent (DMSO/acetonitrile (v/v) = 1:1), the reaction mixture was heated to 125 °C for 30 min followed by high-performance liquid chromatography (HPLC) purification and reformulation to afford 18F-2 in sterile saline containing <10% (v/v) ethanol. The overall yield for the radiolabeling chemistry was 11 ± 4% (n = 3, decay corrected) in a total synthesis time of 70 ± 5 min from end of cyclotron bombardment. The molar activity was around 2 Ci/μmol, and the radiochemical purities were consistently confirmed being greater than 95% at time of injection.
Scheme 1.

Radiochemical Synthesis of 18F-2
After the successful radiochemistry, a 60 min dynamic PET scan was attempted in C57BL/6 mice (25–30 g, male, n = 2) after administration of 18F-2 via tail vein injection to determine its biodistribution (Figure 4). The PET imaging with 18F-2 revealed a high uptake in the liver (7.16% ID/cc at 30 min post-injection) and kidney (8.17% ID/cc at 30 min post-injection). A gradual increase in the uptake with time was also observed in the kidney, suggesting that 18F-2 may be mainly excreted through urine. However, the proximal tubular epithelial cells in the kidney contain ample mitochondria, which helps maintain the homeostasis of the cells to keep the best conditions for optimum kidney functions. Therefore, the intensive interactions between 18F-2 and mitochondria, leading to elevated uptake in the kidney, cannot be ruled out. Notably, 18F-2 displayed relatively slow clearance rates in the brain (brain5min/brain60min = 1.02), blood (blood5min/blood60min = 1.24), heart (heart5min/heart60min = 1.29), and lung (lung5min/lung60min = 1.19). A relatively low uptake in muscle was observed for 18F-2 followed by a gradual increase. A similar pattern was also observed in the bone for 18F-2, implying possible defluorination of 18F-2 in the bone tissue.
Figure 4.

Biodistribution histogram of 18F-2 in C57BL/6 mice. All data are the mean. Data are expressed as the percentage of injected dose per cubic centimeter (% ID/cc).
Next, we further analyzed the properties of 18F-2 in the brain tissue. The representative PET/CT image (sagittal, summed images 20–60 min) and time–activity curves (TACs) are shown in Figure 5. 18F-2 exhibited a modest but rapid uptake to reach a constant level (~1.60% ID/cc) without significant washout during the scan period. To further verify the clearance rate of 18F-2, we performed a 120 min dynamic PET scan in C57BL/6 mice (25–30 g, male, n = 4). The results still showed no washout between 60 and 120 min (see the Supporting Information, Figure S1). Since compound 2 is a neutral and noncovalent compound, this suggests that 18F-2 has a relatively long retention time in the brain tissues. However, the roles of blood flow and tissue extraction efficiency need to be investigated to fully understand the retention properties of this compound in the future since radiotracers with long retention time have been tested for cardiac imaging.21,22,24 Notably, 18F-2 showed higher binding signals in the brain stem, cerebellum, and midbrain, and this might indicate either higher MC-I expression or increased blood flow in these brain sections of the rodent. To test the binding specificity of 18F-2 in the brain, ideally, a different agent from a different chemical class that shares the same mechanism of action should be used to conduct the blocking studies. However, in this regard, there are no known ligands that share the same mechanism of action as ZCM-I-1 by binding to the FMN site of MC-I. Although resveratrol has been reported to bind to the FMN site,49 given its promiscuity and PAIN structure, it may not provide valuable information as a blocking agent. Therefore, we performed self-blocking experiments in C57BL/6 mice with its parent compound 2 (Figure 6A, 25–30 g, male, n = 2). However, the brain uptake was significantly increased in self-blocking mice compared with that of baseline mice, which could be, to some extent, attributed to the increased free 18F-2 in blood after pretreatment with compound 2 (see the Supporting Information, Figure S1). Therefore, the radioactivity accumulation is presented as the whole brain radioactivity normalized by maximal blood radioactivity. Pretreatment of compound 2 (5 mg/kg) led to a significant reduction in the brain radioactivity (~34%, based on the area under the curve from 20 to 60 min). Surprisingly, under the self-blocking condition, no significant elimination of 18F-2 was observed during the PET scan. This suggests a strong binding of this radiotracer or nonreversible binding in the mouse brain. Although the properties of 2 suggest it as a favorable CNS therapeutic agent, the kinetics of 18F-2 shown here warrant further optimization of the lead structure to develop MC-I PET tracers that are suitable for quantitative imaging analysis of brain function as the imaging probe. Collectively, the characterization of 18F-2 in mice suggested the potential development of MC-I PET radiotracers by the further SAR optimization process using ZCM-I-1 as a lead compound.
Figure 5.

Brain regional radioactivity in mice. (A) Sagittal sections were superimposed on the corresponding template MRI. (B) Coronal sections were superimposed on the corresponding template MRI. (C) Transverse sections were superimposed on the corresponding template MRI. (D) TACs for brain regions. Blue, cortex; red, striatum; green, thalamus; yellow, cerebellum; brown, brain stem; purple, midbrain; and dark green, hippocampus. All data are the mean (n = 6). Data are expressed as the percentage of injected dose per cubic centimeter (% ID/cc).
Figure 6.

(A) Specificity of 18F-2 toward MC-I in the mouse brain. TACs of whole brain uptake of 18F-2 in baseline and self-blocking conditions. All data are the mean. “*” means whole brain radioactivity normalized by maximal blood radioactivity. (B) Percentages of parent 18F-2 in the plasma and brain homogenate of C57BL/6 mice (n = 4) at 30 min post-injection.
To evaluate the stability of 18F-2, radiometabolites in the plasma and brain homogenates of C57BL/6 mice were studied at 30 min post-injection. The percentages of parent 18F-2 and the corresponding radiometabolites, which were determined by radio-HPLC (see the Supporting Information), are depicted in Figure 6B. The radioactivity in plasma corresponding to 18F-2 was 81% at 30 min post-injection. Four radiometabolites, three of which are more polar and one is less polar than 18F-2, were observed in the plasma with 19% radioactivity in total. The possible metabolic sites within 18F-2 were predicted by SMARTCyp (see the Supporting Information, Table S1).50 The fraction corresponding to 18F-2 in mouse brain homogenates was 85% at 30 min post-injection. However, a notable difference in metabolism in the brain homogenates compared with that in the plasma is that only two radiometabolites, one of which is more polar, while the other one is less polar than 18F-2, were observed with 15% radioactivity, and they are identical to the ones found in the plasma. These results indicate that some of the 18F-labeled metabolites might be able to pass through the blood brain barrier. Thus, further structure optimization of 18F-2 is still needed.
Based on the results of in vivo PET studies and radiometabolite analysis, we further preliminarily evaluated the involvement of MC-I in AD by conducting 18F-2 PET imaging studies in wild-type and AD transgenic mice, given that the literature suggested the roles of MC-1 dysfunction in AD.12,13 To this end, 5× familial Alzheimer’s disease (FAD) transgenic mice (25–30 g, female, n = 4) and wild-type mice (25–30 g, female, n = 4) were employed in the PET/CT imaging studies with 18F-2 (Figure 7A). As shown in Figure 7B, the results indicated a slight decrease in the brain radioactivity of 18F-2 in the 5× FAD transgenic mice compared to the wild-type controls. The brain washout profile in 5× FAD transgenic mice is similar to that of wide-type mice. These results suggest that 18F-2 may have the potential to differentiate AD from normal mice and also imply that the expression levels of MC-I are decreased in AD transgenic mice compared to the wide-type mice, which agrees with previously published studies.32
Figure 7.

PET imaging studies of 18F-2 in wild-type (25–30 g, female, n = 4) and 5× FAD transgenic mice (25–30 g, female, n = 4). (A) Representative PET sagittal images in wild-type and 5× FAD mice (summed 20–60 min). (B) TACs of the whole brain uptake of 18F-2 in wild-type and 5× FAD mice. All data are the mean. Data are expressed as the percentage of injected dose per cubic centimeter (% ID/cc).
CONCLUSIONS
In conclusion, further characterization of a recently identified MC-I modulator, ZCM-I-1, from our laboratory, using the CESTA supported its physical interaction with the mouse brain MC-I. This also encourages development of ZCM-I-1-based PET radiotracers as imaging probes to better understand the pathological roles of MC-I dysfunction in AD and other disorders and to support clinical development of MC-I-targeted therapeutics. Based on the SAR results of ZCM-I-1, a novel PET radiotracer, 18F-2, was synthesized and characterized in C57BL/6 mice by PET/CT imaging. The results demonstrated that 18F-2 exhibits a rapid and high uptake in the liver and kidney. In addition, a gradual increase of uptake was observed in the kidney with time. Furthermore, 18F-2 shows slow clearance in the brain, blood, heart, and bone. Further analysis of 18F-2 in the brain tissue revealed a rapid uptake without significant wash out during the scanning time. Higher binding signals of 18F-2 were noted in the brain stem, cerebellum, and midbrain regions. More importantly, the radioactivity of 18F-2 in the brain was significantly reduced upon pretreatment with its parent compound, hinting its specific binding in the brain. However, the kinetics of 18F-2 in the brain tissue and metabolic studies suggested the need of further optimization to develop suitable CNS PET radiotracers for MC-I. Further characterization of 18F-2 in transgenic AD mice suggested its potential to differentiate the binding in AD mouse brains from wild-type mouse brains. Taken together, the structure of ZCM-I-1 represents a novel chemical scaffold to develop suitable CNS MC-I PET radiotracers that will help image the biological processes of MC-I under pathological conditions.
MATERIALS AND METHODS
General Information.
All commercially available reagents were used without further purification unless otherwise stated. Analytical thin layer chromatography was performed using Silica Gel GF254 plates (Merck Millipore co. ltd, 0.2 mm thick). Compounds were purified using CombiFlash Rf 150 (Teledyne ISCO co. ltd). 1H and 13C spectra were recorded on a Bruker 500 MHz. Chemical shifts in 1H NMR spectra were reported in parts per million (ppm) on the δ scale from an internal standard of CDCl3 (7.26 ppm). Data were reported as follows: chemical shift (δ ppm), multiplicity (s = singlet, d = doublet, t = triplet, q = quartet, m = multiplet, and br = Broad), coupling constant in hertz (Hz), and integration. Chemical shifts of 13C NMR spectra were reported in ppm from the central peak of CDCl3 (77.0 ppm) on the δ scale. MS data were recorded on an Agilent Technologies 6310 quadrupole mass spectrometer.
All animal studies were carried out at Massachusetts General Hospital (PHS Assurance of Compliance No. A3596-01). The Subcommittee on Research Animal Care (SRAC) serves as the Institutional Animal Care and Use Committee (IACUC) for the Massachusetts General Hospital. SRAC reviewed and approved all procedures detailed in this paper.
PET/CT imaging was performed in anesthetized (isoflurane) mice to minimize discomfort. Highly trained animal technicians monitored animal safety throughout all procedures, and veterinary staff were responsible for daily care. All mice were socially housed in cages appropriate for the physical and behavioral health of the individual animal and were given unlimited access to food and water, with additional nutritional supplements provided as prescribed by the attending veterinary staff.
Preparation of Compound 2.
Compound 2 was synthesized following our reported procedures.40
5-(4-Fluorophenyl)-N-(2-(5-methoxy-1H-indol-3-yl)ethyl)-3-oxo-pentanamide (Compound 2): 1H NMR (400 MHz, methanol-d4) δ 7.21 (d, J = 8.78 Hz, 1H), 7.10–7.15 (m, 2H), 7.06 (d, J = 2.26 Hz, 1H), 7.04 (s, 1H), 6.91–6.96 (m, 2H), 6.76 (dd, J = 2.38, 8.66 Hz, 1H), 3.81 (s, 3H), 3.49 (t, J = 7.15 Hz, 2H), 2.91 (t, J = 7.15 Hz, 2H), 2.74–2.79 (m, 4H); 13C NMR (100 MHz, methanol-d4) δ 205.8, 169.1, 164.1, 161.7, 155.2, 138.3, 133.6, 131.1, 131.1, 129.2, 124.5, 116.2, 115.9, 113.1, 113.1, 112.8, 101.6, 56.6, 45.3, 41.5, 29.6, 26.3. HRMS (m/z) (M + Na)−: calcd. For C22H23FN2NaO3 405.1585, found 405.1588.
Cellular Thermal Shift Assay (CESTA).
Mitochondrial complex I was purified from C57BL/6 mice as described.42 Purified complex I (700 ng) was incubated with ZCM-I-1 or compound 2 for 1 h on ice in no BSA buffer (215 mM mannitol, 75 mM sucrose, 1 mM EGTA, and 20 mM HEPS in purified water, pH 7.4). The samples were then heated to the designated temperatures on a Bio-Rad T100 thermal cycler for 3 min, cooled to 25 °C for 3 min, and further cooled to 4 °C for 30 s. The samples were then centrifuged at 20,000 g at 4 °C for 20 min, resolved by SDS-PAGE, and probed with NDUFV1 antibody (AbCam, ab210558).
Microscale Thermophoresis Assay.
A Monolith NT. Automated instrument was used to measure the KD value. A range of concentrations of compound 2 were incubated with purified MC-I (400 nM) from the bovine heart for 40 min in PBS-T assay buffer. The samples were loaded into NanoTemper glass capillaries, and a series of ligand-induced changes in thermophoresis curves was gained using an excitation power of 100% and a high MST power. KD values were calculated using the mass action equation with NanoTemper software from duplicate reads of an experiment.
Radiosynthesis of 18F-2.
ZCM-I-1 (3.0 mg, 7.9 μmol) and CpRu(COD)Cl (7.3 mg, 23.7 μmol) were added to EtOH (0.05 mL) in a 2 mL borosilicate glass vial. The vial was capped, and the reaction mixture was stirred at 85 °C for 30 min. The vial was removed from the heating block and allowed to stand for 1 min at room temperature. To the vial, N,N-bis(2,6-diisopropyl)phenyl-2-chloroimidazolium chloride (10.9 mg, 23.7 μmol) and 0.15 mL of MeCN were added, and the resulting solution was drawn into a 1.0 mL polypropylene syringe.
Target water from the cyclotron containing 18F-fluoride was loaded with a syringe onto a solid-phase exchange (SPE) Chromafix 30-PS-HCO3 cartridge. The cartridge was washed with MeCN (1.0 mL). The cartridge was inverted and fitted with a female × female Luer adapter. With the syringe, which contained the corresponding solution of ZCM-I-1, ruthenium complex, and N,N-bis(2,6-diisopropyl)phenyl-2-chloroimidazolium chloride, 18F-fluoride was eluted into an 8 mL borosilicate glass vial. The cartridge was washed with DMSO (0.15 mL) followed by DMSO/MeCN (0.05 mL, 1:1 (v/v)). The reaction vial, which contained 0.4 mL of the reaction mixture, was sealed with a Teflon-lined cap and was heated at 125 °C for 30 min. Then, the reaction mixture was allowed to stand for 1 min at room temperature.
The radioactive mixture containing 18F-2 was then applied to a reverse-phase semipreparative HPLC (Phenomenex Gemini-NX 5u C18 110A, 250 × 10 mm, 5.0 mL/min, a gradient of 10–90% CH3CN in H2O with 0.1% formic acid; 0–1 min, 10% CH3CN; 1–10 min, 10 to 90% CH3CN; and 10–15 min, 90% CH3CN). A radioactive fraction having a retention time of 10.5 min was collected in a flask and diluted in water (20 mL). The final product was reformulated by loading onto an SPE C-18 cartridge (Waters WAT020515 Sep-Pak Plus Short C18), rinsing with water (4 × 5 mL), eluting with EtOH (0.3 mL), and diluting with saline (2.7 mL). The chemical and radiochemical purity of 18F-2 was tested by analytical HPLC (VARIAN Puruit XRs 5 C18, 150 × 4.6 mm) and elution with a gradient of 10–90% solvent B in solvent A (solvent A was 0.1% TFA in H2O, and solvent B was CH3CN), at a flow rate of 2 mL/min. Confirmation of the identity of 18F-2 was achieved by coinjection with compound 2 as the reference standard. For the determination of specific activity, mass (μmol) of 18F-2 with a known radioactivity was determined by HPLC comparison of UV absorbance at 254 nm with those of known concentrations of nonradioactive compound 2.
PET/CT Imaging Studies.
Mice were used for the baseline and blocking studies. All animals were anesthetized with inhalational isoflurane at 3% in a carrier of 2 L/min medical oxygen and maintained at 2% isoflurane for the duration of the scan. The mice were fixed on the bed of a Triumph Trimodality PET/CT scanner (Gamma Medica, Northridge, CA) in the prone position and injected with 18F-2 (150–200 μL; ~200 μCi) via a lateral tail vein catheterization at the start of PET acquisition. For blocking studies, compound 2 (5 mg/kg, iv) was injected at 10 min prior to 18F-2 injection. Dynamic PET acquisition lasted for 60 min and was followed by CT for anatomic coregistration. PET data were reconstructed using a 3D-MLEM method resulting in a full width at half-maximum resolution of 1 mm. Reconstructed images were exported from the scanner in the DICOM format along with an anatomic CT. These files were imported to PMOD software (PMOD Technologies LLC, version 4.0). Volumes of interests, including the whole brain, striatum, cortex, thalamus, midbrain, cerebellum, brain stem, and hippocampus, were placed referencing the MRI template software. TACs were exported in terms of decay-corrected activity at specified time points with gradually increasing intervals. TACs were expressed as the percentage of injected dose per cubic centimeter (% ID/cc).
Radiometabolism Studies.
After the intravenous injection of 18F-2, C57BL/6 mice (n = 4) were sacrificed at 30 min post-injection. Blood and whole brain samples were quickly removed. The blood samples were centrifuged at 4000 rpm for 4 min at 4 °C to separate the plasma. Then, the supernatant was collected in a small vial containing acetonitrile. The mixture was vortexed for 10 s and centrifuged at 4000 rpm for 4 min at 4 °C for deproteinization. The mouse brains were homogenized in a cold acetonitrile/water (1/1, v/v) solution. The homogenate was centrifuged at 4000 rpm for 4 min at 4 °C. Then, the supernatant was collected. An aliquot of the supernatant obtained from the plasma or brain homogenate was injected into the radio-HPLC system and analyzed using an Agilent Eclipse Plus 3.5 um C18 column (4.6 mm × 100 mm) at a flow rate of 2 mL/min in a gradient of 10–95% CH3CN with 0.1% formic acid in H2O with 0.1% formic acid (0–3 min, 10% CH3CN with 0.1% formic acid; 3–10 min, 10 to 95% CH3CN with 0.1% formic acid; 10–12 min, 95% CH3CN with 0.1% formic acid). The retention time of 18F-2 is 8.8 min. The percentages of parent 18F-2 and the corresponding radiometabolites were calculated as [peak area for 18F-2 or corresponding radiometabolites]/[total peak area] × 100.
Supplementary Material
ACKNOWLEDGMENTS
The work was supported in part by the NIA of the NIH under award number R01AG058673 (SZ), VCU CCTR funds (S.Z.), and a pilot funding from the Athinoula A. Martinos Center for Biomedical Imaging at the Massachusetts General Hospital (C.W.). The authors are grateful to the Athinoula A. Martinos Center Radiopharmacy Lab staff for the assistance in radiochemistry.
ABBREVIATIONS
- AD
Alzheimer’s disease
- ADNI
Alzheimer’s Disease Neuroimaging Initiative
- ATP
adenosine triphosphate
- AUC
area under the curve
- CESTA
cellular thermal shift assay
- CNS
central nervous system
- ETC
electron transport chain
- FMN
flavin mononucleotide
- HPLC
high-performance liquid chromatography
- MC-I
mitochondrial complex
- MST
microscale thermophoresis
- NADH
nicotinamide adenine dinucleotide
- OXPHOS
oxidative phosphorylation
- PET
positron emission tomography
- ROS
reactive oxygen species
- SAR
structure–activity relationship
- TACs
time–activity curves
- TLC
thin layer chromatography
Footnotes
The authors declare no competing financial interest.
ASSOCIATED CONTENT
Supporting Information
The Supporting Information is available free of charge at https://pubs.acs.org/doi/10.1021/acschemneuro.1c00297.
Predicted metabolic sites by SMARTCyp, brain regional radioactivity under 120 min scanning, the TACs of blood uptake of 18F-2, and the HPLC profiles of radiometabolite analysis (PDF)
Complete contact information is available at: https://pubs.acs.org/10.1021/acschemneuro.1c00297
Contributor Information
Yulong Xu, Athinoula A. Martinos Center for Biomedical Imaging, Department of Radiology, Massachusetts General Hospital, Harvard Medical School, Charlestown, Massachusetts 02129, United States.
Yiming Xu, Department of Medicinal Chemistry, Virginia Commonwealth University, Richmond, Virginia 23298, United States.
Savannah Biby, Department of Medicinal Chemistry, Virginia Commonwealth University, Richmond, Virginia 23298, United States.
Ping Bai, Athinoula A. Martinos Center for Biomedical Imaging, Department of Radiology, Massachusetts General Hospital, Harvard Medical School, Charlestown, Massachusetts 02129, United States.
Yan Liu, Athinoula A. Martinos Center for Biomedical Imaging, Department of Radiology, Massachusetts General Hospital, Harvard Medical School, Charlestown, Massachusetts 02129, United States.
Can Zhang, Department of Neurology, Massachusetts General Hospital, Harvard Medical School, Genetics and Aging Research Unit, McCance Center for Brain Health, Mass General Institute for Neurodegenerative Disease, Charlestown, Massachusetts 02129, United States.
Changning Wang, Athinoula A. Martinos Center for Biomedical Imaging, Department of Radiology, Massachusetts General Hospital, Harvard Medical School, Charlestown, Massachusetts 02129, United States.
Shijun Zhang, Department of Medicinal Chemistry, Virginia Commonwealth University, Richmond, Virginia 23298, United States.
REFERENCES
- (1).Yu J; Zhu H; Taheri S; Mondy W; Perry S; Kirstein C; Kindy MS Effects of GrandFusion diet on cognitive impairment in transgenic mouse model of Alzheimer’s disease. Nutrients 2021, 13, 117. [DOI] [PMC free article] [PubMed] [Google Scholar]
- (2).Hardy JA; Higgins GA Alzheimer’s disease: the amyloid cascade hypothesis. Science 1992, 256, 184–185. [DOI] [PubMed] [Google Scholar]
- (3).Akiyama H; Barger S; Barnum S; Bradt B; Bauer J; Cole GM; Cooper NR; Eikelenboom P; Emmerling M; Fiebich BL; Finch CE; Frautschy S; Griffin WS; Hampel H; Hull M; Landreth G; Lue L; Mrak R; Mackenzie IR; McGeer PL; O’Banion MK; Pachter J; Pasinetti G; Plata-Salaman C; Rogers J; Rydel R; Shen Y; Streit W; Strohmeyer R; Tooyoma I; Van Muiswinkel FL; Veerhuis R; Walker D; Webster S; Wegrzyniak B; Wenk G; Wyss-Coray T Inflammation and Alzheimer’s disease. Neurobiol. Aging 2000, 21, 383–421. [DOI] [PMC free article] [PubMed] [Google Scholar]
- (4).Castellani R; Hirai K; Aliev G; Drew KL; Nunomura A; Takeda A; Cash AD; Obrenovich ME; Perry G; Smith MA Role of mitochondrial dysfunction in Alzheimer’s disease. J. Neurosci. Res. 2002, 70, 357–360. [DOI] [PubMed] [Google Scholar]
- (5).Zhu X; Su B; Wang X; Smith MA; Perry G Causes of oxidative stress in Alzheimer disease. Cell. Mol. Life Sci. 2007, 64, 2202–2210. [DOI] [PMC free article] [PubMed] [Google Scholar]
- (6).Swerdlow RH Mitochondria and cell bioenergetics: increasingly recognized components and a possible etiologic cause of Alzheimer’s disease. Antioxid. Redox Signaling 2012, 16, 1434–1455. [DOI] [PMC free article] [PubMed] [Google Scholar]
- (7).Swerdlow RH; Burns JM; Khan SM The Alzheimer’s disease mitochondrial cascade hypothesis: progress and perspectives. Biochim. Biophys. Acta 2014, 1842, 1219–1231. [DOI] [PMC free article] [PubMed] [Google Scholar]
- (8).Swerdlow RH; Khan SMA ″mitochondrial cascade hypothesis″ for sporadic Alzheimer’s disease. Med. Hypotheses 2004, 63, 8–20. [DOI] [PubMed] [Google Scholar]
- (9).Zhang B; Gaiteri C; Bodea L-G; Wang Z; McElwee J; Podtelezhnikov AA; Zhang C; Xie T; Tran L; Dobrin R; Fluder E; Clurman B; Melquist S; Narayanan M; Suver C; Shah H; Mahajan M; Gillis T; Mysore J; MacDonald ME; Lamb JR; Bennett DA; Molony C; Stone DJ; Gudnason V; Myers AJ; Schadt EE; Neumann H; Zhu J; Emilsson V Integrated systems approach identifies genetic nodes and networks in late-onset Alzheimer’s disease. Cell 2013, 153, 707–720. [DOI] [PMC free article] [PubMed] [Google Scholar]
- (10).Nicholls D; Ferguson SJ Bioenergetics, 4th ed; Elsevier: London, U.K, 2013, 303–325. [Google Scholar]
- (11).Hirst J Mitochondrial complex I. Annu. Rev. Biochem. 2013, 82, 551–575. [DOI] [PubMed] [Google Scholar]
- (12).Schmitt K; Grimm A; Kazmierczak A; Strosznajder JB; Götz J; Eckert A Insights into mitochondrial dysfunction: aging, amyloid-β, and tau-A deleterious trio. Antioxid. Redox Signaling 2012, 16, 1456–1466. [DOI] [PubMed] [Google Scholar]
- (13).Grimm A; Eckert A Brain aging and neurodegeneration: from a mitochondrial point of view. J. Neurochem. 2017, 143, 418–431. [DOI] [PMC free article] [PubMed] [Google Scholar]
- (14).Brand MD Mitochondrial generation of superoxide and hydrogen peroxide as the source of mitochondrial redox signaling. Free Radical Biol. Med. 2016, 100, 14–31. [DOI] [PubMed] [Google Scholar]
- (15).Goncalves RLS; Bunik VI; Brand MD Production of superoxide/hydrogen peroxide by the mitochondrial 2-oxoadipate dehydrogenase complex. Free Radical Biol. Med. 2016, 91, 247–255. [DOI] [PubMed] [Google Scholar]
- (16).Quinlan CL; Perevoschikova IV; Goncalves RL; Hey-Mogensen M; Brand MD The determination and analysis of site-specific rates of mitochondrial reactive oxygen species production. Methods Enzymol. 2013, 526, 189–217. [DOI] [PMC free article] [PubMed] [Google Scholar]
- (17).Monlun M; Hyernard C; Blanco P; Lartigue L; Faustin B Mitochondria as molecular platforms integrating multiple innate immune signalings. J. Mol. Biol. 2017, 429, 1–13. [DOI] [PubMed] [Google Scholar]
- (18).Lakatos A; Derbeneva O; Younes D; Keator D; Bakken T; Lvova M; Brandon M; Guffanti G; Reglodi D; Saykin A; Weiner M; Macciardi F; Schork N; Wallace DC; Potkin SG and Alzheimer’s Disease Neuroimaging Initiative. Association between mitochondrial DNA variations and Alzheimer’s disease in the ADNI cohort. Neurobiol. Aging 2010, 31, 1355–1363. [DOI] [PMC free article] [PubMed] [Google Scholar]
- (19).Biffi A; Sabuncu MR; Desikan RS; Schmansky N; Salat DH; Rosand J; Anderson CD; Alzheimer’s Disease Neuroimaging Initiative. Genetic variation of oxidative phosphorylation genes in stroke and Alzheimer’s disease. Neurobiol. Aging 2014, 35, 1956.e1–8. [DOI] [PMC free article] [PubMed] [Google Scholar]
- (20).Xu Y; Wang C; Wey H-Y; Liang Y; Chen Z; Choi SH; Ran C; Rynearson KD; Bernales DR; Koegel RE; Fiedler SA; Striar R; Wagner SL; Tanzi RE; Zhang C Molecular imaging of Alzheimer’s disease-related gamma-secretase in mice and nonhuman primates. J. Exp. Med. 2020, 217, No. e20182266. [DOI] [PMC free article] [PubMed] [Google Scholar]
- (21).Marshall RC; Powers-Risius P; Reutter BW; Taylor SE; Van Brocklin HF; Huesman RH; Budinger TF Kinetic analysis of 125I-iodorotenone as a deposited myocardial flow tracer: comparison with 99mTc-sestamibi. J. Nucl. Med. 2001, 42, 272–281. [PubMed] [Google Scholar]
- (22).Marshall RC; Powers-Risius P; Reutter BW; O’Neil JP; Belle ML; Huesman RH; Van Brocklin HF Kinetic analysis of 18F-fluorodihydrorotenone as a deposited myocardial flow tracer: comparison to 201Tl. J. Nucl. Med. 2004, 45, 1950–1959. [PubMed] [Google Scholar]
- (23).Higuchi T; Nekolla SG; Huisman MM; Reder S; Poethko T; Yu M; Wester H-J; Casebier DS; Robinson SP; Botnar RM; Schwaiger M A new 18F-labeled myocardial PET tracer: myocardial uptake after permanent and transient coronary occlusion in rats. J. Nucl. Med. 2008, 49, 1715–1722. [DOI] [PubMed] [Google Scholar]
- (24).Yalamanchili P; Wexler E; Hayes M; Yu M; Bozek J; Kagan M; Radeke HS; Azure M; Purohit A; Casebier DS; Robinson SP Mechanism of uptake and retention of F-18 BMS-747158-02 in cardiomyocytes: a novel PET myocardial imaging agent. J. Nucl. Cardiol. 2007, 14, 782–788. [DOI] [PubMed] [Google Scholar]
- (25).Harada N; Nishiyama S; Kanazawa M; Tsukada H Development of novel PET probes, [18F]BCPP-EF, [18F]BCPP-BF, and [11C]BCPP-EM for mitochondrial complex I imaging in the living brain. J. Label. Compd. Radiopharm. 2013, 56, 553–561. [DOI] [PubMed] [Google Scholar]
- (26).Harada N; Nishiyama S; Kanazawa M; Tsukada H Development of novel PET probes, [18F]BCPP-EF, [18F]BCPP-BF, and [11C]BCPP-EM for mitochondrial complex 1 imaging in the living brain. J. Label. Compd. Radiopharm. 2013, 56, 553–561. [DOI] [PubMed] [Google Scholar]
- (27).Tsukada H; Ohba H; Kanazawa M; Kakiuchi T; Harada N Evaluation of 18F-BCPP-EF for mitochondrial complex 1 imaging in the brain of conscious monkeys using PET. Eur. J. Nucl. Med. Mol. Imaging 2014, 41, 755–763. [DOI] [PubMed] [Google Scholar]
- (28).Tsukada H; Ohba H; Nishiyama S; Kanazawa M; Kakiuchi T; Harada N PET imaging of ischemia-induced impairment of mitochondrial complex I function in monkey brain. J. Cereb. Blood Flow Metab. 2014, 34, 708–714. [DOI] [PMC free article] [PubMed] [Google Scholar]
- (29).Tsukada H; Nishiyama S; Fukumoto D; Kanazawa M; Harada N Novel PET probes 18F-BCPP-EF and 18F-BCPP-BF for mitochondrial complex I: a PET study in comparison with 18F-BMS-747158-02 in rat brain. J. Nucl. Med. 2014, 55, 473–480. [DOI] [PubMed] [Google Scholar]
- (30).Tsukada H; Nishiyama S; Ohba H; Kanazawa M; Kakiuchi T; Harada N Comparing amyloid-β deposition, neuroinflammation, glucose metabolism, and mitochondrial complex I activity in brain: a PET study in aged monkeys. Eur. J. Nucl. Med. Mol. Imaging 2014, 41, 2127–2136. [DOI] [PubMed] [Google Scholar]
- (31).Nishiyama S; Ohba H; Kanazawa M; Kakiuchi T; Tsukada H Comparing α7 nicotinic acetylcholine receptor binding, amyloid-β deposition, and mitochondria complex-I function in living brain: A PET study in aged monkeys. Synapse 2015, 69, 475–483. [DOI] [PubMed] [Google Scholar]
- (32).Tsukada H The use of 18F-BCPP-EF as a PET probe for complex I activity the brain. Methods Enzymol. 2014, 547, 417–431. [DOI] [PubMed] [Google Scholar]
- (33).Tsukada H; Kanazawa M; Ohba H; Nishiyama S; Harada N; Kakiuchi T PET imaging of mitochondrial complex I with 18F-BCPP-EF in the brains of MPTP-treated monkeys. J. Nucl. Med. 2016, 57, 950–953. [DOI] [PubMed] [Google Scholar]
- (34).Tsukada H Effects of amyloid-β deposition on mitochondrial complex i activity in brain: a PET study in monkeys, 2016. [Google Scholar]
- (35).Murayama C; Kawaguchi AT; Kamijo A; Naito K; Kanazawa M; Tsukada H Monitoring mitochondrial complex-i activity using novel PET Probe 18F-BCPP-EF Allows early detection of radiotherapy effect in murine squamous cell carcinoma. PLoS One 2017, 12, No. e0170911. [DOI] [PMC free article] [PubMed] [Google Scholar]
- (36).Mansur A; Rabiner EA; Comley RA; Lewis Y; Middleton LT; Huiban M; Passchier J; Tsukada H; Gunn RN; MIND-MAPS Consortium. Characterization of 3 PET Tracers for Quantification of Mitochondrial and Synaptic Function in Healthy Human Brain: 18 F-BCPP-EF, 11 C-SA-4503, and 11 C-UCB-J. J. Nucl. Med. 2020, 61, 96–103. [DOI] [PubMed] [Google Scholar]
- (37).Mansur A; Rabiner EA; Tsukada H; Comley RA; Lewis Y; Huiban M; Passchier J; Gunn RN Test-retest variability and reference region-based quantification of 18F-BCPP-EF for imaging mitochondrial complex I in the human brain. J. Cereb. Blood Flow Metab. 2021, 41, 771–779. [DOI] [PMC free article] [PubMed] [Google Scholar]
- (38).Terada T; Obi T; Bunai T; Matsudaira T; Yoshikawa E; Ando I; Futatsubashi M; Tsukada H; Ouchi Y In vivo mitochondrial and glycolytic impairments in patients with Alzheimer disease. Neurology 2020, 94, e1592–e1604. [DOI] [PubMed] [Google Scholar]
- (39).Terada T; Therriault J; Kang MSP; Savard M; Pascoal TA; Lussier F; Tissot C; Wang Y; Benedet A; Matsudaira T; Bunai T; Obi T; Tsukada H; Ouchi Y; Rosa-Neto P Mitochondrial complex I abnormalities is associated with tau and clinical symptoms in mild Alzheimer’s disease. Mol. Neurodegener. 2021, 16, 28. [DOI] [PMC free article] [PubMed] [Google Scholar]
- (40).Chojnacki JE; Liu K; Yan X; Toldo S; Selden T; Estrada M; Rodríguez-Franco MI; Halquist MS; Ye D; Zhang S Discovery of 5-(4-hydroxyphenyl)-3-oxo-pentanoic acid [2-(5-methoxy-1H-indol-3-yl)-ethyl]-amide as a neuroprotectant for Alzheimer’s disease by hybridization of curcumin and melatonin. ACS Chem. Neurosci. 2014, 5, 690–699. [DOI] [PMC free article] [PubMed] [Google Scholar]
- (41).Gerenu G; Liu K; Chojnacki JE; Saathoff JM; Martínez-Martín P; Perry G; Zhu X; Lee H-G; Zhang S Curcumin/melatonin hybrid 5-(4-hydroxy-phenyl)-3-oxo-pentanoic acid [2-(5-methoxy-1H-indol-3-yl)-ethyl]-amide ameliorates AD-like pathology in the APP/PS1 mouse model. ACS Chem. Neurosci. 2015, 6, 1393–1399. [DOI] [PMC free article] [PubMed] [Google Scholar]
- (42).Green JC; Jiang Y; He L; Xu Y; Sun D; Keoprasert T; Nelson C; Oh U; Lesnefsky EJ; Kellogg GE; Chen Q; Zhang S Characterization and discovery of a selective small-molecule modulator of mitochondrial complex I targeting a unique binding site. J. Med. Chem. 2020, 63, 11819–11830. [DOI] [PMC free article] [PubMed] [Google Scholar]
- (43).Jafari R; Almqvist H; Axelsson H; Ignatushchenko M; Lundbäck T; Nordlund P; Molina DM The cellular thermal shift assay for evaluating drug target interactions in cells. Nat. Protoc. 2014, 9, 2100–2122. [DOI] [PubMed] [Google Scholar]
- (44).Dziekan JM; Wirjanata G; Dai L; Go KD; Yu H; Lim YT; Chen L; Wang LC; Puspita B; Prabhu N; Sobota RM; Nordlund P; Bozdech Z Cellular thermal shift assay for the identification of drug-target interactions in the Plasmodium falciparum proteome. Nat. Protoc. 2020, 15, 1881–1921. [DOI] [PubMed] [Google Scholar]
- (45).Saathoff J; Green J; Jiang YQ; Xu YM; Kellogg GE; Zhang SJ Structural understanding of 5-(4-hydroxy-phenyl)-N-(2-(5-methoxy-1H-indol-3-yl)-ethyl)-3-oxopentanamide as a neuroprotectant for Alzheimer’s disease. Bioorg. Med. Chem. Lett. 2021, 43, No. 128081. [DOI] [PMC free article] [PubMed] [Google Scholar]
- (46).Jerabek-Willemsen M; Wienken CJ; Braun D; Baaske P; Duhr S Molecular interaction studies using microscale thermophoresis. Assay Drug Dev. Technol. 2011, 9, 342–353. [DOI] [PMC free article] [PubMed] [Google Scholar]
- (47).Hielscher R; Yegres M; Voicescu M; Gnandt E; Friedrich T; Hellwig P Characterization of two quinone radicals in the NADH:ubiquinone oxidoreductase from Escherichia coli by a combined fluorescence spectroscopic and electrochemical approach. Biochemistry 2013, 52, 8993–9000. [DOI] [PubMed] [Google Scholar]
- (48).Beyzavi MH; Mandal D; Strebl MG; Neumann CN; D’Amato EM; Chen J; Hooker JM; Ritter T 18F-Deoxyfluorination of phenols via Ru π-complexes. ACS Cent. Sci. 2017, 3, 944–948. [DOI] [PMC free article] [PubMed] [Google Scholar]
- (49).Gueguen N; Desquiret-Dumas V; Leman G; Chupin S; Baron S; Nivet-Antoine V; Vessières E; Ayer A; Henrion D; Lenaers G; Reynier P; Procaccio V Resveratrol Directly Binds to Mitochondrial Complex I and Increases Oxidative Stress in Brain Mitochondria of Aged Mice. PLoS One 2015, 10, No. e0144290. [DOI] [PMC free article] [PubMed] [Google Scholar]
- (50).Rydberg P; Gloriam DE; Zaretzki J; Breneman C; Olsen L SMARTCyp: A 2D Method for Prediction of Cytochrome P450-Mediated Drug Metabolism. ACS Med. Chem. Lett. 2010, 1, 96–100. [DOI] [PMC free article] [PubMed] [Google Scholar]
Associated Data
This section collects any data citations, data availability statements, or supplementary materials included in this article.