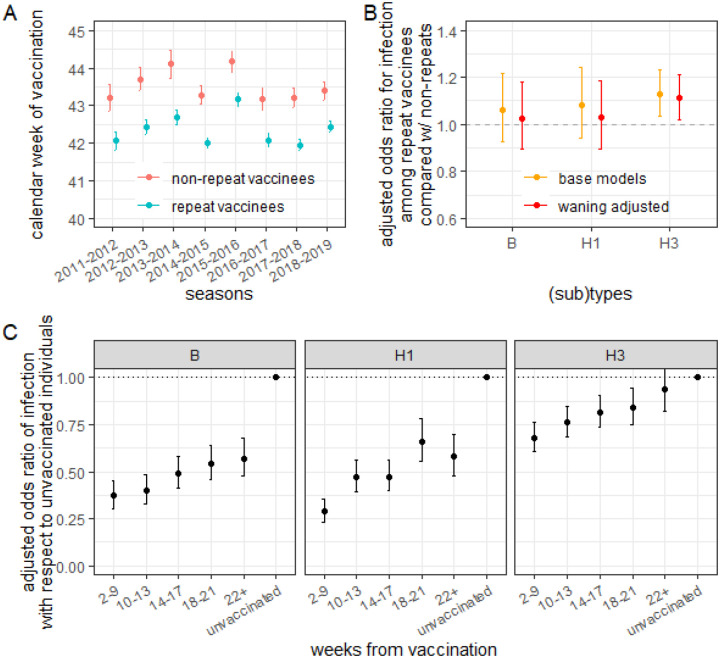
Figure 1: That repeat vaccinees vaccinate earlier in a season, which increases their susceptibility to infection due to waning vaccine protection, does not explain their higher odds of infection compared to non-repeat vaccinees.
A) Average calendar week of vaccination among repeat and non-repeat vaccinees over the study enrollment seasons. Repeat vaccinees consistently get vaccinated earlier than non-repeat vaccinees. B) Adjusted odds ratio for clinical infection among individuals vaccinated this season stratified based on whether the individuals were also vaccinated in the prior season (repeat vaccinees) or not (non-repeat vaccinees) before (yellow) and after (red) adjusting for the timing of vaccination within a season. Site- and season- specific data are shown in SFig 3.3). C) Adjusted odds ratio of clinical infection comparing individuals vaccinated 2–9, 10–13, 14–17, 18–21, and 22+ weeks in the current season (but not in the prevoius season) before testing positive with respect to those not vaccinated in either season. Site- and season-specific data are shown in SFig 3.1 and age specific data are shown in SFig 3.5. See Supplemental Section 3 for detailed definitions of the quantities reported here.

