Abstract
Apolipoproteins measured in plasma or serum are potential biomarkers for assessing metabolic irregularities that are associated with the development of cardiovascular disease (CVD). LC-MS/MS allows quantitative measurement of multiple apolipoproteins in the same sample run. However, the accuracy and precision of the LC-MS/MS measurement depends on the reproducibility of the enzymatic protein digestion step. With the application of an immobilized enzyme reactor (IMER), the reproducibility of the trypsin digestion can be controlled with high precision via flow rate, column volume and temperature. In this report, we demonstrate the application of an integrated IMER-LC-MS/MS platform for the simultaneous quantitative analysis of eight apolipoproteins. Using a dilution series of a characterized serum pool as calibrator, the method was validated by repeated analysis of pooled sera and individual serum samples with a wide range of lipid profiles, all showing intra-assay CV < 4.4% and inter-assay CV < 8%. In addition, the method was compared with traditional homogeneous digestion coupled LC-MS/MS for the quantification of apoA-I and apoB-100. Applied in large scale human population studies, this method can serve the translation of a wider panel of apolipoprotein biomarkers from research to clinical application.
Significance:
Currently, the translation of apolipoprotein biomarkers to clinical application is impaired because of the high cost of large cohort studies using traditional single-analyte immunoassays. The application of on-line tryptic digestion coupled with LC-MS/MS analysis is an effective way to address this problem. In this work we demonstrate a high throughput, multiplexed, automated proteomics workflow for the simultaneous analysis of multiple proteins.
1. Introduction
Lipoproteins are complex multimolecular assemblies that facilitate extracellular lipid transport by interaction with numerous enzymes, cofactors, transporters and cellular membrane receptors [1,2]. Apolipoproteins are functional constituents of lipoproteins. Because of their key role in lipid metabolism, apolipoproteins are potential biomarkers for assessing metabolic irregularities that are associated with the development of cardiovascular disease (CVD), a major public health challenge worldwide.
Two main classes of lipoproteins are high density lipoproteins (HDL) and low density lipoproteins (LDL), which have their structural integrity and basic function provided by two essential apolipoproteins, apoA-I and apoB-100, respectively. The metabolic functions of HDL and LDL are largely mediated by interaction with other exchangeable apolipoproteins [2–5]. The most well characterized of these are A-II [6,7], A-IV [8], C-I [9], C-II [10], C-III [5,11] and E [12].
Currently used clinical assays measuring apolipoproteins in blood rely on antibody selectivity (nephelometry, turbudimetry, radial immunodiffusion, sandwich assays, immunoblotting etc.) with typical drawbacks of cross reactivity and high dose hook effect [13]. An alternative approach to immunoassays is LC-MS/MS quantification. Instead of antibody specificity, LC-MS/MS relies on proteolytic cleavage by trypsin and mass selective detection of unique protein specific peptide sequences (target peptides). The LC-MS/MS peak area of the native target peptide is normalized with the simultaneously detected peak area of an analogous stable isotope labeled internal standard (IS), allowing the calculation of their peak area ratio; also called response ratio or response factor. Calibration is performed by generating a response ratio vs. calibrator concentration curve. The ideal calibrator is a purified recombinant protein. However, synthetic recombinant protein is not always available or usable. A typical example is ApoB-100, which is a large 515 KDa protein. Purified ApoB-100 cannot be solubilized, and therefore an LDL density fraction or serum pool must be used as a calibrator [14].
With in-solution or homogeneous digestion, the entire sample batch is digested at the same time by addition of trypsin to each sample. The in-solution digestion is performed separately, “off-line” from the LC-MS/MS analysis, typically with 2–24 hour incubation times. Common sources of variability and bias are the occurrence of degradation, oxidation, and deamination reactions in the digestion mix. The longer the digestion time, the more likely these reactions can occur. As a solution to these problems, typical off-line LC-MS/MS methods employ protein denaturation, alkylation, reduction, overnight digestion, and solid phase extraction or stable isotope standard capture with anti-peptide antibodies (SISCAPA) [15], leading to labor intensive and time consuming workflows [15–23].
An alternative to off-line digestion is using an immobilized enzyme reactor (IMER), i.e. immobilized trypsin reactor. In this work, we limit the definition of IMER to continuous “plug-flow” reactors where the sample and the IS are injected together into the same autosampler loop, and the injection “plug” is carried through the IMER with a constant flow of digestion buffer. The main advantage of using IMER digestion is that the digestion time ([column volume] / [flow rate]) is short and precisely controlled, enhancing digestion reproducibility and method precision. Furthermore, the on-line coupling of IMER to LC-MS/MS analysis has the potential to greatly simplify quantitative proteomic workflows [24–27].
In this report, we demonstrate the applicability of an integrated IMER-LC-MS/MS platform for quantitative measurement of apolipoproteins in serum. By judicious selection of target peptides, the use of a value assigned serum pool as calibrator, and the addition of stable isotope labeled peptide analogs as IS, patient samples with a wide range of total cholesterol, and total triglyceride levels were analyzed for a series of apolipoproteins (A-I, A-II, A-IV, B-100, C-I, C-II, C-III and E).
2. Materials and methods
2.1. Reagents and chemicals
Tris, ammonium hydroxide, sodium chloride, sodium bicarbonate, HPLC grade water and acetonitrile with 0.1% formic acid were purchased from Fisher Scientific (Fair Lawn, NJ, U.S.A.). Zwittergent 3–12 was purchased from EMD Millipore (Billerica, MA, U.S.A.). Calcium chloride and [Glu1]-Fibrinopeptide were purchased from Sigma-Aldrich (St. Louis, MO, U.S.A.). The IMER column, digestion and wash buffers were obtained from Perfinity Biosciences (West Lafayette, IN, U.S.A.). Protein standard materials, apoA-II, apoC-I, apoC-II and apoC-III were obtained from Academy Bio-Medical (Houston, Texas, U.S.A.). ApoA-IV and apoE were obtained from Novoprotein Scientific (Summit, NJ, U.S.A.). All protein standards were ≥98% pure, based on SDS-PAGE performed by the manufacturer, and were used without further purification. The concentrations of the protein stock solutions prepared from these solid materials were confirmed by amino acid analysis performed by Midwest Bio-Tech. (Fishers, IN, U.S.A.).
2.2. Serum and plasma samples
Five units of frozen human serum or EDTA plasma from deidentified individuals, used for preparation of calibrators and quality controls (QC), were purchased from Interstate Blood Bank (Memphis, TN, U.S.A.). Frozen reference sera used for evaluating method bias, SP1–01 (apoA-1) and SP3–08 (apoB-100), were provided by the Lipid Standardization Program at the Centers for Disease Control and Prevention (Atlanta, GA). Frozen human serum, used for cross-method comparison, was collected from 25 deidentified individuals at Solomon Park Laboratories (Kirkland, WA, USA). All specimens were viral tested. Collection and storage procedures met guidelines described in CLSI document C37-A. All samples were stored frozen at −70 °C and thawed in refrigerator overnight before analysis.
2.3. Preparation of stable isotope labeled peptide internal standards
Labeled synthetic peptides (Table 1) were purchased from Midwest Bio-Tech. (Fishers, IN, U.S.A.); 13C and 15N isotopic enrichment was stated as ≥99%. Chemical purity for all peptides was confirmed in-house by LC-UV. Due to the multitude of analytes and associated cost, labeling occurred predominantly at internal residues, instead of the N-terminal Lys or Arg as is convention. However, only transitions containing the mass shifted residues were selected as quantification and/or qualifier ions. The individual IS peptide stock solutions were prepared with 0.1% formic acid to a nominal concentration of (50 pmol/μL), distributed into 400 μL aliquots and stored at −70 °C. A frozen aliquot of each IS peptide stock solution was sent to Midwest Biotech for amino acid analysis. Pooled IS solutions were prepared using 0.1% formic acid with 1 pmol/μL [Glu1]-Fibrinopeptide and contained between 0.1 and 2 pmol/μL of each labeled peptide to approximately match the native cleavage product peak intensities of 1:100 diluted sera.
Table 1.
Peptide transitions and corresponding isotope labels used for IMER-LC-MS/MS quantification of apolipoproteins.
| Protein | Peptide 1 | Peptide 2 | Peptide 3 |
|---|---|---|---|
| apoA-I | THLAPYSDE[L + 7]R(y8) | ATEHLST[L + 7]SEK(y6) | AKPALED[L + 7]R(y7) |
| apoA-II | EQLTPL[I + 7]K(y5) | - | |
| apoA-IV | LEPYADQL[L+7]R (y6) | LTPYADEF[K + 8] (y6) | - |
| apoB-100 | ATGVLYDY[V+6]NK (y6) | AAIQA[L + 7]R(y5) | TGISPLAL[I + 7]K(y6) |
| apoC-I | TPDVSSA[L + 7]DK(y8) | EWFSETFQ[K + 8] (y6) | - |
| apoC-II | TYLPA[V + 6]DEK(y7) | ESLSSYWESA[K + 8] (y7) | - |
| apoC-III | GWVTDGFSS[L + 7]K(y7) | DALSSVQESQVAQ[Q+ 7]AR (y8) | - |
| apoE | SELEEQLTP[V+6]AEETR (y7) | LQAEAF[Q+7]AR (y7) | - |
2.4. Preparation of serum calibration standards and quality control materials
Serum was chosen to prepare both as the calibrator pool and as QC to match the native matrix of the 25 unknown serum samples to be analyzed. The calibrator pool was prepared from an equal mix of sera collections from four individuals. This pool was vacuum filtered and distributed into 100, 75, 50, 20, and 10 μL aliquots into 2 mL storage vials, using a positive displacement repeater pipette and weighing the mass of each aliquot on an analytical balance for enhanced accuracy and precision. All weighed aliquots were stored at −70 °C until use. A weekly calibration series was prepared by addition of 1500 μL buffer (10 mM NaHCO3, 150 mM NaCl, pH 7.4) to the stored aliquots giving 16, 21, 31, 61, and 151 fold dilutions. The latter four of these were further diluted 10 fold to obtain 210, 310, 610 and 1510 fold dilutions, giving a complete 9 point calibrator series. After dilution, the calibrator series was stored at 4⁰C and discarded after 5 days. Sera collections from three individuals (without pooling) were distributed into 1-mL aliquots and stored at −70 °C until use as quality controls (QC1, QC2, and QC3).
2.5. Sample preparation for analysis
Quality controls and unknown serum samples were diluted 100:1 with buffer containing 10 mM NaHCO3, 150 mM NaCl at pH 7.4. A 100 μL aliquot from each diluted sample was transferred to a 96-well plate. To each well, 50 μL of digest buffer containing 0.45% Zwittergent 3–12 was added. Samples were mixed on a shaker plate at 500 rpm for 5 min, then placed directly into the autosampler at 8 °C for online IMER-LC-MS/MS analysis.
2.6. On-line IMER trypsin digestion and LC-MS/MS analysis
The integrated digestion platform (Perfinity Biosciences) included an autosampler with a 500 μL loop, one quaternary pump, two isocratic pumps, two column oven compartments and four 2-position 10-port valves. The quaternary pump was used for the delivery of the IMER digestion buffer and column regeneration buffer. The two other LC pumps delivered 0.1% FA in water (eluent A) and 0.1% FA in acetonitrile (eluent B) for binary gradient elution.
The sample injection sequence started by drawing 5 μL of IS peptide solution from a reagent vial, followed by drawing 50 μL diluted serum from a 96-well plate. Assuming that a typical human serum sample contains 60–80 g/L of protein, with injection of 50 uL of 1500x–16x diluted calibrator serum pool, the total protein amount injected was between 2 and 250 μg. The IMER (Perfinity trypsin column 2.1 mm × 33 mm) was operated at 50 °C with a 25 μL/min flow rate, giving an injection-plug breakthrough time of 3–4 min (including pre- and post-column tubing). An additional 4 min was allotted to purge the IMER column and connection lines. The unreacted proteins, native cleavage products and internal standards were carried together directly to the trapping column (Halo® C18 4.6 mm × 5 mm, 2.7 μm guard column). After the 8 min digestion period, the trapping column was idled between closed lines while the IMER was regenerated. During the consecutive sample run, native cleavage products and IS peptides from the previous run were eluted from the trapping column to the analytical column (Halo® C18 core shell HPLC column, 2.1 mm × 100 mm, 2.7 μm), while the second trapping column was used for trapping the newly injected sample. The analytical separation was performed at 50 °C with a flow rate of 350 μL/min over a stepwise gradient ranging from 3% to 95% acetonitrile containing 0.1% formic acid (Figs. S2 and S3).
The mass spectrometer was a 6500 QTRAP® (Sciex, Foster City, CA, U.S.A.) operated with a heated electrospray ionization probe in positive ion mode using the following settings: ion spray voltage 5500 V, ion source heater temperature 450 °C, source gas 50 psi, curtain gas 35 psi. The native and the isotopically labeled IS peptide chromatograms were acquired by multiple reaction monitoring (MRM) with unit mass resolution, in scheduled 60 s acquisition windows with a 0.65 s target scan time. Full MRM mass transition tables are summarized in Table S1.
2.7. Other methods
For apoA-I and apoB-100 the serum samples were also analyzed by an off-line tryptic digestion coupled LC-MS/MS method, validated in our laboratory (Supplementary information), using native and isotopically labeled peptide calibrators. The concentrations of the peptide stock solutions used for the off-line digestion method calibration were determined by amino acid analysis in our laboratory [28]. For total cholesterol and total triglyceride measurements, we used a UPLC-MS/MS method developed in our laboratory (Supplementary information).
2.8. Data processing and quantification
Molecular ion masses, product ion masses, and fragmentation potentials were generated using Skyline software version 3.1.0.7382. The raw mass spectrometry data was processed with SCIEX MultiQuant software version 3.0.2. For each peptide precursor ion, two product ions were collected; the product ion with the better signal-to-noise and reproducibility was selected for quantification, while the other was used to calculate product ion ratio for quality control (see Table S1 in Supplementary information). From native peptide vs. corresponding isotope labeled IS analog peak areas, response ratios were calculated. The linear regression calibration curves were calculated with 1/x weighting. In case of multiple target peptides per protein, the reported protein concentrations were calculated as the mean of the concentrations determined based on the individual peptide quantitation ions (Table 1). To note, we routinely use the average of multiple peptides to calculate the reported protein concentration in our laboratory. Once good agreement between two (or more) peptides has been demonstrated, calculation of the peptide-average by protein reduces the possible variation in individual peptide cleavage rates due to differences in protein tertiary structure from sample to sample. Furthermore, by monitoring the ratio of the individual peptide based concentrations helps to identify possible sample specific interferences. A more detailed description of the data processing work flow is presented in Supplementary information.
3. Results and discussion
3.1. Implication of immobilized enzyme kinetics
Because of the heterogeneous nature of the enzyme reaction in the IMER, the amount of peptide collected on the trapping column, as measured by the detected LC-MS/MS signal intensity, is limited by the protein diffusion across the stagnant liquid layer around the porous particles. The driving force of this diffusion, and the digestion rate, is the protein concentration difference on the two sides of the stagnant liquid layer. Because of the high excess of immobilized trypsin/surface area on the porous particles, the protein concentration at the particle surface is always lower than in the bulk mobile phase-side of the stagnant liquid layer. Therefore, the cleavage rate is limited by the concentration of the protein in the injection “plug”, which is determined by the concentration of the protein in the injection solution.
3.2. Selection of target peptides for quantification
The process of peptide screening is important because the on-line digestion is always incomplete, but it needs to be fast to maximize method sensitivity. The rapid cleavage of the target peptides needs to be verified and needs to have a structurally sensible rationalization. Assuming that inside the pores the individual target peptides are cleaved with their unique and independent reaction rates, the pattern of cleavage efficacies along the protein sequence is a fingerprint of the protein structure and its accessibility to trypsin cleavage.
We performed a series of experiments digesting either purified proteins or diluted serum, where we monitored all possible trypsin cleavage products. For each apolipoprotein, an MRM acquisition method was generated by in silico digestion using Skyline software (https://skyline.gs.washington.edu). Dilution series of purified proteins or pooled serum were prepared in a 10–1000 nmol/L concentration range. For each selected transition, LC-MS/MS peak area count vs. protein concentration curves were calculated. Peptides with the highest regression slopes, lowest intercept/slope ratios and R2 values ≥ 0.95 were chosen for quantification. The relative slopes for apoA-I, A-II, A-IV, C-I, C-II, C-III and E are represented by order of peptide sequence position in Fig. 2, where the marker sizes are proportional to the regression slope, relative to the highest value for each protein. In Fig. 3, apoB-100 peptides are shown in a similar format while grouped by structural domains. We observed that 8–12 residue peptides had significantly steeper regression slopes if they contained amino acid side chains with loop propensity (P or G). Consequently, most of the peptides that passed the screening process were from solvent exposed loop regions connecting relatively mobile amphipathic helices, as predicted by structural studies [7–10,29–32].
Fig. 2.
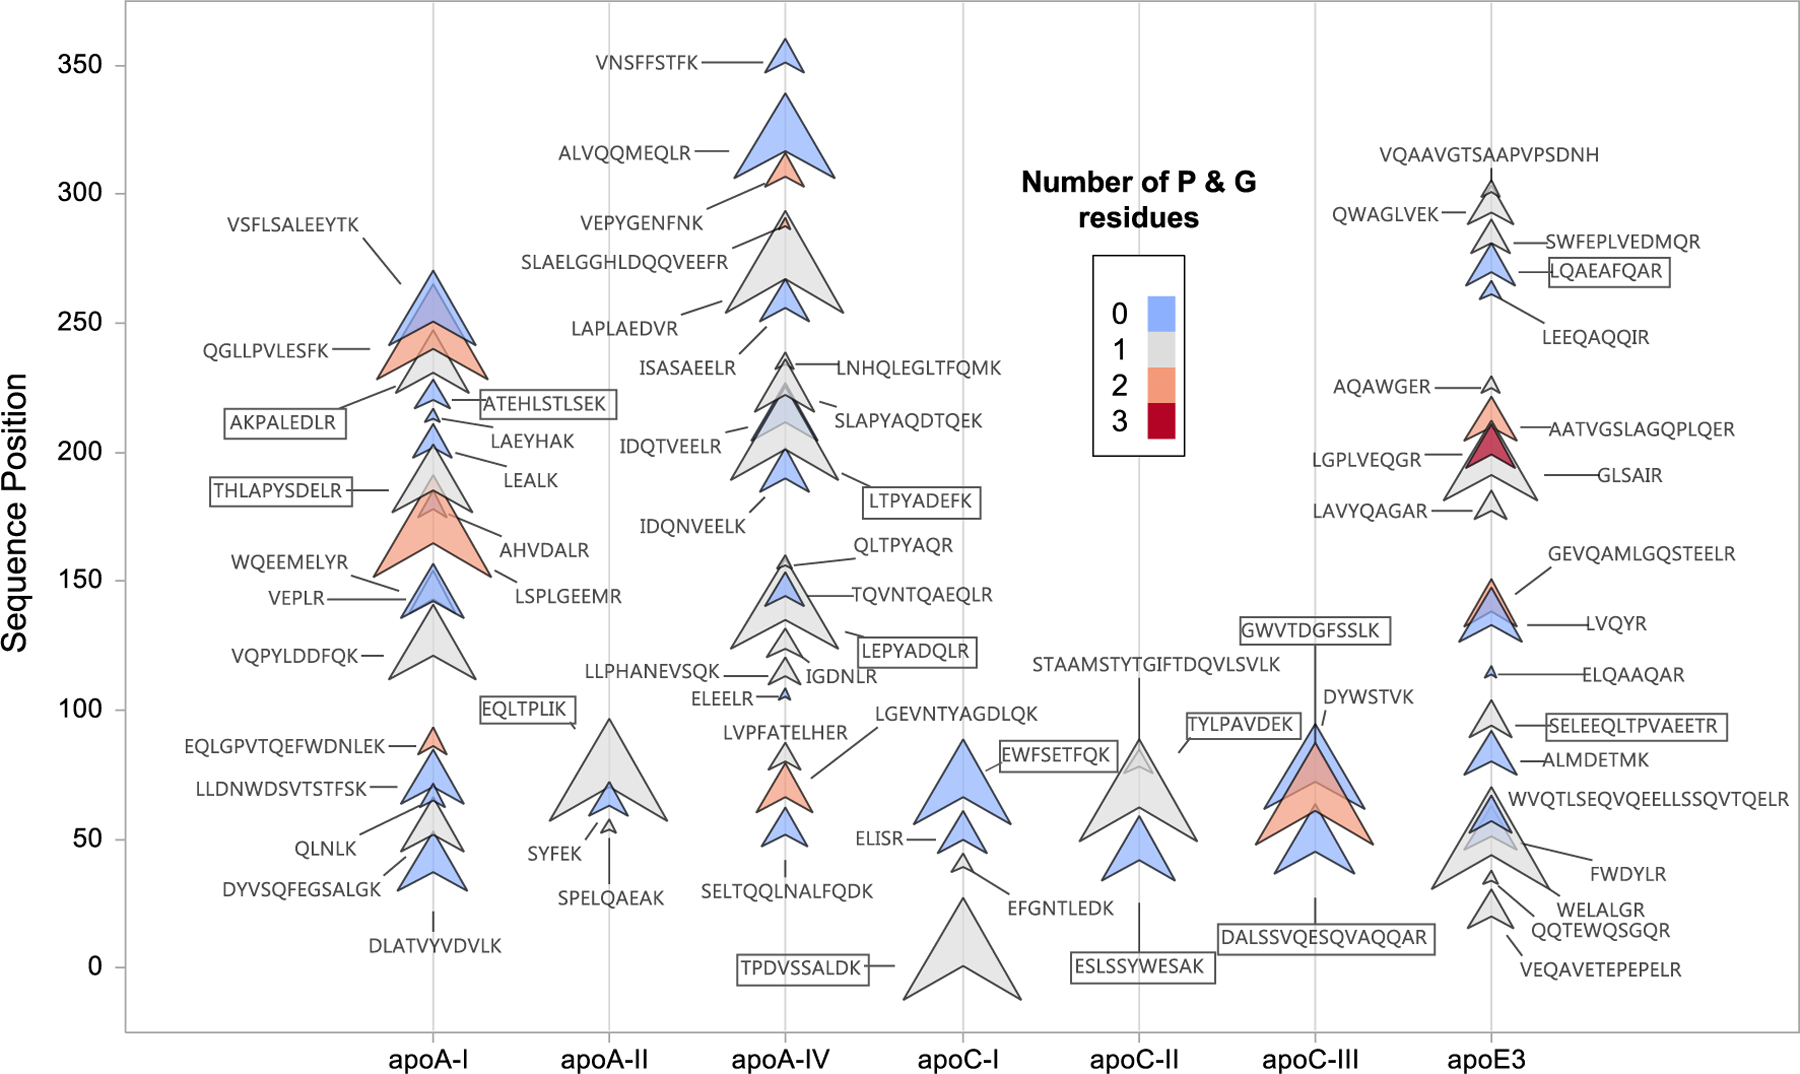
Trypsin releasable peptides of apolipoproteins A-I, A-II, A-IV, C-I, C-II, C-III and E. The size of the markers reflect LC-MS/MS signal area vs. concentration regression slopes. The markers are colored by number of loop inducing (P + G) residues.
Fig. 3.
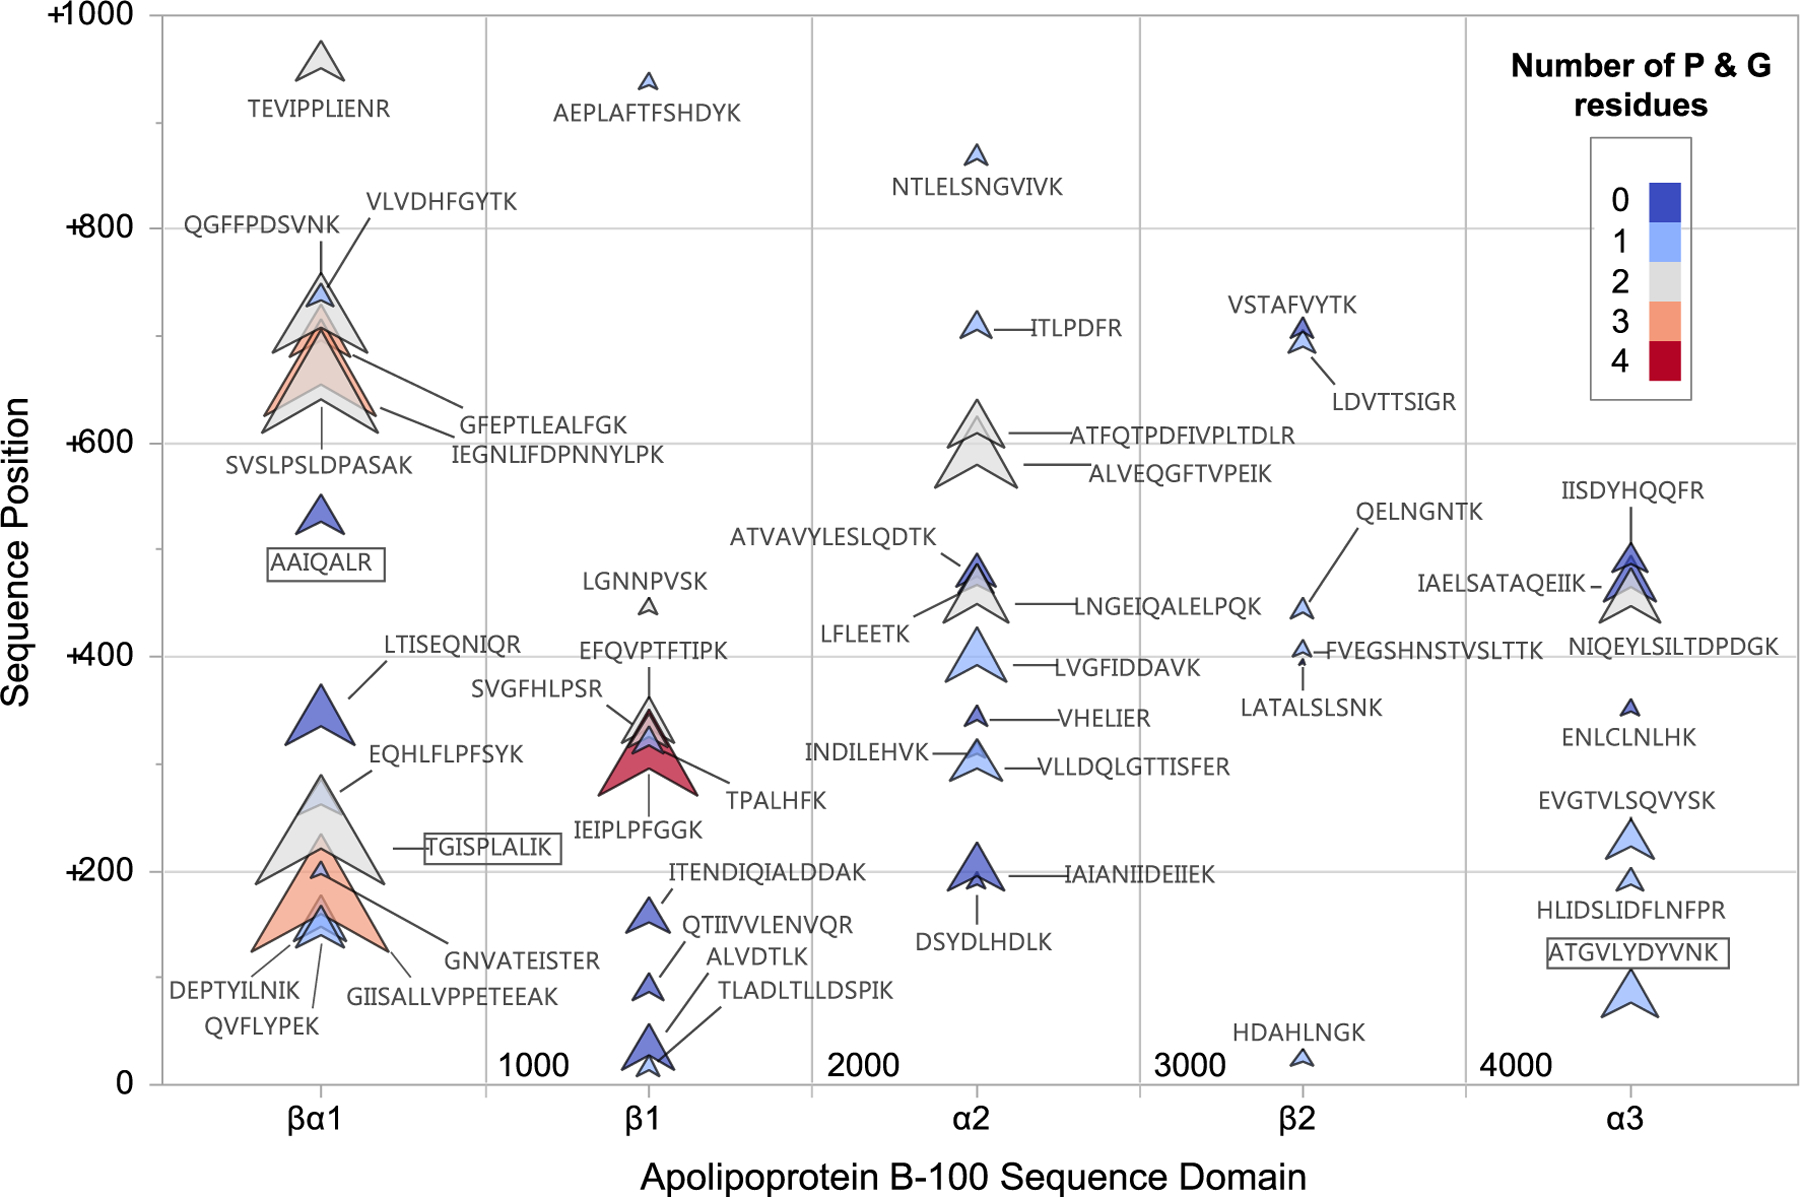
Trypsin releasable peptides of apolipoprotein B-100. The size of the markers reflect LC-MS/MS signal area vs. concentration regression slopes. The markers are colored by number of loop inducing (P + G) residues. The shown peptides exclude sequences containing methionine, passed linear response criteria across a dilution series (R2 ≥ 0.9), and contained between 7 and 16 residues.
For apoA-II, C-I, C-II and C-III, because of their bihelical structure and single prominent loop region [9], only 3 or 4 peptides were detected. The larger proteins, digested in their purified forms, apoA-I, A-IV and E showed numerous peptides to choose from. However, when their lipid bound forms were digested from serum, relatively few peptides passed the desired concentration regression criteria. On published apoA-I structures, our selected peptides are located on helix 6 (THLAPYSDER-185), on helix 8 (ATEHLSTSEK-220) and on helix 9 (AKPALEDR-231). These regions have reduced lipid binding propensity on both discoidal and spherical HDL, consistent with more accessibility for proteolytic cleavage by trypsin [33]. The apoA-IV peptides that passed our screening criteria (LEPYADQLR-135 and LTPYADEFK-201) are located at two mobile loop regions that are involved in the monomer-dimer dynamics of apoA-IV [34]. Of the selected apoE peptides, SELEEQLTPAEETR-94 is located next to the LDL receptor binding N-terminal side of apoE, while LQAEAFAR-269 is located close to the C-terminal, consistent with higher surface exposure for trypsin cleavage [30,35].
The current consensus structure of LDL binding apoB-100 contains five domains: βα1, β1, α2, β2, and α3 [36]. The βα1 domain is the least attached to the lipid particle surface. We selected two peptides for quantification from this domain (TGISPLALK-220 and AAIQAR-526). A unique location on the apoB-100 structure is the beginning of the α3 domain at residue 4050, the following 480 residues turn back toward the β2 domain to form a functionally critical H-bond between residues 3500 and 4369. The matrix exposed sharp elbow of this turn contains ATGVLYDYNK-4077, which was selected as a third peptide for quantification by us, as by others [20].
The final list of peptides selected for quantitative analysis is summarized in Table 1. Because of the short digestion times, the probability for secondary reactions after trypsin cleavage was minimal. Even peptides with tryptophan (W) residues, known for their susceptibility for oxidation still gave acceptable method validation results (apoC-I EWFSETFQK, apoC-II ESLSSYWESAK and apoC-III GWVTDGFSSK).
Finding more than one suitable quantitative peptide for apoA-II was the most challenging. Only one peptide (EQLTPLIK) proved suitable for quantification. Two other peptides were detected in sequential proximity at 54–77: SPELQAEAK, and SYFEK. However, the product ions for both peptides showed relatively low signal-to noise, while SPELQAEAK exhibited poor native/labeled area ratio reproducibility.
3.3. Optimization of digestion conditions
With the original commercial set-up of one trapping column, each sample run required 25 min. During the first half of the injection run, the digestion and trypsin column wash period, the LC-MS/MS system was idle, and during the second half of the run, the LC-MS/MS acquisition the trypsin column was idle. The addition of an extra ten-port valve with 2 trapping columns allowed simultaneous digestion and LC-MS/MS analysis. Each consecutive sample was digested and trapped on one trapping column while the previously digested and trapped sample was eluted from the other trapping column and analyzed by LC-MS/MS. Therefore, except for the first and last sample of the batch, the LC-MS/MS sample throughput is only 12.5 min per sample, thus allowing for the same throughput as an off-line in-solution digestion LC-MS/MS run. We provide the 4 ten-port valve diagram in Supporting information (Fig. S1).
Because protein concentration range, injection volume, digestion buffer flow rate, detergent type, and detergent concentration are strongly interdependent method variables, the optimization was performed by application of a design of experiment (DoE) approach using JMP (SAS) software functions. With calculation of multivariate response surface models for each peptide, the optimization of the IMER conditions was accomplished with the following considerations. Of the detergents tested, Zwittergent 3–12 accelerated the digestion rate the most. The optimal Zwittergent concentration range was found at 0.15–0.2%, near the critical micelle concentration of Zwittergent. The optimal range of flow rate was 25–30 μL/min; minimizing the negative effect on LC-MS/MS signal intensity because of decreased reaction time, but maximizing the efficacy of product removal from the IMER. The optimal range of injection volume was 25–50 μL, by maximizing LC-MS/MS signal intensity at low protein concentration while avoiding the saturation of the IMER at high protein concentration. With these optimal conditions the carryover from the highest calibrator into a blank sample was <0.5% (Fig. S6).
3.4. Characterization of the calibrator pool
The apolipoprotein concentrations in the calibrator serum pool were determined in triplicate analysis by either protein standard addition or external calibration methodologies. For apoA-II, A-IV, C-I, C-II, C-III, and E, standard addition methodology was used with commercially available purified proteins as secondary reference standards (Fig. S5). The protein reference standard solutions were value assigned by amino acid analysis performed at Midwest Bio-Tech., using NIST (U. S. National Institute of Standards and Technology) certified amino acids as primary reference materials. To examine matrix effects the standard addition experiment was performed with a serum pool, plasma pools and buffer matrix (Fig. S5). The relative differences between the response ratio-concentration regression slopes for the plasma vs. serum pool were <7%, and for plasma or serum pool vs. buffer were <8%. An intriguing exception was apoA-II, where a significant matrix effect was observed both for plasma pool vs. buffer (29%) and for serum pool vs. buffer (22%). We hypothesize that this matrix effect was due to unknown protease activity that seems to be apoA-II sequence specific. This hypothesis was supported by the negative curvature for the apoA-II calibration curves, especially at the 2 highest calibration points, i.e. prepared with the highest calibrator-serum-pool:buffer ratio (Fig. S7). We also observed that the analogous stable isotope labeled IS peptide for ApoA-II significantly degraded within 2–4 h when it was spiked into <50× fold diluted serum. For this reason, the IS mix was not spiked into the samples in the 96-well plates; instead the autosampler was programmed to draw the IS mix into the sampling loop from a separate vial immediately prior to the draw of the sample from the 96-well plate (Fig. 1).
Fig. 1.
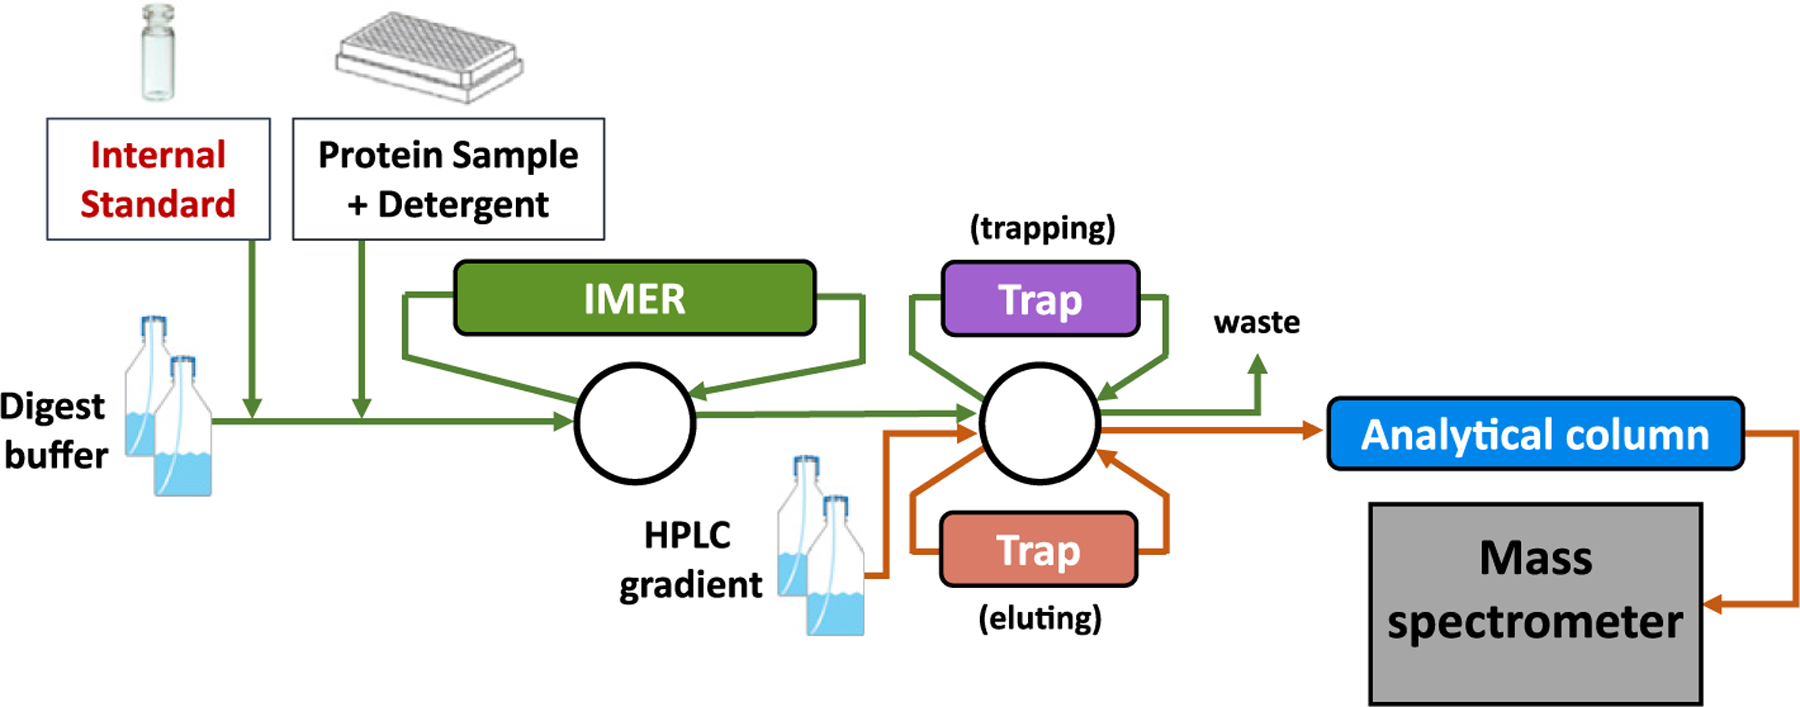
Schematic representation of the integrated IMER trypsin digestion and LC-MS/MS platform.
For apoA-I and apoB-100, being non-exchangeable apolipoproteins with significantly different conformations in free and lipid bound forms, the ApoA-I and ApoB-100 content of the working calibrator serum pool was determined using the dilution series of a value assigned serum pool as a tertiary reference standard. This pool was value assigned by off-line tryptic digestion coupled LC-MS/MS in 24 independent runs, using synthetic peptides as secondary reference standards (Supplementary information). The peptide standards were value assigned by amino acid analysis performed in our laboratory, using NIST certified amino acids as primary reference materials.
3.5. Determination of linear range
A new dilution series of the value assigned calibrator serum pool was prepared on 5 consecutive days, and aliquoted in 96-well plates for analysis. At each dilution level, two injections were made from the same well. At the lower limit of quantification (LLOQ), variations in the measured response ratios were due to low signal-to-noise for the low abundance proteins in the serum calibrator. At the upper limit of quantification (ULOQ), digestion efficacy of the high concentration proteins was limited by the amount of trypsin in the IMER, leading to a nonlinear response. Representative calibration curves for each quantifier ion transition are provided in the supplementary (Fig. S7). The LLOQ and ULOQ for each peptide was determined either by applying ±20% and ±15% tolerance limit on accuracy, respectively, otherwise based on the lowest and highest calibrator concentrations (Table 2). For apoA-II, the two highest calibration points were systematically excluded because of the substantial negative deviation from the linear regression slope. Nonetheless, the R2 correlation was at least 0.99 for all proteins, except for apoA-II (R2 = 0.98).
Table 2.
Limits of quantification in 100× fold diluted serum, limits of reportable concentrations in original serum samples, minimum and maximum concentrations measured in patient samples.
| Protein | Limits of quantification in 100× fold diluted serum (μM) | Reportable range in serum (μM) | Range of reported concentrations in 25 patient samples (μM) | |||
|---|---|---|---|---|---|---|
| LLOQ | ULOQ | Lower limit | Upper limit | Minimum | Maximum | |
| apoA-I | 0.031 | 3.007 | 3.1 | 300.7 | 32.9 | 61.5 |
| apoA-II | 0.065 | 0.65 | 6.5 | 65.0 | 29.0 | 49.7 |
| apoA-IV | 0.002 | 0.054 | 0.2 | 5.4 | 0.4 | 1.7 |
| apoB-100 | 0.003 | 0.126 | 0.3 | 12.6 | 0.8 | 3.2 |
| apoC-I | 0.012 | 0.448 | 1.2 | 44.8 | 2.2 | 10.4 |
| apoC-II | 0.007 | 0.283 | 0.7 | 28.3 | 1.2 | 7.2 |
| apoC-III | 0.017 | 0.248 | 1.7 | 24.8 | 1.4 | 10.5 |
| apoE | 0.002 | 0.084 | 0.2 | 8.4 | 0.4 | 1.6 |
3.6. Reproducibility
Serum from three individuals were distributed into small aliquots and were stored frozen to be used as quality control materials (QC1, QC2 and QC3). Data from quintuplicate sample preparation on 5 days was used to calculate intra-assay and inter-assay variations. Protein concentrations were calculated as the average of measurements based on multiple target peptides (Table 3). The daily intra-assay variations were 1.8–4.4% for all proteins (N = 5), while the overall inter-assay variations were 2.5–8% (N = 25).
Table 3.
Reproducibility of measurements in quality controls, QC1, QC2 and QC3, based on quintuplicate technical replicates over 5 days.
| Protein | Mean protein concentration μM in serum (N = 25) | Intra-day variation %CV (N = 5) | Inter-day variation %CV (N = 25) | ||||||
|---|---|---|---|---|---|---|---|---|---|
| QC1 | QC2 | QC3 | QC1 | QC2 | QC3 | QC1 | QC2 | QC3 | |
| apoA-I | 38.3 | 44.3 | 46.4 | 1.9 | 2.4 | 1.8 | 2.5 | 2.9 | 2.9 |
| apoA-II | 30.9 | 37.5 | 37.4 | 3.7 | 3.9 | 4.3 | 6.3 | 8.0 | 6.6 |
| apoA-IV | 0.7 | 0.6 | 0.9 | 3.5 | 3.6 | 3.1 | 4.2 | 5.2 | 4.4 |
| apoB-100 | 2.0 | 1.2 | 1.8 | 3.3 | 4.2 | 3.6 | 4.1 | 6.2 | 5.4 |
| apoC-I | 4.9 | 4.8 | 11.1 | 2.4 | 3.1 | 3.4 | 3.1 | 4.1 | 4.7 |
| apoC-II | 3.8 | 2.6 | 5.9 | 3.0 | 3.2 | 3.1 | 4.6 | 5.4 | 4.6 |
| apoC-III | 3.4 | 2.5 | 7.1 | 2.2 | 3.7 | 3.0 | 2.9 | 4.7 | 3.8 |
| apoE | 0.9 | 1.3 | 2.2 | 3.1 | 2.7 | 4.4 | 7.0 | 4.7 | 5.0 |
3.7. Evaluation of target peptide agreement
Thirty samples of human sera (25 individual clinical samples and 5 pools) were analyzed for the full panel of apolipoproteins. Deming regression of calculated concentrations based on apoA-I and apoB-100 peptides are presented in Fig. 4. In spite of their very different positions on the apoB-100 sequence, AAIQALR and TGISPLALIK within the βα1 domain correlated well with ATGVLYDYVNK on the α3 domain (slopes of 0.934 and 1.10 and R2 ≥ 0.980), as well as with each other (slope 0.969 and R2 0.982). ApoA-I peptides gave excellent agreement (slopes of 0.984 and 1.024 and R2 ≥ 0.984) while regression plots for apoA-IV, apoC-II and apoC-III showed <10% difference between peptides (Fig. 5). Some exceptions include four samples in which ApoC-I peptides disagreed >10%, indicating sample specific matrix interferences or unknown biological variations. Bland-Altman analysis plots are presented in Supplementary information (Fig. S8).
Fig. 4.
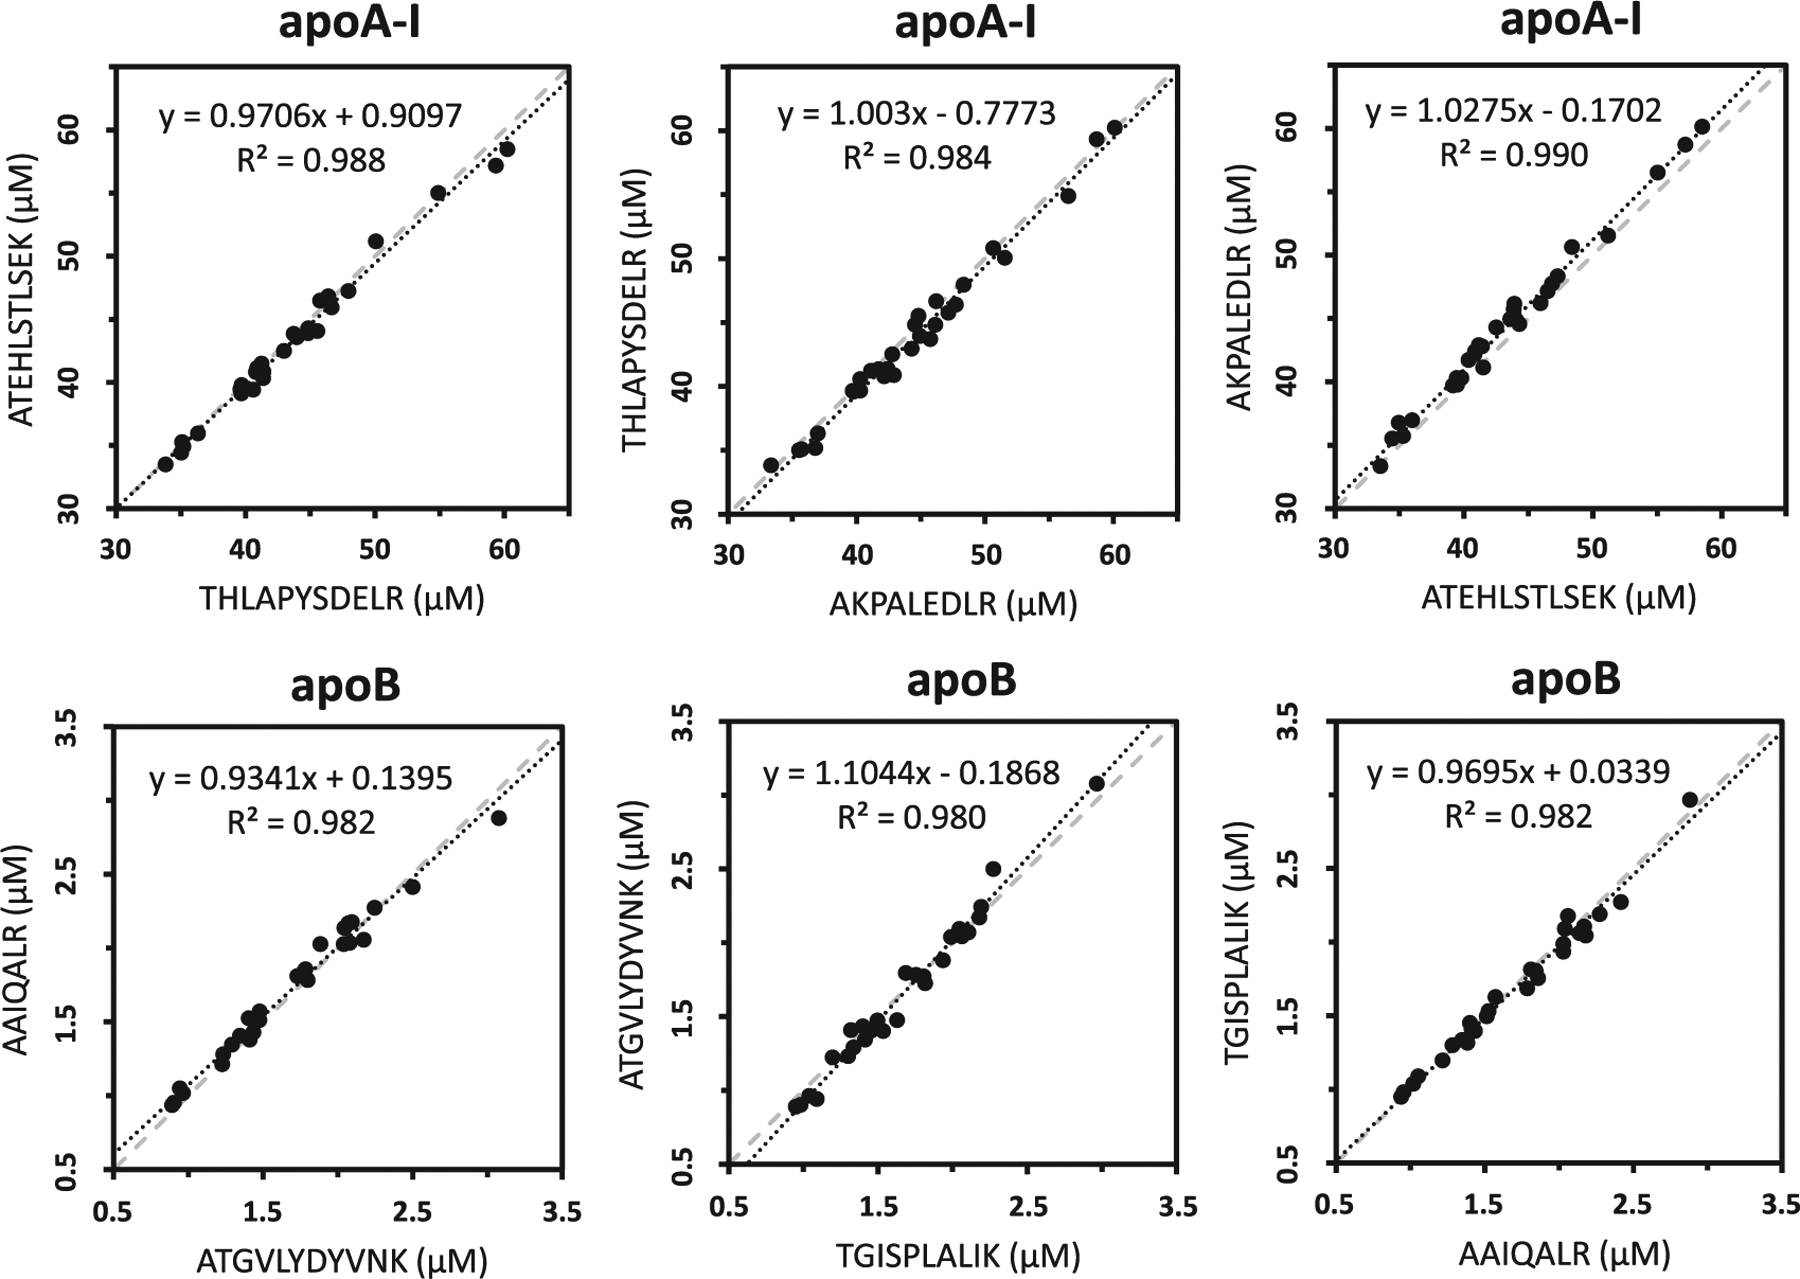
Deming regression comparing the calculated concentrations of three separate peptides of apoA-I and apoB-100 from 30 samples (25 individual clinical samples and 5 pools). Dotted lines represent the orthogonal regression while dashed lines indicate a slope of one.
Fig. 5.
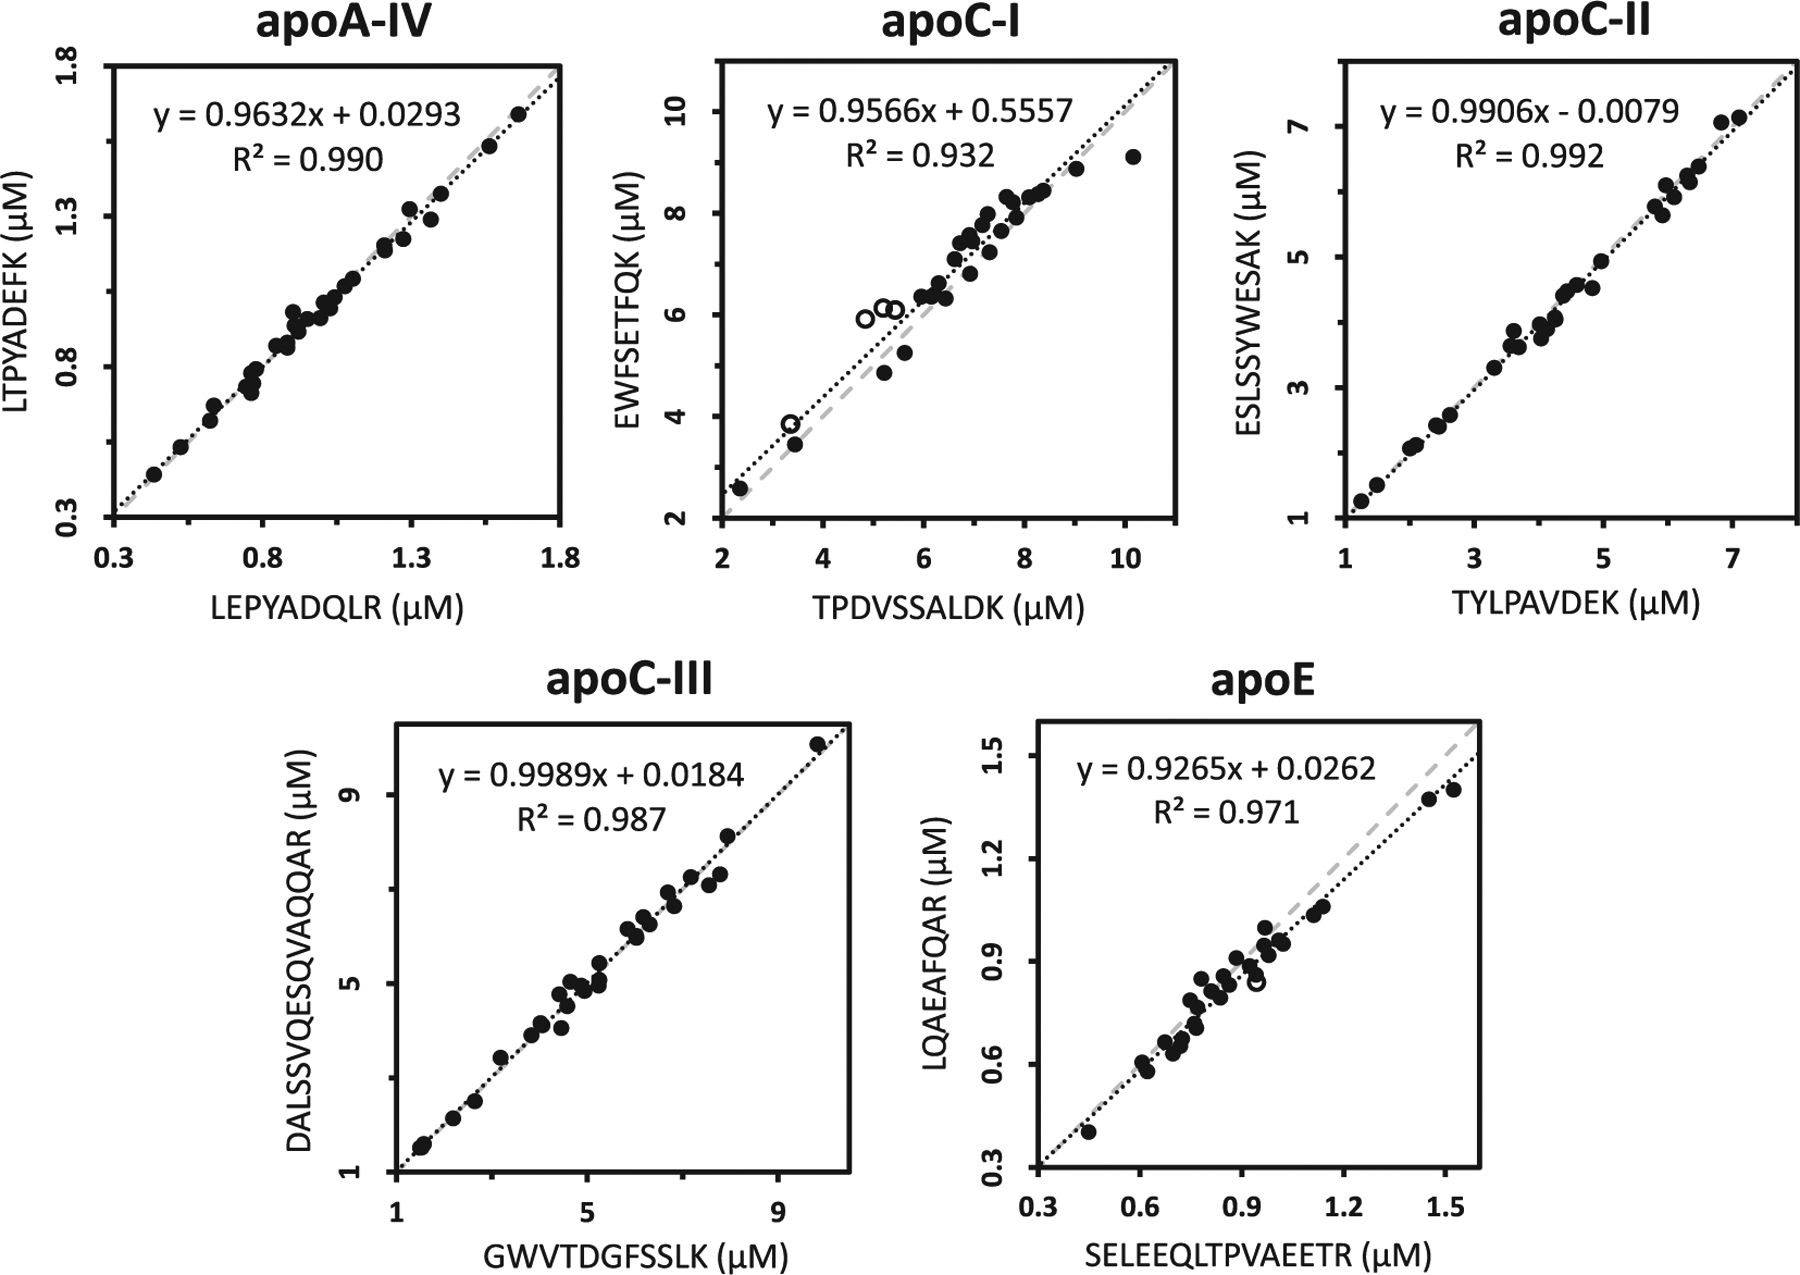
Deming regression comparing the calculated concentrations for multiple peptides of apoA-IV, apoC-I, apoC-II, apoC-III and apoE from 30 samples (25 individual clinical samples and 5 pools). Dotted lines represent the orthogonal regression while dashed lines indicate a slope of one. Empty circles represent samples where peptide measurements diverged by >10%.
3.8. Comparison of IMER vs. off-line digestion coupled LC-MS/MS methods
25 patient samples with a wide range of lipid profiles were analyzed by both on-line and off-line digestion methods in order to assess the agreement between the two methods in the concentration range of unknown samples. The IMER-LC-MS/MS method showed an average of −4.2% difference for apoA-I and +9.9% difference for apoB-100 relative to the off-line LC-MS/MS method (Fig. 6).
Fig. 6.
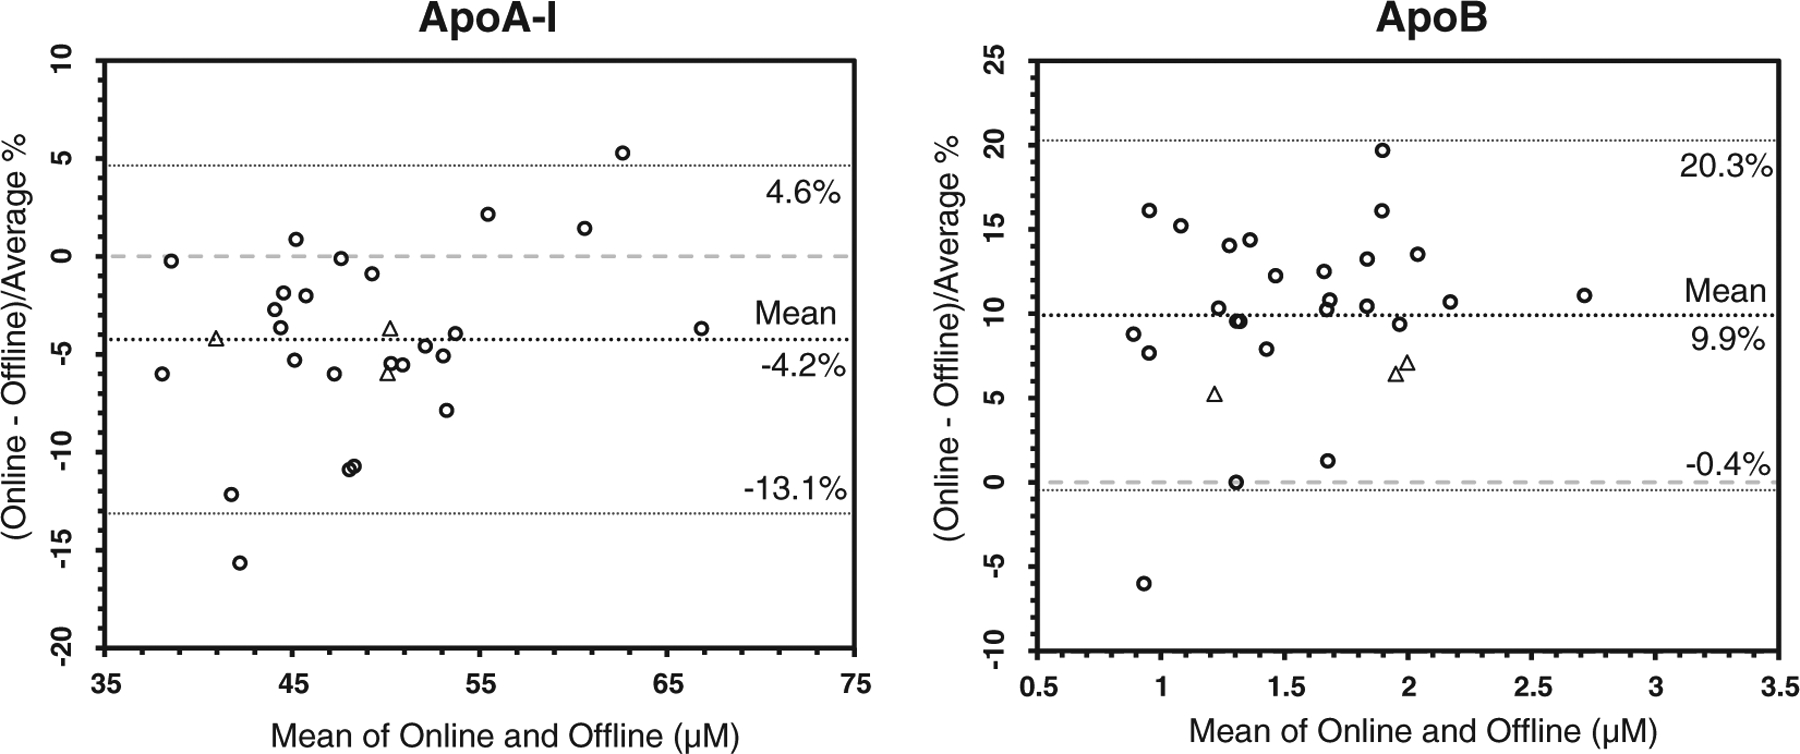
Bland-Altman plots showing % difference for apoA-I and apoB-100 concentrations (μM) measured by IMER-LC-MS/MS and off-line digestion coupled LC-MS/MS, data represents 25 individual patient samples with a wide range of cholesterol and triglyceride levels (○), and 3 pooled serum samples (Δ).
3.9. Evaluation of measurement bias
We acquired World Health Organization (WHO) harmonization standards of apoA-I (SP1–01) and apoB-100 (SP3–08) [14]. The quintuplicate analysis using the IMER-LC-MS/MS method showed 1.6% negative bias (2.6%CV, MW: 28 kDa) relative to the assigned value for apoA-I, and 13.1% negative bias (2.2%CV, MW: 515 kDa) for the apoB-100 harmonization standard. The off-line digestion coupled LC-MS/MS method (traceable to NIST certified amino acid calibrators) also had similar bias of 1% for apoA-I and 12% for apoB-100 relative to the WHO harmonization standards. Therefore, the observed bias originates from the independent calibration of our mass spectrometry based methods vs. harmonized immunoassays.
For the other apolipoproteins, harmonization standards were not available. Measurements in the 25 unknown samples were instead compared with the range of published values by various other authors and methods (Fig. 7) [18,20,37–40]. For most analytes, the values correlated well with previously reported literature data, while mean measurements were 50% lower for apoA-IV and apoC-III. The upper range of the ApoA-IV and ApoC-III values measured in the 25 samples were in the range of literature data. We observed that these relatively high ApoA-IV and ApoC-III levels were measured in hyperlipidemic samples (total cholesterol > 200 mg/dL and total triglyceride > 150 mg/dL).
Fig. 7.
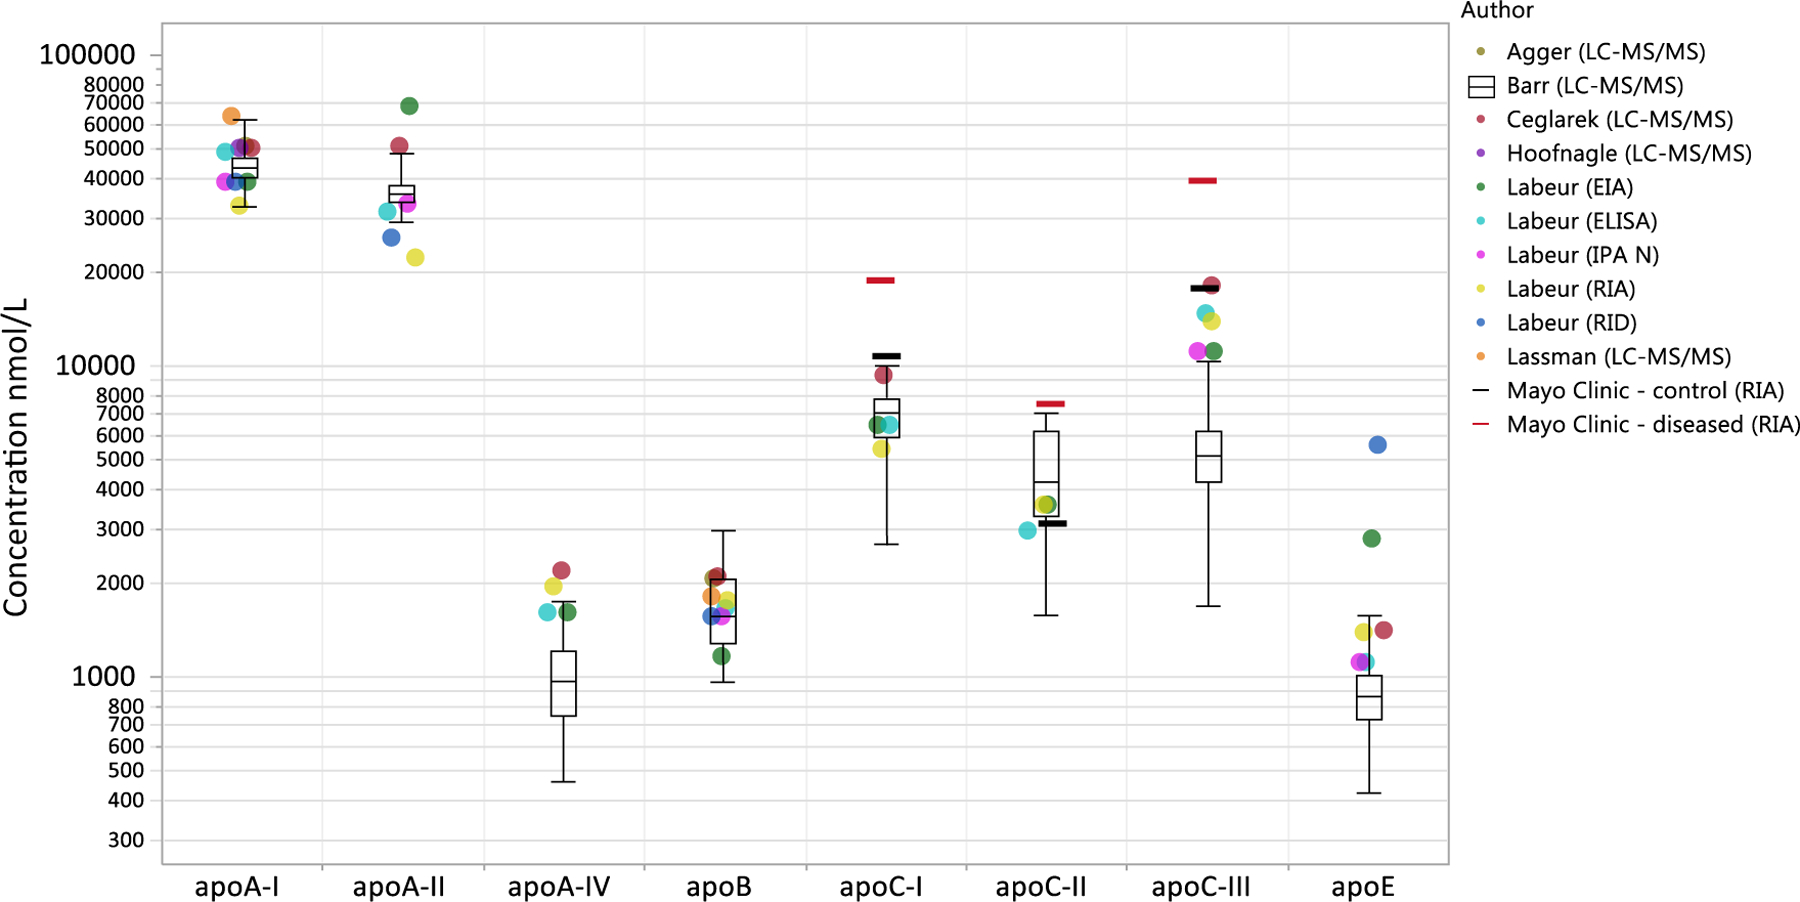
Range of concentrations measured in 25 patient serum samples by the IMER-LC-MS/MS method. The overlaid markers represent concentration means published by other various authors/methods. References: Agger [20], Ceglarek [37], Hoofnagle [38], Labeur [39], Lassman [18] and Mayo Clinic [40].
3.10. Correlations between lipid and apolipoprotein concentrations in patient samples
Total cholesterol and triglyceride measurements were also acquired for the above mentioned 25 patient samples, which provided an opportunity to model total serum lipid levels as a function of apolipoprotein levels using multivariate least squares regression analysis (Fig. 8). The actual vs. predicted correlation for total cholesterol had R2 = 0.89 (p-value < 0.001) and for total triglycerides had R2 = 0.84 (p-value < 0.001). The multivariate regression analysis allows the assessment of the relative strength of correlations between lipid levels vs. individual apolipoprotein levels while correcting for other apolipoprotein levels in serum. Total cholesterol levels showed the most statistically significant correlation with apoB-100 levels (p-value < 0.001), while total triglyceride levels with apoC-III levels (p-value = 0.006). The strong correlation of apoC-III with total triglyceride levels is consistent with its known capability to inhibit both lipoprotein lipase activity and lipoprotein uptake by receptor sites [5,41], extending the circulation time of triglyceride rich lipid particles.
Fig. 8.
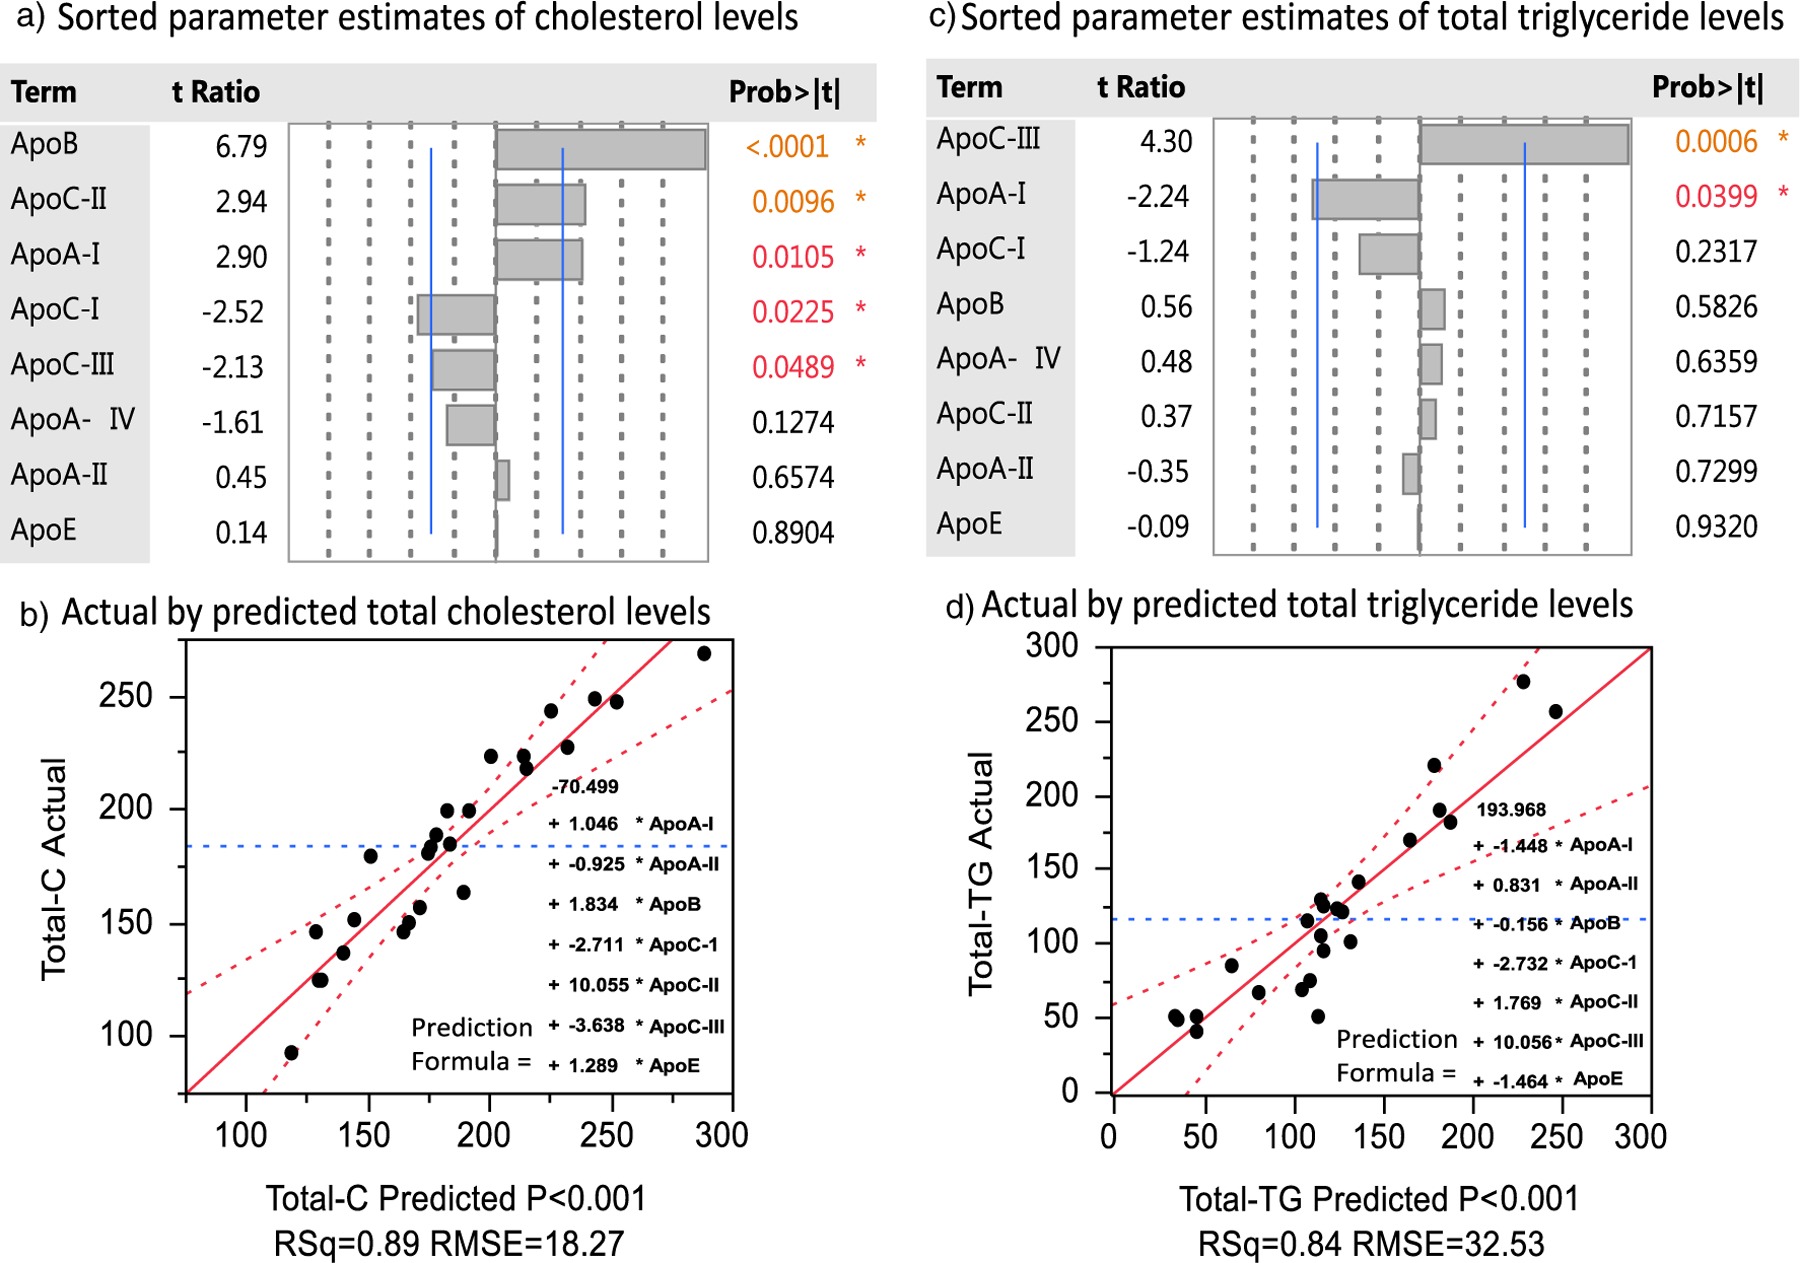
Multivariate standard least square regression modeling of total cholesterol and total triglyceride levels based on triplicate analysis of 25 serum samples. The t-ratio is the ratio of the correlation estimate to its standard error. Prediction formulas shown in corresponding plots.
4. Conclusions
In this report, we showed the application of an integrated on-line trypsin digestion LC-MS/MS platform for multiplexed and high throughput apolipoprotein quantification in serum. Especially with the implementation of the dual trapping column configuration, we find that IMER-LC-MS/MS offers several advantages when compared with in-solution trypsin digestion. 1) Because of the short digestion time, and addition of IS immediately prior to digestion, the problem of peptide degradation (both native and IS) is minimized, thus reducing a major source of method variability and bias. 2) Because degradation due to secondary processes is minimal, target peptides containing tryptophan residues are less of a problem than in the case of in-solution digestion, expanding the number of suitable target peptides per protein. 3) As consequence of 1 and 2, the pre-digestion reduction and alkylation step is not necessary. 4) Several sources of human error are reduced; i.e. pipetting, timing and sample transfers. 5) There are substantial savings in terms of reagent cost, especially trypsin; in our experience, there is about 10 fold less cost in comparison to in-solution digestion. However, there are some disadvantages: 1) Additional LC equipment is required. 2) There is a need for protein calibrators that have to be value assigned by relying on other techniques. 3) There is a narrower range of linear quantification. 4) Carry-over between low and high concentration samples can be more significant. 5) The stability of the samples during the IMER-LC-MS/MS batch run needs to be verified, and monitored with a control sample at the beginning and end of the run. 6) The trypsin column and the trapping columns have to be replaced regularly and the digestion efficacy needs to be monitored with regular system checks; in our laboratory the columns are replaced after ~1000 injections.
The main contribution of this work is the demonstration of a high precision (intra-assay CV < 4.4% and inter-assay CV < 8%) method for quantitating apolipoproteins in serum. The accuracy of the method was assured by using a serum pool calibrator which was determined with traceability to amino acid primary reference materials. Furthermore, analysis of patient samples with wide range of cholesterol and triglyceride levels, coupled with multivariate regression analysis, showed that IMER-LC-MS/MS is an effective tool in revealing links between apolipoproteins and traditional CVD biomarkers. Applied in large scale human population studies, this method can serve the translation of a wider panel of apolipoprotein biomarkers from research to clinical application. In future work, we plan to apply this method to the high throughput, cost effective analysis of lipoprotein sub-fractions collected by size fractionation, which will be presented in a follow up report.
Supplementary Material
Acknowledgements
We thank Dr. Vincent Delatour and co-workers at the Chemistry & Biology Division of the Department Biomedical & Organic Chemist, and Laboratoire national de métrologie et d’essais, Paris, France, for providing the serum samples as part of the BioSITrace cross-platform comparison survey. We also thank Dr. Russ Warnick from Health Diagnostics Laboratory, Inc. (Richmond, VS) and Dr. Don Wiebe from Univ. of Wisconsin Clinical Laboratory for providing samples for method development.
Footnotes
Appendix A. Supplementary data
Supplementary data to this article can be found online at http://dx.doi.org/10.1016/j.jprot.2016.09.011.
Transparency document
The Transparency document associated with this article can be found in the online version.
References
- [1].Ramasamy I, Recent advances in physiological lipoprotein metabolism, Clin. Chem. Lab. Med 52 (2014) 1695–1727. [DOI] [PubMed] [Google Scholar]
- [2].Kwiterovich PO Jr., Diagnosis and management of familial dyslipoproteinemias, Curr. Cardiol. Rep 15 (2013) 371. [DOI] [PubMed] [Google Scholar]
- [3].Alaupovic P, Apolipoprotein composition as the basis for classifying plasma lipoproteins. Characterization of ApoA- and ApoB-containing lipoprotein families, Prog. Lipid Res 30 (1991) 105–138. [DOI] [PubMed] [Google Scholar]
- [4].Sacks FM, The apolipoprotein story, Atheroscler. Suppl 7 (2006) 23–27. [DOI] [PubMed] [Google Scholar]
- [5].Mendivil CO, Rimm EB, Furtado J, Sacks FM, Apolipoprotein E in VLDL and LDL with apolipoprotein C-III is associated with a lower risk of coronary heart disease, J. Am. Heart Assoc 2 (2013). [DOI] [PMC free article] [PubMed] [Google Scholar]
- [6].Bekaert ED, Alaupovic P, Knight-Gibson C, Norum RA, Laux MJ, Ayrault-Jarrier M, Isolation and partial characterization of lipoprotein A-II (LP-A-II) particles of human plasma, Biochim. Biophys. Acta, Lipids Lipid Metab 1126 (1992) 105–13. [DOI] [PubMed] [Google Scholar]
- [7].Gao X, Yuan S, Jayaraman S, Gursky O, Role of apolipoprotein A-II in the structure and remodeling of human high-density lipoprotein (HDL): protein conformational ensemble on HDL, Biochemistry 51 (2012) 4633–4641. [DOI] [PMC free article] [PubMed] [Google Scholar]
- [8].Walker RG, Deng X, Melchior JT, Morris J, Tso P, Jones MK, Segrest JP, Thompson TB, Davidson WS, The structure of human apolipoprotein A-IV as revealed by stable isotope-assisted cross-linking, molecular dynamics, and small angle X-ray scattering, J. Biol. Chem 289 (2014) 5596–5608. [DOI] [PMC free article] [PubMed] [Google Scholar]
- [9].Smith LE, Segrest JP, Davidson WS, Helical domains that mediate lipid solubilization and ABCA1-specific cholesterol efflux in apolipoproteins C-I and A-II, J. Lipid Res 54 (2013) 1939–1948. [DOI] [PMC free article] [PubMed] [Google Scholar]
- [10].MacRaild CA, Howlett GJ, Gooley PR, The structure and interactions of human apolipoprotein C-II in dodecyl phosphocholine, Biochemistry 43 (2004) 8084–8093. [DOI] [PubMed] [Google Scholar]
- [11].Zheng CY, Khoo C, Ikewaki K, Sacks FM, Rapid turnover of apolipoprotein C-III-containing triglyceride-rich lipoproteins contributing to the formation of LDL subfractions, J. Lipid Res 48 (2007) 1190–1203. [DOI] [PubMed] [Google Scholar]
- [12].Phillips MC, Apolipoprotein e isoforms and lipoprotein metabolism, IU BMB Life 66 (2014) 616–623. [DOI] [PubMed] [Google Scholar]
- [13].Hoofnagle AN, Wener MH, The fundamental flaws of immunoassays and potential solutions using tandem mass spectrometry, J. Immunol. Methods 347 (2009) 3–11. [DOI] [PMC free article] [PubMed] [Google Scholar]
- [14].Marcovina SM, Albers JJ, Kennedy H, Mei JV, Henderson LO, Hannon WH, International Federation of Clinical Chemistry standardization project for measurements of apolipoprotein A-I and apolipoprotein-B.4. Comparability of apolipoprotein-B values by use of international reference material, Clin. Chem 40 (1994) 586–592. [PubMed] [Google Scholar]
- [15].van den Broek I, Nouta J, Razavi M, Yip R, Bladergroen MR, Romijn FPHTM, Smit NPM, Drews O, Paape R, Suckau D, Deelder AM, van der Burgt YEM, Pearson TW, Anderson NL, Cobbaert CM, Quantification of serum apolipoproteins A-I and B-100 in clinical samples using an automated SISCAPA-MALDI-TOF-MS workflow, Methods 81 (2015) 74–85. [DOI] [PubMed] [Google Scholar]
- [16].Smit NPM, Romijn FPHTM, van den Broek I, Drijfhout JW, Haex M, van der Laarse A, van der Burgt YEM, Cobbaert CM, Metrological traceability in mass spectrometry-based targeted protein quantitation: a proof-of-principle study for serum apolipoproteins A-I and B100, J. Proteome 109 (2014) 143–161. [DOI] [PubMed] [Google Scholar]
- [17].Switzar L, Giera M, Niessen WMA, Protein digestion: an overview of the available techniques and recent developments, J. Proteome Res 12 (2013) 1067–1077. [DOI] [PubMed] [Google Scholar]
- [18].Lassman ME, McLaughlin TM, Somers EP, Stefanni AC, Chen Z, Murphy BA, Bierilo KK, Flattery AM, Wong KK, Castro-Perez JM, Hubbard BK, Roddy TP, A rapid method for cross-species quantitation of apolipoproteins A1, B48 and B100 in plasma by ultra-performance liquid chromatography/tandem mass spectrometry, Rapid Commun. Mass Spectrom 26 (2012) 101–108. [DOI] [PubMed] [Google Scholar]
- [19].Hoofnagle AN, Becker JO, Oda MN, Cavigiolio G, Mayer P, Vaisar T, Multiple-reaction monitoring-mass spectrometric assays can accurately measure the relative protein abundance in complex mixtures, Clin. Chem 58 (2012) 777–781. [DOI] [PMC free article] [PubMed] [Google Scholar]
- [20].Agger SA, Marney LC, Hoofnagle AN, Simultaneous quantification of apolipoprotein A-I and apolipoprotein B by liquid-chromatography-multiple-reaction-monitoring mass spectrometry, Clin. Chem 56 (2010) 1804–1813. [DOI] [PMC free article] [PubMed] [Google Scholar]
- [21].Kay RG, Gregory B, Grace PB, Pleasance S, The application of ultra-performance liquid chromatography/tandem mass spectrometry to the detection and quantitation of apolipoproteins in human serum, Rapid Commun. Mass Spectrom 21 (2007) 2585–2593. [DOI] [PubMed] [Google Scholar]
- [22].Davidsson P, Hulthe J, Fagerberg B, Olsson BM, Hallberg C, Dahllof B, Camejo G, A proteomic study of the apolipoproteins in LDL subclasses in patients with the metabolic syndrome and type 2 diabetes, J. Lipid Res 46 (2005) 1999–2006. [DOI] [PubMed] [Google Scholar]
- [23].Van Den Broek I, Romijn FPHTM, Smit NPM, Van Der Laarse A, Drijfhout JW, Van Der Burgt YEM, Cobbaert CM, Quantifying protein measurands by peptide measurements: where do errors arise? J. Proteome Res 14 (2015) 928–942. [DOI] [PubMed] [Google Scholar]
- [24].Regnier FE, Kim JH, Accelerating trypsin digestion: the immobilized enzyme reactor, Bioanalysis 6 (2014) 2685–2698. [DOI] [PubMed] [Google Scholar]
- [25].Kim JH, Inerowicz D, Hedrick V, Regnier F, Integrated sample preparation methodology for proteomics: analysis of native proteins, Anal. Chem 85 (2013) 8039–8045. [DOI] [PubMed] [Google Scholar]
- [26].Nicoli R, Rudaz S, Stella C, Veuthey JL, Trypsin immobilization on an ethylenediamine-based monolithic minidisk for rapid on-line peptide mass finger-printing studies, J. Chromatogr. A 1216 (2009) 2695–2699. [DOI] [PubMed] [Google Scholar]
- [27].Lim LW, Tomatsu M, Takeuchi T, Development of an on-line immobilized-enzyme reversed-phase HPLC method for protein digestion and peptide separation, Anal. Bioanal. Chem 386 (2006) 614–620. [DOI] [PubMed] [Google Scholar]
- [28].Woolfitt AR, Solano MI, Williams TL, Pirkle JL, Barr JR, Amino acid analysis of peptides using isobaric-tagged isotope dilution LC-MS/MS, Anal. Chem 81 (2009) 3979–3985. [DOI] [PubMed] [Google Scholar]
- [29].Silva GRAD, Tubb MR, Davidson SW, Apolipoprotein A-I structure in high-density lipoproteins, Ann. Med 40 (2008) 5–13. [Google Scholar]
- [30].Frieden C, Garai K, Concerning the structure of apoE, Protein Sci 22 (2013) 1820–1825. [DOI] [PMC free article] [PubMed] [Google Scholar]
- [31].Wu ZP, Gogonea V, Lee X, May RP, Pipich V, Wagner MA, Undurti A, Tallant TC, Baleanu-Gogonea C, Charlton F, Ioffe A, DiDonato JA, Rye KA, Hazen SL, The low resolution structure of ApoA1 in spherical high density lipoprotein revealed by small angle neutron scattering, J. Biol. Chem 286 (2011) 14. [DOI] [PMC free article] [PubMed] [Google Scholar]
- [32].Davidson WS, Thompson TB, The structure of apolipoprotein A-I in high density lipoproteins, J. Biol. Chem 282 (2007) 22249–22253. [DOI] [PubMed] [Google Scholar]
- [33].Gu F, Jones MK, Chen J, Patterson JC, Catte A, Jerome WG, Li L, Segrest JP, Structures of discoidal high density lipoproteins: a combined computational-experimental approach, J. Biol. Chem 285 (2010) 4652–4665. [DOI] [PMC free article] [PubMed] [Google Scholar]
- [34].Deng X, Morris J, Dressmen J, Tubb MR, Tso P, Jerome WG, Davidson WS, Thompson TB, The structure of dimeric apolipoprotein A-IV and its mechanism of self-association, Structure 20 (2012) 767–779. [DOI] [PMC free article] [PubMed] [Google Scholar]
- [35].Chen J, Li Q, Wang J, Topology of human apolipoprotein E3 uniquely regulates its diverse biological functions, Proc. Natl. Acad. Sci. U. S. A 108 (2011) 14813–14818. [DOI] [PMC free article] [PubMed] [Google Scholar]
- [36].Segrest JP, Jones MK, De Loof H, Dashti N, Structure of apolipoprotein B-100 in low density lipoproteins, J. Lipid Res 42 (2001) 1346–1367. [PubMed] [Google Scholar]
- [37].Ceglarek U, Dittrich J, Becker S, Baumann F, Kortz L, Thiery J, Quantification of seven apolipoproteins in human plasma by proteotypic peptides using fast LC-MS/MS, Proteomics Clin. Appl 7 (2013) 794–801. [DOI] [PubMed] [Google Scholar]
- [38].Hoofnagle AN, Wu M, Gosmanova AK, Becker JO, Wijsman EM, Brunzell JD, Kahn SE, Knopp RH, Lyons TJ, Heinecke JW, Low clusterin levels in high-density lipoprotein associate with insulin resistance, obesity, and dyslipoproteinemia, Arterioscler. Thromb. Vasc. Biol 30 (2010) 2528–2534. [DOI] [PMC free article] [PubMed] [Google Scholar]
- [39].Labeur C, Shepherd J, Rosseneu M, Immunological assays of apolipoproteins in plasma: methods and instrumentation, Clin. Chem 36 (1990) 591–597. [PubMed] [Google Scholar]
- [40].Bren ND, Rastogi A, Kottke BA, Quantification of human plasma apolipoproteins C-I, C-II, and C-III by radioimmunoassays, Mayo Clin. Proc 68 (1993) 657–664. [DOI] [PubMed] [Google Scholar]
- [41].Larsson M, Vorrsjo E, Talmud P, Lookene A, Olivecrona G, Apolipoproteins C-I and C-III inhibit lipoprotein lipase activity by displacement of the enzyme from lipid droplets, J. Biol. Chem 288 (2013) 33997–34008. [DOI] [PMC free article] [PubMed] [Google Scholar]
Associated Data
This section collects any data citations, data availability statements, or supplementary materials included in this article.


