

Abstract
Purpose:
Heritable pathogenic variants in the DNA mismatch repair (MMR) pathway cause Lynch syndrome, a condition that significantly increases risk of colorectal and other cancers. At least half of individuals tested using gene panel sequencing have a variant of uncertain significance or no variant identified leading to no diagnosis. To fill this diagnostic gap, we developed Cancer Risk C (CR-C), a flow variant assay test.
Methods:
In response to treatment with an alkylating agent, individual assays of the nuclear translocation of MLH1, MSH2, BARD1, PMS2, and BRCA2 proteins and the nuclear phosphorylation of the ATM and ATR proteins distinguished pathogenic/likely pathogenic (P/LP) from benign/likely benign variants in MMR genes.
Results:
A risk classification score based on MLH1, MSH2, and ATR assays was 100% sensitive and 98% specific. Causality of MMR P/LP variants was shown through gene editing and rescue. In individuals with suspected Lynch syndrome but no P/LP, CR-C identified most (73%) as having germline MMR defects. Direct comparison of CR-C on matched blood samples and lymphoblastoid cell lines yielded comparable results (r2 > 0.9).
Conclusion:
For identifying germline MMR defects, CR-C provides augmentation to traditional panel sequencing through greater accuracy, shorter turnaround time (48 hours), and performance on blood with minimal sample handling.
Keywords: Colorectal cancer, Functional genomics, Genetic testing, Lynch syndrome, Variant of uncertain significance
Introduction
Lynch syndrome (LS), also known as hereditary nonpolyposis colorectal cancer, is the most common hereditary cause of colorectal cancer, accounting for up to 80% of the hereditary form of this disease.1 LS is caused by autosomal dominant heterozygous germline pathogenic variants in 1 of 4 mismatch repair (MMR) genes namely MLH1, MSH2, MSH6, and PMS2 or deletion of EPCAM gene.2 The current National Comprehensive Cancer Network (NCCN) guidelines for diagnosis and treatment of LS recommend testing for familial variants in these genes.3 If familial testing has not been performed, cancer gene panel testing is recommended for those who fulfill the Amsterdam II “3-2-1” criteria (3 affected members, 2 generations, 1 aged <50 years), have presence of microsatellite instability, or negative staining in immunohistochemistry (IHC) for MMR proteins in tumors.2 If a pathogenic/likely pathogenic (P/LP) variant is identified in an individual, the family undergoes predictive testing for this variant. If positive, the individual is recommended to undergo cancer screening through colonoscopy and other preventative management.4 Those identified with P/LP MMR variants have a lifetime risk of 50% to 80% of developing colorectal cancer.5 Of those who meet Amsterdam II criteria and are tested using gene panel sequencing, only 27% have P/LP variants and 20% to 40% have variants of uncertain significance (VUS), leaving the patients with uncertainty about their diagnosis of LS and risk of cancer.6 Functional genomic tests can fill the annotation gaps and, potentially, serve as standalone tests for genetic diagnostics. Flow cytometry-based functional variant assays (FVAs) were developed to observe the biological effects of heterozygous variants in genes that disrupt genetic pathways. FVAs use fluorescently labeled anti-bodies/markers and flow cytometry to measure functional protein changes, such as protein–protein interaction and nuclear transport and/or secondary modifications of proteins, such as phosphorylation. FVAs were first used to test variants in MAP3K1 in individuals with 46,XY gonadal dysgenesis for gain of function in the gene.7 Cancer Risk B (CR-B), the first FVA test for hereditary cancer risk, evaluated whether P/LP variants in BRCA1, BRCA2, and other genes altered functional activities in the double stranded break repair (DSBR) pathway. CR-B was highly sensitive and specific for diagnosing hereditary breast and ovarian cancer syndrome and served as the impetus for developing new FVA tests for other hereditary cancer syndromes.8,9
In this article, we describe the development of Cancer Risk C (CR-C), a novel FVA test that identifies MMR defects with high specificity and sensitivity in patient-derived B-lymphoblastoid cell lines (LCLs), patient-derived peripheral blood mononuclear cells (PBMCs), and edited cells. The FVA test is based on how a human cell mounts a repair response to mismatch DNA damage caused by an alkylating agent. CR-C measures functional activities in the MMR pathway, specifically nuclear translocation of repair proteins (ie, MLH1 and MSH2) and modifications of DNA damage-sensing kinases (ie, ATR and ATM10,11). Combining multiple FVAs using logistic regression resulted in a risk classification score (RCS) that identifies MMR defects. When applied to cells derived from subjects with either heterozygous P/LP or benign/likely benign (B/LB) variants in MMR genes, this test showed high specificity and sensitivity for identifying MMR defects. The test could also identify germline MMR defects in LCLs from subjects with a germline VUS and microsatellite instability-high (MSI-H) tumor. If clinically validated in future studies, CR-C could act as a test for patients who fulfill the Amsterdam II (or similar) criteria or have MSI-H tumor and/or tumors without MMR proteins measured through IHC, thereby determining which NCCN management guidelines to follow.
Materials and Methods
LCLs and PBMCs
LCLs were provided by the Colon Cancer Family Registry (CCFR). LCLs were derived from 180 individual patient samples that were recruited at Mount Sinai Hospital/Lunenfeld-Tanenbaum Research Institute, Toronto; Fred Hutchinson Cancer Research Center, Seattle; and Mayo Clinic, Phoenix. Patient recruitment, Sanger sequencing or next generation sequencing, tumor genetic testing, and transformation to LCLs were done before this study. In addition to LCLs, CCFR provided de-identified information.12–14 Variant classification and nomenclature were determined using the InSiGHT colon cancer gene variant database (http://www.insight-group.org/mutations). The subjects were assigned into 3 groups: group 1 had MSI-H colorectal cancer and a known P/LP variant in 1 of the MMR genes: MLH1, MSH2, MSH6, and PMS2; group 2 had significant family histories of colorectal cancer, a VUS classified by ClinVar, and/or colorectal cancer that was MSI-H and/or had loss of MMR proteins (measured through IHC), but were not positive for MLH1 hypermethylation or BRAF(V600E) variant; and group 3 were family members of known heterozygote individuals with P/LP variants in MMR genes who themselves do not carry the variant, included both first- and second-degree relatives.
From the original 180 individual patient samples, 2 cohorts were developed: a discovery cohort to develop the assays (containing 20 group 1 and 20 group 3 individual subjects) and a larger replication cohort to confirm sensitivity and specificity and measure prevalence of germline MMR deficiency among patients with VUS (containing 40 group 1, 60 group 2, and 40 group 3 individuals). LCLs were stored in liquid nitrogen and expanded in RPMI media (Sigma Aldrich #724000) containing 20% fetal bovine serum (Peak Serum #PSFB-4) and 10% penicillin/streptomycin (Gibco #15140). To assess an appropriate nontoxic dose of methylnitroni-trosoguanidine (MNNG), LCL cells from patients with B/LB variants in MMR genes were treated with 25 to 100 μM MNNG applied into the media for 48 hours.
During this study, another cohort of 24 subjects was recruited from Montefiore Medical Center under approval from the Albert Einstein College of Medicine Institutional Review Board to collect blood samples for translating the test from LCL to whole blood cells. All subjects were aged >18 years, had traditional cancer gene panel sequencing, and provided informed consent for de-identified CR-C testing and limited information sharing. The information shared were age, personal cancer diagnosis (either LS or non-LS related) and treatment, family history of cancer (either LS or non-LS related), and results of cancer gene panel tests. PBMCs from these individuals were transformed to LCLs to compare performance of FVAs for these 2 cell types. MMR response was induced in both LCL and PBMC cells using nontoxic concentrations of MNNG (50μl) and incubated for a 24-hour period. Cells were then fixed using 35% paraformaldehyde (Sigma #F1635) and permeabilized using methanol (Sigma #34860).
Edited cells
MLH1, MSH2, MSH6, or PMS2 genes in HEK293 cells were edited with known B/LB or P/LP variants using a CRISPR/Cas9 method for mammalian cells that has been previously developed by Integrated DNA Technologies.15–17
On-target was confirmed through DNA sequencing. Cells were grown under similar conditions as LCLs and MMR response was induced as described earlier.
Flow variant assays
The following antibodies were tested: anti-MLH1 (Abcam #ab251576), anti-MSH2 (Abcam #ab228334), anti-ATM (Abcam #ab224947), anti-phospho ATM (Abcam #ab208775), anti-ATR (Abcam #ab54793), anti-phospho ATR (Abcam #ab230831) anti-PMS2 (Abcam #ab214442), anti-BARD1 (Abcam #ab226854), anti-BRCA2 (Proteintech #67285), anti-BRCA1 (Abcam #ab215988), anti-P53 (Proteintech #60283), and anti-phospho P53 (Abcam #ab223868). Flow cytometry was performed using the strategy that is previously described.9 In brief, cells were partially lysed and treated with antibodies conjugated to fluorochromes. DAPI (Thermo Fisher Scientific #62248) was used as a DNA marker and presence of S6 ribosomal protein (Life Techologies #710405) was used as a marker for intact whole cells. Cell concentration was 100 to 500 cells per μl and antibody concentration was 0.001 μg/μl. Operator was blinded to the genetic background of samples when conducting FVAs.
Gene rescue
Expression plasmids for MLH1 (Origene #RG201607), MSH2 (Origene #RG205848), MSH6 (Origene #RC202469), and PMS2 (Origene #RC210880) complementary DNAs (cDNAs) were used to transfect edited HEK 293 cells with MLH1, MSH2, MSH6, and PMS2 edits. The constructs without cDNA inserts were used for sham transfection to show specificity of the rescue. The LifeTech Neon Transfection (Thermo Fisher Scientific) system was used following the recommendations of the manufacturer. The efficiency of transfection was gauged by the number of cells expressing the in-frame reporter (GFP, SBP, or Flag-His). After transfection, the cells were treated according to the standard CR-C protocol, then assessed using flow cytometry with CR-C parameters.
Data analysis
Data are presented as mean ± SEM values. The exact value of the sample size (n) represents individual biological replicates. FVAs for each sample was performed with 3 technical replicates. GraphPad Prism 6 and Microsoft Excel 2019 were used for all statistical analyses. Cohort sample sizes were predetermined by power calculation. Normality was evaluated using the Kolomogorov-Smirnov test. For normally distributed data, t test was used to compare 2 groups and 1-way analysis of variance followed by Bonferroni post hoc test for >2 groups. RCS was developed by fitting a logistic regression model of MLH1, MSH2, and ATR FVA assays based on group 1 (n = 20) and group 3 (n = 20) from the discovery cohort. This model was applied to the FVA assays from the remaining group 1 (n = 40) and group 3 (n = 40) subjects to obtain RCS for the replication cohort. It was also applied to the group 2 subjects (n = 60). Subjects with P/LP MMR variants had a positive RCS, whereas those with B/LB had a negative RCS. Sensitivity was calculated as the percentage of subjects with a P/LP variant in any of the MMR genes who had a positive RCS. Specificity was calculated as the percentage of subjects without the family P/LP MMR variant who had a negative CRS. It was found that 95% CIs of the sensitivity and specificity were exact binomial CIs calculated using StataSE (StataCorp).
Results
Selecting a dose of alkylating agents that is not toxic to cell lines
Alkylating agents, such as MNNG, can induce mismatches by forming O4-methylguanine adducts.18 Alkylating agents are known to be toxic to normal cells, whereas cells with deficiencies in the MMR pathway are resistant to MNNG toxicity. The concentration of 50 μM MNNG was identified as the highest dose that was not significantly toxic when treating cells for up to 48 hours (Supplemental Figure 1, n = 3). Another alkylating agent, Diazald, was also tested on the same set of cells and showed similar survival when treated with up to 25 μM of Diazald for 48 hours (data not shown).
CR-C, an FVA test, identifies germline defects in the MMR pathway with high sensitivity and specificity
A discovery cohort was established from subjects from the CCFR, which included 20 participants with a known P/LP variant in 1 of the MMR genes, namely MLH1, MSH2, MSH6, and PMS2 (group 1 positive controls), and 20 family members of heterozygote individuals with P/LP variants in MMR genes who themselves do not carry the variant (group 3 negative controls; Supplemental Table 1). Nuclear translocation of proteins involved in MMR pathway and kinase-dependent signaling from the site of damage in the nucleus are features of a functioning MMR pathway and provided targets for developing a test. After the MNNG treatment of LCLs derived from subjects in the discovery cohort, MMR proteins showed a significant increase in nuclear translocation of MLH1 (P = .008), MSH2 (P = .001), BARD1 (P = .003), and PMS2 (P = .002) in group 1 compared with group 3 (Figure 1A–D). FANCD2, MDM2, PALB2, and RAD51, did not show changes in nuclear translocation between groups 1 and 3 (Supplemental Table 2; P > .05). ATR (P = .0001) and ATM (P = .028) phosphorylation in the nucleus also showed significant increases in group 1 subjects compared with group 3 subjects (Figure 1E and F).
Figure 1. Development of CR-C based on systematic evaluation of FVAs in discovery cohort.
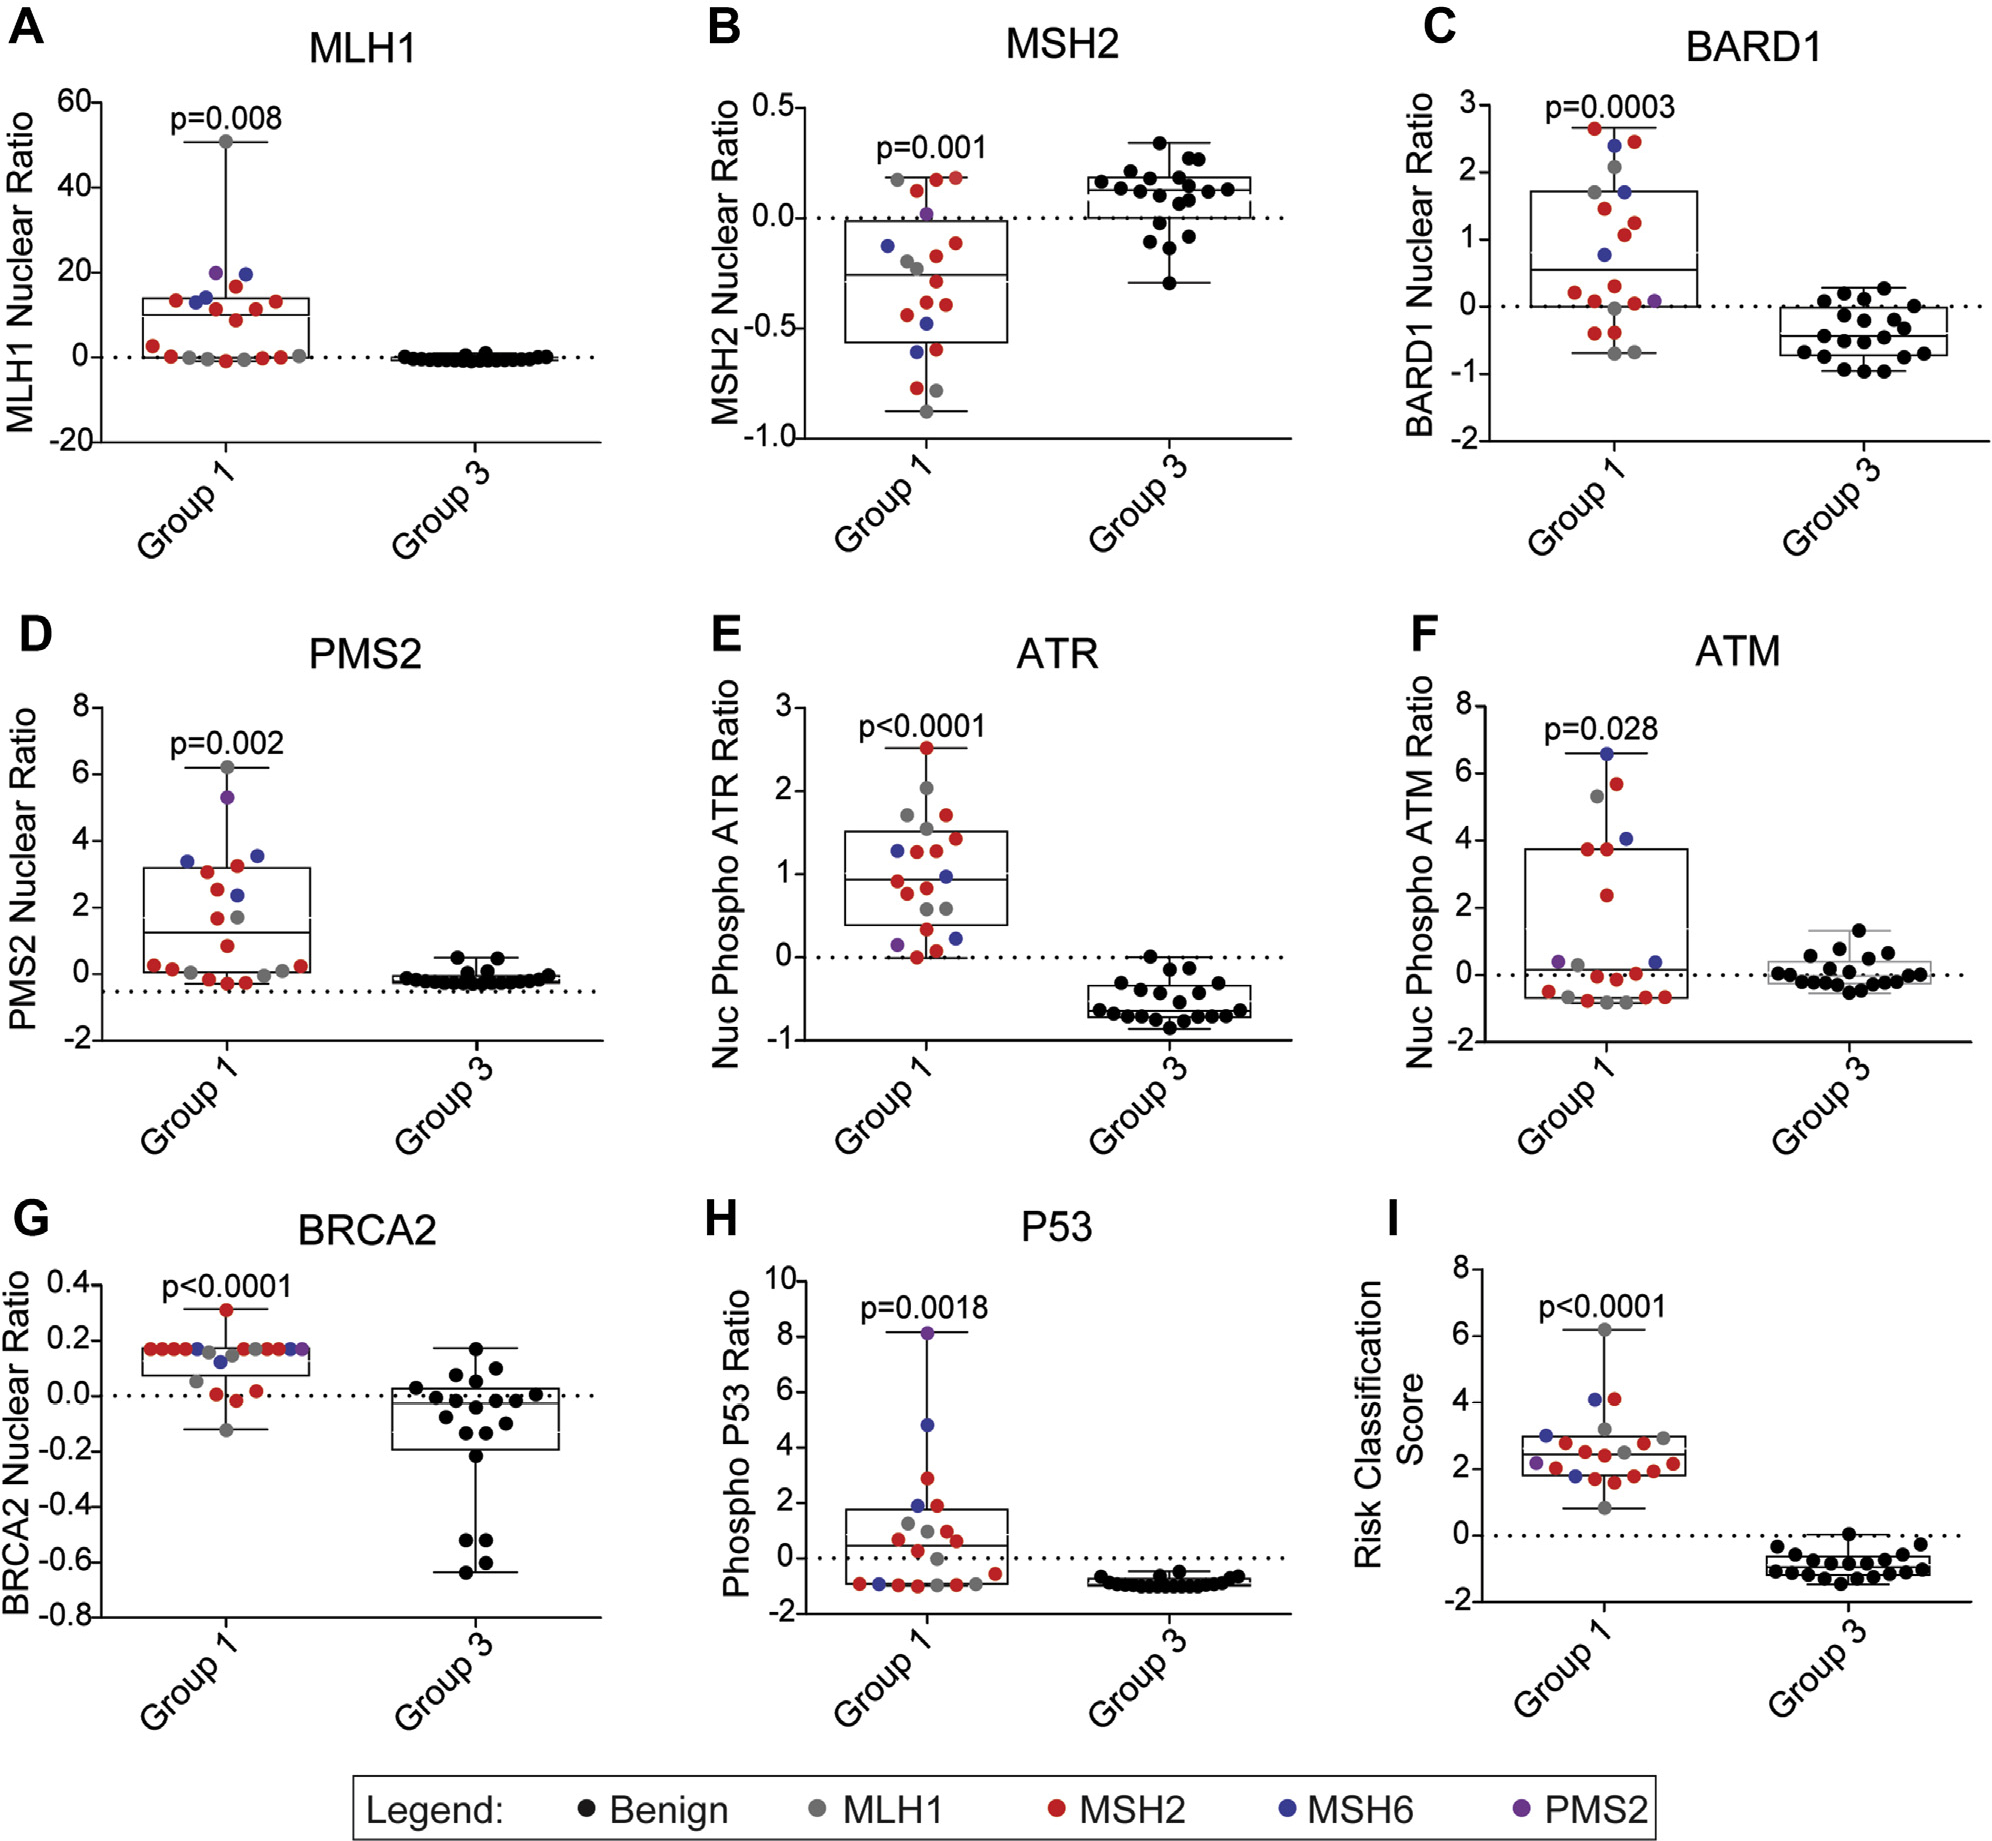
Boxplots for group 1 (n = 20) and group 3 (n = 20) subjects’ FVAs for MMR pathway: MLH1 nuclear localization (A), MSH2 nuclear localization (B), BARD1 nuclear localization (C), PMS nuclear localization (D), ATR nuclear phosphorylation (E), and ATM nuclear phosphorylation (F). Boxplots for group 1 (n = 20) and group 3 (n = 20) subjects’ FVAs for DSBR pathway: BRCA2 nuclear translocation (G); p53 phosphorylation after MNNG treatment (H); risk classification score based on combination of MLH1, MSH2, and ATR FVAs (I). Colors represent gene where variant was identified through sequencing. CR-C, Cancer Risk C; FVA, flow variant assay; MNNG, methylnitronitrosoguanidine.
Disruption of the MMR pathway is known to increase sensitivity to double stranded breaks and can augment functional activities of proteins in the DSBR pathway, another DNA repair pathway that uses homologous recombination.19 After MNNG treatment, BRCA2 had higher nuclear translocation and p53 had higher whole cell phosphorylation in group 1 than in group 3 (Figure 1G and H). However, there was no significant change in BRCA1 nuclear translocation between the 2 groups (Supplemental Table 2).
To produce a nonredundant test, pairwise comparisons between MMR FVAs and correlated assays were made, because they provided no incremental information about MMR defects. PMS2 correlated with MLH1 (r2 = 0.82), BARD1 correlated with MSH2 (r2 = 0.83), and ATM correlated with MSH2 (r2 = 0.82); thus, PMS2, BARD1, and ATM were not carried forward (Supplemental Figure 2A–F). The MLH1, MSH2, and ATR FVAs showed 95% or less specificity and sensitivity in distinguishing group 1 and group 3 subjects (Table 1). To improve the specificity and sensitivity, these FVAs were combined by logistic regression to produce an RCS, in which subjects with a positive RCS were considered to have LS and those with a negative RCS did not. The sensitivity (proportion of participants with a P/LP variant who had a positive RCS) was 100% (95% CI = 83%–100%) and the specificity (proportion of participants without any variant who had a negative RCS) was 95% (95% CI = 75%–100%). The combined accuracy of the RCS, derived from the weighted average of specificity and sensitivity was 98% (95% CI = 87%–100%) (Table 1, Figure 1I). Antibody concentration and cell concentration were optimized for concentrations with coefficients of variation (CV) < 0.05 when comparing RCS of 3 technical replicates among discovery cohort subjects (Supplemental Figure 3A–B). The CR-C test was stable up to 3 days after staining when compared with freshly stained matched cells (Supplemental Figure 3C).
Table 1.
Regression Mean Absolute Error (MAE) with corresponding standard deviations (×10−5) under 5-fold crossvalidation. The values in bold show the best and second best results.
| Aggr. | Rule | Intr. | Overall | |
|---|---|---|---|---|
|
| ||||
| PCA + LR | 2.97(530) | 3.49(12) | 3.77(2.6) | 6.26(27) |
| Spec. C + LR [15] | 2.64(66) | 2.53(2.4) | 2.10(4.2) | 5.08(33) |
|
| ||||
| Global Pool | 3.24(760) | 2.86(130) | 2.42(330) | 5.97(10) |
| SAG Pool[13] | 1.24(240) | 1.66(270) | 1.25(4.8) | 4.07(8.2) |
| DIFFPOOL[16] | 1.79(110) | 1.58(4.8) | 1.17(71) | 3.72(47) |
| HGP-SL[17] | 1.11(19) | 1.24(26) | 1.21(2.6) | 3.16(110) |
| StructPool [18] | 1.57(21) | 1.11(720) | 1.36(19) | 2.94(6.2) |
|
| ||||
| HBE w/o KL † | 1.02(5.2) | 0.87(113) | 1.21(36) | 2.17(12) |
| HBE | 0.82(66) | 0.71(125) | 1.02(12) | 1.98(24) |
shows the results of our model without using KL loss to optimize the community inner features. LR and Spec. C are Linear Regression and Spectral Clustering respectively. Overall denotes the task of jointly predicting all three scores.
CR-C testing in the replication cohort shows high specificity and sensitivity and can identify MMR deficiency in subjects with germline VUS
A replication cohort was established from a different set of CCFR subjects than those used in the discovery cohort. The replication cohort comprised 3 groups: subjects with P/LP variants in MMR genes (group 1; n = 40); subjects with a VUS in MMR genes and an MSI-H colorectal tumor (group 2; n = 60); and family members of individuals with known P/LP variants, who themselves did not have the variant (group 3; n = 40; Supplemental Table 1). On comparing groups 1 and 3, similar differences in activities of MLH1, MSH2, and ATR were observed, resulting in a sensitivity of RCS of 100% (95% CI = 91%–100%) and a specificity of 98% (95% CI = 87%–100%) (Figure 2A–D, Table 1). When applied to group 2, 73% (95% CI = 60%–84%) of subjects had a positive RCS indicating germline MMR deficiency (Figure 2D). There were no differences by MMR gene VUS in the mean RCS (Supplemental Figure 4A). The majority of group 2 subjects had multiple absent MMR proteins, always dimer pairs, in the tumor as measured through IHC (85%; Supplemental Figure 4B) and no hypermethylation of the MLH1 promoter (88%; Supplemental Figure 4C). In 94% of group 2 subjects, the gene with VUS matched 1 of the IHC- deficient MMR proteins (Supplemental Table 2).
Figure 2. CR-C applied to a larger replication cohort shows similar high accuracy for discriminating individuals with P/LP and B/LB variants and diagnoses most MSI-H VUS subjects with LS.
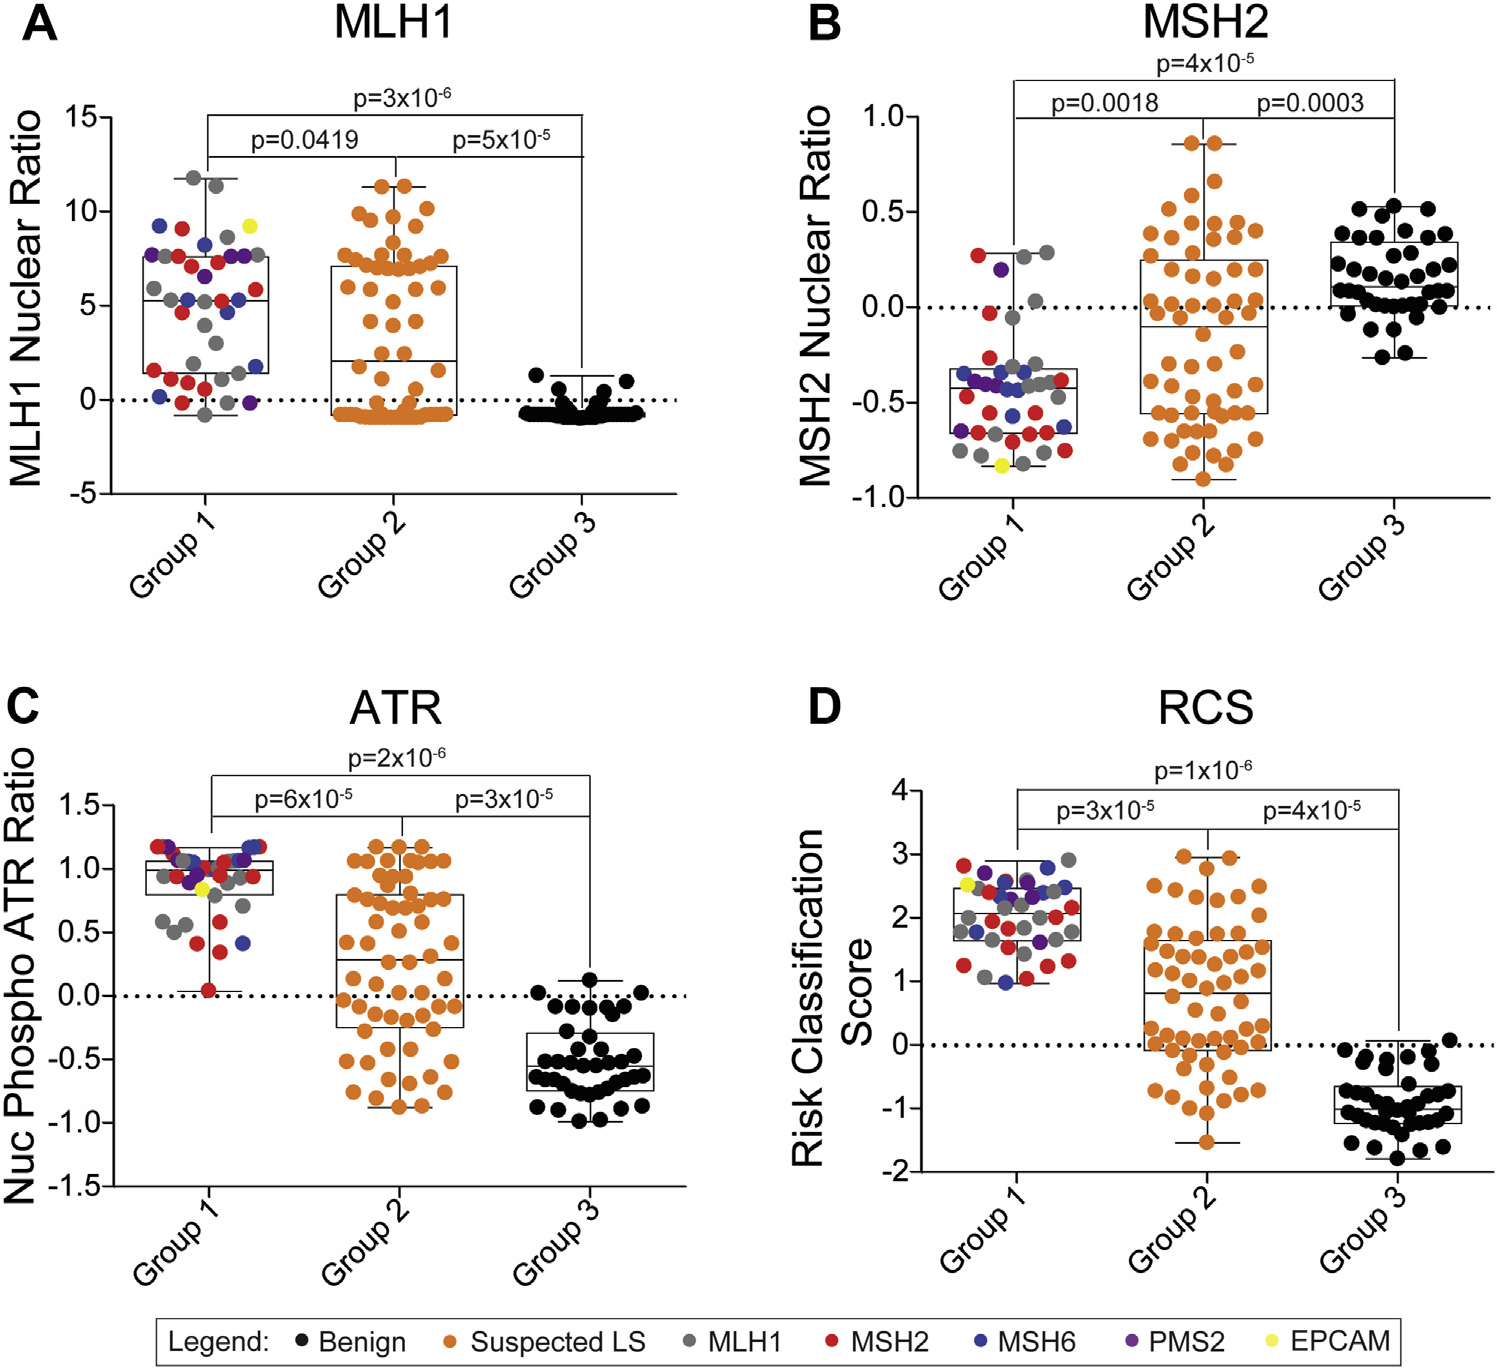
Boxplots for CR-C FVAs for subjects with P/LP variants (group 1; n = 40), MSI-H, VUS (group 2; n = 60), and subjects negative for familial P/LP variants (group 3; n = 40). FVAs of MLH1 nuclear localization (A), MSH2 nuclear localization (B), ATR nuclear phosphorylation (C), and RCS (D). Colors represent gene where variant was identified through sequencing. CR-C, Cancer Risk C; FVA, flow variant assay; MSI-H, microsatellite instability-high; LP, likely pathogenic; LS, Lynch syndrome; P, pathogenic; RCS, risk classification score; VUS, variants of uncertain significance.
Gene rescue of P/LP-edited cell lines shows causality of variants
The cohorts tested in this study correlated the presence of P/LP variants in genes in the MMR pathway with the CR-C+ phenotype. To show the causality of these variants, HEK293 cells were edited with P/LP or B/LB variants in MLH1, MSH2, MSH6, and PMS2 via CRISPR/Cas9 (Supplemental Table 3). We first tested MLH1 and MSH2-edited cell lines because of more common occurrence of VUS in these genes. These cell lines were transfected with either an empty vector plasmid or the corresponding wild-type (WT) cDNA, both plasmids having a GFP reporter tag. Based on GFP positivity, the overall efficiency of transfection exceeded 90%. The expression plasmids showed negligible effects on CR-C phenotypes when transfected into HEK293 cells with B/LB variants (Figure 3). When expression plasmids with MLH1 or MSH2 cDNAs were transfected into HEK293 with P/LP variants, and then treated with MNNG, individual MLH1, MSH2, and ATR FVAs showed heterogenous phenotypes (Figure 3A–F). When analyzed for RCS, MLH1 cDNA rescued MLH1 P/LP variants (P = .01; Figure 3G) and MSH2 cDNA rescued MSH2 P/LP variants (P = .03; Figure 3H). We validated these results using 2 edited cell lines with P/LP variants in either MSH6 or PMS2. We found that corresponding WT cDNA expression plasmid transfection rescued P/LP RCS (P = .001; Supplemental Figure 5), confirming the causality of these P/LP variants to the CR-C+ result.
Figure 3. Transfection of wild-type cDNA expression plasmid restores benign FVA results in edited cells with P/LP variants.

Boxplots for CRISPR/Cas9 edited cells with either benign or P/LP variants in MLH1 (n = 4 each) or MSH2 (n = 4 each) and transfected with empty vector or wild-type expression plasmid containing cDNA of the corresponding edited variant: MLH1 (A), MSH2 (B), and ATR FVAs of cells with edits in MLH1 (C); MLH1 (D), MSH2 (E), and ATR FVAs of cells with edits in MSH2 (F); RCS of transfected cells with edits in MLH1 (G), and RCS of transfected cells with edits in MSH2 (H). Rescue is shown to be significant by pairwise comparison (P < .05). cDNA, complementary DNA; FVA, flow variant assay; P/LP, pathogenic/likely pathogenic; RCS, risk classification score.
CR-C testing of whole blood can be translated into the clinical setting
To facilitate deployment of CR-C in the clinical setting, direct comparison of LCLs and whole blood was performed on a pilot group of 24 individuals seeking genetic testing for cancer risks at the Montefiore Medical Center Cancer Genetics Service, 15 had family histories of LS-related cancers and 9 had family histories of non–LS-related cancers (Supplemental Table 4). PBMCs from these subjects were either tested directly for CR-C or transformed to LCLs, then tested for CR-C. The correlation between LCL and PBMCs was high for each of the 3 assays (Figure 4A–C; MLH1 r2 = 0.98, MLH2 r2 = 0.96, and ATR r2 = 0.87) and for RCS (r2 = 0.92) (Figure 4D). The reproducibility of FVAs performed on PBMCs was also high (MLH1 CV =1.29%, MSH2 CV =1.49%, and ATR CV = 2.36%).
Figure 4. CR-C shows similar results when comparing LCL and corresponding PBMCs.
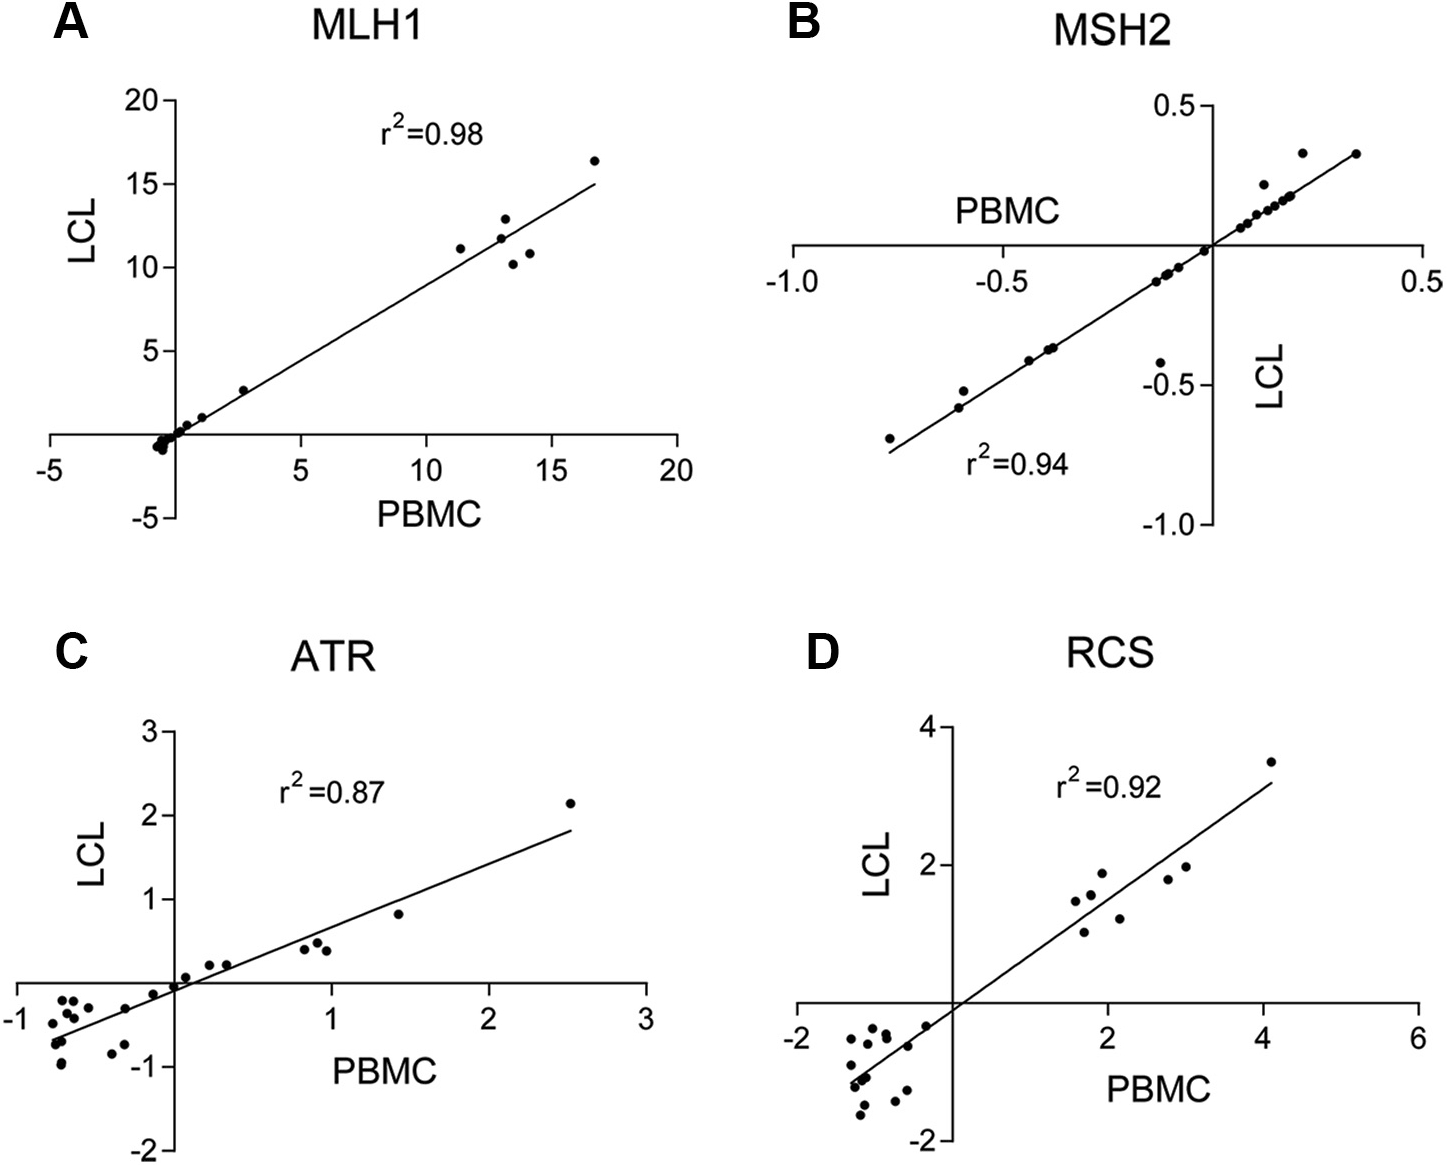
Linear regression comparing matched PBMCs and LCLs (n = 20) from the same subjects for MLH1 FVAs (A), MSH2 FVAs (B), ATR FVAs (C), and RCS (D). CR-C, Cancer Risk C; FVA, flow variant assay; LCL, lymphoblastoid cell line; PBMC, peripheral blood mononuclear cell; RCS, risk classification score.
Among this pilot-study test group, 8 with personal or familial LS-related cancers were CR-C+ and 1 with personal or familial non–LS-related cancers was CR-C+. Among those with personal or familial LS-related cancers who were CR-C+, 2 had P/LP variants in MMR genes and 1 had a VUS in PMS2 that was rescued with a PMS2 expression plasmid (Supplemental Figure 6). The other 5 subjects with personal or familial LS-related cancers and the subject with non–LS-related personal or familial cancers did not have VUS in MMR genes. Another subject with LS-related familial cancers and a VUS in PMS2 was CR-C−, indicating that VUS was likely B/LB (Supplemental Figure 6).
Discussion
CR-C, an accurate functional genomics test, identifies germline MMR pathway deficiency among patients who meet Amsterdam II criteria or have a tumor that is MSI-H and/or IHC negative for an MMR protein. CR-C is based on FVAs of MLH1 and MSH2 nuclear localization and ATR nuclear phosphorylation, all 3 of which showed significant functional differences when comparing cells with P/LP variants vs B/LB variants. Similar to prior FVA studies of the DSBR pathway,8 individual assays had ≤80% sensitivity when comparing LCL cells from group 1 and group 3 subjects. Nonetheless, in both pathways, the heterogeneous biological effects of P/LP variants were accounted for by combining multiple FVAs to calculate an RCS that accurately captured deficiency (or overcompensation to a failed repair response in the presence of deficiency) in the pathways.20 The CR-C RCS based on combining MLH1, MSH2, and ATR FVAs by logistic regression had 100% sensitivity and 98% specificity.
This study of CR-C established analytical validity and clinical validity, criteria that must be met for introducing a test into a clinical setting.21 Analytical validity was shown by the correlated results from different cell lines carrying the same variant, whether LCLs, PBMCs, or edited HEK293 cells, and by the low CVs on replicates of the test on the same samples. Clinical validity for CR-C was shown by high specificity and sensitivity for MMR deficiency in >180 patient samples. Clinical utility of the test will be shown in future case-control studies that measure prospective risks for developing colorectal and other cancers, as well as retrospective studies that measure prevalence of CR-C+ among cases with microsatellite stable colorectal cancers, MSI-H colorectal cancers with double somatic variants, and MSI-H non–colorectal cancers. Individuals with germline MMR deficiency identified using CR-C could follow NCCN colonoscopy screening guidelines at an earlier age, which could lead to identification of colorectal cancer at an earlier stage, when cure could be most readily achieved.3
Adoption of the CR-C test could modify the current approach for testing people who meet criteria for LS testing.3 Gene panel sequencing identifies P/LP variants in only 27% of individuals who are tested and VUS in 20% to 40%.6 Although P/LP variants in specific MMR genes have been shown to have differential risks for colorectal, endometrial, or other cancers,22 this knowledge has no practical value when providing counseling nor surveillance for cancer risks because it does not consider modifying gene–gene interactions contributed by polygenic risk scores.23 A 2-tiered approach of sequencing followed by CR-C would increase sensitivity, especially for those with VUS. For patients who have tumors that are MSI-H or have absent MMR proteins measured through IHC, CR-C could also be a first-line test, rather than an add-on. Currently, tests for BRAF(V600E) variant or MLH1 promoter hypermethylation in these tumors identify somatic events that account for approximately 75% of MSI-H or IHC negative phenotypes and exclude the need for germline sequencing for diagnosing LS.24–27 The advantage of CR-C is that it would identify germline MMR deficiency without additional tumor tests. When CR-C was applied to subjects with significant family histories; germline VUS in MMR genes; and MSI-H, MLH1 hypermethylation negative, and BRAF (V600E) negative tumors (group 2) germline MMR deficiency was identified among 73%. On the basis of these observations, approximately 17% of those with significant family histories and MSI-H or IHC negative cancers would be expected to have germline MMR deficiency. Although approximately 50% of subjects with MSI-H or IHC negative without MLH1 hypermethylation have been reported to have double somatic variants,28 tumor sequencing was not included in this study, and thus, prevalence of CR-C+ among the whole group of patients with MMR deficient tumors is unknown. Whereas knowledge of germline MMR deficiency has considerable clinical utility for patients, knowledge of MLH1 promoter hypermethylation, BRAF(V600E) variant status, and double somatic variants do not, because these methods are used only to rule out LS.
CR-C would be useful for annotating gene variants (Supplemental Figure 7). Application of CR-C to gene edited cells subsequently rescued by transfected plasmids that express the WT cDNA showed the causality of P/LP variants. This unified approach for analyzing all VUS in MMR pathway genes contrasts with prior research-based functional assays. Cell-free in vitro MMR activity uses MSH2 deficient nuclear extract mixed with variant or WT protein extract. This cell-free procedure compares variant with WT function via fluorescent labeled mismatch.29,30
Cell line and yeast models have been used to reclassify human MMR variants. For example, yeast transfection of both a reporter plasmid with mismatch errors and a MLH1 variant-carrying plasmid tests whether errors in the reporter plasmid are repaired.31 The CR-C unified approach could be scaled to 96-well plate analysis and it would meet proposed criteria for functional assay annotation of genetic variants: (1) define disease, (2) application of general classes of assays used in the field, (3) evaluate specific instances of assay, and (4) apply evidence to individual variant interpretation that were met by this test.32 Based on these criteria, the evidence for CR-C− as a benign BS3 categorical classifier using the American College of Medical Genetics and Genomics/Association for Molecular Pathology sequence variant interpretation framework (high sensitivity, specificity, and reproducibility) is strong.33 Rescue of patient cells with an expression plasmid would show causality for the VUS as was done for subject SKC7 in this study. This approach has been applied previously to the CR-B assay to annotate variants in the DSBR pathway,34 and would be applicable not only to the DSBR and MMR pathways, but also to other genetic pathways for which FVAs were developed.
Supplementary Material
Table 2.
Regression Mean Absolute Error (MAE) with corresponding standard deviation (×−5) under 5-fold crossvalidation. The values in bold show the best results.
| Aggr. | Rule | Intr. | All | |
|---|---|---|---|---|
|
| ||||
| 8-nodes | 2.25(27) | 3.07(79) | 3.91(102) | 7.62(11) |
| HBE | 0.82(66) | 0.71(125) | 1.02(12) | 1.98(24) |
Acknowledgments
The study was funded in part by the National Cancer Institute, United States (1 R41 CA232867).
Footnotes
Conflict of Interest
H.O. and J.L. are members of the scientific advisory board for Morgan & Mendel Genomics Inc and own shares of the company. I.A., S.Y., A.S.T., P.N., N.M.L., R.K.P., M.A.J., D.D.B., S.G., and S.K. declare no conflicts of interest.
Ethics Declaration
This study was approved by the Institutional Review Board of Albert Einstein College of Medicine. Samples from Colon Cancer Family Registry were obtained from patients with informed consent and were de-identified by the biobank.12 Informed consent was obtained from all Montefiore participants in this study and data were de-identified.
Additional Information
The online version of this article (https://doi.org/10.1016/j.gim.2022.05.003) contains supplementary material, which is available to authorized users.
Data Availability
The data from this study are available in the Supplemental Tables.
References
- 1.Lynch HT, de la Chapelle A. Hereditary colorectal cancer. N Engl J Med. 2003;348(10):919–932. 10.1056/NEJMra012242. [DOI] [PubMed] [Google Scholar]
- 2.Vasen HF, Watson P, Mecklin JP, Lynch HT. New clinical criteria for hereditary nonpolyposis colorectal cancer (HNPCC, Lynch syndrome) proposed by the International Collaborative group on HNPCC. Gastroenterology. 1999;116(6):1453–1456. 10.1016/s0016-5085(99)70510-x. [DOI] [PubMed] [Google Scholar]
- 3.Gupta S, Provenzale D, Llor X, et al. NCCN Guidelines Insights: genetic/familial high- risk assessment: colorectal, version 2.2019. J Natl Compr Canc Netw. 2019;17(9):1032–1041. 10.6004/jnccn.2019.0044. [DOI] [PubMed] [Google Scholar]
- 4.Provenzale D, Gupta S, Ahnen DJ, et al. NCCN Guidelines Insights: colorectal cancer screening, version 1.2018. J Natl Compr Canc Netw. 2018;16(8):939–949. 10.6004/jnccn.2018.0067. [DOI] [PubMed] [Google Scholar]
- 5.Stoffel E, Mukherjee B, Raymond VM, et al. Calculation of risk of colorectal and endometrial cancer among patients with Lynch syndrome. Gastroenterology. 2009;137(5):1621–1627. 10.1053/j.gastro.2009.07.039. [DOI] [PMC free article] [PubMed] [Google Scholar]
- 6.Moreira L, Balaguer F, Lindor N, et al. Identification of Lynch syndrome among patients with colorectal cancer. JAMA. 2012;308(15):1555–1565. 10.1001/jama.2012.13088. [DOI] [PMC free article] [PubMed] [Google Scholar]
- 7.Loke J, Ostrer H. Rapidly screening variants of uncertain significance in the MAP3K1 gene for phenotypic effects. Clin Genet. 2012;81(3):272–277. 10.1111/j.1399-0004.2011.01834.x. [DOI] [PubMed] [Google Scholar]
- 8.Loke J, Pearlman A, Upadhyay K, Tesfa L, Shao Y, Ostrer H. Functional variant analyses (FVAs) predict pathogenicity in the BRCA1 DNA double-strand break repair pathway. Hum Mol Genet. 2015;24(11):3030–3037. 10.1093/hmg/ddv048. [DOI] [PubMed] [Google Scholar]
- 9.Syeda MM, Upadhyay K, Loke J, et al. Prediction of breast cancer risk based on flow- variant analysis of circulating peripheral blood B cells. Genet Med. 2017;19(9):1071–1077. 10.1038/gim.2016.222. [DOI] [PubMed] [Google Scholar]
- 10.Mirzoeva OK, Kawaguchi T, Pieper RO. The Mre11/Rad50/Nbs1 complex interacts with the mismatch repair system and contributes to temozolomide-induced G2 arrest and cytotoxicity. Mol Cancer Ther. 2006;5(11):2757–2766. 10.1158/1535-7163.MCT-06-0183. [DOI] [PubMed] [Google Scholar]
- 11.Eich M, Roos WP, Dianov GL, Digweed M, Kaina B. Nijmegen breakage syndrome protein (NBN) causes resistance to methylating anticancer drugs such as temozolomide. Mol Pharmacol. 2010;78(5):943–951. 10.1124/mol.110.066076. [DOI] [PubMed] [Google Scholar]
- 12.Newcomb PA, Baron J, Cotterchio M, et al. Colon Cancer Family Registry: an international resource for studies of the genetic epidemiology of colon cancer. Cancer Epidemiol Biomarkers Prev. 2007;16(11):2331–2343. 10.1158/1055-9965.EPI-07-0648. [DOI] [PubMed] [Google Scholar]
- 13.Win AK, Young JP, Lindor NM, et al. Colorectal and other cancer risks for carriers and noncarriers from families with a DNA mismatch repair gene mutation: a prospective cohort study. J Clin Oncol. 2012;30(9):958–964. 10.1200/JCO.2011.39.5590. [DOI] [PMC free article] [PubMed] [Google Scholar]
- 14.DeRycke MS, Gunawardena S, Balcom JR, et al. Targeted sequencing of 36 known or putative colorectal cancer susceptibility genes. Mol Genet Genomic Med. 2017;5(5):553–569. 10.1002/mgg3.317. [DOI] [PMC free article] [PubMed] [Google Scholar]
- 15.Jacobi AM, Rettig GR, Turk R, et al. Simplified CRISPR tools for efficient genome editing and streamlined protocols for their delivery into mammalian cells and mouse zygotes. Methods. 2017;121–122:16–28. 10.1016/j.ymeth.2017.03.021. [DOI] [PMC free article] [PubMed] [Google Scholar]
- 16.Liang X, Potter J, Kumar S, et al. Rapid and highly efficient mammalian cell engineering via Cas9 protein transfection. J Biotechnol. 2015;208:44–53. 10.1016/j.jbiotec.2015.04.024. [DOI] [PubMed] [Google Scholar]
- 17.Liang X, Potter J, Kumar S, Ravinder N, Chesnut JD. Enhanced CRISPR/Cas9- mediated precise genome editing by improved design and delivery of gRNA, Cas9 nuclease, and donor DNA. J Biotechnol. 2017;241:136–146. 10.1016/j.jbiotec.2016.11.011. [DOI] [PubMed] [Google Scholar]
- 18.Yoshioka K, Yoshioka Y, Hsieh P. ATR kinase activation mediated by MutSalpha and MutLalpha in response to cytotoxic O6-methylguanine adducts. Mol Cell. 2006;22(4):501–510. 10.1016/j.molcel.2006.04.023. [DOI] [PMC free article] [PubMed] [Google Scholar]
- 19.Zhao H, Thienpont B, Yesilyurt BT, et al. Mismatch repair deficiency endows tumors with a unique mutation signature and sensitivity to DNA double-strand breaks. Elife. 2014;3:e02725. 10.7554/eLife.02725. [DOI] [PMC free article] [PubMed] [Google Scholar]
- 20.Fu D, Calvo JA, Samson LD. Balancing repair and tolerance of DNA damage caused by alkylating agents. Nat Rev Cancer. 2012;12(2):104–120. 10.1038/nrc3185. [DOI] [PMC free article] [PubMed] [Google Scholar]
- 21.Burke W Genetic tests: clinical validity and clinical utility. Curr Protoc Hum Genet. 2014;81:9.15.1–9.15.8. 10.1002/0471142905.hg0915s81. [DOI] [PMC free article] [PubMed] [Google Scholar]
- 22.Jasperson KW, Tuohy TM, Neklason DW, Burt RW. Hereditary and familial colon cancer. Gastroenterology. 2010;138(6):2044–2058. 10.1053/j.gastro.2010.01.054. [DOI] [PMC free article] [PubMed] [Google Scholar]
- 23.Fahed AC, Wang M, Homburger JR, et al. Polygenic background modifies penetrance of monogenic variants for tier 1 genomic conditions. Nat Commun. 2020;11(1):3635. 10.1038/s41467-020-17374-3. [DOI] [PMC free article] [PubMed] [Google Scholar]
- 24.Gausachs M, Mur P, Corral J, et al. MLH1 promoter hypermethylation in the analytical algorithm of Lynch syndrome: a cost-effectiveness study. Eur J Hum Genet. 2012;20(7):762–768. 10.1038/ejhg.2011.277. [DOI] [PMC free article] [PubMed] [Google Scholar]
- 25.Sarode VR, Robinson L. Screening for Lynch syndrome by immunohistochemistry of mismatch repair proteins: significance of indeterminate result and correlation with mutational studies. Arch Pathol Lab Med. 2019;143(10):1225–1233. 10.5858/arpa.2018-0201-OA. [DOI] [PubMed] [Google Scholar]
- 26.Capper D, Voigt A, Bozukova G, et al. BRAF V600E-specific immunohistochemistry for the exclusion of Lynch syndrome in MSI-H colorectal cancer. Int J Cancer. 2013;133(7):1624–1630. 10.1002/ijc.28183. [DOI] [PubMed] [Google Scholar]
- 27.Latham A, Srinivasan P, Kemel Y, et al. Microsatellite instability is associated with the presence of Lynch syndrome pan-cancer. J Clin Oncol. 2019;37(4):286–295. Published correction appears in J Clin Oncol. 2019;37(11):942. 10.1200/JCO.18.00283 [DOI] [PMC free article] [PubMed] [Google Scholar]
- 28.Pearlman R, Haraldsdottir S, de la Chapelle A, et al. Clinical characteristics of patients with colorectal cancer with double somatic mismatch repair mutations compared with Lynch syndrome. J Med Genet. 2019;56(7):462–470. 10.1136/jmedgenet-2018-105698. [DOI] [PMC free article] [PubMed] [Google Scholar]
- 29.Drost M, Tiersma Y, Thompson BA, et al. A functional assay-based procedure to classify mismatch repair gene variants in Lynch syndrome. Genet Med. 2019;21(7):1486–1496. 10.1038/s41436-018-0372-2. [DOI] [PMC free article] [PubMed] [Google Scholar]
- 30.Drost M, Tiersma Y, Glubb D, et al. Two integrated and highly predictive functional analysis-based procedures for the classification of MSH6 variants in Lynch syndrome. Genet Med. 2020;22(5):847–856. 10.1038/s41436-019-0736-2. [DOI] [PMC free article] [PubMed] [Google Scholar]
- 31.Takahashi M, Shimodaira H, Andreutti-Zaugg C, Iggo R, Kolodner RD, Ishioka C. Functional analysis of human MLH1 variants using yeast and in vitro mismatch repair assays. Cancer Res. 2007;67(10):4595–4604. 10.1158/0008-5472.CAN-06-3509. [DOI] [PubMed] [Google Scholar]
- 32.Brnich SE, Rivera-Muñoz EA, Berg JS. Quantifying the potential of functional evidence to reclassify variants of uncertain significance in the categorical and Bayesian interpretation frameworks. Hum Mutat. 2018;39(11):1531–1541. 10.1002/humu.23609. [DOI] [PMC free article] [PubMed] [Google Scholar]
- 33.Brnich SE, Abou Tayoun AN, Couch FJ, et al. Recommendations for application of the functional evidence PS3/BS3 criterion using the ACMG/AMP sequence variant interpretation framework. Genome Med. 2019;12(1):3. 10.1186/s13073-019-0690-2. [DOI] [PMC free article] [PubMed] [Google Scholar]
- 34.Loke J, Alim I, Yam S, et al. Prediction of breast cancer risk based on flow variant analysis of circulating peripheral blood mononuclear cells. HGG AdV. 2022;3(2):100085. 10.1016/j.xhgg.2022.100085. [DOI] [PMC free article] [PubMed] [Google Scholar]
Associated Data
This section collects any data citations, data availability statements, or supplementary materials included in this article.
Supplementary Materials
Data Availability Statement
The data from this study are available in the Supplemental Tables.