Abstract
Neuronal endoplasmic reticulum (ER) appears continuous throughout the cell. Its shape and continuity are influenced by ER-shaping proteins, mutations in which can cause distal axon degeneration in Hereditary Spastic Paraplegia (HSP). We therefore asked how loss of Rtnl1, a Drosophila ortholog of the human HSP gene RTN2 (SPG12), which encodes an ER-shaping protein, affects ER organization and the function of presynaptic terminals. Loss of Rtnl1 depleted ER membrane markers at Drosophila presynaptic motor terminals and appeared to deplete narrow tubular ER while leaving cisternae largely unaffected, thus suggesting little change in resting Ca2+ storage capacity. Nevertheless, these changes were accompanied by major reductions in activity-evoked Ca2+ fluxes in the cytosol, ER lumen, and mitochondria, as well as reduced evoked and spontaneous neurotransmission. We found that reduced STIM-mediated ER-plasma membrane contacts underlie presynaptic Ca2+ defects in Rtnl1 mutants. Our results show the importance of ER architecture in presynaptic physiology and function, which are therefore potential factors in the pathology of HSP.
Introduction
Synapses, the computational units of nervous systems, are immensely adaptable. The ER is a site of some of the processes that tune synaptic strength. It is a major Ca2+ store of the cell, a site of lipid biosynthesis, and can regulate the physiology of other organelles through contact sites that support exchange of Ca2+ and lipids. Axonal ER comprises an extensive continuous network formed mainly of tubules (Wu et al., 2017) that are shaped by proteins of the reticulon and REEP families, among others. These contain intramembrane hairpin domains that can curve ER membrane (Shibata et al., 2009; Voeltz et al., 2006); loss of these proteins can reduce tubule number and curvature of axonal ER and disrupt network continuity (O’Sullivan et al., 2012; Yalçın et al., 2017).
The ER network appears to influence axon survival and maintenance; mutations affecting ER-shaping proteins can lead to the axon degeneration disease, Hereditary Spastic Paraplegia (HSP; Öztürk et al., 2020). HSPs show degeneration of the distal regions of longer upper motor axons, consistent with “dying back” degeneration from axon terminals, preferentially in the longest upper motor axons. The links between HSP and ER-shaping proteins suggest a critical relationship between ER architecture and axonal and presynaptic maintenance. However, we lacked a good model for how ER spatial organization affects axonal or presynaptic function and degeneration. One way in which ER might do this is as an intracellular Ca2+ store. ER Ca2+ stores can either contribute to presynaptic cytosolic Ca2+ responses or sequester excess Ca2+ from the cytosol in response to high frequency stimulation (Chanaday et al., 2021; de Juan-Sanz et al., 2017; Kuromi and Kidokoro, 2002; Lindhout et al., 2019; Sanyal et al., 2005; Singh et al., 2021; Tran and Stricker, 2021). ER might potentially also influence presynaptic physiology via its interactions with mitochondria. Like ER, mitochondria can also take up Ca2+ when cytosolic Ca2+ is elevated, although this process appears unable to buffer Ca2+ sufficiently to affect synaptic transmission (Chouhan et al., 2010; Verstreken et al., 2005); rather its role appears to be to stimulate ATP synthesis in response to the Ca2+ influx that occurs on synaptic activity (Chouhan et al., 2012; Datta and Jaiswal, 2021; Jouaville et al., 1999). The cytosol, rather than ER, seems to be the main source of Ca2+ for mitochondria in presynaptic terminals (Ashrafi et al., 2020; Chouhan et al., 2012).
As well as being a bulk Ca2+ source or sink, the ER dynamically responds to lumenal Ca2+ levels. STIM (stromal interacting molecule) proteins in the ER membrane, when activated by depletion of ER Ca2+ stores, interact with effectors in the plasma membrane (PM), such as the Orai1 Ca2+ channel, leading to influx of extracellular Ca2+ into the cytosol (store-operated Ca2+ entry, SOCE) and refilling of ER stores (Serwach and Gruszczynska-Biegala, 2020). In primary hippocampal neurons, evoked neurotransmitter release correlates with ER Ca2+ content due to a feedback loop dependent on inhibition of voltage-gated Ca2+ channels in the plasma membrane by activated STIM1 (de Juan-Sanz et al., 2017). Also in primary hippocampal neurons, SOCE, in a STIM2-dependent manner, can transiently increase presynaptic Ca2+ levels and robustly augment spontaneous glutamate vesicular release (Chanaday et al., 2021).
Since mutations in several ER-shaping proteins can cause axon degeneration, altered ER architecture may elicit degenerative changes in axonal or presynaptic function. One mechanism could be local dysregulation of Ca2+—for example through reduced availability of Ca2+ for synaptic signaling or capacity to remove cytosolic Ca2+, or interference with regulatory effects of the ER STIM Ca2+ sensors (Chanaday et al., 2021; de Juan-Sanz et al., 2017). Presynaptic ER comprises a network of interconnected tubules with occasional cisternae (Wu et al., 2017). While the presence of cisternae might indicate regions specialized in storing Ca2+, the predominance of narrow ER tubules suggests a local regulatory role for this organelle. To test how spatial organization of ER could impair synaptic function, we used Drosophila to study the effects of removing the tubular ER-shaping protein Rtnl1 on presynaptic ER organization, and on the Ca2+ fluxes between compartments during synaptic activity. Rtnl1 is one of two documented reticulons in Drosophila, orthologous to the four RTNs found in mammals (RTN1-4), including the HSP causative gene RTN2 (Montenegro et al., 2012). It is distributed continuously in motor axons all the way to presynaptic termini (O’Sullivan et al., 2012), and its loss leads to partial depletion of axonal ER (O’Sullivan et al., 2012; Yalçın et al., 2017). Loss of Rtnl1 greatly decreases Excitatory Junction Potential (EJP) amplitude at the larval neuromuscular junction (NMJ; Summerville et al., 2016), implying major effects on presynaptic physiology, although its effects on presynaptic ER and its role in presynaptic physiology has not been well defined.
Here we reveal how loss of Rtnl1 depletes tubular ER but not cisternae or ER volume at NMJs, and how this loss significantly decreases ER, mitochondrial, and cytosolic evoked Ca2+ fluxes. We found that this impact of Rtnl1 loss on presynaptic Ca2+ handling is caused by a decrease of STIM-mediated ER-PM contacts. Our results suggest a feedback loop, whereby tubular ER and inactivated STIM control evoked Ca2+ entry into the presynaptic compartment and neurotransmitter release.
While Rtnl1 loss reduces axonal ER levels mainly in longer motor axons (O’Sullivan et al., 2012; Yalçın et al., 2017), we observed that it reduces presynaptic tubular ER independently of axonal length. This phenotype provides a unique model to study the contribution of the presynaptic tubular ER network and ER-shaping HSP proteins to presynaptic Ca2+ handling. Our findings display a local role for presynaptic ER tubules, and how synaptic dysfunction might be a consequence of impairing functions of proteins that are mutated in HSP.
Results
Rtnl118 is a null mutant allele
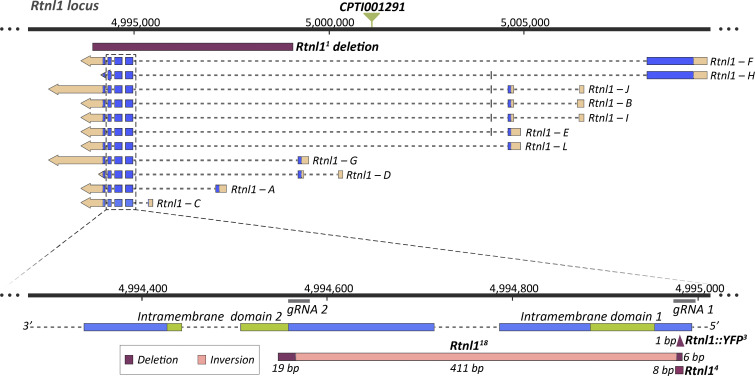
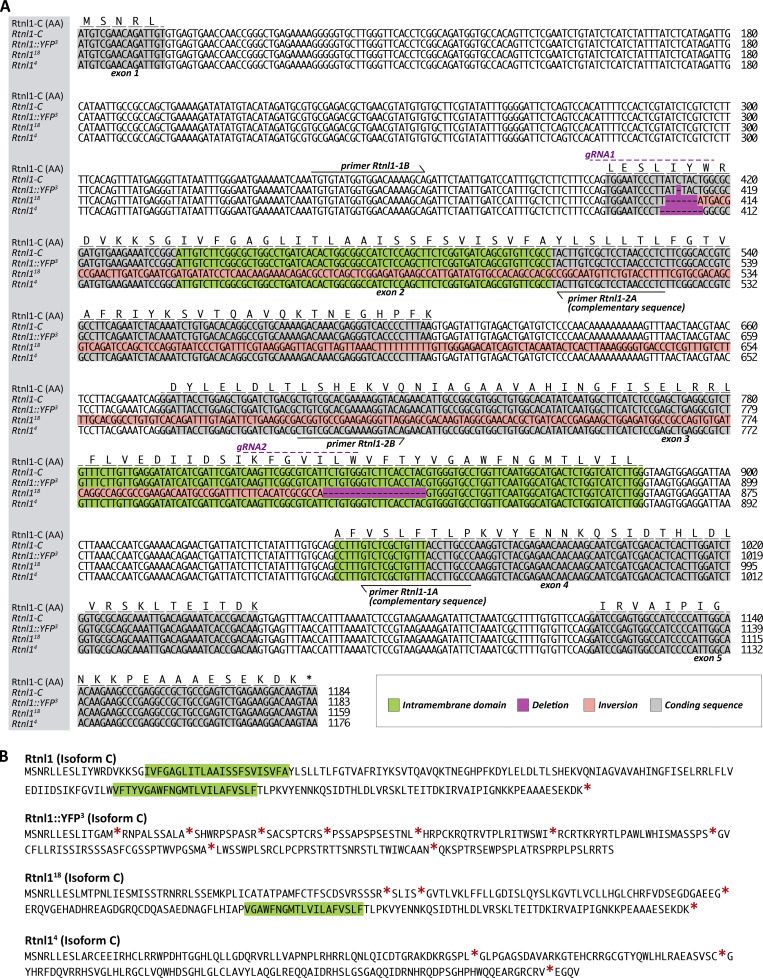
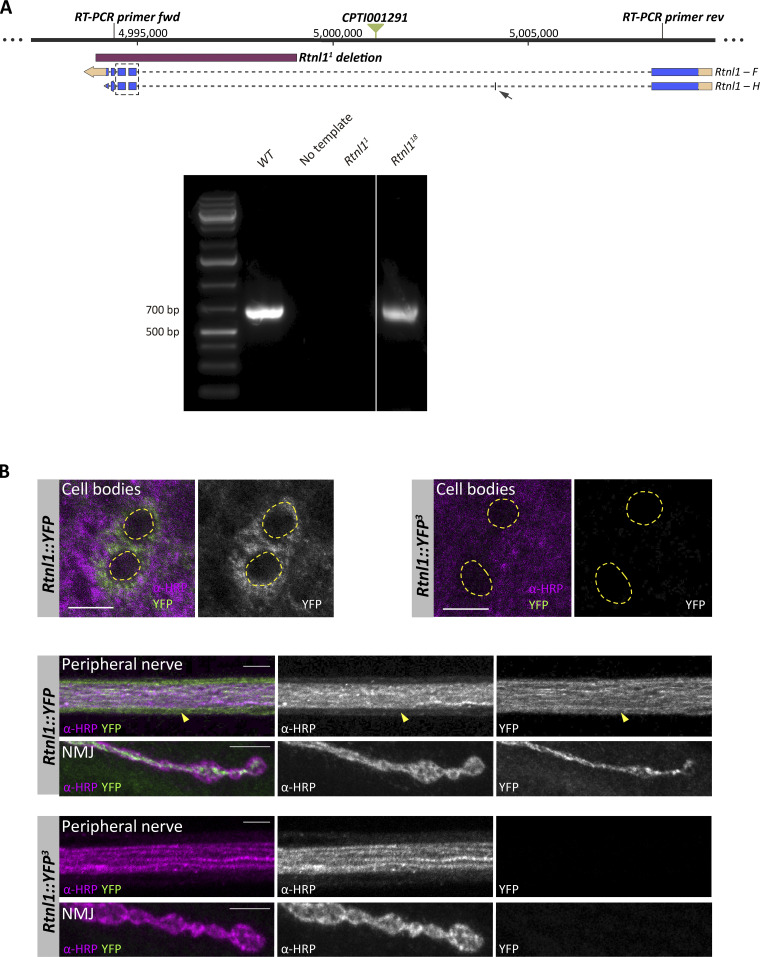
To understand how Rtnl1 contributes to presynaptic ER organization and physiology, we generated new mutant alleles of Rtnl1. We had previously analyzed a loss-of-function allele, Rtnl11 (Wakefield and Tear, 2006), with an internal deletion of around 5 kb (Yalçın et al., 2017) and obtained ER phenotypes that were broadly consistent with those of RNAi knockdown, but obtained only partial rescue using a genomic Rtnl1 construct (O’Sullivan et al., 2012; Yalçın et al., 2017). Since additional alleles could allow us to exclude phenotypes due to second-site mutations, we generated new CRISPR/Cas9 mutant Rtnl1 alleles. We targeted these using two gRNAs, each just upstream of the sequence encoding each intramembrane domain, present in all splice variants (Figs. 1 and S1). We characterized three new alleles; one of these, Rtnl118, had multiple changes: an inversion of the region between both gRNA sequences, a 6-bp deletion at the site of the upstream gRNA, and a 19-bp deletion at the site of the downstream gRNA (Fig. 1 and Fig. S1 A). This lesion inverts the sequence encoding the first intramembrane domain; and it deletes some of the sequence encoding the second intramembrane domain, leaving only the C-terminal half of this domain potentially able to be translated from an in-frame AUG codon (Fig. S1 B). While Rtnl118 does not abolish Rtnl1 transcription (Fig. S2), it is likely to be a null allele, since the rearrangements downstream of the first gRNA site make it impossible to express more than a fragment of the protein, which lacks an intact intramembrane domain.
Figure 1.
Generation of new Rtnl1 null mutant alleles. For the different Rtnl1 splice variants, blue boxes indicate coding sequence, broken lines introns, light orange boxes UTR sequences, and arrows the direction of transcription. Green triangle indicates the position of the Rtnl1::YFP exon trap insertion (CPTI001291). Genomic coordinates are from Release 6.26 of the Drosophila melanogaster genome (http://flybase.org). Magnified detail shows exons encoding Rtnl1 intramembrane domains (green; bottom), locations recognized by gRNAs, the Rtnl118 lesion, and the 8-bp (Rtnl14) and the 1-bp (Rtnl1::YFP3) frameshift deletions, generated at the site of the upstream gRNA on Rtnl1+ and Rtnl1CPTI001291 backgrounds respectively, but not used further in this work. The length of each mutated region is shown. In Rtnl118, the region encoding the first intramembrane domain is completely disrupted by an inversion, while the initial part of the sequence encoding the second intramembrane domain is absent due to a deletion and frameshift (see Fig. S1 for more molecular details of alleles).
Figure S1.
CRISPR-derived lesions in Rtnl1 and their effects on the Rtnl1 coding region. (A) Manual alignment of the Rtnl1 transcript C for WT (Rtnl1-C), and Rtnl1::YFP3, Rtnl118 and Rtnl14 mutant CRISPR alleles, showing the amino acids (AA) encoded by the WT (Rtnl1-C) allele, the location of the gRNAs used to generate the mutant alleles, and the primers used to genotype them (see Materials and methods for details). Since the sequences encoding intramembrane domains are shared by all Rtnl1 isoforms, the shortest one, isoform C, was chosen for convenience. Sequences read from 5′ to 3′. The Rtnl1::YFP3 allele was generated from Rtnl1::YFPCPTI00291, has a 1-bp deletion/frameshift at the position of gRNA1 upstream of the first intramembrane domain, and lacks detectable YFP expression (Fig. S2); we did not use it further in this work, but it shows that frameshifts around this position can lead to loss of protein expression. The effects of Rtnl118 on the protein-coding sequence are described in the main paper. Rtnl14 has an 8-bp deletion/frameshift at the position of gRNA1, upstream of the first intramembrane domain. (B) Predicted Rtnl1-C protein sequences for the Rtnl1 alleles shown in A. Intramembrane domains are decorated in green and stop codons shown with a red asterisk.
Figure S2.
Effects of Rtnl1 mutant CRISPR alleles on Rtnl1 expression. (A) RT-PCR strategy to test presence of Rtnl1 transcripts (top). For the Rtnl1 isoforms shown, blue boxes indicate exons, broken lines indicate introns, light orange boxes indicate 5′ and-3′ UTRs, and arrows indicate the direction of transcription. A green triangle shows the position of the Rtnl1::YFP exon trap insertion (CPTI001291). Genomic coordinates are based on Release 6.26 of the D. melanogaster genome (http://flybase.org). Using the indicated primers, the expected amplicon from genomic DNA is around 14 kb. The expected amplicon for Rtnl1 transcript F is 636 bp, and for transcript H is 672 bp, due to an extra small exon (arrow). The box surrounded by a broken line shows the region containing Rtnl118 lesions. Agarose gel electrophoresis (1%) of reverse-transcribed cDNA (bottom) shows that Rtnl118 does not disrupt Rtnl1 mRNA transcription. For both WT and Rtnl118 alleles, only one amplicon is seen, which is slightly smaller in Rtnl118, due to the small deletions totaling 25 bp within the amplified region (see Fig. 1 A and Fig. S1 A for details). (B) Confocal sections of neuronal cell bodies, peripheral nerves and NMJs (muscle 1) show that Rtnl1::YFP3 mutation is enough to abolish Rtnl1::YFP expression. In cell bodies, nuclei are distinguished by the absence of α-HRP signal (dotted line regions). On the peripheral nerve, glia can be distinguished from neuronal axons due to the low levels of α-HRP signal (arrowhead). All larvae are also expressing Ib-GAL4, but this is not driving any reporter expression. Scale bars, 5 μm. Source data are available for this figure: SourceData FS2.
Rtnl1 loss-of-function decreases presynaptic ER membrane labeling
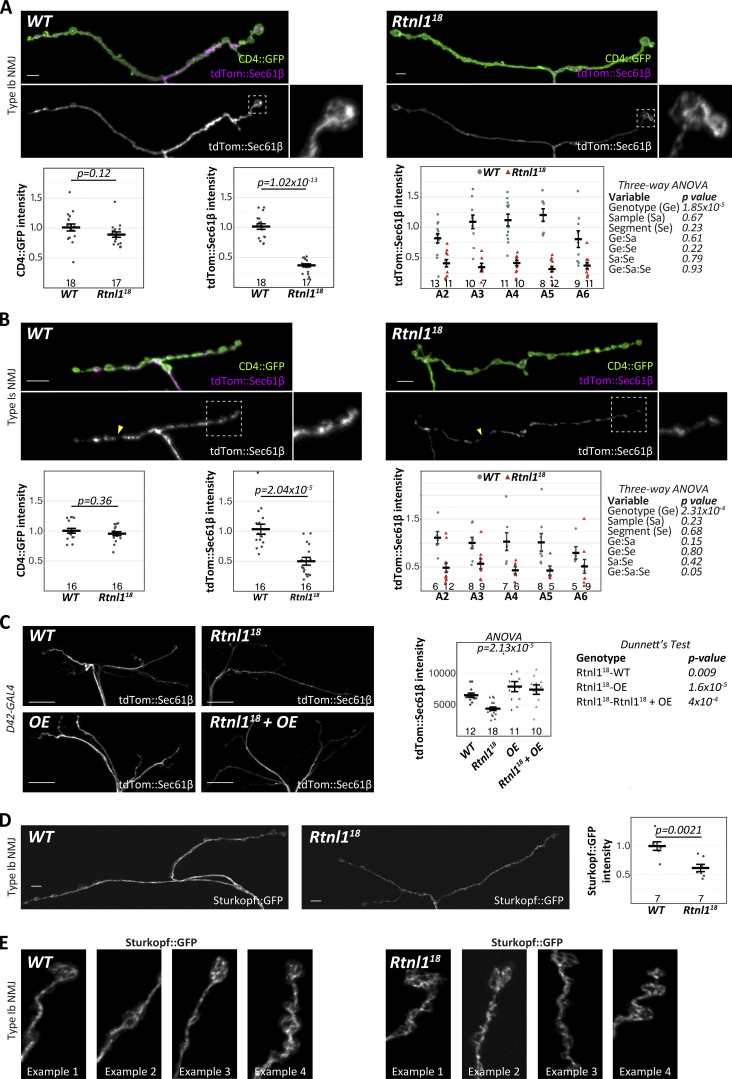
We next tested Rtnl1 mutant NMJs for altered ER distribution. We expressed tdTom::Sec61β, which labels presynaptic ER (Summerville et al., 2016), using GAL4 drivers specific for each main type of larval excitatory motor neuron (MN), Ib and Is (Pérez-Moreno and O’Kane, 2019), which differ structurally (Menon et al., 2013) and physiologically (Aponte-Santiago et al., 2020; Aponte-Santiago and Littleton, 2020; Chouhan et al., 2010). Compared with wild-type (WT) NMJs of the same genetic background, Rtnl118 showed decreased tdTom::Sec61β levels in both Type Ib (Fig. 2 A) and Is (Fig. 2 B) NMJs. This decrease was not due to lowered GAL4-dependent expression; the plasma membrane marker, CD4::tdGFP (Han et al., 2011), expressed at NMJs using the same GAL4 lines, was not affected by Rtnl118. We found a similar reduction in tdTom::Sec61β using a general MN driver, D42-GAL4 (Sanyal, 2009) in Rtnl118 NMJs (Fig. 2 C).
Figure 2.
Rtnl1 loss depletes presynaptic ER membrane markers. (A and B) Representative confocal projections and quantifications of ER marker tdTom::Sec61β in (A) Type Ib terminals on muscle 1 and (B) Type Is terminals on muscles 1–9 of WT and Rtnl118 larvae. Insets show magnified views of the areas inside broken lines. Arrowheads in B indicate gaps in tdTom::Sec61β signal. (C) Rtnl1::HA overexpression (OE) rescues the depletion of tdTom::Sec61β in Rtnl118 mutant NMJs at muscle 1/9. Since Type Ib and Is GAL4 constructs, UAS-Rtnl1::HA, and UAS-tdTom::Sec61β, are all inserted at attP2, we used D42-GAL4 which could be recombined with the UAS insertions. (D and E) Sturkopf::GFP in Type Ib muscle 1 NMJs, with intensity analyzed as above, and high magnification examples. All plots show individual larval datapoints and mean ± SEM; y-axes indicate arbitrary units (au) after normalization to WT; sample size is within the plots for each genotype. Where tdTom::Sec61β signal is compared between segments (A and B), sample size is the number of hemisegments (NMJs); for other plots, sample size is the number of larvae. For each larva, several NMJs across segments A2-A6 were randomly analyzed, and the mean value used as a larval datapoint. For each larva in C, we analyzed (but did not distinguish) Type Ib and Is branches on muscles 1 and 9 in a single segment chosen randomly between A4-A6. Student’s t tests were used for pairwise comparisons; ANOVA was used as shown for comparisons of more than two categories, or of multiple factors, with Dunnett’s post-hoc testing where appropriate. Scale bars for A, B, and D are 5 μm; for C, 20 μm. Insets in A and B are 8 × 8 μm. Panel width in E is 10 μm. Genotypes: A and B, GAL4, UAS-CD4::tdGFP/UAS-tdTom::Sec61β; C, D42-GAL4, UAS-tdTom::Sec61β and D42-GAL4, UAS-tdTom::Sec61β/UAS-Rtnl1::HA in either Rtnl1+ (WT) or Rtnl118 background (OE and Rtnl118 + OE respectively); D–E, Ib-GAL4, UAS-Sturkopf::GFP/+; all in either a WT or Rtnl118 background.
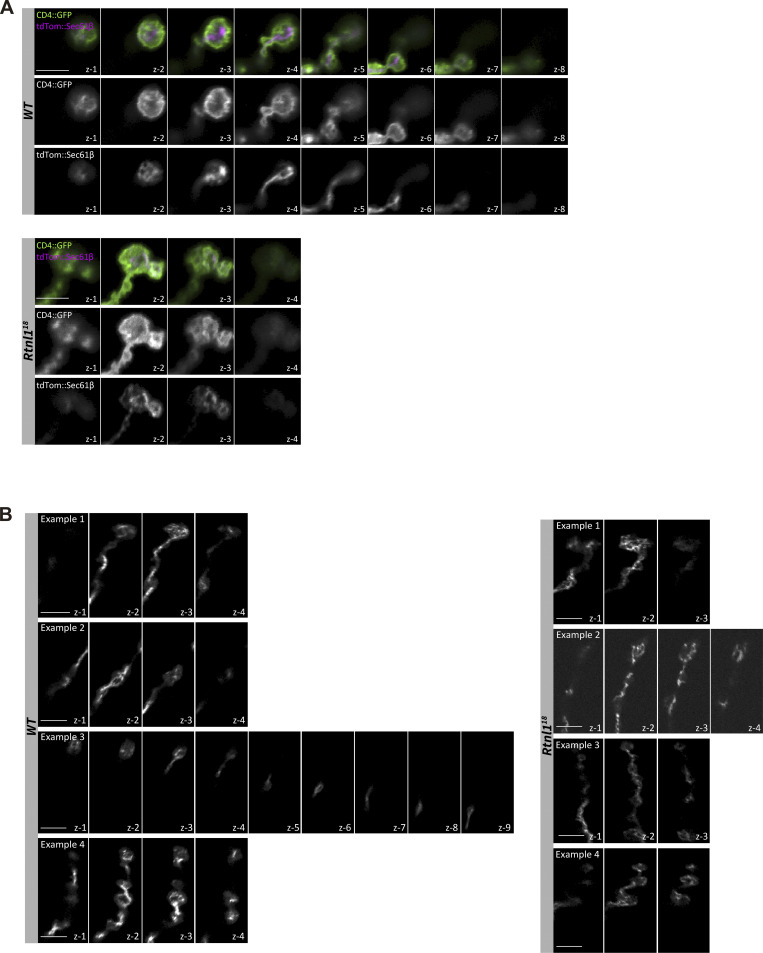
Loss of Rtnl1 reduces ER levels specifically in distal long motor axons (O’Sullivan et al., 2012; Yalçın et al., 2017); however, lowered presynaptic tdTom::Sec61β levels in Rtnl118 NMJs were independent of motor axon length (Fig. 2, A and B). Rtnl118 presynaptic terminals still showed an interconnected and mostly continuous ER network (insets in Fig. 2 A and Fig. S3 A), with a distribution resembling that of WT. These findings suggest that loss of Rtnl1 leads to less presynaptic ER membrane, but that its general organizational features are unaffected. The phenotype appears to affect ER membrane in general rather than tdTom::Sec61β in particular; a second ER membrane marker, Sturkopf::GFP (Thiel et al., 2013; Yalçın et al., 2017), also showed decreased levels in Rtnl118 NMJs (Fig. 2 D), and an apparently normal ER network organization (Fig. 2 E and Fig. S3 B). Type Is terminals, but not Type Ib, showed occasional apparent gaps in the ER network (Fig. 2 B) in both WT and Rtnl118 NMJs, perhaps due to having a smaller ER network that is more sensitive to partial loss of tubules.
Figure S3.
Rtnl1 loss does not noticeably disrupt presynaptic ER network organization. (A) Confocal sections (z steps, 1 μm) of the projections presented in the magnified areas of Fig. 2 A, showing the distribution of the ER marker tdTom::Sec61β in Type Ib muscle 1 NMJ of WT and Rtnl118 larvae. CD4::GFP labels the plasma membrane. Genotypes are Ib-GAL4, UAS-CD4::tdGFP/UAS-tdTom::Sec61β, in either a WT or Rtnl118 background. (B) Confocal sections (z steps, 1 μm) of the projections presented in the magnified areas of Fig. 2 E, showing the distribution of the ER marker Sturkopf::GFP in Type Ib muscle 1 NMJ of WT and Rtnl118 larvae. Genotypes are Ib-GAL4, UAS-Sturkopf::GFP/+, in either a WT or Rtnl118 background. Scale bars, 5 μm.
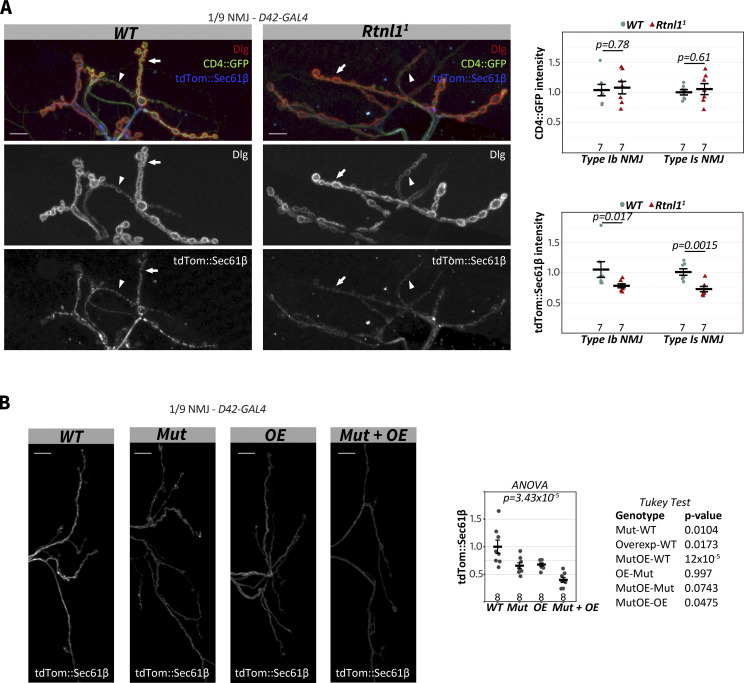
The partial depletion of ER membrane was specifically due to loss of Rtnl1. First, we also observed it at Type Ib and Type Is NMJs in a second mutant allele, Rtnl11 (Fig. S4 A). Second, the expression of UAS-Rtnl1::HA (Summerville et al., 2016) under GAL4 control fully rescued tdTom::Sec61β levels in Rtnl118 NMJs (Fig. 2 C). Surprisingly, a UAS-Rtnl1::GFP construct (Rao et al., 2016), appeared to be dominant negative; it produced a similar tdTom::Sec61β decrease as Rtnl1 loss-of-function, and even made a Rtnl1 loss-of-function phenotype slightly more severe (Fig. S4 B). Taken together, our results in a variety of genotypes and with two different markers support the conclusion that Rtnl1 controls presynaptic ER levels.
Figure S4.
Effects of Rtnl1 mutant alleles on presynaptic tdTom::Sec61β levels. (A) Representative examples of confocal projections and quantifications of WT and Rtnl11 larvae showing the distribution of the ER marker tdTom::Sec61β in Type I NMJs (muscles 1/9 NMJ). Samples were immunostained for tdTom, GFP, and Dlg to distinguish between Type Ib (arrows) and Type Is (arrowheads) NMJs. Genotypes: D42-GAL4, UAS-tdTom::Sec61β, UAS-CD4::tdGFP/+, in either WT or Rtnl11 background. (B) Representative examples of confocal projections and quantification of WT, Mut, OE, and Mut + OE larvae showing the distribution of the ER marker tdTom::Sec61β in Type I NMJs (muscles 1/9 NMJ). Genotypes: WT - Rtnl1+; D42-GAL4, UAS-tdTom::Sec61β/+, Mut - Rtnl118/Rtnl11; D42-GAL4, UAS-tdTom::Sec61β/+ OE - Rtnl1+; D42-GAL4, UAS-Rtnl1::GFP/UAS-tdTom::Sec61β Mut + OE-Rtnl118/Rtnl11 ; D42-GAL4, UAS-Rtnl1::GFP/UAS-tdTom::Sec61β. For A and B, plots show individual larval datapoints and mean ± SEM; y-axis indicates arbitrary units (au) after normalization to control (WT); sample size (number of larvae) is indicated within the plots for each genotype. For each larva, several NMJs between A2-A6 segments were analyzed, and the mean value is shown as a larval datapoint. Student’s t tests were performed for pairwise comparisons, except for tdTom::Sec61β intensity in Type Ib NMJ comparison (A), where a Mann-Whitney U test was performed. Scale bars, 10 μm.
Rtnl1 loss-of-function specifically decreases presynaptic tubular ER network
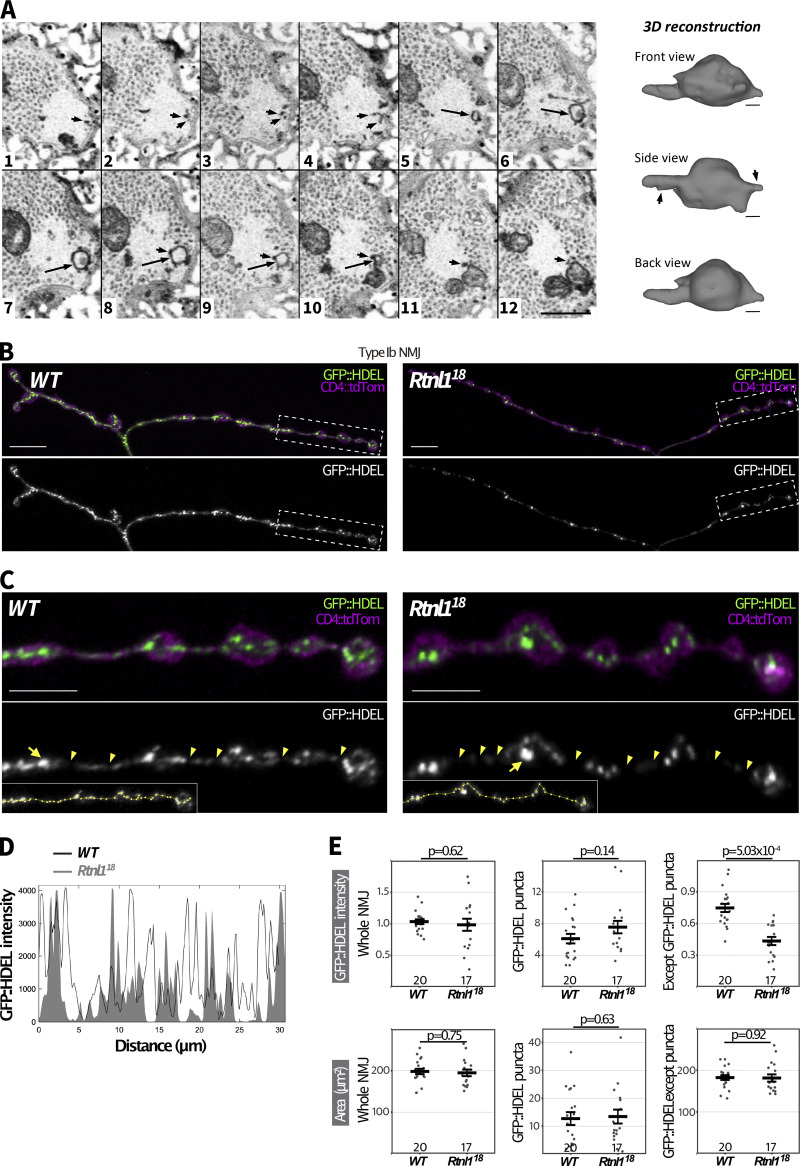
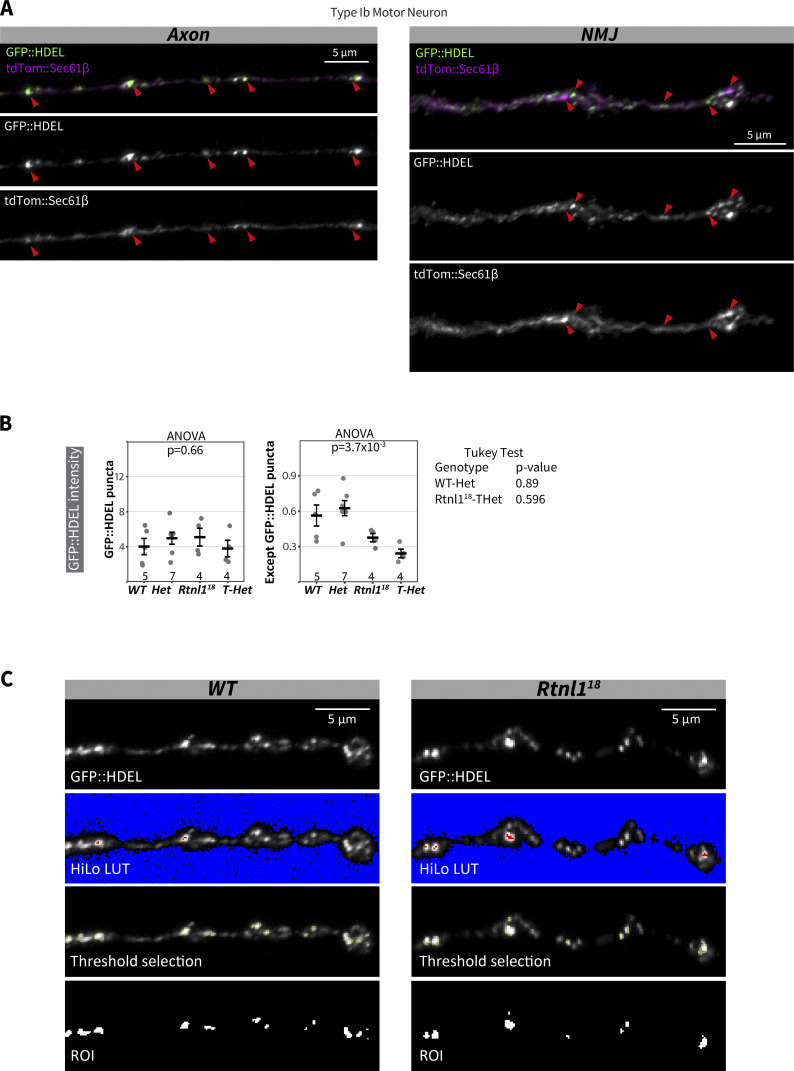
The reduced levels of ER membrane markers in Rtnl1 mutants contrasted with the unchanged resting fluorescence of the Ca2+ sensor GCaMP6-210 in the ER lumen, on loss of multiple ER-shaping proteins including Rtnl1 (Oliva et al., 2020). While the fluorescence of GCaMP6-210 is also Ca2+-dependent, we hypothesized that the role of reticulons in generating highly curved ER tubules (Voeltz et al., 2006) might explain the apparent discrepancy by preferentially removing ER tubules compared to cisternae, due to their greater curvature, in Rtnl1 mutant NMJs. Similar to mammalian neurons (Wu et al., 2017), we observed both ER tubules with a lumen too small to be visible (as reported previously in axons [Terasaki, 2018; Yalçın et al., 2017]) and cisternae with a larger lumen, in presynaptic motor terminals, using electron microscopy (Fig. 3 A). Tubules were observed most clearly in regions of the bouton where synaptic vesicles (SVs) were sparse, but harder to distinguish from SVs in regions of the bouton that were rich in SVs due to the similar diameters of ER tubules and SVs, thus preventing reconstruction of the whole ER network. Using the ER lumen marker BiP::sfGFP::HDEL (Summerville et al., 2016), hereafter referred to as GFP::HDEL, we observed larger and brighter puncta that we interpret as cisternae with a large lumen, joined by stretches of fainter signal that we interpret as ER tubules with a narrow lumen, that we observed using electron microscopy (Fig. 3, B–D). These bright puncta often, but not always, overlap with puncta of tdTom::Sec61β (Fig. S5 A), suggesting that enrichment of these two markers highlights different features of ER that are sometimes found together—indeed, electron microscopy of axonal ER shows both cisternae (with a noticeable lumen) and small sheets (without a noticeable lumen) that are sometimes, but not always, apposed to each other (Yalçın et al., 2017).
Figure 3.
Rtnl1 loss causes localized depletion of presynaptic ER lumenal marker. (A) A series of 12 serial ATUMtome 50-nm sections through a ROTO-stained larval bouton, visualized by scanning EM and inverted grayscale images. An example is shown of a cisterna (large arrows in sections 5–10) that appears to be continuous with tubules in the same and neighboring sections (smaller arrows), in a region with few synaptic vesicles. Tubules are identified as darkly staining puncta in successive sections; their lumen is too small to detect using this method (Terasaki, 2018; Yalçın et al., 2017). Scale bar in panel 12, 500 nm. The cisterna highlighted by the large arrow and its attached tubules (arrows in “Side View”) were used to generate a reconstruction, shown on the right and viewed from three different angles. EM section 1 is on the left of the reconstruction, section 12 on the right. Scale bars, 70 nm. Larval genotype is Rtnl118/WT. (B) Representative confocal projections showing GFP::HDEL in Type Ib muscle 1 NMJs of WT and Rtnl118 larvae. Scale bars, 10 μm. (C) Magnified views of the areas inside broken lines in B. Scale bars, 5 μm. Arrowheads indicate regions with low levels of GFP::HDEL, which we interpret as tubules, and arrows indicate examples of puncta which we interpret as cisternae. (D) Insets show the lines drawn along GFP::HDEL signal to plot intensity profiles. (E) GFP::HDEL intensity across the whole NMJ, within an ROI containing all puncta, and in the NMJ excluding the puncta ROI. Plots show individual larval datapoints and mean ± SEM; intensity levels indicate arbitrary units (au) after normalization to control (WT); intensity values are relative to CD4::tdTom (Han et al., 2011) signal. Larval datapoints were calculated and are shown and compared using Student’s t tests as in Fig. 2. Genotypes are Ib-GAL4, UAS-CD4::tdTom/UAS-BiP::sfGFP::HDEL, in either a Rtnl1+ (WT) or Rtnl118 background. Transheterozygous Rtnl118/Rtnl11 mutant larvae also showed a similar phenotype to Rtnl118 (Fig. S5 B).
Figure S5.
GFP::HDEL distribution. (A) Representative examples of confocal projections of WT larvae showing the distribution of the ER markers tdTom::Sec61β and GFP::HDEL in a Type Ib motor neuron. Genotype: Rtnl1+/UAS-tdTom::Sec61β; Ib-GAL4/UAS-GFP::HDEL. (B) Quantification of the ER marker GFP::HDEL in Type I NMJs (muscles 1/9 NMJ) of WT, Het, Rtnl118, and T-Het larvae. Genotypes: WT—Rtnl1+; Ib-GAL4, UAS-CD4::tdTom/UAS-GFP::HDEL Het - Rtnl1+/Rtnl118; Ib-GAL4, UAS-CD4::tdTom/UAS-GFP::HDEL Rtnl118 - Rtnl118; Ib-GAL4, UAS-CD4::tdTom/UAS-GFP::HDEL T-Het - Rtnl118/Rtnl11 ; Ib-GAL4, UAS-CD4::tdTom/UAS-GFP::HDEL. Plots show individual larval datapoints and mean ± SEM; y-axis indicates arbitrary units (au) after normalization to control (WT); intensity values are relative to CD4::tdTom signal; sample size (number of larvae) is indicated within the plots for each genotype. For each larva, several NMJs between A2-A6 segments were analyzed, and the mean value is shown as a larval datapoint. (C) Representative examples showing the selection of GFP::HDEL puncta in confocal projections of Type Ib muscle 1 NMJ (magnified areas from Fig. 3 C). HiLo lookup table (LUT) shows saturated pixels in red and pixels with no detectable signal in blue. Intermodes thresholding of GFP::HDEL intensity was used to select only those regions with high GFP::HDEL levels (region of interest, ROI). Genotypes are Ib-GAL4, UAS-CD4::tdTom/UAS-BiP::sfGFP::HDEL, in either a Rtnl1+ (WT) or Rtnl118 background.
In Rtnl118 NMJs, labeling of bright GFP::HDEL puncta was not affected, but labeling between puncta was significantly decreased compared to WT (Fig. 3, B–E and Fig. S5 B). We concluded that the tubular ER network, but not the amount or volume of ER cisternae, is reduced in Rtnl1 mutant NMJs; and that the stronger depletion of ER membrane markers in Rtnl1 mutant genotypes reflects the higher proportion of these markers in tubules compared to cisternae, due to the high surface area/volume ratio of presynaptic ER tubules.
Rtnl1 loss reduces STIM-mediated ER-PM contact sites
The decreased levels of ER membrane and tubules, but not cisternae, in Rtnl1 mutant presynaptic termini provided a unique model to explore the specific functional and physiological roles of presynaptic ER tubules. Since contact sites must depend on availability of ER membrane, we first tested two critical roles of ER-PM contact sites, in lipid and Ca2+ exchange between both compartments (Öztürk et al., 2020).
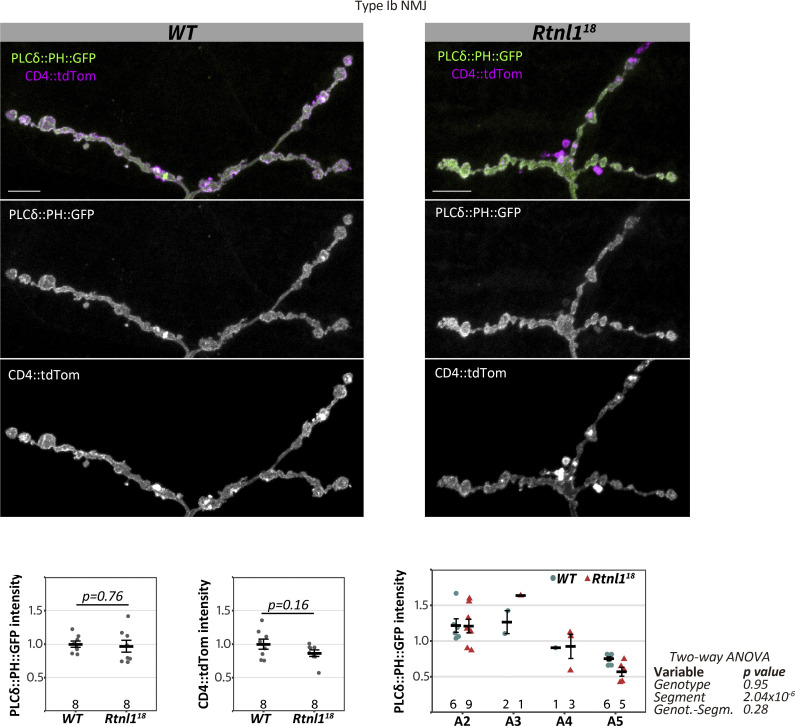
The PM phospholipid phosphatidylinositol 4,5-bisphosphate (PI(4,5)P2) is derived from phosphatidylinositol (PI) formed at the ER membrane. PI(4,5)P2 binds to ER membrane proteins to mediate ER-PM tethering (Muallem et al., 2017), and it is also required for presynaptic function (Lauwers et al., 2016). However, using the sensor PLCδ::PH::GFP (Verstreken et al., 2009), we did not detect any difference in PI(4,5)P2 levels between WT and Rtnl1 NMJs (Fig. S6). Although we cannot exclude that other ER-PM contact-site-dependent lipids are affected in Rtnl1 mutants, a decrease in presynaptic tubular ER does not necessarily impact lipid homeostasis.
Figure S6.
Rtnl1 loss does not affect presynaptic PI(4,5)P2 levels. Representative examples of confocal projections and quantifications of WT and Rtnl118 larvae showing the distribution of the PI(4,5)P2 marker PLCδ::PH::GFP in Type Ib muscle 1 NMJ. Scale bars, 10 μm. Plots show individual larval datapoints and mean ± SEM; y-axis indicates arbitrary units (au) after normalization to control (WT); sample size (larvae) is indicated within the plot for each genotype. For each larva, several NMJs between A2-A6 segments were analyzed, and the mean larval value is shown as a datapoint. Student’s t tests were performed for pairwise comparisons. Genotypes are Ib-GAL4, UAS-CD4::tdTom/UAS-PLCδ::PH::GFP, in either a Rtnl1+ (WT) or Rtnl118 background.
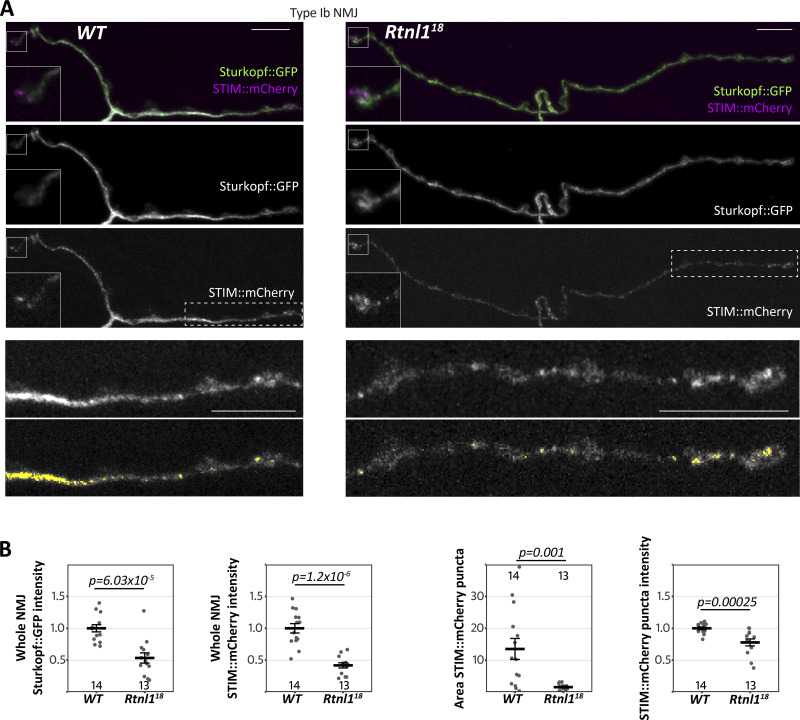
ER-PM contact sites can also mediate Ca2+ exchange. STIM proteins are ER Ca2+ sensors that can also bind to the PM at ER-PM contact sites, promoting SOCE upon emptying of ER Ca2+ stores (Serwach and Gruszczynska-Biegala, 2020). STIM proteins are distributed throughout the ER membrane, but enriched at ER-PM contacts, which increase in number when ER is depleted of Ca2+ (Liou et al., 2005; Shen et al., 2021). Drosophila has one STIM gene, orthologous to mammalian STIM1 and STIM2 (Williams et al., 2001). In WT motor neuron terminals, STIM::mCherry (Bi et al., 2014) showed, as expected, a mostly continuous distribution, with some foci characteristic of STIM accumulation at ER-PM contact sites. STIM:mCherry levels were generally reduced in Rtnl1 NMJs (Fig. 4), like other ER membrane markers (Fig. 2), consistent with less presynaptic ER surface. STIM::mCherry foci were slightly less intense and took up less area in Rtnl1 mutants than in WT larvae, suggesting a reduction of these ER-PM contact sites (Fig. 4), and that Ca2+ stores are not depleted in Rtnl1 mutants. STIM::mCherry foci area was highly variable among wild-type NMJs, but consistently low in Rtnl1 NMJs, suggesting that WT presynaptic ER could be responding to physiological demands (e.g., variable emptying of ER Ca2+) by adjusting the number of STIM-containing ER-PM contact sites.
Figure 4.
Rtnl1 loss depletes presynaptic STIM and reduces STIM foci. (A) Representative confocal projections showing the ER markers STIM::mCherry and Sturkopf::GFP in Type Ib muscle 1 NMJs of WT and Rtnl118 larvae. Insets in the top three rows show a magnified view of terminal boutons. Bottom panels show magnified views of the areas indicated with a broken line. Areas of elevated STIM (“foci”) are sometimes punctate and sometimes extended and are highlighted in yellow in the bottom panels. Scale bars, 10 μm. Insets, 6 × 6 μm. (B) Plots show individual larval datapoints and mean ± SEM; intensity levels indicate arbitrary units (au) after normalization to control (WT). Larval datapoints were calculated and are shown as in Fig. 2; Except for Sturkopf::GFP intensity (Student’s t test), pairwise comparisons were performed with Mann–Whitney U tests. Genotypes are Ib-GAL4, UAS-Sturkopf::GFP/UAS-STIM::mCherry, in either a WT or Rtnl118 background.
Rtnl1 loss reduces neurotransmitter release and evoked presynaptic Ca2+ influx by impairing STIM-dependent ER-PM contacts
Synaptic strength is regulated by Ca2+, both extracellular and in the ER. Alterations to ER as the largest intracellular Ca2+ store could therefore potentially alter presynaptic Ca2+ physiology, with consequences for processes such as synaptic strength and ATP generation that could contribute to neurodegeneration in conditions including the HSPs. However, since the levels of the lumenal marker GFP::HDEL (Fig. 3) and the lumenal Ca2+ sensor GCaMP-210 (Oliva et al., 2020) are relatively unaffected by loss of Rtnl1, processes that depend simply on the amount or capacity of presynaptic ER Ca2+ storage might not necessarily be affected. We therefore tested how far synaptic function and presynaptic Ca2+ fluxes were affected by the loss of Rtnl1, which reduced presynaptic ER membrane and ER tubules, but left ER volume and Ca2+ storage capacity largely intact.
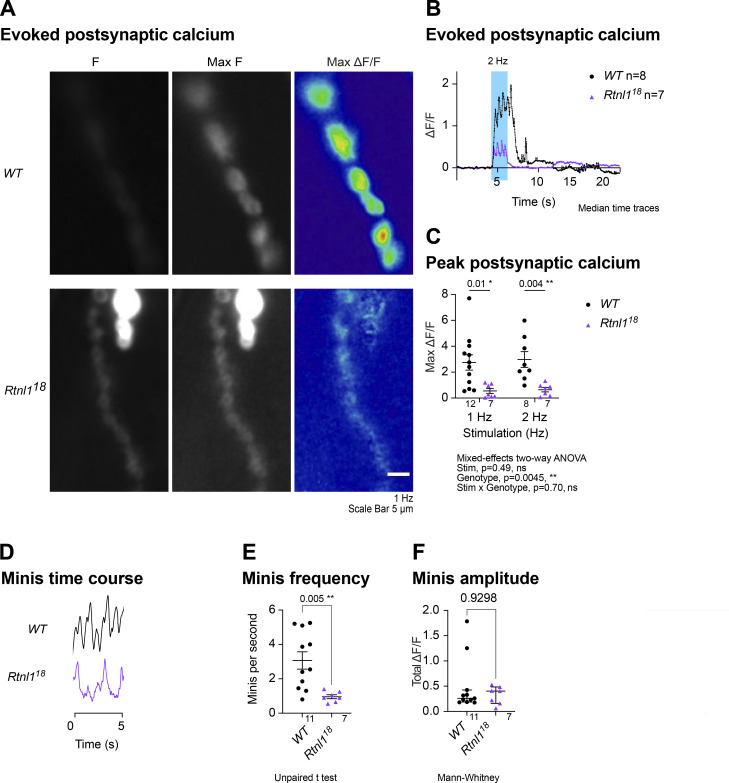
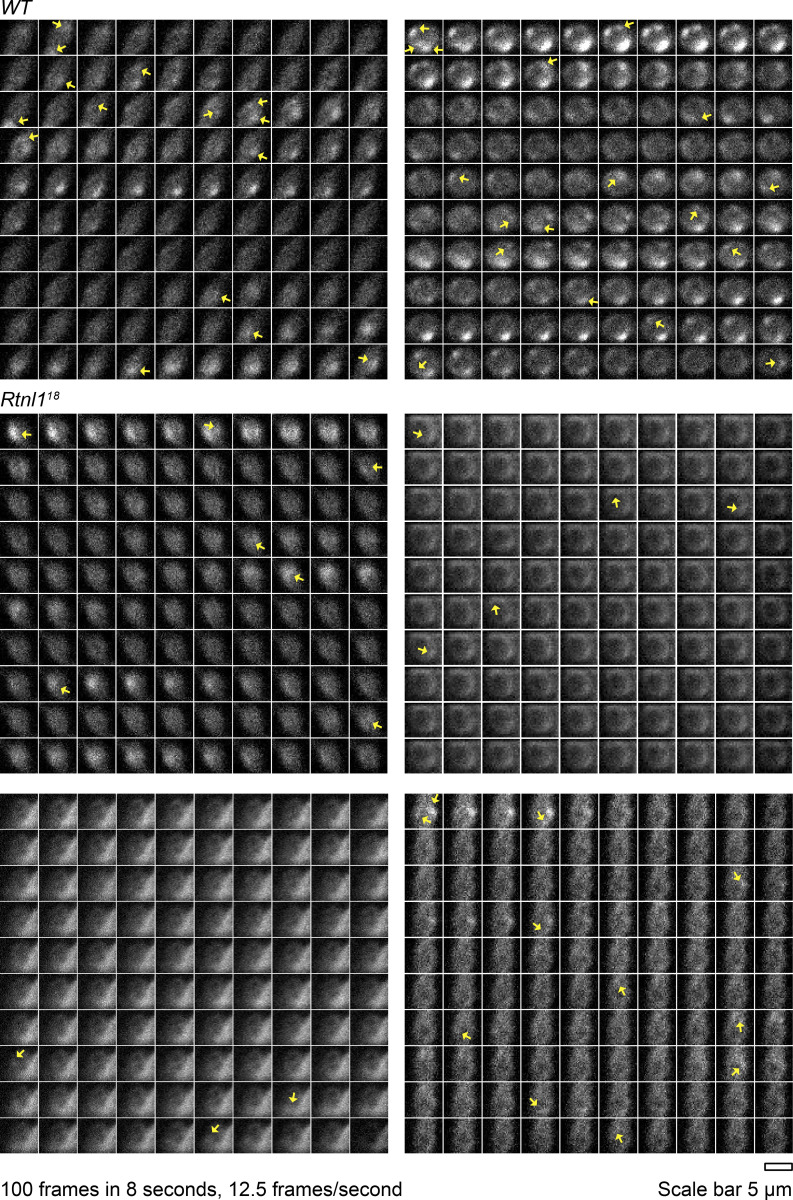
We first tested a readout of synaptic transmission using a Ca2+ indicator inserted in the postsynaptic muscle membrane, Mhc-SynapGCaMP6f (Newman et al., 2017). Rtnl1 loss caused a large decrease in postsynaptic Ca2+ responses to low-frequency stimulation, suggesting decreased presynaptic neurotransmitter release (Fig. S7, A–C; and Videos 1 and 2). This result is consistent with strongly reduced EJP amplitudes in Rtnl11 NMJs (Summerville et al., 2016). Loss of Rtnl1 also strongly reduced the frequency of miniature transmission (spontaneous vesicle release, seen as transient highly localized elevations in SynapGCaMP6f fluorescence; Fig. S7, D and E; and Fig. S8; and Videos 3 and 4). Loss of Rtnl1 had no effect on the amplitude of miniature transmission (Fig. S7 F) indicating that loss of Rtnl1 does not change neurotransmitter load per vesicle.
Figure S7.
Rtnl1 loss impacts synaptic transmission. (A) GCaMP fluorescence at rest (F), maximum fluorescence (Max F) in response to 1 Hz stimulation, and maximum change in fluorescence (Max ΔF) in examples of WT and Rtnl118 at muscle 1, Type Is postsynaptic terminals. (B) Impact of Rtnl1 loss-of-function on peak evoked postsynaptic Ca2+. Plot shows the median responses to a burst of 2 Hz stimulation of larvae from each genotype. (C) Impact of Rtnl1 loss-of-function on peak evoked postsynaptic Ca2+ responses. Plot shows individual larval datapoints and mean ± SEM; datapoints represent the largest ΔF/F reached after either a 1 Hz or 2 Hz stimulation during the recording. Comparisons were analyzed with a mixed-effects two-way ANOVA. (D) Impact of Rtnl1 loss-of-function on postsynaptic resting miniature responses (minis). Plots show representative time traces (close to the mean stimulation frequency) over 5 s from the distal bouton during the recording collected. (E) Impact of Rtnl1 loss-of-function on minis frequency. Plot shows individual larval datapoints and mean ± SEM. Frequency datapoints represent the number of minis per second over a 5-s recording. Pairwise comparison was performed using Student’s t test. (F) Rtnl1 loss-of-function did not affect minis amplitude. Plot shows individual larval datapoints and median ± interquartile ranges. For each larva in E and F, minis from a 20-s recording from the distal bouton of one NMJ between segments A4-A6. Amplitude datapoints represent the largest ΔF/F over the recording. Pairwise comparison was performed using Mann–Whitney U-test (maximum mini amplitude). (B–F) Sample size (larvae) is indicated within each plot for each genotype. Each recording was from one muscle 1, Type Is NMJ between segments A4-A6. Genotypes are Is-GAL4, mhc-SynapGCaMP6f/UAS-tdTom::Sec61β, in either a WT or Rtnl118 background.
Video 1.
WT postsynaptic Ca2+ response to low-frequency stimulation. Evoked postsynaptic Ca2+ response to a 1 Hz stimulation. Genotype is WT; Is-GAL4, Mhc-SynapGCaMP6f/UAS-tdTom::Sec61β. In this and in all subsequent videos, Ca2+ sensor GCaMP is in green, ER marker tdTom::Sec61β in magenta; time is shown in seconds, and stimulation period (when present) as “STIM”; scale bar, 10 µm.
Video 2.
Rtnl1 mutant postsynaptic Ca2+ response to low-frequency stimulation. Evoked postsynaptic Ca2+ response to a 1 Hz stimulation. Genotype is Rtnl118; Is-GAL4, Mhc-SynapGCaMP6f/UAS-tdTom::Sec61β.
Figure S8.
Rtnl1 loss decreases miniature neurotransmission frequency. (Extended data from Fig. S7, D–E.) Representative examples (close to the median frequency) of miniature events in 100 frames over 8 s (12.5 frames/s). Panels show time-lapse GCaMP fluorescence at rest in distal boutons of muscle 1, Type Is postsynaptic terminals, in WT (two boutons) and Rtnl118 (four boutons). Arrows indicate miniature events counted. Genotypes are Is-GAL4, mhc-SynapGCaMP6f/UAS-tdTom::Sec61β, in either a WT or Rtnl118 background.
Video 3.
WT postsynaptic miniature Ca2+ events. Spontaneous postsynaptic Ca2+ at rest. Genotype is WT; Is-GAL4, Mhc-SynapGCaMP6f/UAS-tdTom::Sec61β.
Video 4.
Rtnl1 mutant postsynaptic miniature Ca2+ events. Spontaneous postsynaptic Ca2+ at rest. Genotype is Rtnl118; Is-GAL4, Mhc-SynapGCaMP6f/UAS-tdTom::Sec61β.
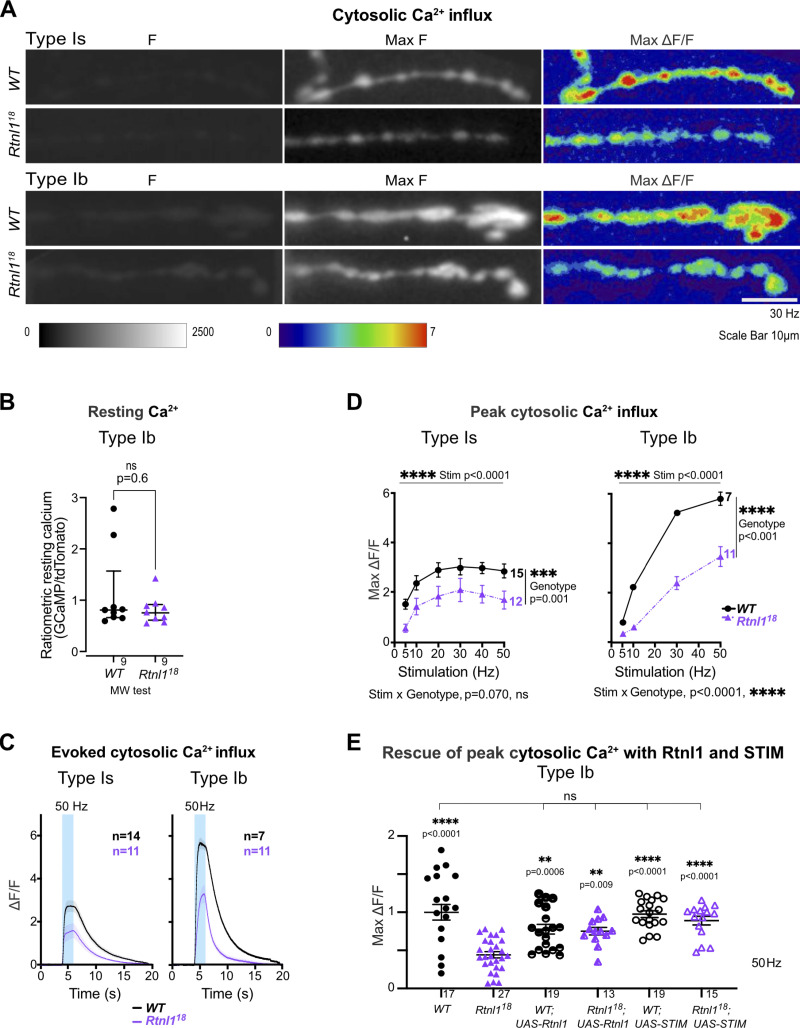
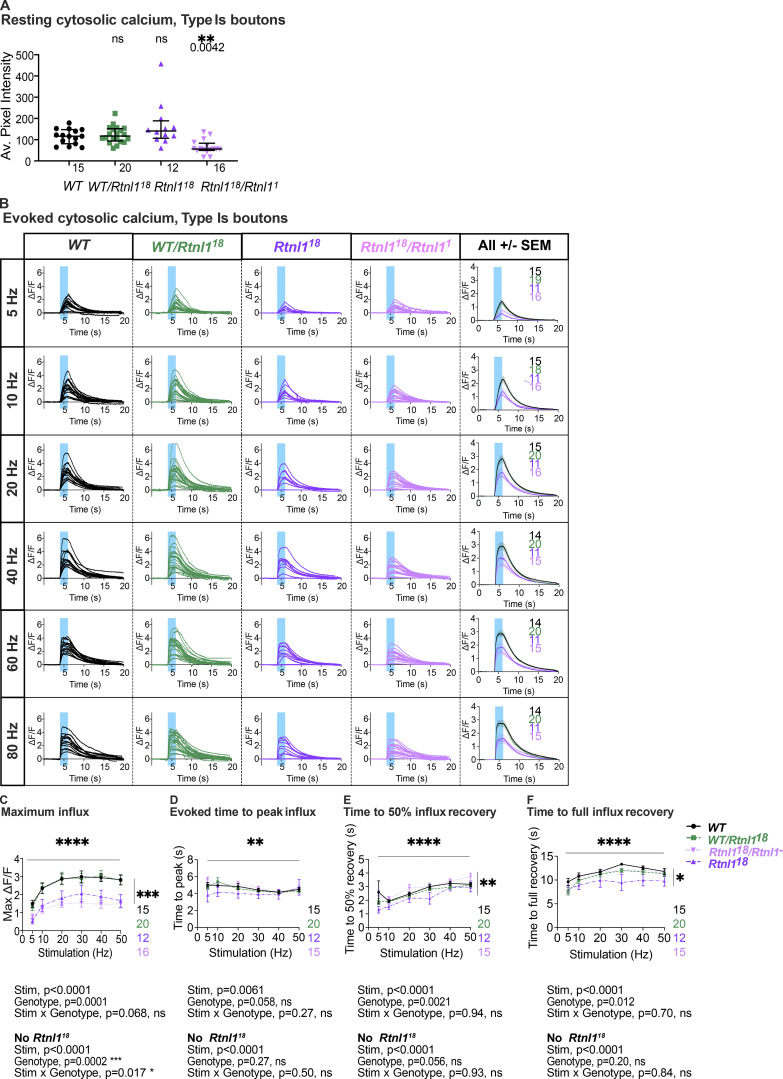
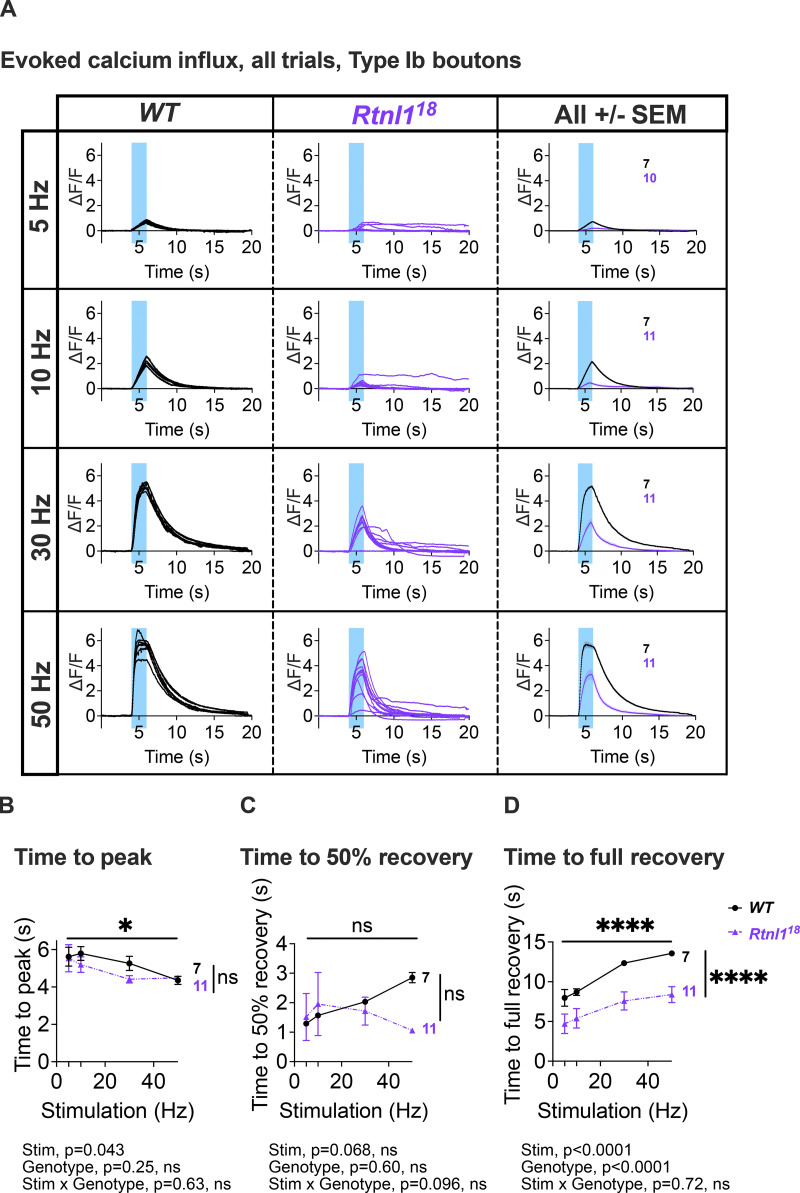
We next tested whether reduced synaptic transmission at Rtnl1 mutant NMJs could be due to low presynaptic Ca2+ responses to neuronal activity. We tested Type Ib and Is presynaptic terminals separately, due to their different physiological properties that could potentially be linked to Ca2+ storage and fluxes, and their different contributions to postsynaptic responses (Aponte-Santiago et al., 2020; Aponte-Santiago and Littleton, 2020; Chouhan et al., 2010). A Ca2+ sensor targeted to the cytosolic face of the presynaptic plasma membrane, myrGCaMP6s, showed no significant change in resting fluorescence in both Type Is and Type Ib Rtnl118 boutons compared to WT (Fig. 5 A and Fig. S9 A), indicating that Rtnl1 loss does not change resting cytosolic [Ca2+]. We corroborated this conclusion using a ratiometric cytosolic Ca2+ sensor UAS-tdTom-p2a-GCaMP56 (Daniels et al., 2014), which also detected no difference in resting cytosolic Ca2+ in Type Ib Rtnl118 boutons compared to WT (Fig. 5 B). Evoked myrGCaMP6s responses (Videos 5 and 6) were reduced in Type Ib and Is Rtnl118 boutons at all stimulation frequencies tested (Fig. 5, C and D; and Fig. S9 B; and Fig. S10 A). This reduction appeared to be due to loss of Rtnl1; it could be rescued by a UAS-Rtnl1::HA transgene (Fig. 5 E); furthermore, transheterozygous Rtnl11/Rtnl118 mutant larvae displayed the same phenotype as homozygous Rtnl118 mutants (Fig. S9, B and C). Interestingly, synaptic size was not reduced in Rtnl118 NMJs; instead, they showed a small but significant increase in the number of synaptic boutons (muscle 1 Type Ib NMJ; WT: 24.6 ± 0.5 [mean ± SEM], n = 18 larvae; Rtnl118: 27.8 ± 1.0 [mean ± SEM], n = 17 larvae; P = 0.0075**, Student’s t test), consistent with previous data from Rtnl11 (Summerville et al., 2016). Loss of Rtnl1 did not affect the dynamics of the response, as neither the time to peak response, nor the recovery half-time of Type Is or Ib boutons were affected (Fig. S9, D–F and Fig. S10, B–D). Taken together, our data suggested reduced neurotransmission in Rtnl118 NMJs. This reduced neurotransmission could potentially be accounted for by reduced evoked presynaptic cytosolic Ca2+ responses.
Figure 5.
Loss of Rtnl1 decreases evoked cytosolic Ca2+ responses in presynaptic NMJs. Cytosolic Ca2+ responses to 2 s of 30-Hz stimulation were measured at Type Is and Type Ib termini at muscle 1 in segment A4-A6, using myr::GCaMP. (A) Panels show GCaMP fluorescence at rest (F), maximum fluorescence (Max F), and maximum relative change in fluorescence (Max ΔF/F) in representative examples of WT and Rtnl118 presynaptic terminals. (B) The ratiometric cytosolic Ca2+ sensor tdTom-p2a-GCaMP56 detected no difference in resting cytosolic Ca2+ in Type Ib Rtnl118 boutons compared to WT. Graphs show individual larval datapoints for the ratio of GCaMP to Tomato fluorescence, with one Type Ib muscle 1 NMJ per larva, averaged across the responding area. Genotypes were compared using a Mann–Whitney U test, with median ± interquartile range shown. (C) Timecourses of evoked cytosolic GCaMP responses to 50 Hz stimulation (mean ± SEM of larval datapoints). (D) Loss of Rtnl1 significantly decreases cytosolic Ca2+ responses across a range of stimulation frequencies. Graph shows mean ± SEM of maximum evoked ΔF/F values (larval datapoints), with comparisons using mixed-effects model repeated-measures ANOVA. (A–D) Genotypes: Is-GAL4 or Ib-GAL4, UAS-myr::GCaMP6s/UAS-tdTom::Sec61β in either a WT or Rtnl118 mutant background. (E) Expression of UAS-Rtnl1::HA or UAS-STIM::mCherry using Ib-GAL4 rescues evoked cytosolic Ca2+ response in mutant larvae. Data were normalized to the WT mean of maximum cytosolic GCaMP responses (ΔF/F) evoked by 50 Hz stimulation, from two different microscope setups. Graph shows individual larval datapoints, with one NMJ per larva, averaged across the responding area. Genotypes: Ib-GAL4, UAS-myr::GCaMP6s/attP2+, or Ib-GAL4, UAS-myr::GCaMP6s/UAS-Rtnl1::HA, or Ib-GAL4, UAS-myr::GCaMP6s/UAS-STIM::mCherry, in either a WT or Rtnl118 mutant background; the attP2 landing site acts as a WT control for insertion of UAS-Rtnl1::HA at attP2.
Figure S9.
Rtnl1 loss decreases cytosolic Ca2+ handling in Type Is boutons. (Extended data from Fig. 5.) (A) Loss of Rtnl1 does not affect resting myrGCaMP6s fluorescence. Rtnl118/Rtnl11 flies show a decrease in myrGCaMP6s fluorescence, but this effect is not replicated in a homozygous Rtnl118 background, indicating that loss of Rtnl1 does not affect resting cytosolic Ca2+. The plot shows individual larval datapoints and median ± interquartile ranges; sample size (larvae) is indicated within the plot for each genotype. The pairwise comparison performed was a Kruskal–Wallis test. (B) Impact of Rtnl1 loss-of-function on peak evoked cytosolic Ca2+ responses. Plots show all single time traces, as well as mean ± SEM time traces in every genotype for six stimulation frequencies tested. Sample size is indicated within the plot for each genotype. (C) Rtnl1 loss of function decreases peak evoked cytosolic Ca2+. Datapoints represent mean ± SEM of the largest ΔF/F reached after stimulation during the recording, shown in B. (D) Rtnl1 loss did not affect time to peak cytosolic Ca2+. Datapoints represent the time between stimulation and peak ΔF/F. Comparisons were analyzed as in C. (E and F) Rtnl1 loss did not affect time recovery from evoked cytosolic Ca2+ influx. Although the mixed-effects two-way ANOVA records a significant genotypic effect in both time to 50% recovery (E) and 100% recovery (F), two-way ANOVAs without the Rtnl118 group erase this significance, indicating that Rtnl18/Rtnl1 transheterozygotes are not significantly different from controls in these assays and that the effect is likely due to the homozygosity of the chromosome carrying Rtnl118, and not to the loss of Rtnl1. Datapoints represent the time between peak ΔF/F and 50% or 100% recovery. Comparisons were analyzed as in C. In C–F, plots show mean ± SEM of every genotype for each stimulation frequency tested; sample size (larvae) is indicated within the plot for each genotype. For each larva, responses from a 20 s recording from one muscle 1 NMJ between segments A4-A6 were analyzed. Comparisons were analyzed with a mixed-effects two-way ANOVA. (A–F) Genotypes are Is-GAL4, UAS-myrGCaMP6s/UAS-tdTom::Sec61β, in either a WT, or Rtnl118, Rtnl118/Rtnl11, or WT/Rtnl118 background.
Video 5.
WT cytosolic Ca2+ response to stimulation. Evoked cytosolic Ca2+ response to a 30 Hz stimulation. Genotype is WT; Ib-GAL4, UAS-myr::GCaMP6s/UAS-tdTom::Sec61β.
Video 6.
Rtnl1 mutant cytosolic Ca2+ response to stimulation. Evoked cytosolic Ca2+ response to a 30 Hz stimulation. Genotype is Rtnl118; Ib-GAL4, UAS-myr::GCaMP6s/UAS-tdTom::Sec61β.
Figure S10.
Rtnl1 loss decreases cytosolic Ca2+ handling in Type Ib boutons. (Extended data from Fig. 5.) (A) Impact of Rtnl1 loss of function on peak evoked cytosolic Ca2+. Plots show all single time traces and mean ± SEM of time traces in both genotypes for the four stimulation frequencies tested. Sample size (larvae) is indicated within the plot for each genotype. (B and C) Rtnl1 loss of function does not affect time to peak cytosolic Ca2+, or time to 50% recovery. (D) Rtnl1 loss of function decreases time to 100% recovery in every stimulation frequency tested. In B–D, plots show mean ± SEM of every genotype for each stimulation frequency tested; sample size (larvae) is indicated within the plot for each genotype. For each larva, we analyzed responses from a 20-s recording from one muscle 1 NMJ between segments A4-A6. Datapoints represent the time to peak ΔF/F and 50% or 100% recovery. Comparisons were analyzed with a mixed-effects two-way ANOVA. Genotypes are Ib-GAL4, UAS-myrGCaMP6s/UAS-tdTom::Sec61β, in either a WT or Rtnl118 background.
Since STIM-mediated ER-PM contact sites are known to mediate Ca2+ exchange, and both STIM levels and foci were reduced in Rtnl1 mutants (Fig. 4), we tested whether STIM levels were associated with the observed defects in presynaptic Ca2+ influx. We found that the overexpression of STIM::mCherry in motor neurons rescued cytosolic Ca2+ influx in Rtnl1 mutants (Fig. 5 E), suggesting that the depletion of the presynaptic ER surface may lower presynaptic Ca2+ influx by downregulating STIM signaling.
Rtnl1 loss decreases evoked ER Ca2+ uptake at Type Is and Type Ib NMJs
Further, we examined whether depletion of ER tubules differentially affected ER Ca2+ fluxes in NMJs with phasic or sustained firing profiles, Type Is and Type Ib, respectively.
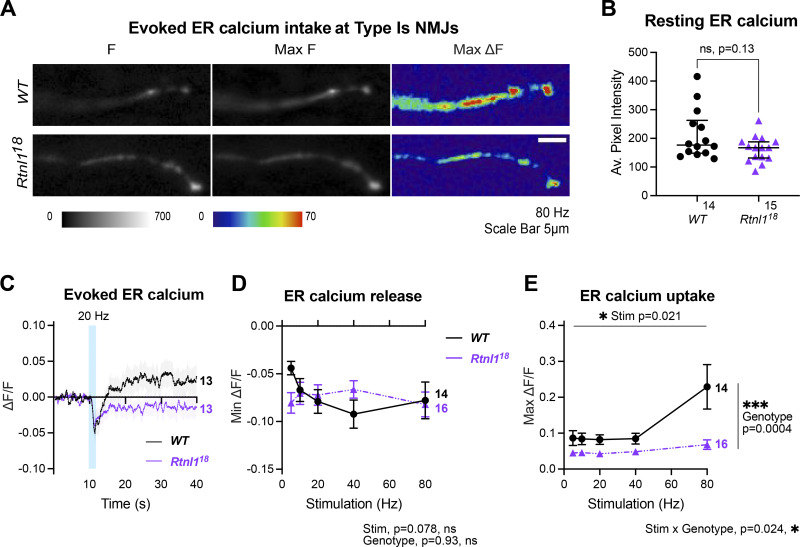
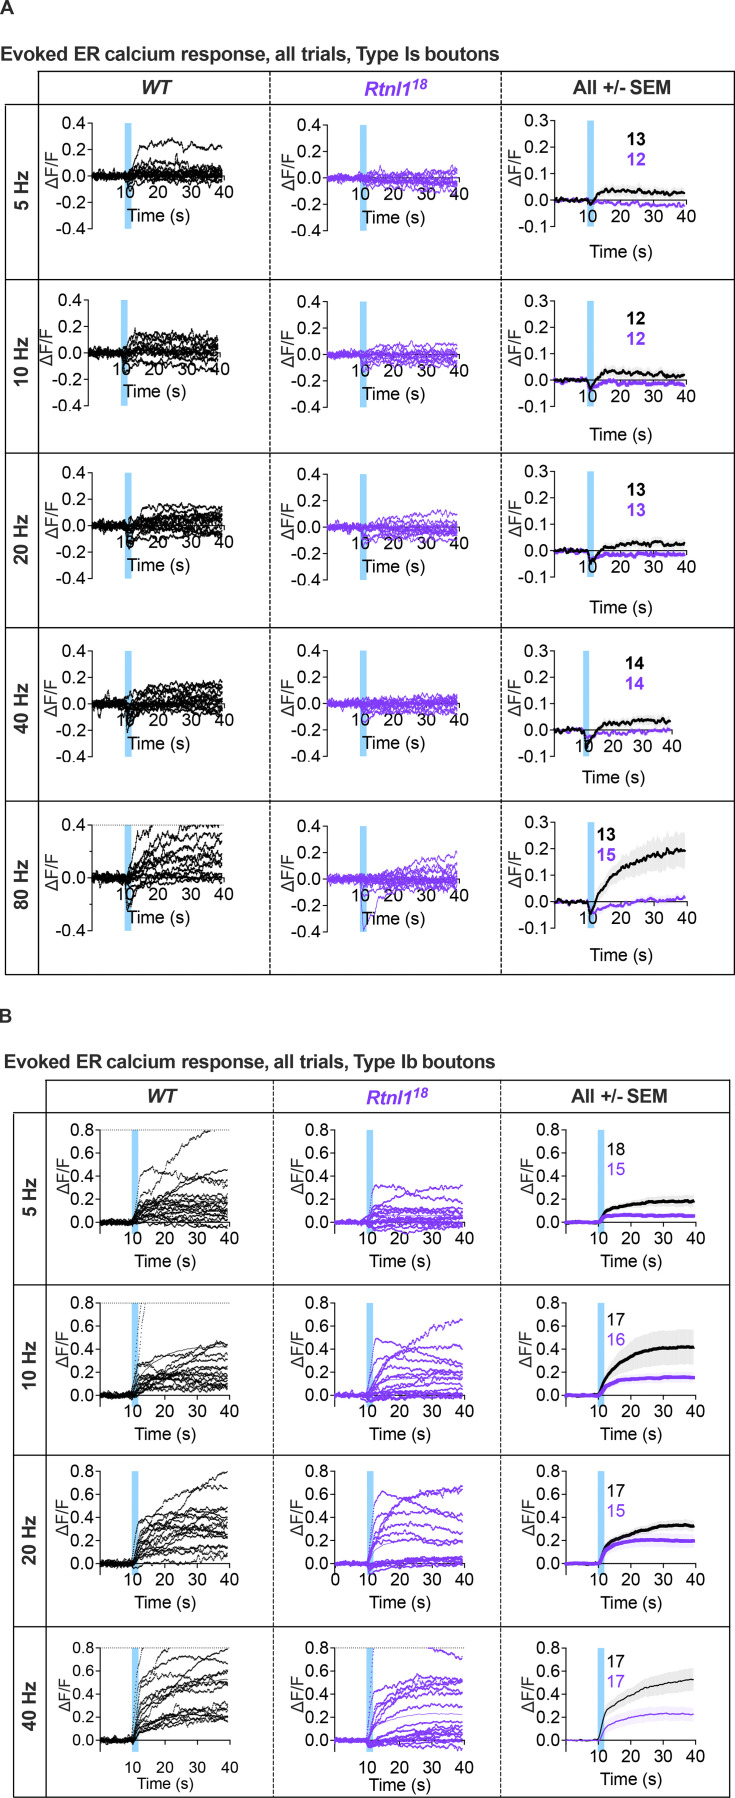
At WT Type Is terminals, an ER lumenal GCaMP6-210 reporter showed rapid transient decreases in ER lumenal fluorescence immediately after stimulation, suggesting release of Ca2+ to the cytosol evoked by repetitive stimulation, followed by a slow increase in fluorescence, which was more pronounced at higher stimulation frequencies (Fig. 6; and Video 7), and lagged and outlasted the evoked elevation of cytosolic Ca2+ (Figs. 5, S9, and S10). Rtnl1 loss did not significantly change resting fluorescence (Fig. 6, A and B), nor the rapid release (Fig. 6 C) across most stimulation frequencies, except that release was slightly higher at the lowest frequency, 5 Hz (Fig. 6 D). However, Rtnl118 mutants showed less Ca2+ uptake by ER than WT, after the initial rapid release (Fig. 6 C) across all stimulation frequencies tested (Fig. 6 E, Fig. S11 A, and Video 8), suggesting that the ER tubule depletion in Rtnl1 mutants primarily diminishes the uptake of ER Ca2+ in Type Is boutons.
Figure 6.
Rtnl1 loss decreases evoked ER Ca2+ uptake at Type Is termini. Evoked ER Ca2+ responses were measured at Type Is termini at muscle 1 in segment A4-A6. (A) Lumenal GCaMP fluorescence at Type Is NMJs, presented at rest (F), maximum fluorescence (Max F), and maximum change in fluorescence (Max ΔF) in representative examples of WT and Rtnl118 presynaptic terminals. (B) Loss of Rtnl1 does not affect resting ER Ca2+. The graph shows larval datapoints as in Fig. 5 B, with median ± interquartile ranges, compared using a Mann–Whitney U-test. (C) ΔF/F timecourse of evoked lumenal GCaMP responses to 20 Hz stimulation (mean ± SEM). (D) Loss of Rtnl1 does not affect ER Ca2+ release immediately following stimulation. The graph shows the minimum ΔF/F value after stimulation. (E) Loss of Rtnl1 significantly decreases evoked ER Ca2+ uptake over a range of stimulation frequencies. The graph shows the maximum ΔF/F value reached after stimulation. In D and E, graphs and analyses are as for Fig. 5 D. Genotypes: Is-GAL4, UAS-ER-GCaMP6-210/UAS-tdTom::Sec61β in either a WT or Rtnl118 mutant background.
Video 7.
WT ER Ca2+ response to stimulation in Is boutons. Evoked ER Ca2+ response to a 40 Hz stimulation. Genotype is WT; Is-GAL4, UAS-ER-GCaMP6-210/UAS-tdTom::Sec61β.
Figure S11.
Rtnl1 loss decreases ER Ca2+ handling in Type Is and Ib boutons. (Extended data from Figs. 6 and 7.) (A) Impact of Rtnl1 loss-of-function on evoked ER Ca2+ in Is boutons. Plots show all single time traces and mean ± SEM time traces in both genotypes for the five stimulation frequencies tested. Sample size (larvae) is indicated within the plot for each genotype. Genotypes are Is-GAL4, UAS-ER-GCaMP6-210/UAS-tdTom::Sec61β, in either a WT or Rtnl118 background. (B) Impact of Rtnl1 loss of function on evoked ER Ca2+ in Ib boutons, plotted as in A. Genotypes are Ib-GAL4, UAS-ER-GCaMP6-210/UAS-tdTom::Sec61β, in either a WT or Rtnl118 background.
Video 8.
Rtnl1 mutant ER Ca2+ response to stimulation in Is boutons. Evoked ER Ca2+ response to a 40 Hz stimulation. Genotype is Rtnl118; Is-GAL4, UAS-ER-GCaMP6-210/UAS-tdTom::Sec61β.
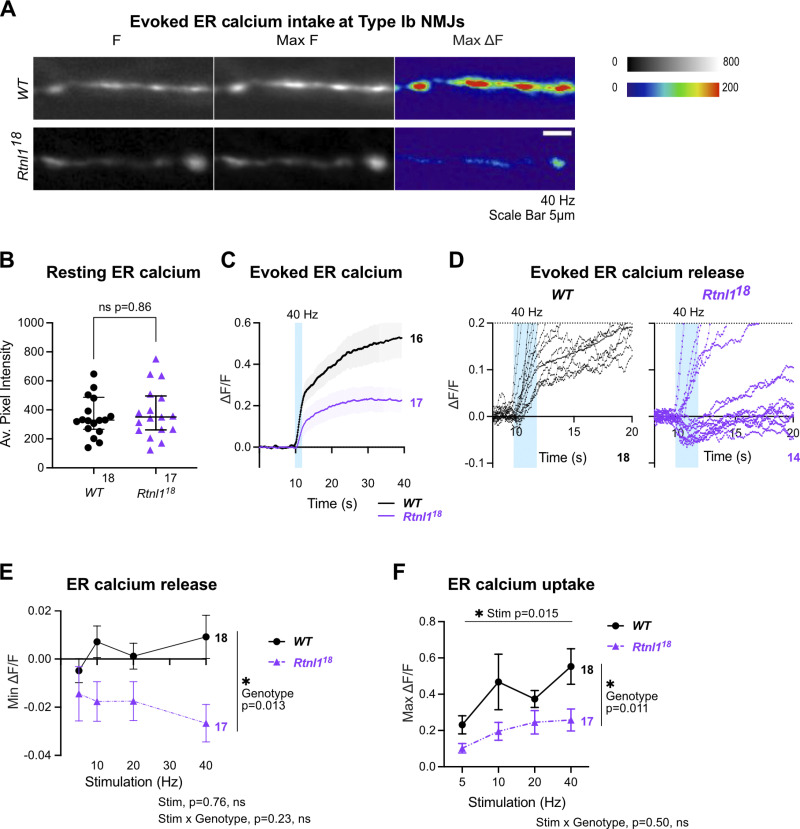
WT Type Ib terminals only occasionally showed the initial rapid evoked decrease in ER lumenal fluorescence seen in Type Is termini, and showed a strong and sustained increase in lumenal fluorescence that lagged and outlasted the cytosolic Ca2+ response, similar to Type Is boutons, but stronger (Fig. 7; and Video 9). Rtnl1 loss again did not alter resting ER lumenal GCaMP fluorescence relative to WT (Fig. 7, A and B), but often caused the initial rapid Ca2+ release to appear (Fig. 7, C and D) at every stimulation frequency tested (Fig. 7 E, Fig. S11 B, and Videos 10 and 11), and led to lower evoked ER Ca2+ uptake (Fig. 7 F), similar to Type Is termini.
Figure 7.
Rtnl1 loss decreases evoked ER Ca2+ uptake in Type Ib termini. Evoked ER Ca2+ responses were measured at Type Ib termini at muscle 1 in segment A4-A6. (A) Lumenal GCaMP fluorescence at Type Ib NMJs presented as in Fig. 6 A. (B) Loss of Rtnl1 does not affect resting ER resting lumen GCaMP. Graphing and analysis are as for Fig. 6 B. Some outlier datapoints are excluded from the graph but included in statistics. (C) ΔF/F time course of evoked lumenal GCaMP responses to 40 Hz stimulation (mean ± SEM). (D) ΔF/F time courses from individual larvae show that transient evoked Ca2+ release from ER, common in Type Is termini (Fig. 6 C) is mostly undetectable in WT Type Ib termini but found in over half of Rtnl118 Type Ib termini tested. (E) Loss of Rtnl1 increases ER Ca2+ release across a range of stimulation frequencies. (F) Loss of Rtnl1 significantly decreases evoked ER Ca2+ uptake over a range of stimulation frequencies. Graphs in E and F are presented and analyzed as in Fig. 5 D. Genotypes: Ib-GAL4, UAS-ER-GCaMP6-210/UAS-tdTom::Sec61β in either a WT or Rtnl118 mutant background.
Video 9.
WT ER Ca2+ response to stimulation in Ib boutons. Evoked ER Ca2+ response to a 40 Hz stimulation. Genotype is WT; Ib-GAL4, UAS-ER-GCaMP6-210/UAS-tdTom::Sec61β.
Video 10.
Rtnl1 mutant ER Ca2+ response to stimulation in Ib boutons. Evoked ER Ca2+ response to a 40 Hz stimulation. We provided two video versions, the first with the brightness comparable to the WT Video 9, Genotype is Rtnl118; Ib-GAL4, UAS-ER-GCaMP6-210/UAS-tdTom::Sec61β.
Video 11.
Rtnl1 mutant ER Ca2+ response to stimulation in Ib boutons, brighter image. A brighter version of Video 10.
Rtnl1 loss decreases mitochondrial Ca2+ uptake at Type Is and Type Ib NMJs
Mitochondrial Ca2+ stimulates ATP production (Datta and Jaiswal, 2021), and since Ca2+ released from ER and/or present in the cytosol can potentially be taken up by mitochondria, we hypothesized that mitochondrial Ca2+ could be impaired by the changes in ER architecture elicited by Rtnl1 loss. We tested this hypothesis using a Ca2+ sensor adapted for mitochondrial conditions, CEPIA3mt (Suzuki et al., 2014).
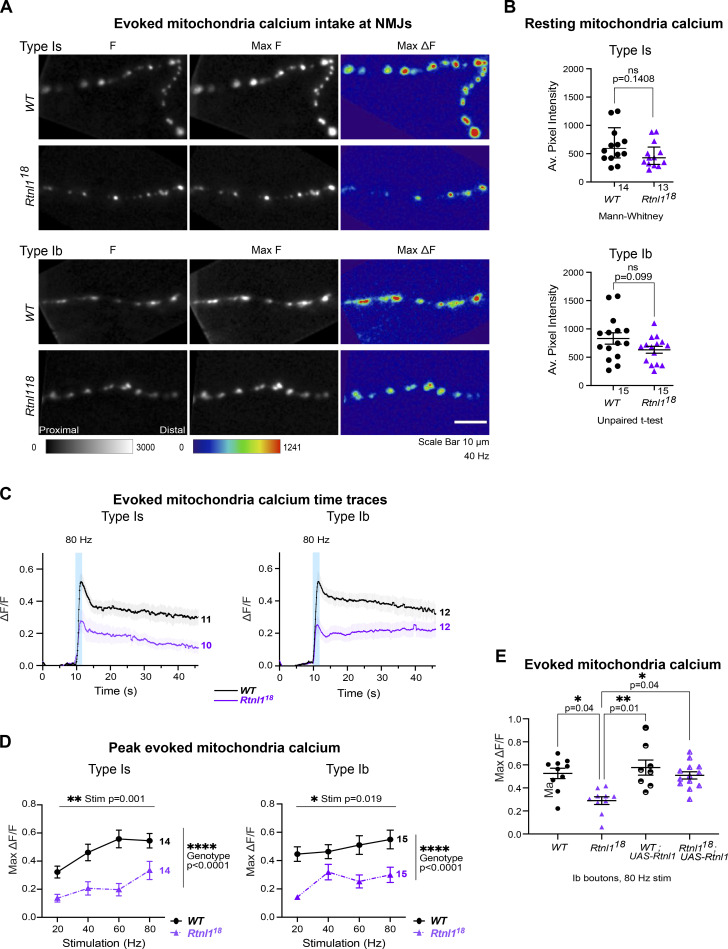
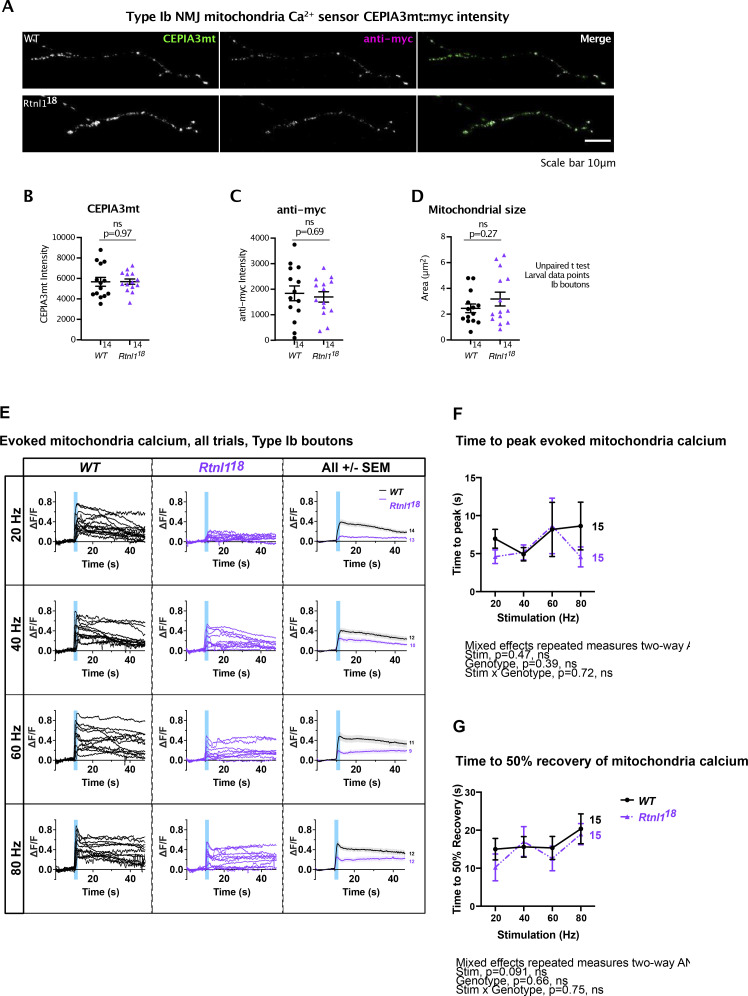
In WT Type Is and Ib NMJs, mitochondria showed a rapid increase in [Ca2+] in response to repetitive stimulation, followed by a rapid partial decline, and a slow return to baseline over a period greater than 40 s (usually 1–2 min; Fig. 8; and Video 12). As with ER lumenal Ca2+, this response followed and outlasted the evoked cytosolic Ca2+ response. Loss of Rtnl1 did not affect resting CEPIA3mt fluorescence in either Type Is or Ib boutons (Fig. 8, A and B; Fig. S12 A; Fig. S13, A and B; and Video 13). Immunostaining for the myc epitope tag of the CEPIA3mt sensor showed that CEPIA3mt sensor levels were not altered between WT and Rtnl118 larvae (Fig. S13, A and C), implying that the levels of expression of the sensor were comparable and the CEPIA3mt fluorescence is reporting relative [Ca2+] in these genotypes. Although Rtnl11 NMJ mitochondria have been reported as larger than WT (O’Sullivan et al., 2012), we detected only a small and non-significant increase in mitochondrial size in Rtnl118 muscle 1 NMJs compared to WT (Fig. S13 D).
Figure 8.
Rtnl1 loss decreases evoked mitochondrial Ca2+ uptake in Ib and Is presynaptic termini. Evoked mitochondrial Ca2+ responses were measured at Type Ib and Type Is termini at muscle 1 in segment A4-A6. (A) Mitochondrial CEPIA3mt fluorescence presented as in Fig. 6 A. (B) Loss of Rtnl1 does not alter resting mitochondrial Ca2+ levels in Type Is or Type Ib terminals. Some outlier datapoints are excluded from the graph but included in statistics. Graphs and analyses are as in Fig. 6 B, except that Type Ib are shown as mean ± SEM and compared using Student’s t test. (C) Time courses of evoked mitochondrial CEPIA3mt responses to 80 Hz stimulation (mean ± SEM) show reduced Ca2+ uptake by mitochondria on loss of Rtnl1. (D) Loss of Rtnl1 significantly decreases mitochondrial Ca2+ uptake across a range of stimulation frequencies. Graphs and analyses are as for Fig. 5 D. (A–D) Genotypes: Is-GAL4 or Ib-GAL4, UAS-CEPIA3mt/UAS-tdTom::Sec61β in either a WT or Rtnl118 mutant background. (E) Expression of UAS-Rtnl1::HA under Ib-GAL4 control rescues evoked Ca2+ uptake by mitochondria in mutant larvae. Data shows maximum evoked mitochondrial CEPIA3mt responses (ΔF/F) after 80 Hz stimulation. Graph shows individual larval datapoints, with one NMJ datapoint per larvae, averaged across the responding area; statistical comparisons were performed using one-way ANOVA followed by Dunnett's post-hoc multiple comparisons. Genotypes: Ib-GAL4, UAS-CEPIA3mt/UAS-Rtnl1::HA or Ib-GAL4, UAS-CEPIA3mt/attP2+ in either a WT or Rtnl118 mutant background; the attP2 landing site acts as a WT control for insertion of UAS-Rtnl1::HA at attP2.
Video 12.
WT mitochondria Ca2+ response to stimulation in Ib boutons. Evoked mitochondria Ca2+ response to a 40 Hz stimulation. Genotype is WT; Ib-GAL4, UAS-CEPIA3mt/UAS-tdTom::Sec61β.
Figure S12.
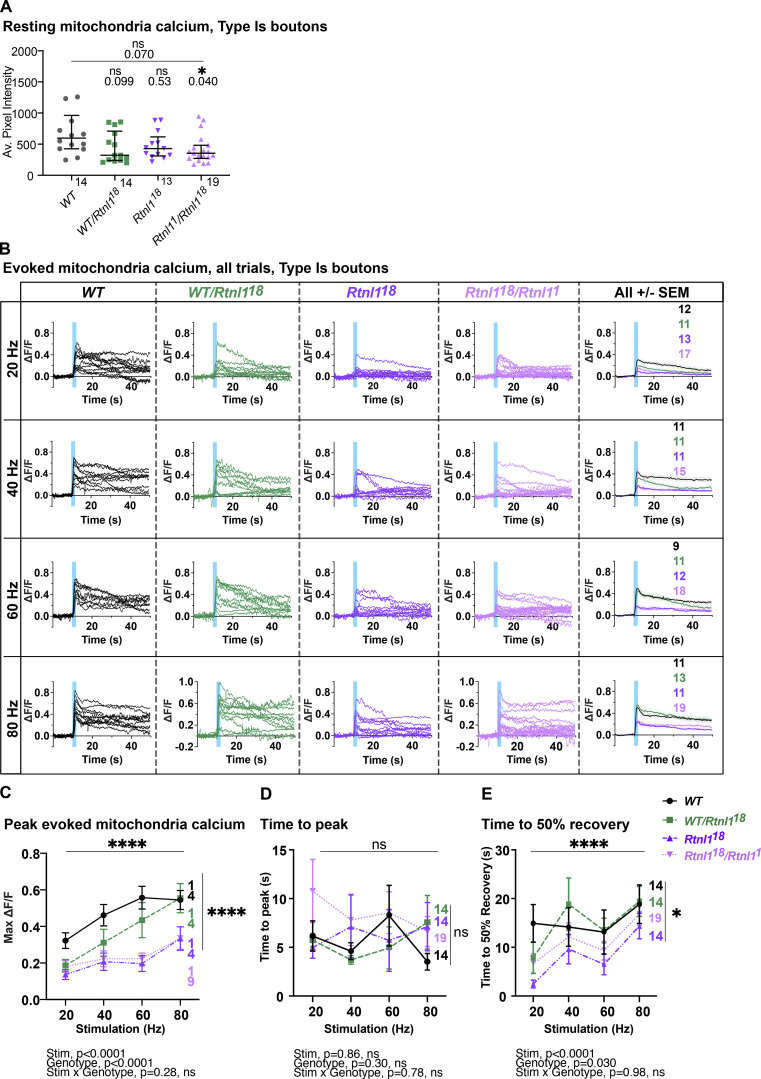
Rtnl1 loss decreases mitochondrial Ca2+ handling in Type Is boutons. (Extended data from Fig. 8.) (A) Loss of Rtnl1 does not affect resting CEPIA3mt fluorescence. Although Rtnl118/Rtnl11 flies show a marginally significant decrease in CEPIA3mt fluorescence, this effect is not found in a homozygous Rtnl118 background, indicating that loss of Rtnl1 does not affect resting mitochondrial Ca2+. Plot shows individual larval datapoints and median ± interquartile ranges; sample size (larvae) is indicated within the plot for each genotype. Comparisons were performed using Kruskal–Wallis tests. (B) Impact of Rtnl1 loss-of-function on peak evoked mitochondrial Ca2+. Plots show all single time traces and mean ± SEM time traces in every genotype for four stimulation frequencies tested. Sample size (larvae) is indicated within the plot for each genotype. (C) Impact of Rtnl1 loss-of-function on peak evoked mitochondrial Ca2+. Plots show mean ± SEM of every genotype for each stimulation frequency tested; sample size (larvae) is indicated within the plot for each genotype. For each larva, responses from a 50-s recording from one muscle 1 NMJ between A4-A6 segments were analyzed. Comparisons were analyzed with a mixed-effects two-way ANOVA. (D) Rtnl1 loss did not affect time to peak mitochondria Ca2+. Data analyzed as in C. (E) Impact of Rtnl1 loss on time to 50% recovery of mitochondria Ca2+. Rtnl1 loss in both Rtnl118 and Rtnl118/Rtnl11 backgrounds slightly decreases time to 50% recovery when compared to WT and WT/Rtnl118 backgrounds, indicating that mitochondria in Rtnl1 mutants lose their Ca2+ slightly faster than in WT. Data analyzed as in C. In D and E, datapoints represent the time to peak ΔF/F and 50% or 100% recovery. Genotypes are Is-GAL4, UAS-CEPIA3mt/UAS-tdTom::Sec61β, in either a WT, or Rtnl118, Rtnl118/Rtnl11, or WT/Rtnl118 background.
Figure S13.
Effect of Rtnl1 loss on mitochondrial Ca2+ handling in Type Ib boutons. (Extended data from Fig. 8.) (A) Panels show mitochondrial CEPIA3mt fluorescence and anti-myc signal of CEPIA3mt::myc in typical examples of WT and Rtnl118 muscle 1, Type Ib postsynaptic terminals. (B–D) Rtnl1 loss-of-function does not impact CEPIA3mt fluorescence intensity (B), anti-myc signal intensity (C) of CEPIA3mt::myc, or mitochondrial size (D). Plots shows individual larval datapoints and mean ± SEM; sample size (larvae) is indicated within the plot for each genotype. For each larva, all mitochondria from several muscle 1 NMJs between A2-A6 segments were analyzed, and each mean larval value is shown as a datapoint. Pairwise comparisons were performed using Student’s t tests. Genotypes are Ib-GAL4, CEPIA3mt::myc, in either a WT or Rtnl118 background. (E) Impact of Rtnl1 loss-of-function on peak evoked mitochondria Ca2+. Plots show all single time traces and mean ± SEM time traces in both genotypes for the four stimulation frequencies tested. Sample size (larvae) is indicated within the plot for each genotype. (F and G) Rtnl1 loss of function does not affect time to peak mitochondria Ca2+ or (G) time to 50% recovery of mitochondria Ca2+. Plots show mean ± SEM of every genotype for each stimulation frequency tested; sample size (larvae) is indicated within the plot for each genotype. For each larva, responses from a 50-s recording from one muscle 1 NMJ between A4-A6 segments were analyzed. Datapoints represent the time between stimulation and peak ΔF/F or peak ΔF/F and half recovery. Comparisons were analyzed with a mixed-effects two-way ANOVA. Genotypes are Ib-GAL4, UAS-CEPIA3mt::myc/UAS-tdTom::Sec61β, in either a WT or Rtnl118 background.
Video 13.
Rtnl1 mutant mitochondria Ca2+ response to stimulation in Ib boutons. Evoked mitochondria Ca2+ response to a 40 Hz stimulation. Genotype is Rtnl118; Ib-GAL4, UAS-CEPIA3mt/UAS-tdTom::Sec61β.
However, Rtnl1 loss significantly lowered evoked NMJ mitochondrial Ca2+ uptake compared to WT at every stimulation frequency tested (Fig. 8, C and D; and Fig. S12 B and Fig. S13 E). Transheterozygous mutant controls had statistically similar responses to homozygous Rtnl118 larvae (Fig. S12, B and C), corroborating that the phenotype is due to loss of Rtnl1. Further, expression of UAS-Rtnl1::HA under GAL4 control fully rescued evoked mitochondria Ca2+ uptake in Ib presynaptic boutons (Fig. 8 E).
Although Type Is and Ib NMJs have different mitochondrial densities, responses to nerve stimulation, and Ca2+ sequestration capacities (Chouhan et al., 2010), Rtnl1 loss reduced evoked mitochondria Ca2+ responses in both bouton classes. Heterozygous Rtnl118/WT NMJ mitochondria Ca2+ responses were similar to WT larvae at the higher stimulation frequencies, but were reduced at lower frequencies, suggesting a mild dominant effect of Rtnl118 (Fig. S12, B and C).
Genotype did not affect time to peak evoked Ca2+ in either Is or Ib boutons (Fig. S12 D and Fig. S13 F), nor time to 50% recovery in Ib boutons (Fig. S13 G). In mitochondria of Type Is boutons, loss of Rtnl1 elicited faster 50% recovery times, in both Rtnl118 mutants and transheterozygous controls, compared to WT controls (Fig. S12 E).
Comparison of Ca2+ responses and their Rtnl1 dependence across compartments
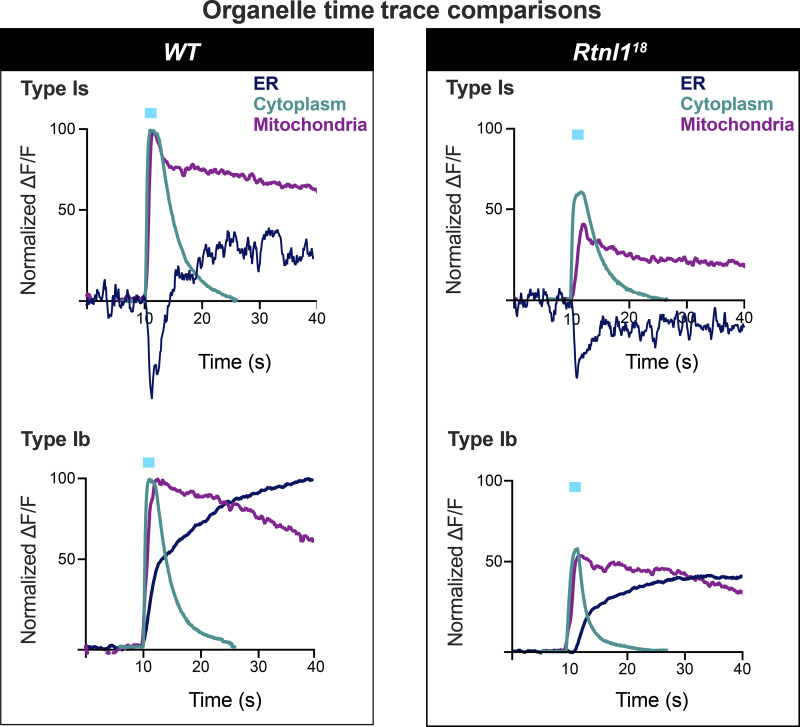
Comparison of the above Ca2+ responses in different organelles (Fig. 9) revealed a rapid rise and fall in cytosolic Ca2+, followed by strong and longer lasting Ca2+ responses in both mitochondria and ER. These time courses reveal that loss of Rtnl1 affects the evoked Ca2+ responses of the three presynaptic compartments with similar severity, with Ca2+ responses being reduced to just over a half of those of WT in Ib boutons and Is cytosolic responses, and just under half in Is mitochondria and ER responses.
Figure 9.
A comparison of superimposed time courses. Mean time traces (data from Figs. 5 and 8) from ER, mitochondria, and cytosolic sensors in WT and a Rtnl1 mutant (Rtnl1-), and in Type Is and Ib excitatory synapses. Plots are normalized so that the difference of minimum to maximum ΔF/F values are set to 100 for the WT recordings in each compartment. Most time courses are from 40 Hz stimulation trials. Two exceptions are: the Ib cytosolic trace was with 50 Hz stimulation, as 40 Hz was not tested, Is ER responses were with 20 Hz, as this frequency was most representative of the lack of statistical difference between WT and Rtnl1 mutant responses (Fig. 6 D).
Discussion
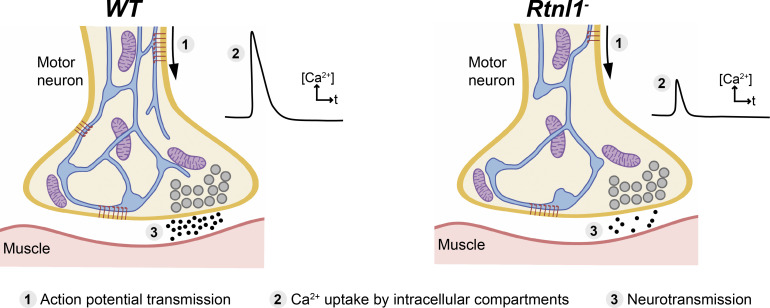
From a body of work mostly in cultured non-neuronal cells, we know that the ER controls Ca2+ handling (Öztürk et al., 2020). This role appears conserved in presynaptic ER, where both ER-PM contacts (de Juan-Sanz et al., 2017) and the amount of ER (Kuijpers et al., 2021) are critical for neurotransmission. Given the relatively larger Ca2+ storage capacity of ER cisternae, are presynaptic ER tubules contributing to Ca2+ dynamics? In this work, we have disrupted the tubular ER-shaping protein Rtnl1 and found a decrease of presynaptic ER tubules (schematized in Fig. 10). Rtnl1 loss results in a unique model to study the role of ER tubules at the presynaptic region. Here, we used this model to analyze Ca2+ handling, which relates with neurotransmission and the biological basis of neurological disorders associated with tubular ER.
Figure 10.
Model of effect of Rtnl1 loss on presynaptic ER network and synaptic function. Schematic diagrams of a WT and a Rtnl1 mutant (Rtnl1−) presynaptic terminal. The latter shows fewer ER tubules, resulting in less ER network surface, and hence in less ER contact surface with other cell compartments. Reduced presynaptic ER surface is accompanied by generally lower Ca2+ fluxes in presynaptic compartments (cytosol, ER lumen, and mitochondria), and by lower neurotransmission. These reductions could be a potential route by which the loss of ER-shaping HSP protein function might lead to motor neuron axonopathy. Key: ER network, blue; mitochondria, purple; synaptic vesicles, gray; MN PM, dark orange; muscle PM, dark red; ER-PM contacts, accumulation of STIM1 (red rods); released neurotransmitter, black dots.
Loss of either Rtnl1 or REEPs causes a loss of axonal ER preferentially in longer motor neurons of Drosophila larvae (Yalçın et al., 2017). In contrast, the decrease of presynaptic ER network in Rtnl1 mutants is independent of axon length (Fig. 2, A and B). The tubular ER network in presynaptic terminals (mouse nucleus accumbens) is more extensive than in axons (Wu et al., 2017). It is therefore possible that presynaptic ER is more dependent on the function of tubular ER-shaping proteins than axonal ER. Regarding the continuity of the network, it is possible that neurons can better tolerate loss of ER tubules in presynaptic terminals than in axons, where there are relatively few tubules to begin with. This might explain why loss of Rtnl1 causes ER network discontinuity in axons (Yalçın et al., 2017), but not at the presynaptic region.
Increasing the levels of axonal and presynaptic ER (by blocking neuronal autophagy) correlates with elevated Ca2+ release from ER, which in turn increases neurotransmission (Kuijpers et al., 2021). In agreement with this, we showed that lower ER levels correlate with decreased neurotransmission (Fig. S7), indicating that the relationship works conversely. Interestingly, we also found a severe decrease in the frequency of miniature neurotransmission in Rtnl1 mutants (Fig. S7, D–F and Fig. S8). Since presynaptic ER tubules, but not cisternae, appear to be reduced in Rtnl1 mutants (Fig. 3), we proposed that tubules help regulate Ca2+ handling across presynaptic compartments. Tubule loss abates Ca2+ handling in the ER (Figs. 6 and 7), cytosol (Fig. 5), and mitochondria (Fig. 8), in both types of excitatory NMJs in Drosophila larvae. As neurotransmitter release is triggered by cytosolic Ca2+ influx through PM voltage-gated Ca2+ channels, the decrease of postsynaptic Ca2+ responses (Fig. S7) and presynaptic cytosolic influx (Fig. 5) corroborate with each other.
ER-PM contacts have an inhibitory role in cytosolic Ca2+ influx in primary hippocampal neurons via activated STIM1 on emptying of ER stores (de Juan-Sanz et al., 2017); other studies in neurons have demonstrated that emptying of Ca2+ from ER stores (thereby activating STIM) promotes spontaneous (miniature), but not evoked vesicle release at excitatory terminals by the action of STIM2 (Chanaday et al., 2021). Here, we do not expect STIM to be playing an inhibitory role to presynaptic Ca2+, as we observed a decrease in STIM levels and foci in Rtnl1 mutants (Fig. 4), as well as a decrease in evoked Ca2+ fluxes, which were rescued by overexpressing STIM (Fig. 5). Work in non-neuronal cells indicate that STIM1/STIM2 promotes Ca2+ entry via coupling with Ca2+ channels on the PM (Berna-Erro et al., 2009; Chanaday et al., 2021; Gudlur et al., 2018; Jennette et al., 2022), and our in vivo data support a similar relationship in motor neurons for the Drosophila STIM1/STIM2 ortholog STIM. Accordingly, we proposed a model for presynaptic compartments, whereby narrow tubular ER modulates Ca2+ entry via STIM (Fig. 10). Other components of the network with higher volume, such as cisternae, would work as a Ca2+ store, since both ER volume (Fig. 3) and resting ER Ca2+ levels (Figs. 6 and 7) are unaffected in Rtnl1 mutants. Evoked Ca2+ uptake by the ER was also decreased by loss of Rtnl1 (Figs. 6 and 7). While most lumenal GFP::HDEL or GCaMP, and hence Ca2+, appears to be in cisternae that would act as Ca2+ reservoirs, evoked ER Ca2+ uptake is reduced upon depletion of the tubular ER network in both phasic and tonic firing boutons. Moreover, we saw the tubular network influencing the physiological profile of ER Ca2+, with ER Ca2+ release occurring on stimulation of WT Is boutons, and rarely on stimulation of WT Ib boutons. However, with loss of Rtnl1 and depletion of tubular ER, ER in Ib boutons released Ca2+ during neuronal activity in over half of NMJs tested, and thus caused it to act like smaller Is boutons. Our results demonstrate a complex relationship between ER structure, and uptake and release of Ca2+ by the ER, suggesting that intact ER cisternae are not sufficient to maintain full levels of synaptic ER Ca2+ release and uptake, but that ER tubules are necessary as well.
Rtnl1 loss also decreased evoked presynaptic Ca2+ uptake by mitochondria (Fig. 8), similar to the ER and cytosolic compartments. As mitochondrial Ca2+ and ATP production are positively correlated (Datta and Jaiswal, 2021), energy generation in both Type Is and Ib boutons might potentially be impaired on depletion of tubular ER. Mitochondria normally receive Ca2+ directly from ER (Rizzuto et al., 1993; de Brito and Scorrano, 2010), although synaptic mitochondria can take up Ca2+ from the cytosol (Ashrafi et al., 2020; Chouhan et al., 2010, 2012). However, the comparative kinetics of the Ca2+ responses of WT cytosol, ER, and mitochondria (Fig. 9) do not allow us to distinguish between mitochondrial Ca2+ uptake from the cytosol or from ER in this situation.
Beyond the Ca2+ handling defects characterized in this work, we proposed Rtnl1 mutants as a useful model to explore other biological roles of presynaptic ER, and to understand which presynaptic ER-related processes might be relevant to the mechanisms of HSP. In addition to Ca2+ handling, presynaptic ER depletion might affect other cellular processes such as autophagy, vesicle trafficking, glucose transport, or lipid metabolism (Öztürk et al., 2020). Although we do not observe any PI(4,5)P2 alterations in Rtnl1 mutants (Fig. S6), it is still possible that other ER-dependent lipids might be affected, since at least some ER-PM contacts seem to be reduced (according to the decreased levels observed for STIM1 foci). Failed lipid transfer at ER-PM contacts has been previously related with reduced expansion of the growth cone and with neuronal PM growth in general (Petkovic et al., 2014), but we did not observe any defect in morphology of mature motor neurons in Rtnl1 mutants apart from a slight increase in the number of boutons.
Our results reveal at least three aspects of the Rtnl1 mutant phenotype that could be relevant to the disease mechanisms of HSPs caused by mutations in ER-shaping proteins. First, Rtnl1 mutants show a reduced frequency of miniature neurotransmission. This induces bouton fragmentation in young adult Drosophila so as to resemble that of aged Drosophila, whereas elevated minis can delay age-associated fragmentation and prolong motor ability in adult Drosophila (Banerjee et al., 2021). Second, Rtnl1 mutants show decreased evoked cytosolic Ca2+ influx and neurotransmission at NMJs, which controls muscle contraction. Third, decreased evoked mitochondrial Ca2+ fluxes predict lower ATP generation capacity and potential energy deficits, although these may be mitigated by the reduced levels of synaptic transmission. Our results suggest mechanisms whereby altered organization of ER tubules could be a potential mechanism for diseases including HSP by affecting synaptic Ca2+ handling, and thus synapse function.
Materials and methods
Drosophila genetics
Drosophila stocks (Table S1) were maintained on standard culture media at 18°C (Fly Facility from Department of Genetics, University of Cambridge, Cambridge, UK). Crosses used to generate data were performed at 25°C and are listed in Table S2.
Generation and analysis of Rtnl1 and Rtnl1::YFP mutant alleles
Disruption of Rtnl1 was performed by expressing Cas9 together with two guide RNAs (gRNAs) that target the genomic sequences encoding Rtnl1 intramembrane domains (Fig. 1 and Fig. S1 A). We used the online tool FIND CRISPRs (2017 version; https://www.flyrnai.org/crispr/) from DRSC/TRiP Functional Genomics Resources (Harvard Medical School) for gRNA designing, targeting Rtnl1, and filtering for at least four mismatches to any off-target sequences. BLAST sequence searches at www.ncbi.nlm.nih.gov were used to validate the absence of potential off-target sequences for the selected gRNAs. gRNA sequences were cloned into the tRNA::gRNA plasmid pCFD5 by following the protocol on http://www.crisprflydesign.org/. In brief, pCFD5 was digested with Bbs1-HF; DNA fragments containing gRNAs were generated using Q5 High-Fidelity DNA Polymerase with the guided sequences 5′-CAGTGGAATCCCTTATCTAC-3′ (1) and 5′-CAAGTTCGGCGTCATTCTGT-3′ (2); Gibson Assembly Master Mix was used to ligate the generated DNA fragments with digested pCDF5; High efficiency Transformation Protocol was used to establish bacterial colonies containing the assembled plasmids; colonies containing inserts with the correct size were sent for sequencing (Source BioSciences) to validate insert orientation. The resulting pCFD5-2xgRNA expression plasmid was purified using a QIAprep Spin Miniprep kit and injected into Drosophila embryos (microinjection service at Department of Genetics, University of Cambridge). Rtnl118 and Rtnl14 were recovered from microinjection into embryos containing nos-Cas9 on the X chromosome; we used the second chromosome of this stock as Rtnl1+ WT, as the parental chromosome of the Rtnl118 and Rtnl14 alleles. Surviving F0 male adults were individually crossed with If/CyO virgin females, and the male F1 adults from this cross were crossed with Sco/CyO virgin females for a few days, to establish stocks containing any new Rtnl1 mutations. These males were then sacrificed for genomic DNA extraction, and mutations in Rtnl1 locus were analyzed by PCR using Surveyor Mutation Detection Kit with Phusion High-Fidelity Polymerase and 5′-GGCAAGGTAAACAGCGAGAC-3′ (Rtnl1-1A) and 5′-TGTGTATGGTGGACAAAAGCA-3′ (Rtnl1-1B) primers (WT amplicon, 629 bp; Thermo Fisher Scientific; Fig. S1 A). The same DNA polymerase and primers were used to generate PCR products from the mutated lines for sequencing (Source BioScience). To generate Rtnl1+ line, a single male from the nos-Cas9 stock was crossed with If/CyO virgin females, and the Rtnl1+/CyO, Tb males from the progeny were crossed again with If/CyO virgin females to establish the stock.
To generate Rtnl1::YFP3, we first established a stable line expressing the Rtnl1 gRNAs. The pCDF5-2xgRNA plasmid was injected into Drosophila embryos of genotype nos-phiC31 v− on the X chromosome, and the attP2 landing site on the third chromosome. Successful phiC31 integrase-mediated integration of pCDF5, which contains an attB site, was verified by v+ in the resulting F1 adult flies. The Rtnl1 double gRNA line was then used with nos-Cas9 to generate Rtnl1 mutations in the germline of Rtnl1CPTI001291 flies.
For RT-PCR, we used a One-Step RT-PCR kit, on total RNA template from a TRIzol reagent extraction (15 males per genotype), and 5′-GGCAAGGTAAACAGCGAGAC-3′ (forward) and 5′-GTTCAAACCCACTGTCCAGG-3′ (reverse) primers (Fig. S2 A), which do not amplify Rtnl11 (negative control), and amplify only WT mRNA (636 bp) but not genomic DNA (13,955 bp).
Unless otherwise specified, PCRs were performed with DreamTaq Green PCR Master Mix. Gel electrophoresis was performed in 2% agarose in TBE. DNA fragment sizes were estimated using a GeneRuler 1 kb Plus DNA Ladder. Primers were designed with Primer3web 4.1.0 (https://primer3.ut.ee). Cloning design and sequence analysis were performed with SnapGene 4.2.11. Bacterial cultures were grown using BD Difco LB Broth, Miller, and BD Bacto Agar.
Genotyping Rtnl1 alleles
We used PCR primer pairs to verify the orientation of the region inverted in Rtnl118 (Fig. 1 A and Fig. S1 A). Primers 5′-GGCAAGGTAAACAGCGAGAC-3′ (Rtnl1-1A) and 5′-CTGTCGCACGAAAAGGTACA-3′ (Rtnl1-2B) gave a product of 272 bp in WT, but none in Rtnl118. Primers 5′-GGCAAGGTAAACAGCGAGAC-3′ (Rtnl1-1A) and 5′-GAGGGTTAGGAGCGACAAGT-3′ (Rtnl1-2A) primers (both forward in WT) gave a PCR product of 242 bp in Rtnl118, but none in WT. 5′-GGCAAGGTAAACAGCGAGAC-3′ (Rtnl1-1A) and 5′-CTGTCGCACGAAAAGGTACA-3′ (Rtnl1-2B) were also used to detect UAS-Rtnl1::HA, which gave a 207 bp band (lacking a 65 bp intron) compared to the 272 bp band of WT genomic DNA. To genotype Rtnl11, 5′-GGAAATTGCGTGGAACTCAT-3′ and 5′-TATTCGCATTTCCTCGATCC-3′ primers gave a PCR product of 5,623 bp in WT, and 496 bp in Rtnl11 (Yalçın et al., 2017). New stocks were genotyped for Rtnl1 alleles and UAS-Rtnl1::HA after they were constructed to verify their genotypes and at intervals throughout the work.
Generation of mitochondrial Ca2+ sensor
17xUASTattB-CEPIA3mt::myc was constructed as for the lumenal ER sensors (Oliva et al., 2020), and integrated by injection at phiC31 landing site attP86Fb (Bischof et al., 2007).
Histology and confocal microscopy
Third instar larvae were dissected in chilled Ca2+-free HL3 solution (prefixation HL3; Stewart et al., 1994), and fixed for 10 min in PBS with 4% formaldehyde. Unless otherwise specified, visualization of fluorescent tags was performed via direct imaging without immunostaining. For immunostaining, the dissected preparations were permeabilized in PBS containing 0.1% Triton X-100 (PBT) at room temperature for 1 h. After permeabilization, samples were blocked in PBT with 4% bovine serum albumin for 30 min at room temperature, incubated with primary antibodies (Table S3) overnight at 4°C, and finally incubated with secondary antibodies (Table S3) for 2 h at room temperature. For myc and HA immunostaining, samples were permeabilized for 30 min with PBT, blocked for 1 h with 5% Normal Goat Serum in PBT, and incubated with anti-myc or anti-HA overnight at 4°C. Processed preparations were mounted in Vectashield, and images were collected using EZ-C1 acquisition software (Nikon) on a Nikon Eclipse C1si confocal microscope (Nikon Instruments) with 488 nm (for GFP and Alexa-488 signals), 561 nm (for tdTom, mCherry, and Alexa-594 signals) and 638 nm (for Alexa-647 signal) lasers. Images were captured using a 40×/1.3NA oil Nikon Plan Fluor DIC H/N2 infinity-0.17 WD 0.2 objective, or a 60×/1.4NA oil Plan Apo VC infinity-0.17 DIC N2.
Live imaging
Wandering third instar larvae were fillet dissected in ice-cold Schneider’s Drosophila medium and imaged in ice-cold HL3 of the appropriate kind. Presynaptic responses were imaged in low-Mg2+ HL3 containing 1 mM Ca2+ (Oliva et al., 2020). Postsynaptic responses were imaged in low-Mg2+ HL3, with 1 mM L-glutamic acid to partially saturate postsynaptic receptors; higher concentrations of L-glutamic acid blocked postsynaptic responses, and lower concentrations did not inhibit muscle contractions enough. Muscle contractions often obscured postsynaptic responses even with 1 mM L-glutamic acid. New HL3 was kept no longer than 3 d at 4°C, as Ca2+ responses became unreliable with HL3 older than this.
Nerves were cut at the base of the VNC with dissection scissors, suctioned into a heat-polished glass pipette (Macleod et al., 2002), attached to a stimulator and train generator, and imaged on an upright widefield Olympus BX50 microscope as described previously (Oliva et al., 2020) using LED illumination (Cairn Instruments): a 470 nm LED with an ET470/40× T495LPXR excitation cube, a cool white LED with an ET572/X35 holder and ET500/20xT485/68dcrb excitation cube, a 59,022 bs infinity cube, and a Cairn Optosplit II beamsplitter with an ET520/40m T565LPXR-UF2 ET632/60m emission cube. ER lumen and mitochondrial responses were imaged at 10 frames per second and EM gain level 100. Presynaptic cytosolic and postsynaptic responses were imaged at 50 frames per second and EM gain level 100. Live images were acquired using a 40×/1.0NA long working distance, water-immersion objective (W Plan-Apochromat 40×/1.0 DIC M27), a 2× C-mount fixed focal length lens extender, and an Andor EMCCD camera (iXon Ultra model 897_BV, 512 × 512 pixels, Andor Technology). Imaging data were acquired using Micro-Manager (Edelstein et al., 2014) and saved as multilayer TIFF files.
Image analysis and figure preparation
Confocal stack images (.nd2) were processed with Fiji ImageJ (Schindelin et al., 2012). Selection of specific z-stack ranges, generation of maximum intensity projections, brightness adjustment (identical for all images within the same experiment), and/or image cropping were performed as required. Thresholding of the resulting images was used to select regions of interest (ROIs) for quantification. For overall axon and NMJ structures, thresholding was manually adjusted on the PM marker channel (when present), and the resulting ROIs were applied to the remaining channels. For punctate signals, to reduce variability in ROI selection between samples, one of the predefined Fiji threshold algorithms was chosen, based on its ability to filter puncta previously identified by eye in multiple random images. The selected ROIs were used to measure mean pixel intensity and/or area values, which were recorded in a Microsoft Excel 2019 file (.xlsx). Files generated during successive steps in image processing, the threshold algorithms used in each experiment (when required), the threshold values used for all ROIs, and the quantification datasets, can be found in the underpinning dataset for this paper.
Wide-field multilayer .tif time course files were opened in Fiji ImageJ (Schindelin et al., 2012), and channels were background subtracted (Rolling Ball Radius: 50 pixels). NMJs were stabilized using Register ROI from the cookbook menu with an ROI containing the entire NMJ. Some NMJs needed to be registered multiple times. Fluorescent intensity time traces were obtained for ROIs traced around the entire NMJ, or around all individual mitochondria in the NMJ, in each .tif frame in a given data set using the Time Series Analyzer V3 plugin and ROI manager, recording the average fluorescence in each ROI (or across all mitochondria ROIs). Mitochondria or NMJs that moved and could not be corrected with registration software, or drifted out of focus during recording, were discarded from analysis. If only one or two mitochondria/boutons in the NMJ were available for analysis, due to focus or drift, data were discarded from analysis. Miniature neurotransmission frequencies were manually counted (Fig. S8) at the distal bouton over a 20-s interval. Miniature neurotransmission amplitude was calculated via a maximum ΔF/F value reached at the distal bouton over a 20-s interval in R. Time traces were saved as CSV files and NMJ averages were fed into R scripts (R Core Team, 2020) to perform bleach correction and rolling averages (5 frames). Bleach correction was performed by fitting a bleach correction power curve (PC = a*xb) to pre-stimulation fluorescence (a and b coefficients calculated in R) and dividing raw fluorescence over the entire time course by this fitted curve. R scripts were also used to collect resting fluorescence (immediate pre-stimulation value of the fitted power curve), maximum fluorescence (maximum raw fluorescent value), ΔF, ΔF/F, time to peak, time to 50% recovery, and with the cytosolic sensor, time to 100% recovery. All files generated during successive steps in image processing, ROIs, and the quantification analyses, are available in the dataset for this paper.
Electron microscopy
Fixation and embedding
Fixation of dissected third instar larvae was done by replacing HL3 solution with fix solution (0.05 M sodium cacodylate at pH 7.4 containing 4% formaldehyde, 2% vacuum distilled glutaraldehyde, and 2 mM CaCl2). The larvae were incubated at 4°C overnight. After fixation the preparations were washed three times for 10 min each at 4°C using 0.05 M cold cacodylate buffer. Samples were osmicated in 1% osmium tetroxide/1.5% potassium ferricyanide/0.05 M sodium cacodylate buffer for 3 d at 4°C. The preparations were washed four times with deionized water at room temperature. Thiocarbohydrazide solution was prepared at a concentration of 0.1% in deionized water, incubated in a 60°C oven for 1 h while agitated by swirling every 10 min to facilitate dissolution, and filtered through two 9-cm filter papers just before use. The preparations were then incubated in thiocarbohydrazide solution for 20–30 min at room temperature and covered with aluminum foil to protect from light. They were then rinsed with deionized water at room temperature five times for 3 min, incubated in 2% aqueous osmium tetroxide for 30–60 min at room temperature, and rinsed with deionized water at room temperature five times for 3 min. Afterward, the preparations were incubated in 2% uranyl acetate (maleate-buffered to pH 5.5) at 4°C for 3 d and rinsed with deionized water at room temperature 5 times for 3 min. They were then incubated in lead aspartate solution (0.66 g of lead nitrate was dissolved in 100 ml 0.03 M aspartic acid solution and pH adjusted to 5.5 with 1 M KOH in a 60°C oven for 30 min) at 60°C for 30 min, and rinsed with deionized water at room temperature five times for 3 min. They were then dehydrated twice with each of 50, 70, 90, and 100% ethanol and twice with dried ethanol, twice with dried acetone, and twice with dry acetonitrile. The preparations were incubated in 50/50 acetonitrile/Quetol 651 overnight at room temperature. They were then incubated 72 h in Quetol epoxy resin 651 (Agar Scientific) without BDMA and five times for 24 h in Quetol epoxy resin 651 with BDMA (dimethylbenzylamine). Afterward, they were incubated at 60°C for a minimum of 48 h.
Sectioning
The resin blocks were sectioned using a Leica Ultracut E ultramicrotome. Sections were mounted on aluminum SEM stubs using carbon sticky pads and coated with 30 nm carbon for conductivity. The sections were imaged in a Verios 460 SEM at 4 keV and 0.2 nM probe current using the concentric backscatter detector at low magnification, and stitched image maps were acquired using MAPS automated acquisition software to give an overview through the central region of the larva. Once NMJs were identified, blocks were trimmed down to the region containing the structures of interest. The samples were then sectioned with a 4 mm UltraMaxi Diatome 35° knife using an ATUMtome (RMC/Boeckeler Instruments) at a thickness of 50 nm and were collected onto rolling Kapton tape.
Imaging
Kapton tape strips were mounted on 4-in silicon wafers using double-sided carbon sticky tape. Wafers were then sputter coated with 30 nm carbon using a Quorum Q150 T E carbon coater. Wafers were imaged in a Verios 460 scanning electron microscope (FEI/Thermo Fisher Scientific) at 4 keV accelerating voltage and 0.2 nA probe current in backscatter mode using the concentric backscatter detector (CBS) in immersion mode at a working distance of 3.5–4 mm; 1,536 × 1,024 pixel resolution, 3 μs dwell time, four line integrations. Stitched maps were acquired using FEI MAPS software using the default stitching profile and 5% tile overlap. Images of serial sections were imported into a single file using ImageJ/Fiji (Schindelin et al., 2012), and sections were aligned and reconstructed using the TrakEM2 plugin (Cardona et al., 2012). Reconstructions were further processed with eight smoothing steps of Laplacian smooth function in the program MeshLab (http://meshlab.sourceforge.net). The rendering file generated is available in the underpinning data for the paper.
Statistical analysis
After quantification, values were exported from .xlsx or .CSV to .txt files to be analyzed with R Studio 1.3.1093 or GraphPad Prism 9 for statistical analysis and plotting. Figures were made using Adobe Illustrator CC 2017 or Affinity Designer 1.10.0. All R scripts were written by the authors and are available in the underpinning data for the paper.
A Shapiro-Wilk test was used to test for normality in the data distribution, and Levene’s test was used to test for differences between group variances. Normally distributed data were analyzed with mixed-effects model repeated-measures ANOVA or unpaired two-tailed Student’s t tests. Data not normally distributed were analyzed using non-parametric Kruskal–Wallis or Mann–Whitney U-tests. Post-hoc multiple comparisons were then applied where relevant. Tukey HSD test was used to compare each group with the other groups, while Dunnett’s test was used for planned comparisons between every group and a single control group.
Online supplemental material
Fig. S1 shows CRISPR-derived lesions in Rtnl1 and their effects on the Rtnl1 coding region. Fig. S2 shows Rtnl1 expression in Rtnl1 mutant CRISPR alleles. Fig. S3 shows high-magnification confocal planes of the presynaptic ER network organization in Rtnl1 mutants. Fig. S4 (tdTom::Sec61β) and Fig. S5 (GFP::HDEL) show extended data on the effects of Rtnl1 mutant alleles on presynaptic ER distribution. Fig. S6 shows presynaptic PI(4,5)P2 levels in Rtnl1 mutants. Fig. S7 shows synaptic transmission in Rtnl1 mutants. Fig. S8 shows images of miniature neurotransmission in Rtnl1 mutants. Figs. S9 and S10 show extended data on cytosolic Ca2+ handling in Is and Ib boutons, respectively, of Rtnl1 mutants. Fig. S11 shows extended data on ER Ca2+ handling in Is and Ib boutons of Rtnl1 mutants. Figs. S12 and S13 show extended data on mitochondrial Ca2+ handling in Is and Ib boutons, respectively, of Rtnl1 mutants. Video 1 (WT) and Video 2 (Rtnl1) show postsynaptic Ca2+ response to low-frequency stimulation. Video 3 (WT) and Video 4 (Rtnl1) show postsynaptic miniature Ca2+ events. Video 5 (WT) and Video 6 (Rtnl1) show cytosolic Ca2+ response to stimulation. Video 7 (WT) and Video 8 (Rtnl1) show ER Ca2+ response to stimulation in Is boutons. Video 9 (WT) and Video 10 (Rtnl1) show ER Ca2+ response to stimulation in Ib boutons. Video 11 is a brighter version of Video 10. Video 12 (WT) and Video 13 (Rtnl1) show mitochondria Ca2+ response to stimulation in Ib boutons. Video 13 shows Rtnl1 mutant mitochondria Ca2+ response to stimulation in Ib boutons. Table S1 shows the Drosophila stocks used in this work. Table S2 shows the crosses used in this work. Table S3 shows the reagents used in this work.
Supplementary Material
shows Drosophila stocks used or generated in this work.
shows crosses used in this work.
shows reagents used in this work.
is the source file for Fig. S2.
Acknowledgments
We thank Dion Dickman, Xun Huang, Andrea Daga, Guy Tear, Addgene, the Developmental Studies Hybridoma Bank, the Bloomington and Kyoto Drosophila Stock Centers, and the University of Cambridge Department of Genetics Fly Facility for antibodies, constructs, and stocks. We thank the University of Cambridge Department of Genetics Fly Facility for embryo injections and the electron microscopy facility of the Cambridge Advanced Imaging Centre. We thank Beatriz Ibañez for helpful discussions, and the HSP Tom Wahlig Foundation for its support and dissemination of our work.
This work was supported by grants from the Medical Research Council (MRC) (MR/S011226/1), the Biotechnology and Biological Sciences Research Council (BBSRC; BB/S001212/1), and the Spastic Paraplegia Foundation, Inc. (SPF) to C.J. O’Kane. J.J. Pérez-Moreno was supported by the SPF, a Marie-Sklodowska-Curie grant from the European Union (745007), and a Juan de la Cierva Incorporación grant (IJC2019-038819-I) from the Spanish State Research Agency (MCIN/AEI/10.13039/501100011033). M.K. Oliva was supported by a Marie-Sklodowska-Curie grant from the European Union (660516), and S. Ojha by the SPF.
Author contributions: J.J. Pérez-Moreno: Conceptualization, Resources, Formal analysis, Funding acquisition, Investigation, Visualization, Writing—original draft, Writing—review and editing; generated and characterized new Rtnl1 alleles, performed and analyzed most confocal microscopy, participated in the generation and imaging of EM samples. R.C. Smith: Conceptualization, Resources, Formal analysis, Investigation, Visualization, Writing—original draft, Writing—review and editing; performed and analyzed most Ca2+ imaging, performed and analyzed confocal microscopy. M.K. Oliva: Conceptualization, Resources, Formal analysis, Investigation, Visualization, Writing—review and editing; generated and characterized GCaMPs, performed Ib ER Ca2+ imaging. S. Ojha: Serial EM analysis. F. Gallo: generation of EM samples and serial EM sectioning, Writing—review and editing; K.H. Müller: EM imaging, Writing—review and editing. CJO’K: Conceptualization, Resources, Formal analysis, Supervision, Funding acquisition, Writing—original draft, Project administration, Writing—review and editing.
Data availability
The underpinning dataset for this article is openly available at the University of Cambridge Data Repository (https://www.repository.cam.ac.uk): https://doi.org/10.17863/CAM.93878.
References
- Aponte-Santiago, N.A., and Littleton J.T.. 2020. Synaptic properties and plasticity mechanisms of invertebrate tonic and phasic neurons. Front. Physiol. 11:611982. 10.3389/fphys.2020.611982 [DOI] [PMC free article] [PubMed] [Google Scholar]
- Aponte-Santiago, N.A., Ormerod K.G., Akbergenova Y., and Littleton J.T.. 2020. Synaptic plasticity induced by differential manipulation of tonic and phasic motoneurons in Drosophila. J. Neurosci. 40:6270–6288. 10.1523/JNEUROSCI.0925-20.2020 [DOI] [PMC free article] [PubMed] [Google Scholar]
- Ashrafi, G., de Juan-Sanz J., Farrell R.J., and Ryan T.A.. 2020. Molecular tuning of the axonal mitochondrial Ca2+ uniporter ensures metabolic flexibility of neurotransmission. Neuron. 105:678–687.e5. 10.1016/j.neuron.2019.11.020 [DOI] [PMC free article] [PubMed] [Google Scholar]
- Banerjee, S., Vernon S., Jiao W., Choi B.J., Ruchti E., Asadzadeh J., Burri O., Stowers R.S., and McCabe B.D.. 2021. Miniature neurotransmission is required to maintain Drosophila synaptic structures during ageing. Nat. Commun. 12:4399. 10.1038/s41467-021-24490-1 [DOI] [PMC free article] [PubMed] [Google Scholar]
- Berna-Erro, A., Braun A., Kraft R., Kleinschnitz C., Schuhmann M.K., Stegner D., Wultsch T., Eilers J., Meuth S.G., Stoll G., and Nieswandt B.. 2009. STIM2 regulates capacitive Ca2+ entry in neurons and plays a key role in hypoxic neuronal cell death. Sci. Signal. 2:ra67. 10.1126/scisignal.2000522 [DOI] [PubMed] [Google Scholar]
- Bi, J., Wang W., Liu Z., Huang X., Jiang Q., Liu G., Wang Y., and Huang X.. 2014. Seipin promotes adipose tissue fat storage through the ER Ca²⁺-ATPase SERCA. Cell Metab. 19:861–871. 10.1016/j.cmet.2014.03.028 [DOI] [PubMed] [Google Scholar]
- Bischof, J., Maeda R.K., Hediger M., Karch F., and Basler K.. 2007. An optimized transgenesis system for Drosophila using germ-line-specific phiC31 integrases. Proc. Natl. Acad. Sci. USA. 104:3312–3317. 10.1073/pnas.0611511104 [DOI] [PMC free article] [PubMed] [Google Scholar]
- de Brito, O.M., and Scorrano L.. 2010. An intimate liaison: spatial organization of the endoplasmic reticulum-mitochondria relationship. EMBO J. 29:2715–2723. 10.1038/emboj.2010.177 [DOI] [PMC free article] [PubMed] [Google Scholar]
- Cardona, A., Saalfeld S., Schindelin J., Arganda-Carreras I., Preibisch S., Longair M., Tomancak P., Hartenstein V., and Douglas R.J.. 2012. TrakEM2 software for neural circuit reconstruction. PLoS One. 7:e38011. 10.1371/journal.pone.0038011 [DOI] [PMC free article] [PubMed] [Google Scholar]
- Casso, D., Ramírez-Weber F.-A., and Kornberg T.B.. 1999. GFP-tagged balancer chromosomes for Drosophila melanogaster. Mech. Dev. 88:229–232. 10.1016/S0925-4773(99)00174-4 [DOI] [PubMed] [Google Scholar]
- Chanaday, N.L., Nosyreva E., Shin O.-H., Zhang H., Aklan I., Atasoy D., Bezprozvanny I., and Kavalali E.T.. 2021. Presynaptic store-operated Ca2+ entry drives excitatory spontaneous neurotransmission and augments endoplasmic reticulum stress. Neuron. 109:1314–1332.e5. 10.1016/j.neuron.2021.02.023 [DOI] [PMC free article] [PubMed] [Google Scholar]
- Chouhan, A.K., Ivannikov M.V., Lu Z., Sugimori M., Llinas R.R., and Macleod G.T.. 2012. Cytosolic calcium coordinates mitochondrial energy metabolism with presynaptic activity. J. Neurosci. 32:1233–1243. 10.1523/JNEUROSCI.1301-11.2012 [DOI] [PMC free article] [PubMed] [Google Scholar]
- Chouhan, A.K., Zhang J., Zinsmaier K.E., and Macleod G.T.. 2010. Presynaptic mitochondria in functionally different motor neurons exhibit similar affinities for Ca2+ but exert little influence as Ca2+ buffers at nerve firing rates in situ. J. Neurosci. 30:1869–1881. 10.1523/JNEUROSCI.4701-09.2010 [DOI] [PMC free article] [PubMed] [Google Scholar]
- Daniels, R.W., Rossano A.J., Macleod G.T., and Ganetzky B.. 2014. Expression of multiple transgenes from a single construct using viral 2A peptides in Drosophila. PLoS One. 9:e100637. 10.1371/journal.pone.0100637 [DOI] [PMC free article] [PubMed] [Google Scholar]
- Datta, S., and Jaiswal M.. 2021. Mitochondrial calcium at the synapse. Mitochondrion. 59:135–153. 10.1016/j.mito.2021.04.006 [DOI] [PubMed] [Google Scholar]
- de Juan-Sanz, J., Holt G.T., Schreiter E.R., de Juan F., Kim D.S., and Ryan T.A.. 2017. Axonal endoplasmic reticulum Ca2+ content controls release probability in CNS nerve terminals. Neuron. 93:867–881.e6. 10.1016/j.neuron.2017.01.010 [DOI] [PMC free article] [PubMed] [Google Scholar]
- Edelstein, A.D., Tsuchida M.A., Amodaj N., Pinkard H., Vale R.D., and Stuurman N.. 2014. Advanced methods of microscope control using μManager software. J. Biol. Methods. 1. 10.14440/jbm.2014.36 [DOI] [PMC free article] [PubMed] [Google Scholar]
- Gudlur, A., Zeraik A.E., Hirve N., Rajanikanth V., Bobkov A.A., Ma G., Zheng S., Wang Y., Zhou Y., Komives E.A., and Hogan P.G.. 2018. Calcium sensing by the STIM1 ER-luminal domain. Nat. Commun. 9:4536. 10.1038/s41467-018-06816-8 [DOI] [PMC free article] [PubMed] [Google Scholar]
- Han, C., Jan L.Y., and Jan Y.-N.. 2011. Enhancer-driven membrane markers for analysis of nonautonomous mechanisms reveal neuron-glia interactions in Drosophila. Proc. Natl. Acad. Sci. USA. 108:9673–9678. 10.1073/pnas.1106386108 [DOI] [PMC free article] [PubMed] [Google Scholar]
- Jennette, M.R., Baraniak J.H., Zhou Y., and Gill D.L.. 2022. The unfolding and activation of STIM1 in store-operated calcium signal generation. Cell Calcium. 102:102537. 10.1016/j.ceca.2022.102537 [DOI] [PMC free article] [PubMed] [Google Scholar]
- Jouaville, L.S., Pinton P., Bastianutto C., Rutter G.A., and Rizzuto R.. 1999. Regulation of mitochondrial ATP synthesis by calcium: Evidence for a long-term metabolic priming. Proc. Natl. Acad. Sci. USA. 96:13807–13812. 10.1073/pnas.96.24.13807 [DOI] [PMC free article] [PubMed] [Google Scholar]
- Kuijpers, M., Kochlamazashvili G., Stumpf A., Puchkov D., Swaminathan A., Lucht M.T., Krause E., Maritzen T., Schmitz D., and Haucke V.. 2021. Neuronal autophagy regulates presynaptic neurotransmission by controlling the axonal endoplasmic reticulum. Neuron. 109:299–313.e9. 10.1016/j.neuron.2020.10.005 [DOI] [PMC free article] [PubMed] [Google Scholar]
- Kuromi, H., and Kidokoro Y.. 2002. Selective replenishment of two vesicle pools depends on the source of Ca2+ at the Drosophila synapse. Neuron. 35:333–343. 10.1016/S0896-6273(02)00777-8 [DOI] [PubMed] [Google Scholar]
- Lattao, R., Bonaccorsi S., Guan X., Wasserman S.A., and Gatti M.. 2011. Tubby-tagged balancers for the Drosophila X and second chromosomes. Fly. 5:369–370. 10.4161/fly.5.4.17283 [DOI] [PMC free article] [PubMed] [Google Scholar]
- Lauwers, E., Goodchild R., and Verstreken P.. 2016. Membrane lipids in presynaptic function and disease. Neuron. 90:11–25. 10.1016/j.neuron.2016.02.033 [DOI] [PubMed] [Google Scholar]
- Lindhout, F.W., Cao Y., Kevenaar J.T., Bodzęta A., Stucchi R., Boumpoutsari M.M., Katrukha E.A., Altelaar M., MacGillavry H.D., and Hoogenraad C.C.. 2019. VAP-SCRN1 interaction regulates dynamic endoplasmic reticulum remodeling and presynaptic function. EMBO J. 38:e101345. 10.15252/embj.2018101345 [DOI] [PMC free article] [PubMed] [Google Scholar]
- Liou, J., Kim M.L., Heo W.D., Jones J.T., Myers J.W., Ferrell J.E. Jr, and Meyer T.. 2005. STIM is a Ca2+ sensor essential for Ca2+-store-depletion-triggered Ca2+ influx. Curr. Biol. 15:1235–1241. 10.1016/j.cub.2005.05.055 [DOI] [PMC free article] [PubMed] [Google Scholar]
- Macleod, G.T., Hegström-Wojtowicz M., Charlton M.P., and Atwood H.L.. 2002. Fast calcium signals in Drosophila motor neuron terminals. J. Neurophysiol. 88:2659–2663. 10.1152/jn.00515.2002 [DOI] [PubMed] [Google Scholar]
- Menon, K.P., Carrillo R.A., and Zinn K.. 2013. Development and plasticity of the Drosophila larval neuromuscular junction. Wiley Interdiscip. Rev. Dev. Biol. 2:647–670. 10.1002/wdev.108 [DOI] [PMC free article] [PubMed] [Google Scholar]
- Montenegro, G., Rebelo A.P., Connell J., Allison R., Babalini C., D’Aloia M., Montieri P., Schüle R., Ishiura H., Price J., et al. 2012. Mutations in the ER-shaping protein reticulon 2 cause the axon-degenerative disorder hereditary spastic paraplegia type 12. J. Clin. Invest. 122:538–544. 10.1172/JCI60560 [DOI] [PMC free article] [PubMed] [Google Scholar]
- Muallem, S., Chung W.Y., Jha A., and Ahuja M.. 2017. Lipids at membrane contact sites: Cell signaling and ion transport. EMBO Rep. 18:1893–1904. 10.15252/embr.201744331 [DOI] [PMC free article] [PubMed] [Google Scholar]
- Newman, Z.L., Hoagland A., Aghi K., Worden K., Levy S.L., Son J.H., Lee L.P., and Isacoff E.Y.. 2017. Input-specific plasticity and homeostasis at the Drosophila larval neuromuscular junction. Neuron. 93:1388–1404.e10. 10.1016/j.neuron.2017.02.028 [DOI] [PMC free article] [PubMed] [Google Scholar]
- Oliva, M.K., Pérez-Moreno J.J., O’Shaughnessy J., Wardill T.J., and O’Kane C.J.. 2020. Endoplasmic reticulum lumenal indicators in Drosophila reveal effects of HSP-related mutations on endoplasmic reticulum calcium dynamics. Front. Neurosci. 14:816. 10.3389/fnins.2020.00816 [DOI] [PMC free article] [PubMed] [Google Scholar]
- O’Sullivan, N.C., Jahn T.R., Reid E., and O’Kane C.J.. 2012. Reticulon-like-1, the Drosophila orthologue of the hereditary spastic paraplegia gene reticulon 2, is required for organization of endoplasmic reticulum and of distal motor axons. Hum. Mol. Genet. 21:3356–3365. 10.1093/hmg/dds167 [DOI] [PMC free article] [PubMed] [Google Scholar]
- Öztürk, Z., O’Kane C.J., and Pérez-Moreno J.J.. 2020. Axonal endoplasmic reticulum dynamics and its roles in neurodegeneration. Front. Neurosci. 14:48. 10.3389/fnins.2020.00048 [DOI] [PMC free article] [PubMed] [Google Scholar]
- Pérez-Moreno, J.J., and O’Kane C.J.. 2019. GAL4 drivers specific for type Ib and type is motor neurons in Drosophila. G3. 9:453–462. 10.1534/g3.118.200809 [DOI] [PMC free article] [PubMed] [Google Scholar]
- Petkovic, M., Jemaiel A., Daste F., Specht C.G., Izeddin I., Vorkel D., Verbavatz J.-M., Darzacq X., Triller A., Pfenninger K.H., et al. 2014. The SNARE Sec22b has a non-fusogenic function in plasma membrane expansion. Nat. Cell Biol. 16:434–444. 10.1038/ncb2937 [DOI] [PubMed] [Google Scholar]
- Port, F., Chen H.-M., Lee T., and Bullock S.L.. 2014. Optimized CRISPR/Cas tools for efficient germline and somatic genome engineering in Drosophila. Proc. Natl. Acad. Sci. USA. 111:E2967–E2976. 10.1073/pnas.1405500111 [DOI] [PMC free article] [PubMed] [Google Scholar]
- Rao, K., Stone M.C., Weiner A.T., Gheres K.W., Zhou C., Deitcher D.L., Levitan E.S., and Rolls M.M.. 2016. Spastin, atlastin, and ER relocalization are involved in axon but not dendrite regeneration. Mol. Biol. Cell. 27:3245–3256. 10.1091/mbc.E16-05-0287 [DOI] [PMC free article] [PubMed] [Google Scholar]
- Rizzuto, R., Brini M., Murgia M., and Pozzan T.. 1993. Microdomains with high Ca2+ close to IP3-sensitive channels that are sensed by neighboring mitochondria. Science. 262:744–747. 10.1126/science.8235595 [DOI] [PubMed] [Google Scholar]
- Sanyal, S. 2009. Genomic mapping and expression patterns of C380, OK6 and D42 enhancer trap lines in the larval nervous system of Drosophila. Gene Expr. Patterns. 9:371–380. 10.1016/j.gep.2009.01.002 [DOI] [PubMed] [Google Scholar]
- Sanyal, S., Consoulas C., Kuromi H., Basole A., Mukai L., Kidokoro Y., Krishnan K.S., and Ramaswami M.. 2005. Analysis of conditional paralytic mutants in Drosophila sarco-endoplasmic reticulum calcium ATPase reveals novel mechanisms for regulating membrane excitability. Genetics. 169:737–750. 10.1534/genetics.104.031930 [DOI] [PMC free article] [PubMed] [Google Scholar]
- Schindelin, J., Arganda-Carreras I., Frise E., Kaynig V., Longair M., Pietzsch T., Preibisch S., Rueden C., Saalfeld S., Schmid B., et al. 2012. Fiji: An open-source platform for biological-image analysis. Nat. Methods. 9:676–682. 10.1038/nmeth.2019 [DOI] [PMC free article] [PubMed] [Google Scholar]
- Serwach, K., and Gruszczynska-Biegala J.. 2020. Target molecules of STIM proteins in the central nervous system. Front. Mol. Neurosci. 13:617422. 10.3389/fnmol.2020.617422 [DOI] [PMC free article] [PubMed] [Google Scholar]
- Shen, Y., Thillaiappan N.B., and Taylor C.W.. 2021. The store-operated Ca2+ entry complex comprises a small cluster of STIM1 associated with one orai1 channel. Proc. Natl. Acad. Sci. USA. 118:e2010789118. 10.1073/pnas.2010789118 [DOI] [PMC free article] [PubMed] [Google Scholar]
- Shibata, Y., Hu J., Kozlov M.M., and Rapoport T.A.. 2009. Mechanisms shaping the membranes of cellular organelles. Annu. Rev. Cell Dev. Biol. 25:329–354. 10.1146/annurev.cellbio.042308.113324 [DOI] [PubMed] [Google Scholar]
- Singh, N., Bartol T., Levine H., Sejnowski T., and Nadkarni S.. 2021. Presynaptic endoplasmic reticulum regulates short-term plasticity in hippocampal synapses. Commun. Biol. 4:241. 10.1038/s42003-021-01761-7 [DOI] [PMC free article] [PubMed] [Google Scholar]
- Stewart, B.A., Atwood H.L., Renger J.J., Wang J., and Wu C.F.. 1994. Improved stability of Drosophila larval neuromuscular preparations in haemolymph-like physiological solutions. J. Comp. Physiol. A. 175:179–191. 10.1007/BF00215114 [DOI] [PubMed] [Google Scholar]
- Summerville, J.B., Faust J.F., Fan E., Pendin D., Daga A., Formella J., Stern M., and McNew J.A.. 2016. The effects of ER morphology on synaptic structure and function in Drosophila melanogaster. J. Cell Sci. 129:1635–1648. 10.1242/jcs.184929 [DOI] [PMC free article] [PubMed] [Google Scholar]
- Suzuki, J., Kanemaru K., Ishii K., Ohkura M., Okubo Y., and Iino M.. 2014. Imaging intraorganellar Ca2+ at subcellular resolution using CEPIA. Nat. Commun. 5:4153. 10.1038/ncomms5153 [DOI] [PMC free article] [PubMed] [Google Scholar]
- Terasaki, M. 2018. Axonal endoplasmic reticulum is very narrow. J. Cell Sci. 131:jcs210450. 10.1242/jcs.210450 [DOI] [PubMed] [Google Scholar]
- Thiel, K., Heier, C., Haberl, V., Thul, P.J., Oberer, M., Lass, A., Jäckle, H., & Beller, M.. 2013. The evolutionary conserved protein CG9186 is associated with lipid droplets, required for their positioning and for fat storage. J. Cell Sci. 126:2198–2212. 10.1242/jcs.120493 [DOI] [PMC free article] [PubMed] [Google Scholar]
- Tran, V., and Stricker C.. 2021. Spontaneous and action potential-evoked Ca2+ release from endoplasmic reticulum in neocortical synaptic boutons. Cell Calcium. 97:102433. 10.1016/j.ceca.2021.102433 [DOI] [PubMed] [Google Scholar]
- Verstreken, P., Ly C.V., Venken K.J.T., Koh T.-W., Zhou Y., and Bellen H.J.. 2005. Synaptic mitochondria are critical for mobilization of reserve pool vesicles at Drosophila neuromuscular junctions. Neuron. 47:365–378. 10.1016/j.neuron.2005.06.018 [DOI] [PubMed] [Google Scholar]
- Verstreken, P., Ohyama T., Haueter C., Habets R.L.P., Lin Y.Q., Swan L.E., Ly C.V., Venken K.J.T., De Camilli P., and Bellen H.J.. 2009. Tweek, an evolutionarily conserved protein, is required for synaptic vesicle recycling. Neuron. 63:203–215. 10.1016/j.neuron.2009.06.017 [DOI] [PMC free article] [PubMed] [Google Scholar]
- Voeltz, G.K., Prinz W.A., Shibata Y., Rist J.M., and Rapoport T.A.. 2006. A class of membrane proteins shaping the tubular endoplasmic reticulum. Cell. 124:573–586. 10.1016/j.cell.2005.11.047 [DOI] [PubMed] [Google Scholar]
- Wakefield, S., and Tear G.. 2006. The Drosophila reticulon, Rtnl-1, has multiple differentially expressed isoforms that are associated with a sub-compartment of the endoplasmic reticulum. Cell. Mol. Life Sci. 63:2027–2038. 10.1007/s00018-006-6142-3 [DOI] [PMC free article] [PubMed] [Google Scholar]
- Williams, R.T., Manji S.S.M., Parker N.J., Hancock M.S., Van Stekelenburg L., Eid J.-P., Senior P.V., Kazenwadel J.S., Shandala T., Saint R., et al. 2001. Identification and characterization of the STIM (stromal interaction molecule) gene family: Coding for a novel class of transmembrane proteins. Biochem. J. 357:673–685. 10.1042/bj3570673 [DOI] [PMC free article] [PubMed] [Google Scholar]
- Wu, Y., Whiteus C., Xu C.S., Hayworth K.J., Weinberg R.J., Hess H.F., and De Camilli P.. 2017. Contacts between the endoplasmic reticulum and other membranes in neurons. Proc. Natl. Acad. Sci. USA. 114:E4859–E4867. 10.1073/pnas.1701078114 [DOI] [PMC free article] [PubMed] [Google Scholar]
- Yalçın, B., Zhao L., Stofanko M., O’Sullivan N.C., Kang Z.H., Roost A., Thomas M.R., Zaessinger S., Blard O., Patto A.L., et al. 2017. Modeling of axonal endoplasmic reticulum network by spastic paraplegia proteins. Elife. 6:e23882. 10.7554/eLife.23882 [DOI] [PMC free article] [PubMed] [Google Scholar]
- Yeh, E., Gustafson K., and Boulianne G.L.. 1995. Green fluorescent protein as a vital marker and reporter of gene expression in Drosophila. Proc. Natl. Acad. Sci. USA. 92:7036–7040. 10.1073/pnas.92.15.7036 [DOI] [PMC free article] [PubMed] [Google Scholar]
Associated Data
This section collects any data citations, data availability statements, or supplementary materials included in this article.
Supplementary Materials
shows Drosophila stocks used or generated in this work.
shows crosses used in this work.
shows reagents used in this work.
is the source file for Fig. S2.
Data Availability Statement
The underpinning dataset for this article is openly available at the University of Cambridge Data Repository (https://www.repository.cam.ac.uk): https://doi.org/10.17863/CAM.93878.


