

Abstract
A growing body of preclinical and clinical literature suggests that brain-gut-microbiota interactions may contribute to obesity pathogenesis. In this study, we use a machine learning approach to leverage the enormous amount of microstructural neuroimaging and fecal metabolomic data to better understand key drivers of the obese compared to overweight phenotype. Our findings reveal that although gut-derived factors play a role in this distinction, it is primarily brain-directed changes that differentiate obese from overweight individuals. Of the key gut metabolites that emerged from our model, many are likely at least in part derived or influenced by the gut-microbiota, including some amino-acid derivatives. Remarkably, key regions outside of the central nervous system extended reward network emerged as important differentiators, suggesting a role for previously unexplored neural pathways in the pathogenesis of obesity.
Subject terms: Systems biology, Diseases
Introduction
The obesity epidemic has emerged as a major public health crisis nationally and internationally1,2. In addition to costing the healthcare system hundreds of billions of dollars, there are countless associated negative health outcomes including cancers, endocrinological disorders, musculoskeletal disorders, and a well-documented increase in premature mortality from cardiovascular disease3. Additionally, the distinction between overweight and obese is becoming increasingly important as many studies have demonstrated a dose-dependent relationship between excess weight or body mass index (BMI) and health outcomes4,5.
The pathophysiology of obesity remains complex, representing a derangement of energy homeostasis and gut endocrine signaling, especially within the context of aberrant insulin sensitivity and regulation, in addition to disruptions in the fine balance of pro- and anti-satiety signals in the gut6,7. In brief, gut hormones such as ghrelin produce hunger and cravings8,9, while hormones such as glucagon like peptide (GLP)-110 and peptide tyrosine tyrosine (PYY)11 trigger satiety. External factors, such as the gut microbiota, can disrupt this carefully orchestrated homeostatic energy balance. For example, spore forming microbes found in the human gut microbiome can influence enteroendocrine cells of the gut to release more or less GLP-1 in response to microbiota-derived secondary bile acids12.
Obesity, however, is just as much a disorder of the endocrine system as it is of the brain, especially with respect to the extended reward network, which is responsible for processing rewarding stimuli and food-seeking behaviors. Key regions of the extended reward network that have been implicated include those related to salience, executive control, core reward, sensorimotor, and emotional regulation-related processes13–17. Despite the robust body of neuroscience research on obesity, investigations have almost exclusively focused on understanding how the obese brain differs from the non-obese brain; no studies have investigated central nervous system (CNS) changes that differentiate obese from overweight individuals. In addition to identifying anatomical and functional alterations in specific brain regions, more recent efforts have focused on identifying alterations in brain network properties18. To assess brain connectivity, graph theory has been leveraged to perform complex network analysis. In this way, we can quantify the anatomic and functional contributions to information flow within the context of a global, whole brain network19–22. Previous investigations used this approach to explore CNS alterations between high BMI and normal BMI brain connectivity23,24.
Perhaps attributed to the feasibility of more computationally rigorous approaches, combined with an overwhelming amount of data, the last decade has seen an explosion of research leveraging systems-based approaches to understanding complex human disease states, such as obesity. One such example has been to view obesity as a brain-gut disorder, with the gut microbiome also likely to modulate these interactions. Most of the high quality evidence to suggest a role for these brain-gut interactions have been from pre-clinical studies, or primarily cross-sectional clinical studies25,26. It is important to note that there has been limited progress in developing effective, long-lasting treatments for obesity27,28. This is likely driven by both the complex pathophysiology of obesity, combined with the failure to view obesity through a systems biology lens, incorporating both neuroimaging and gut metabolite data. Recent advances in machine learning have allowed for the ability to build robust, predictive models that can distill very large amounts of data into a smaller number of highly impactful features. Here, we use a machine learning approach to leverage the enormous amount of neuroimaging and fecal metabolomic data to better understand key drivers of the obese compared to overweight phenotype.
Methods
Study participants
The total sample was comprised of 117 right-handed healthy adult (age ≥ 18) volunteers (36 males and 81 females). A medical exam and clinical assessment that included a modified Mini-International Neuropsychiatric Interview Plus 5.0 (MINI) (27) was administered to confirm the absence of significant medical or psychiatric conditions. Subjects were excluded from participating in the study for any of the following reasons: pregnant or lactating, substance abuse, abdominal surgery, tobacco dependence (smoked half a pack of cigarettes or more daily), extreme strenuous exercise (> 8 h of continuous exercise per week), current or past psychiatric illness, and major medical or neurological conditions. Subjects taking medications that interfere with the central nervous system (full dose antidepressants including SSRI, NSRIs, sedatives or anxiolytics) or regular use of analgesic drugs (including narcotics, opioids, and α2-δ ligands) were excluded. Since female sex hormones such as estrogen are known to effect brain structure and function, in this study we used women who were premenopausal and who were scanned during the follicular phase of their menstrual cycles as determined by self-report of their last day of the menstrual cycle.
Subjects with hypertension, diabetes, or metabolic syndrome were also excluded from the study to minimize confounding effects from our findings. For the same reason, subjects with eating disorders such as anorexia or bulimia nervosa were also excluded. For the purpose of our analyses, we used BMI cutoffs to define our groups: Overweight individuals had a BMI ≥ 25 but < 30, obese individuals had a BMI > 30. Individuals with normal BMIs or who had BMIs that would be considered underweight were excluded from our analysis (BMI < 25). No subjects exceeded 400lbs due to MRI scanning weight limits.
All procedures complied with the principles of the Declaration of Helsinki and were approved by the Institutional Review Board at UCLA’s Office of Protection for Research Subjects (approval numbers 11-000069 and 12-001802). All subjects provided written informed consent.
MRI acquisition
A 3.0 T Siemens Trio scanner was used to perform whole brain structural, and diffusion tensor (DTI) magnetic resonance imaging. Noise reducing headphones were used. Automated data processing and computational workflows for structural and diffusion tensor imaging data were designed and implemented in collaboration with the University of Southern California Laboratory of Neuroimaging (LONI) Pipeline (pipeline.loni.usc.edu).
Structural gray-matter
For registration purposes, a high resolution structural image was obtained from each subject using a magnetization-prepared rapid acquisition gradient-echo sequence, repetition time = 2200 ms, echo time = 3.26 ms, structural acquisition time = 5 m 12 s, slice thickness = 1 mm, 176 slices, 256*256 voxel matrix, 1 mm voxel size.
Anatomical connectivity (DTI)
Diffusion-weighted MRIs (DWIs) were acquired according to two comparable acquisition protocols. Specifically, DWIs were acquired in either 61 or 64 noncolinear directions with b = 1000 s/mm2, with 8 or 1 b = 0 s/mm2 images, respectively. Both protocols had a TR = 9400 ms, TE = 83 ms, and field of view (FOV) = 256 mm with an acquisition matrix of 128 × 128, and a slice thickness of 2 mm to produce 2 × 2 × 2 mm3 isotropic voxels.
MRI preprocessing and quality control
Structural gray-matter
Structural T1-image segmentation and regional parcellation were conducted using FreeSurfer 29,30 following the nomenclature described in Destrieux et al. 31. This parcellation results in the labeling of 165 regions, 74 bilateral cortical structures, 7 subcortical structures, the midbrain, and the cerebellum32.
Anatomical connectivity (DTI)
Diffusion weighted images (DWI) were corrected for motion and used to compute diffusion tensors that were rotationally re-oriented at each voxel. The diffusion tensor images were realigned based on trilinear interpolation of log-transformed tensors as described in Chiang et al. 33 and resampled to an isotropic voxel resolution (2 × 2 × 2 mm3). White matter connectivity for each subject was estimated between the 165 brain regions using DTI fiber tractography 32, performed via the Fiber Assignment by Continuous Tracking (FACT) algorithm 34 using TrackVis (http://trackvis.org).
Anatomical MRI network construction
Connection matrix
Regional parcellation and tractography results were combined to produce a weighted, unidirected connectivity matrix. The final estimate of white matter connectivity between each of the brain regions was determined based on the number of fiber tracts intersecting each region. Weights of the connections were then expressed as the absolute fiber count divided by the individual volumes of the two interconnected regions 21.
Computing network metrics
The Graph Theory GLM toolbox (GTG) (www.nitrc.org/projects/metalab_gtg) and in-house matlab scripts were applied to the subject-specific anatomical brain networks to compute three local weighted network metrics indexing centrality. The network metrics are described below 22,35–37.
Measures of centrality quantify the importance of a region’s influence on communication and information flow in large-scale brain networks. These measures include strength, betweenness centrality and eigenvector centrality. Strength represents the number of connections (fiber tracts) a given brain region has, factoring in the “weight” of each connection and reflects a brain region’s total level of impact in the network. Betweenness centrality describes degree to which a brain region lies on the shortest path between two other regions. Acting as way stations, regions with high betweenness centrality are topologically primed to control communication between other regions38. Eigenvector centrality reflects how connected a given brain region is to other brain regions with high centrality (greater number of fiber tracts) and is a measure of a region’s overall influence on the network39.
Stool collection and processing
Fecal samples were aliquoted under liquid nitrogen and shipped to Metabolon for processing and analysis as a single batch on their global metabolomics and bioinformatics platform. Data was curated by mass spectroscopy using established protocols and software as previously described40. The samples of stool were all collected within a week of the subjects’ MRIs.
Machine learning model
A balanced, binary classification label was defined using clinical information about each participant’s weight.
For both the metabolite and brain DTI network metric datasets, the number of variables (987 and 2156 respectively) greatly outnumber the sample size of 117. Machine learning models containing this many feature with a comparatively smaller sample size often contain uninformative variables that lower the model’s classification accuracy. In order to arrive at an optimal, reduced feature space that gave a superior classification, a feature selection technique known as Recursive Feature Elimination (RFE) was utilized with cross validation. Previous work has shown RFE using a Support Vector Machine Estimator (SVM-RFE) to be effective at small sample size and high dimensional data modeling41.
RFE is a wrapper feature selection technique that essentially performs backwards selection on the predictors. A linear model is initially trained on the entire set of features, and iteratively, the features with the lowest weight are removed until a certain target of features to be kept is met. We used a Support Vector Machine (SVM) with a linear kernel as our model for RFE.
In this study, two different types of cross validation were used. K-fold cross validation is a resampling procedure that can be used to evaluate a machine learning model’s performance on a limited dataset. In this process the dataset is partitioned into k different, equally sized, subsets, which are termed folds. Of these k folds, a single one is isolated as a test data set while the rest of the data are designated for training. This process is repeated k times, with a different fold designated as test data at each iteration. Here, we used ten-fold cross validation and leave-one-out (LOO) cross validation, which involves iteratively isolating a single sample as test data and using the rest as training data42.
To determine the best target number of features to keep using RFE, a candidate range from 1 feature, all the way to the entire feature space was considered. RFE was performed with LOO cross validation for each candidate. The number of features that recorded the highest average test data accuracy was determined to be the optimal number of features to keep.
Using this optimal number, RFE was then performed again with ten-fold cross validation To determine the final feature subset, a voting strategy was used43. For each fold, a different subset of features was selected by RFE. Each time a feature was included in a fold’s RFE selection, it received a count, or “vote.” If “n” were the optimal number of features to keep, then the final subset of selected features was determined to be the top “n” features by votes across folds43.
This process was performed on both the metabolite and brain DTI datasets to arrive at minimal feature sets that maximized accuracy.
To further assess the ability of these chosen variables to classify obesity, SVM with a linear kernel, ridge classifier, and logistic regression models were created and trained on just these features. In addition to the isolated variables, patient age and sex were also included as model predictors. For the metabolite model, patient diet was included as well. Logistic regression and a ridge classifier, being different models than the one used as an estimator for RFE, were used to ensure robustness and linear separability of the data. The predictive ability of each of these final models was assessed using LOO cross validation.
Finally, a combined model was created by merging the top 90 percent of features by absolute value of model weight, from each of the final brain and metabolite models. This model was also assessed using leave one out cross validation.
For each model, in addition to overall accuracy, precision and recall were calculated as well. Precision is defined as the number of true positives over the number of true positives plus the number of false positives. Recall is defined as the number of true positives over the number of true positives plus the number of false negatives. In other words, precision is the proportion of predicted trues that were actually true, and recall is the proportion of actual trues that were correctly predicted as true by the model. Precision and recall were calculated for both the very obese and obese classes.
As an additional way to ensure that overfitting was not occurring, a permutation test was performed by randomly shuffling the labels and retraining all three (brain, metabolite, and combined) models44. With the null hypothesis that there is no difference between the original model’s test accuracy versus the test accuracy after shuffling the labels, this test illustrates whether the model actually learned based on the particular relationship between the features and the label, or otherwise simply fit very closely to our high dimensional feature data with a small sample size. If the latter occurred, then we would see that the model would still have an above average test accuracy or have overfit and learned something from this random data.
Figure 1 provides a high-level overview of the methodology.
Figure 1.

Study overview. In this study, we distil over three thousand unique brain microstructural and gut metabolite data into 76 brain and 50 metabolite features. These features were then used to create a machine learning model that could predict if patients were overweight or obese with over 90% accuracy.
Results
Sample characteristics
The total sample (N = 117) included 64 obese individuals (females = 47, males = 17), mean age = 33.203125, standard deviation 10.2457, and 53 overweight individuals (females = 34, males = 19) mean age = 31.4528, standard deviation = 10.964. Clinical characteristics are summarized in Table 1.
Table 1.
Clinical characteristics.
| Column name | Overweight (n = 53) |
Std | Obese (n = 64) | Std | P-value | T-value |
|---|---|---|---|---|---|---|
| Diets |
American: 12 Other: 41 |
– |
American: 29 Other: 35 |
– | 0.01024 | − 2.6106 |
| Sexes |
Male: 19 Female: 34 |
– |
Male: 17 Female: 47 |
– | 0.28261 | 1.07951 |
| Ages | 28.0 | 10.964 | 31.0 | 10.246 | 0.37888 | 0.88335 |
| BMI | 27.60274 | 1.61979 | 34.52796 | 3.79251 | 0.0 | 12.2843 |
Recursive feature elimination results
Our feature selection method identified 83 DTI features out of 2156 total variables for the brain model (Fig. 2A, SuppTable 1).
Figure 2.

Recursive feature elimination graph of brain network metrics (A) and metabolites (B). A linear model is first developed incorporating all features and iteratively, the features with the lowest weight are removed. These graphs demonstrate the relationship between model accuracy and the number of features kept.
Out of 987 total metabolites, our feature selection method identified 57 variables for the metabolite model (Fig. 2B, SuppTable 2).
Brain classifier
An SVM model trained on this subset of DTI features identified by our RFE method achieved 90.25 percent accuracy in discriminating very obese patients from obese patients (Fig. 3A). The obese class (0 class) had a precision of 0.90 and a recall of 0.88. The extremely obese (1 class) had a precision of 0.91 and a recall of 0.92.
Figure 3.

Receiver operating characteristic curve of support-vector machine model using brain features (A) exclusively, metabolite features exclusively (B).
Interestingly, the 83 isolated DTI network metric features were all either node betweenness centrality or average path length measures of various parts of the brain. Out of the 83 isolated features, all of the corresponding brain regions were unique except for nine. The left triangular part of the frontal gyrus (L_InfFGTrip), left fronto marginal gyrus (of Wernicke) and sulcus (L_FMarG_S), right occipital pole (R_OcPo), right intraparietal (interparietal sulcus) and transverse parietal sulci (R_IntPS_TrPS), right transverse frontopolar gyri and sulci (R_TrFPoG_S), left inferior segment of the circular sulcus of the insula (L_InfCirIns), right inferior temporal sulcus (R_InfTS), Transverse frontopolar gyri and sulci(L_TrFPoG_S), and left caudate nucleus (L_CaN) each had both its node betweenness centrality and average path length measures in the identified feature set.
The three features with the largest positive weight, influencing the model most towards classification as extremely obese are average path length of the left pericallosal sulcus (AvPathLength__L_PerCaS), average path length of inferior occipital gyrus and sulcus (AvPathLength__L_InfOcG_S), and node betweeness centrality of the left temporal pole (NodeBWCent__L_Tpo). On the other hand, the three features with the largest negative weight, influencing our model towards classification as just obese are average path length of the right long insular gyrus and central insular sulcus (AvPathLength__RLoInG_CInS), average path length of the left middle-posterior part of the cingulate gyrus and sulcus (AvPathLength__L_MPosCgG_S), and posterior dorsal part of the cingulate gyrus (AvPathLength__PosDCgG) (SuppFigure 1).
Metabolite classifier
An SVM model trained on this subset of metabolite features identified by our RFE method achieved 79.84 percent accuracy in discriminating very obese patients from obese patients (Fig. 3B). The obese (0 class) had a precision of 0.79 and a recall of 0.76. The extremely obese (1 class) had a precision of 0.81 and a recall of 0.83.
The three features with the largest positive weight, influencing the model towards classification as extremely obese were acesulfame, N-acetylisoleucine, and 1,2-dilinoleoyl-GPC (18:2/18:2). On the other hand, the three features with the largest negative weight, influencing the model towards classification as obese, were 1-oleoyl-GPC (18:1), pregnen-diol sulfate, and glyocholate (SuppFigure 2).
Combined classifier
Combining the top 90 percent of features by absolute value of weight from the two described models above yielded a new feature subset of 126 variables (50 metabolite variables and 76 brain dti nm variables) (Table 2). The SVM model trained on this subset of features slightly outperformed the brain classifier. It achieved 90.49 percent accuracy in discriminating very obese patients from obese patients (Fig. 4). The obese class (0 class) had a precision of 0.90 and a recall of 0.89, and the extremely obese class (1 class) had a precision of 0.91 and a recall of 0.92.
Table 2.
Brain and metabolites features included in combined support-vector machine model of obesity.
| Column name | Info | SVM weight | P-value | T-value |
|---|---|---|---|---|
| 1-oleoyl-GPC (18:1) | Metabolite | − 3.20823e−05 | 0.3254347 | − 0.9875739 |
| Glycocholate | Metabolite | − 8.2497e−06 | 0.2450839 | − 1.1683452 |
| Pregnen-diol disulfate* | Metabolite | − 5.24364e−05 | 0.0766891 | − 1.7862797 |
| Nicotinate ribonucleoside | Metabolite | − 1.16909e−05 | 0.5345713 | − 0.6229187 |
| 2-hydroxypalmitate | Metabolite | − 8.8495e-06 | 0.0279664 | − 2.2259563 |
| 12-ketolithocholate | Metabolite | − 6.062e-07 | 0.6234562 | − 0.4922853 |
| 11beta-hydroxyandrosterone sulfate (2) | Metabolite | − 6.3292e-06 | 0.1132935 | − 1.5957305 |
| N-stearoyl-sphinganine (d18:0/18:0)* | Metabolite | 2.2885e−06 | 0.9127752 | 0.10978 |
| Pantoate | Metabolite | − 5.9953e−06 | 0.0844496 | − 1.7404801 |
| 5-hydroxyhexanoate | Metabolite | − 1.05904e−05 | 0.3068464 | − 1.026423 |
| Imidazole propionate | Metabolite | 2.7469e−06 | 0.9937212 | − 0.0078865 |
| Agmatine | Metabolite | − 2.20964e−05 | 0.1105004 | −1.6083507 |
| N-methylproline | Metabolite | − 1.37931e−05 | 0.3443564 | – 0.9495022 |
| Arabitol/xylitol | Metabolite | − 2.07102e−05 | 0.1675273 | − 1.3889653 |
| Deoxymugineic acid | Metabolite | − 9.3404e−06 | 0.2403965 | − 1.1800981 |
| Theobromine | Metabolite | − 4.6408e−06 | 0.8264974 | − 0.219696 |
| Stachydrine | Metabolite | 2.3491e−06 | 0.9693121 | 0.0385549 |
| Docosahexaenoylcarnitine (C22:6)* | Metabolite | − 7.433e−06 | 0.0613478 | − 1.8894642 |
| Carboxyibuprofen | Metabolite | − 2.25928e−05 | 0.4496436 | − 0.7586004 |
| Hyocholate | Metabolite | − 2.7928e−06 | 0.4151871 | − 0.817757 |
| 3,7-dimethylurate | Metabolite | − 4.1805e−06 | 0.7599397 | − 0.3062874 |
| 7-methylxanthine | Metabolite | − 2.2189e−06 | 0.5315353 | − 0.6275615 |
| (R)-salsolinol | Metabolite | − 2.21099e−05 | 0.2229156 | − 1.225434 |
| 5alpha-androstan-3alpha,17beta-diol disulfate | Metabolite | − 7.7926e−06 | 0.2266135 | − 1.2156354 |
| Curcumin | Metabolite | − 7.1795e−06 | 0.1972666 | − 1.2968855 |
| Docosadienoate (22:2n6) | Metabolite | − 6.8086e−06 | 0.2522873 | − 1.1505912 |
| Genistein | Metabolite | 4.88011e−05 | 0.6114582 | 0.5093853 |
| 2′-deoxyadenosine 5′-monophosphate | Metabolite | 1.2038e−06 | 0.785891 | − 0.2722852 |
| 2-(4-hydroxyphenyl)propionate | Metabolite | 1.64756e−05 | 0.2969804 | 1.0476857 |
| Piperine | Metabolite | 3.29415e−05 | 0.5037286 | 0.6707439 |
| 5-(2-Hydroxyethyl)-4-methylthiazole | Metabolite | − 9.7784e−06 | 0.9918073 | 0.0102906 |
| Tyrosol | Metabolite | 1.02517e−05 | 0.0755582 | 1.7932698 |
| N-butyryl-leucine | Metabolite | 5.3575e−06 | 0.0931012 | 1.6933227 |
| I-urobilinogen | Metabolite | 7.58174e−05 | 0.0195845 | 2.36738 |
| N-(2-furoyl)glycine | Metabolite | 2.14319e−05 | 0.3071521 | 1.0257716 |
| OAHSA (18:1/OH-18:0) | Metabolite | − 8.6601e−06 | 0.7071483 | 0.3766223 |
| AMP | Metabolite | − 2.3066e−06 | 0.2627772 | − 1.1253659 |
| Maltose | Metabolite | 2.7173e−06 | 0.3679204 | − 0.9039334 |
| Sulfate of piperine metabolite C16H19NO3 (2)* | Metabolite | 2.01842e−05 | 0.1394363 | 1.488196 |
| gamma-Glutamylalanine | Metabolite | 3.4847e−06 | 0.1697141 | 1.3817916 |
| Docosahexaenoate (DHA; 22:6n3) | Metabolite | 1.79368e−05 | 0.5487737 | 0.6013752 |
| 1-linolenoylglycerol (18:3) | Metabolite | − 2.6022e−06 | 0.5024215 | 0.6728043 |
| 1-oleoylglycerol (18:1) | Metabolite | 5.74495e−05 | 0.2049111 | 1.2749096 |
| Stigmastadienone | Metabolite | 4.6773e−06 | 0.4839874 | 0.7021772 |
| Linoleoyl-linoleoyl-glycerol (18:2/18:2) [1]* | Metabolite | 5.4485e−06 | 0.0342553 | 2.1425781 |
| Levulinate (4-oxovalerate) | Metabolite | 2.1728e−06 | 0.2314901 | 1.2028887 |
| Sucralose | Metabolite | 8.6687e−06 | 0.116412 | 1.5819302 |
| 1,2-dilinoleoyl-GPC (18:2/18:2) | Metabolite | 1.16417e−05 | 0.8407669 | 0.2013676 |
| N-acetylisoleucine | Metabolite | 5.4118e−06 | 0.02041 | 2.3512972 |
| Acesulfame | Metabolite | 2.93443e−05 | 0.222516 | 1.2264998 |
| AvPathLength__R_LoInG_CInS | Somatosensory | − 0.0009482483 | 0.170343 | − 1.3797417 |
| AvPathLength__L_MPosCgG_S | Emotional Regulation | − 0.0009154738 | 0.0139718 | − 2.4961668 |
| AvPathLength__L_PosDCgG | Default Mode Network | − 0.0007531148 | 0.1134375 | − 1.5950865 |
| AvPathLength__R_InfFGOrp | Emotional Regulation | − 0.0005549889 | 0.4141841 | − 0.8195216 |
| NodeBWCent__R_PosCS | Somatosensory | − 0.0006092343 | 0.0692979 | − 1.8336098 |
| AvPathLength__L_InfCirIns | Somatosensory | − 0.0006176458 | 0.0244062 | − 2.2807316 |
| NodeBWCent__R_PosCG | Somatosensory | − 0.0005719311 | 0.6046272 | − 0.5191882 |
| NodeBWCent__L_RG | Emotional Regulation | − 0.0006018847 | 0.6067252 | − 0.5161723 |
| AvPathLength__R_PrCun | Default Mode Network | − 0.0005846671 | 0.0411581 | − 2.0651356 |
| NodeBWCent__L_ACgG_S | Emotional Regulation | − 0.0005199462 | 0.8344359 | − 0.2094906 |
| NodeBWCent__R_TrFPoG_S | Default Mode Network | − 0.000550803 | 0.4761666 | − 0.7148237 |
| AvPathLength__L_OcPo | Occipital | − 0.0005372031 | 0.3719004 | − 0.8964214 |
| AvPathLength__R_PosTrCoS | Interlobe | − 0.0005350337 | 0.1452779 | − 1.4663656 |
| NodeBWCent__R_AngG | Default Mode Network | − 0.0004671307 | 0.4646458 | − 0.7336653 |
| AvPathLength__R_PerCaS | Emotional Regulation | − 0.0004534601 | 0.0093628 | − 2.6430109 |
| AvPathLength__R_AOcS | Occipital | − 0.0004988374 | 0.0586744 | − 1.9096126 |
| NodeBWCent__L_CS | Somatosensory | − 0.0004482049 | 0.6791227 | − 0.4147156 |
| AvPathLength__R_SbOrS | Emotional Regulation | − 0.0005218257 | 0.0774365 | − 1.7817068 |
| AvPathLength__R_PaHipG | Emotional Regulation | − 0.0005000987 | 0.7399951 | − 0.3326619 |
| NodeBWCent__L_MOcG | Occipital | − 0.0004343127 | 0.1116088 | − 1.6033124 |
| NodeBWCent__R_MPosCgG_S | Emotional Regulation | − 0.000483703 | 0.3756011 | − 0.8894819 |
| NodeBWCent__L_PaHipG | Emotional Regulation | − 0.0004352314 | 0.5103618 | − 0.6603312 |
| AvPathLength__L_InfFGTrip | Emotional Regulation | − 0.000433419 | 0.2284636 | − 1.2107763 |
| AvPathLength__L_MACgG_S | Emotional Regulation | − 0.0003845632 | 0.0829239 | − 1.7492025 |
| NodeBWCent__L_PosCG | Somatosensory | − 0.0004257865 | 0.1377684 | − 1.4945595 |
| NodeBWCent__R_Hip | Emotional Regulation | − 0.0004448703 | 0.7521676 | 0.3165386 |
| NodeBWCent__L_TrFPoG_S | Default Mode Network | − 0.0004187044 | 0.5716848 | − 0.5671986 |
| NodeBWCent__R_OcPo | Occipital | − 0.0003524324 | 0.9782904 | − 0.0272716 |
| AvPathLength__L_FMarG_S | Executive | − 0.0004036164 | 0.2131851 | − 1.251794 |
| AvPathLength__R_SupPrCs | Somatosensory | − 0.0002847931 | 0.3299016 | − 0.9784583 |
| NodeBWCent__R_Tha | Somatosensory | − 0.0003020804 | 0.4789275 | − 0.7103462 |
| NodeBWCent__R_MOcG | Occipital | − 0.0003067178 | 0.3078318 | − 1.0243248 |
| NodeBWCent__L_SupFG | Somatosensory | − 0.0002481055 | 0.5374476 | 0.6185325 |
| NodeBWCent__R_SupFS | Somatosensory | − 0.0002719212 | 0.6366603 | − 0.4736319 |
| NodeBWCent__L_CaN | Core Reward | − 0.0002289915 | 0.0463734 | − 2.0137213 |
| NodeBWCent__L_PaCL_S | Somatosensory | − 0.0001960458 | 0.5392911 | − 0.6157276 |
| AvPathLength__L_InfFGOrp | Emotional Regulation | − 0.0002701086 | 0.69713 | 0.3901735 |
| NodeBWCent__R_SbPS | Executive | − 0.0002149309 | 0.7591009 | − 0.3073921 |
| NodeBWCent__L_Hip | Emotional Regulation | 3.375e−06 | 0.4010689 | − 0.8428374 |
| NodeBWCent__R_InfTS | Temporal | 0.0001339698 | 0.5679843 | 0.5726727 |
| NodeBWCent__L_Pu | Somatosensory | 0.0001385234 | 0.5944141 | 0.5339394 |
| NodeBWCent__L_HG | Temporal | 0.0001799849 | 0.2125041 | 1.2536713 |
| NodeBWCent__R_IntPS_TrPS | Executive Control | 0.0002065054 | 0.912869 | − 0.1096615 |
| AvPathLength__R_TrFPoG_S | Default Mode Network | 0.0001700514 | 0.6230364 | − 0.4928811 |
| NodeBWCent__R_InfFGTrip | Emotional Regulation | 0.0001712679 | 0.4691462 | 0.7262744 |
| AvPathLength__R_ShoInG | Salience | 0.0002558495 | 0.1916472 | 1.313446 |
| NodeBWCent__L_InfCirIns | Somatosensory | 0.000298333 | 0.3661217 | 0.9073451 |
| NodeBWCent__L_InfFGTrip | Emotional Regulation | 0.0002452258 | 0.2790149 | 1.0876706 |
| NodeBWCent__R_SupFG | Somatosensory | 0.0003080609 | 0.2651615 | 1.1197311 |
| AvPathLength__R_InfFGOpp | Emotional Regulation | 0.0002563451 | 0.6090979 | 0.512767 |
| NodeBWCent__L_SupFS | Somatosensory | 0.0003189446 | 0.1007301 | 1.6546121 |
| AvPathLength__R_OcPo | Occipital | 0.0003393655 | 0.5872989 | − 0.5442853 |
| AvPathLength__R_Cun | Occipital | 0.00039095 | 0.9285999 | − 0.0898031 |
| AvPathLength__R_ACirIns | Salience | 0.0003916695 | 0.0878444 | 1.7215257 |
| AvPathLength__L_SupTS | Temporal | 0.0003220023 | 0.8840551 | 0.1461548 |
| AvPathLength__R_TrTs | Temporal | 0.0003712902 | 0.2822812 | 1.0802726 |
| AvPathLength__L_SupPrCs | Somatosensory | 0.0003569259 | 0.8959603 | 0.1310557 |
| AvPathLength__L_InfPrCS | Somatosensory | 0.000369516 | 0.6345674 | 0.4765773 |
| AvPathLength__R_PosVCgG | Default Mode Network | 0.0003904446 | 0.4358497 | 0.7819521 |
| AvPathLength__L_TrFPoG_S | Default Mode Network | 0.0003353048 | 0.8599587 | − 0.1768227 |
| AvPathLength__L_JS | Parietal | 0.0004036897 | 0.5434692 | 0.6093882 |
| NodeBWCent__L_MTG | Default Mode Network | 0.0004397223 | 0.4000983 | 0.8445812 |
| AvPathLength__L_InfTS | Temporal | 0.000505792 | 0.4668332 | 0.730068 |
| NodeBWCent__L_PRCG | Somatosensory | 0.0004845014 | 0.0058443 | 2.8088183 |
| NodeBWCent__L_FMarG_S | Executive | 0.0005082393 | 0.2996283 | 1.0419329 |
| NodeBWCent__R_SupCirInS | Salience | 0.0005409756 | 0.2098923 | 1.2609129 |
| AvPathLength__L_ACirIns | Salience | 0.0005799921 | 0.253704 | 1.1471418 |
| NodeBWCent__R_SupTGLp | Temporal | 0.0005360867 | 0.0692834 | 1.8337069 |
| NodeBWCent__R_CS | Somatosensory | 0.0005749146 | 0.732848 | 0.3421693 |
| NodeBWCent__L_SupTGLp | Temporal | 0.0005546731 | 0.6895121 | 0.4005262 |
| NodeBWCent__L_PrCun | Default Mode Network | 0.0005835341 | 0.8516433 | 0.1874434 |
| NodeBWCent__L_SupOcG | Occipital | 0.000645764 | 0.1567469 | 1.4254113 |
| AvPathLength__R_InfPrCS | Somatosensory | 0.0006194332 | 0.4971359 | 0.6811658 |
| NodeBWCent__L_Tpo | Temporal | 0.0006079824 | 0.2851643 | 1.0737911 |
| AvPathLength__L_InfOcG_S | Occipital | 0.0006837278 | 0.049996 | 1.9808431 |
| AvPathLength__L_PerCaS | Emotional Regulation | 0.0009624533 | 0.5916009 | 0.538023 |
Figure 4.
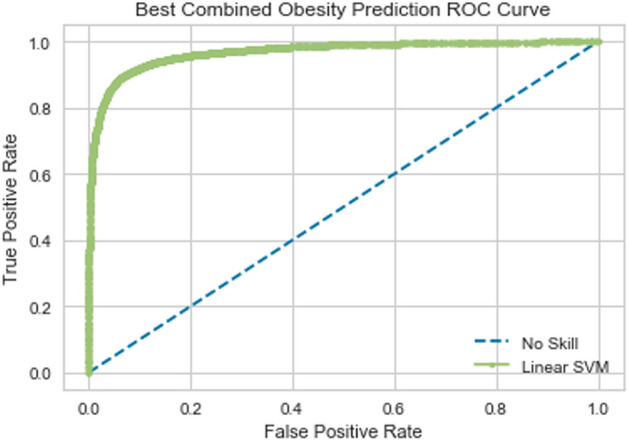
Receiver operating characteristic curve of support-vector machine model using combined brain and metabolite features.
In this model, the features from the brain DTI dataset had significantly greater weights than those from the metabolite dataset. The three features with the largest positive weight, influencing the model towards classification as extremely obese were average path length of the left pericallosal sulcus (AvPathLength__L_PerCaS), average path length of inferior occipital gyrus and sulcus (AvPathLength__L_InfOcG_S), and node betweeness centrality of the Superior occipital gyrus (SupOcG).
The three features with the largest negatives weights were average path length of the right long insular gyrus and central insular sulcus (AvPathLength__RLoInG_CInS), average path length of the left middle-posterior part of the cingulate gyrus and sulcus (AvPathLength__L_MPosCgG_S), and posterior dorsal part of the cingulate gyrus (AvPathLength__PosDCgG) (Fig. 5A).
Figure 5.

Top brain (A) and metabolite (B) features in combined support-vector machine model of obesity. The x-axis represents the brain and metabolite features of interest that contributed the most to the machine learning model—the magnitude of contribution is outlined on the y-axis, with a negative weight associated with the obese phenotype and a positive weight with the overweight phenotype.
The most negative metabolite features in the combined model were pregen-diol sulfate, 1-oleoyl-GPC (18:1), and R-salsolinol. Lastly, the most positive metabolite features in this model were I-urobilinogen, 1-oleoylglycerol (18:1), and genistein (Fig. 5B).
Permutation testing
For all three models, this null hypothesis was rejected. By shuffling the labels, the test accuracy with ten-fold cross validation decreased to worse than random (46 percent). This supports our claim that the models learned meaningful relationships between the features (metabolites and brain DTI) and the label (obesity level).
Discussion
In this study, we demonstrate a machine learning approach that can successfully differentiate overweight from obese individuals using fecal metabolites and neuroimaging data, independently; however, combination of these two data parameters yields a more accurate classifier. Our results reveal a role for metabolites and brain regions of interest that have been previously investigated within the context of obesity, in addition to suggesting a role for previously unexplored metabolites and regions within this context. While not providing information about causality, our findings will be important for future, mechanistic studies, as this represents the first investigation of brain-gut interactions in differentiating obese from overweight individuals.
A substantial number of brain regions in the extended reward network, primarily the emotional regulation and somatosensory networks, emerged as important in differentiating obese from overweight individuals. These brain regions, most notably the inferior frontal gyrus, cingulate gyrus, and straight gyrus (emotional regulation), in addition to the postcentral gyrus, posterior insula, and paracentral lobule (somatosensory) have been previously described in multivariate analysis pattern classifiers that are able to differentiate normal weight from overweight individuals with a high degree of accuracy23. Only one region of the core reward network, the caudate nucleus, emerged as an important, albeit relatively minor, differentiator in our model. Although disruptions in core reward connectivity have been shown to be particularly important in differentiating normal from overweight phenotypes23, our results suggest that these disruptions are likely not the most important factors in differentiating overweight and obese individuals. Unexpectedly, regions outside of the extended reward network, primarily the default mode network, also emerged as important in differentiating obese from overweight individuals. Activity in the default mode network reflects baseline brain function, in addition to spontaneous self-reflection45, attention to internal stimuli45, and accounts for up to 80% of the brain’s energy use46. Research on the default mode network within the context of obesity is limited; though, our findings are consistent with a preclinical mouse model that demonstrates increased default mode network activity in overweight but not lean mice47. Taken together, our results suggest that obesity should not necessarily be interpreted as a more extreme version of the overweight phenotype, but rather as perhaps a different entity with a unique neuroimaging signature that is in many ways distinct from the overweight one.
Several amino acid derivatives (N-methylproline [from proline], imidazole propionate [histidine], agmatine [arginine], N-acetylisoleucine [isoleucine] and N-butyryl-leucine [leucine]) emerged as important in differentiating obese from overweight individuals. Previous work has linked amino acid and branched-chain amino acids in particular to obesity and related insulin resistance in both human and preclinical models, though these studies have been primarily performed using serum rather than fecal samples48–51. It is likely that the microbiome plays an important role in mediating this relationship; one study showed that mice transplanted with the microbiomes of human twin pairs discordant for obesity demonstrated differences in body composition, with the microbial communities in the obese mice showing increased metabolism of branched-chain amino acids52. Furthermore, a subset of the metabolites that emerged as some of the strongest differentiators between obese and overweight individuals in our data set are produced exclusively by gut microbes, including imidazole propionate53. L-urobilinogen, a metabolite produced in the intestine by bacterial reduction of bilirubin was also an important differentiator54. Previous studies have suggested a role for hyperbilirubinemia and obesity with respect to blood levels54.
With activity on serotonergic and glutaminergic neurotransmitters, agmatine is one of the handful of metabolites highlighted in our results that has been extensively studied with respect to its role as a neuromodulator55. Agmatine is also released from endogenous neurons in the peripheral nervous system and astrocytes in the central nervous system as a compensatory, protective mechanism in response to stress and inflammation56. Gut agmatine may interact with vagal afferents and contribute to the unique brain-gut signature of the obese and overweight phenotype. As many of the other significant metabolites have not been studies within the context of brain-gut interactions, we cannot conclude if these compounds communicate with the central nervous system in some way.
Our study focused on structural connectivity of brain regions and fecal metabolites. Future work may benefit from incorporating functional connectivity of brain regions or perhaps pairwise connectivity in characterizing key differences between overweight and obese individuals. Although we discussed the metabolites of interest within the context of the gut microbiome, we did not explicitly examine gut microbiota signatures (16S rRNA gene sequencing data) in this study. Future, more complex, machine learning models may benefit from the addition of different data sets to deepen our systems-based understanding of obesity and how it may be different from the overweight phenotype. We are unable to define the directionality and causality between fecal metabolites and alteration in brain connectivity with respect to obesity from this study; however, previous work has suggested bidirectional models for brain-gut-microbiome communication in obesity57. Machine learning tends to focus on the variability of features in order to explain the various outcomes. As a result, machine learning can eliminate features with low variance. This may not be correct in all situations as sometimes small variations can potentially drive large changes in the systems. To some extent, this bias can be eliminated by ensuring that the models being built and used are validated by subject matter experts. Although many of the fecal metabolites included in this model were not on their own able to differentiate between the overweight and obese phenotypes, the unique metabolome signature was able to significantly differentiate between the two groups, which underscores the impact of a machine learning approach to our systems understanding of obesity, which would otherwise not be captured in more traditional, strictly correlational analyses. Despite their predictive accuracy in classifying the data, machine learning algorithms cannot always entirely explain the true underlying processes, while also arriving at a final predictive model with the best set of features for optimizing accuracy. In this study, we differentiated our two groups by BMI; although BMI, which expresses the relationship between height and weight is the most widely used measure of obesity. Future studies may consider other measures of obesity such as waist–hip ratio or visceral adiposity in order to validate our current study.
To our knowledge, this is the first study to integrate microstructural neuroimaging and fecal metabolite data using a machine learning model to understand key differentiators and potential drivers of obese and overweight individuals. A growing body of evidence suggests that brain-gut interactions are important in driving the transition from being normal weight to overweight. Our results suggest that brain-directed signaling may be more important in obesity pathophysiology compared to overweight pathophysiology, as our machine learning model weighed alterations in brain connectivity as substantially more significant compared to fecal metabolites. This exploratory analysis supports previous preclinical and clinical investigations, while also revealing novel insights, which will be essential in driving discovery into previously unexplored avenues of brain-gut-microbiome interactions in obesity.
Supplementary Information
Author contributions
A.G. contributed to funding, study concept and design, analysis and interpretation of data, critical revision of the manuscript for important intellectual content, study supervision. R.B. contributed to analysis and interpretation of data, drafting of the manuscript, critical revision of the manuscript for important intellectual content. E.A.M. contributed to funding, study concept and design, and critical revision of the manuscript for important intellectual content. R.K. contributed to study concept and design, analysis and interpretation of data, drafting of the manuscript, and critical revision of the manuscript for important intellectual content. T.D. contributed to critical revision of the manuscript for important intellectual content. P.V. and J.S. contributed to technical support and analysis and interpretation of data. D.P. contributed to study concept and design. C.L. contributed to technical support, analysis and interpretation of data, and figure creation. V.O. contributed to study concept and design, drafting of the manuscript, critical revision of the manuscript for important intellectual content, and study supervision. All authors read and approved the final manuscript.
Funding
This research was supported by grants from the National Institutes of Health including K23 DK106528 (AG), ULTR001881/DK041301 (UCLA CURE/CTSI Pilot and Feasibility Study; AG), R01 DK048351 (EAM), and pilot funds were provided for brain scanning by the Ahmanson-Lovelace Brain Mapping Center.
Data availability
The datasets generated and/or analyzed during the current study are not publicly available due to the fact that the data collected are a part of an ongoing study but are available from the corresponding author on reasonable request.
Competing interests
The authors declare no competing interests.
Footnotes
Publisher's note
Springer Nature remains neutral with regard to jurisdictional claims in published maps and institutional affiliations.
Supplementary Information
The online version contains supplementary material available at 10.1038/s41598-023-32713-2.
References
- 1.CDC, C. f. D. C. a. P. Overweight and Obesity. http://www.cdc.gov/obesity/data/adult.html (2014).
- 2.http://www.who.int/mediacentre/factsheets/fs311/en/. Obesity and Overweight. Fact Sheet (2016).
- 3.Reilly JJ, Kelly J. Long-term impact of overweight and obesity in childhood and adolescence on morbidity and premature mortality in adulthood: Systematic review. Int. J. Obes. (Lond.) 2011;35:891–898. doi: 10.1038/ijo.2010.222. [DOI] [PubMed] [Google Scholar]
- 4.Jiang M, et al. Dose-response relationship between body mass index and risks of all-cause mortality and disability among the elderly: A systematic review and meta-analysis. Clin. Nutr. 2019;38:1511–1523. doi: 10.1016/j.clnu.2018.07.021. [DOI] [PubMed] [Google Scholar]
- 5.Yu J, et al. The dose-response analysis between BMI and common chronic diseases in northeast China. Sci. Rep. 2018;8:4228. doi: 10.1038/s41598-018-22551-y. [DOI] [PMC free article] [PubMed] [Google Scholar]
- 6.Schwartz MW, et al. Obesity pathogenesis: An endocrine society scientific statement. Endocr. Rev. 2017;38:267–296. doi: 10.1210/er.2017-00111. [DOI] [PMC free article] [PubMed] [Google Scholar]
- 7.Gupta A, Osadchiy V, Mayer EA. Brain-gut-microbiome interactions in obesity and food addiction. Nat. Rev. Gastroenterol. Hepatol. 2020 doi: 10.1038/s41575-020-0341-5. [DOI] [PMC free article] [PubMed] [Google Scholar]
- 8.Nakazato M, et al. A role for ghrelin in the central regulation of feeding. Nature. 2001;409:194–198. doi: 10.1038/35051587. [DOI] [PubMed] [Google Scholar]
- 9.Wren AM, et al. Ghrelin causes hyperphagia and obesity in rats. Diabetes. 2001;50:2540–2547. doi: 10.2337/diabetes.50.11.2540. [DOI] [PubMed] [Google Scholar]
- 10.Shah M, Vella A. Effects of GLP-1 on appetite and weight. Rev. Endocr. Metab. Disord. 2014;15:181–187. doi: 10.1007/s11154-014-9289-5. [DOI] [PMC free article] [PubMed] [Google Scholar]
- 11.Karra E, Chandarana K, Batterham RL. The role of peptide YY in appetite regulation and obesity. J. Physiol. 2009;587:19–25. doi: 10.1113/jphysiol.2008.164269. [DOI] [PMC free article] [PubMed] [Google Scholar]
- 12.Yano JM, et al. Indigenous bacteria from the gut microbiota regulate host serotonin biosynthesis. Cell. 2015;161:264–276. doi: 10.1016/j.cell.2015.02.047. [DOI] [PMC free article] [PubMed] [Google Scholar]
- 13.Kullmann S, et al. The obese brain: Association of body mass index and insulin sensitivity with resting state network functional connectivity. Hum. Brain Mapp. 2012;33:1052–1061. doi: 10.1002/hbm.21268. [DOI] [PMC free article] [PubMed] [Google Scholar]
- 14.Raji CA, et al. Brain structure and obesity. Hum. Brain Mapp. 2010;31:353–364. doi: 10.1002/hbm.20870. [DOI] [PMC free article] [PubMed] [Google Scholar]
- 15.Connolly L, et al. Differences in brain responses between lean and obese women to a sweetened drink. Neurogastroenterol. Motil. 2013;25:579–e460. doi: 10.1111/nmo.12125. [DOI] [PMC free article] [PubMed] [Google Scholar]
- 16.Garcia-Garcia I, et al. Alterations of the salience network in obesity: A resting-state fMRI study. Hum. Brain Mapp. 2013;34:2786–2797. doi: 10.1002/hbm.22104. [DOI] [PMC free article] [PubMed] [Google Scholar]
- 17.Kilpatrick LA, et al. Influence of sucrose ingestion on brainstem and hypothalamic intrinsic oscillations in lean and obese women. Gastroenterology. 2014;146:1212–1221. doi: 10.1053/j.gastro.2014.01.023. [DOI] [PMC free article] [PubMed] [Google Scholar]
- 18.Crossley NA, et al. The hubs of the human connectome are generally implicated in the anatomy of brain disorders. Brain. 2014;137:2382–2395. doi: 10.1093/brain/awu132. [DOI] [PMC free article] [PubMed] [Google Scholar]
- 19.Sporns O. From simple graphs to the connectome: Networks in neuroimaging. Neuroimage. 2012;62:881–886. doi: 10.1016/j.neuroimage.2011.08.085. [DOI] [PubMed] [Google Scholar]
- 20.Bullmore E, Sporns O. Complex brain networks: Graph theoretical analysis of structural and functional systems. Nat. Rev. Neurosci. 2009;10:186–198. doi: 10.1038/nrn2575. [DOI] [PubMed] [Google Scholar]
- 21.Irimia A, Chambers MC, Torgerson CM, Van Horn JD. Circular representation of human cortical networks for subject and population-level connectomic visualization. Neuroimage. 2012;60:1340–1351. doi: 10.1016/j.neuroimage.2012.01.107. [DOI] [PMC free article] [PubMed] [Google Scholar]
- 22.Rubinov M, Sporns O. Complex network measures of brain connectivity: Uses and interpretations. Neuroimage. 2010;52:1059–1069. doi: 10.1016/j.neuroimage.2009.10.003. [DOI] [PubMed] [Google Scholar]
- 23.Gupta A, et al. Patterns of brain structural connectivity differentiate normal weight from overweight subjects. Neuroimage Clin. 2015;7:506–517. doi: 10.1016/j.nicl.2015.01.005. [DOI] [PMC free article] [PubMed] [Google Scholar]
- 24.Osadchiy V, et al. History of early life adversity is associated with increased food addiction and sex-specific alterations in reward network connectivity in obesity. Obes. Sci. Pract. 2019;5:416–436. doi: 10.1002/osp4.362. [DOI] [PMC free article] [PubMed] [Google Scholar]
- 25.Osadchiy V, Martin CR, Mayer EA. The gut-brain axis and the microbiome: Mechanisms and clinical implications. Clin. Gastroenterol. Hepatol. 2019;17:322–332. doi: 10.1016/j.cgh.2018.10.002. [DOI] [PMC free article] [PubMed] [Google Scholar]
- 26.Osadchiy V, et al. Correlation of tryptophan metabolites with connectivity of extended central reward network in healthy subjects. PLoS ONE. 2018;13:e0201772. doi: 10.1371/journal.pone.0201772. [DOI] [PMC free article] [PubMed] [Google Scholar]
- 27.Zhang Y, et al. Obesity: Pathophysiology and intervention. Nutrients. 2014;6:5153–5183. doi: 10.3390/nu6115153. [DOI] [PMC free article] [PubMed] [Google Scholar]
- 28.Heymsfield SB, Wadden TA. Mechanisms, pathophysiology, and management of obesity. N. Engl. J. Med. 2017;376:254–266. doi: 10.1056/NEJMra1514009. [DOI] [PubMed] [Google Scholar]
- 29.Fischl B, et al. Whole brain segmentation: Automated labeling of neuroanatomical structures in the human brain. Neuron. 2002;33:341–355. doi: 10.1016/S0896-6273(02)00569-X. [DOI] [PubMed] [Google Scholar]
- 30.Dale AM, Fischl B, Sereno MI. Cortical surface-based analysis—I. Segmentation and surface reconstruction. Neuroimage. 1999;9:179–194. doi: 10.1006/Nimg.1998.0395. [DOI] [PubMed] [Google Scholar]
- 31.Destrieux C, Fischl B, Dale A, Halgren E. Automatic parcellation of human cortical gyri and sulci using standard anatomical nomenclature. Neuroimage. 2010;53:1–15. doi: 10.1016/J.Neuroimage.2010.06.010. [DOI] [PMC free article] [PubMed] [Google Scholar]
- 32.Irimia A, Van Horn JD. The structural, connectomic and network covariance of the human brain. Neuroimage. 2012;66C:489–499. doi: 10.1016/j.neuroimage.2012.10.066. [DOI] [PMC free article] [PubMed] [Google Scholar]
- 33.Chiang MC, et al. BDNF gene effects on brain circuitry replicated in 455 twins. Neuroimage. 2011;55:448–454. doi: 10.1016/j.neuroimage.2010.12.053. [DOI] [PMC free article] [PubMed] [Google Scholar]
- 34.Mori Y, et al. Three-dimensional reconstruction of the color Doppler-imaged vena contracta for quantifying aortic regurgitation: Studies in a chronic animal model. Circulation. 1999;99:1611–1617. doi: 10.1161/01.CIR.99.12.1611. [DOI] [PubMed] [Google Scholar]
- 35.Sporns O. Structure and function of complex brain networks. Dialog. Clin. Neurosci. 2013;15:247–262. doi: 10.31887/DCNS.2013.15.3/osporns. [DOI] [PMC free article] [PubMed] [Google Scholar]
- 36.Opsahl T, Colizza V, Panzarasa P, Ramasco JJ. Prominence and control: The weighted rich-club effect. Phys. Rev. Lett. 2008;101:168702. doi: 10.1103/PhysRevLett.101.168702. [DOI] [PubMed] [Google Scholar]
- 37.Opsahl T, Agneessens F, Skortez J. Node centrality in weighted networks: Generalizing degree and shortest paths. Soc. Netw. 2010;32:245–251. doi: 10.1016/j.socnet.2010.03.006. [DOI] [Google Scholar]
- 38.Gupta A, et al. Complex functional brain network properties in anorexia nervosa. J. Eat Disord. 2022;10:13. doi: 10.1186/s40337-022-00534-9. [DOI] [PMC free article] [PubMed] [Google Scholar]
- 39.Gupta A, et al. Sex differences in the influence of body mass index on anatomical architecture of brain networks. Int. J. Obes. (Lond.) 2017;41:1185–1195. doi: 10.1038/ijo.2017.86. [DOI] [PMC free article] [PubMed] [Google Scholar]
- 40.Dong TS, et al. A distinct brain-gut-microbiome profile exists for females with obesity and food addiction. Obes. (Silver Spring) 2020;28:1477–1486. doi: 10.1002/oby.22870. [DOI] [PMC free article] [PubMed] [Google Scholar]
- 41.Qui X, Fu D, Fu Z. An efficient dimensionality reduction approach for small-sample size and high-dimensional data modeling. J. Comput. 2014;9:576–580. [Google Scholar]
- 42.Wong T. Performance evaluation of classification algorithms by k-fold and leave-one-out cross validation. Pattern Recogn. 2016;48:2839–2846. doi: 10.1016/j.patcog.2015.03.009. [DOI] [Google Scholar]
- 43.Chen Q, Meng Z, Liu X, Jin Q, Su R. Decision variants for the automatic determination of optimal feature subset in RF-RFE. Genes Basel. 2018;9:253. doi: 10.3390/genes9060301. [DOI] [PMC free article] [PubMed] [Google Scholar]
- 44.Golland P, Fischl B. Permutation tests for classification: Towards statistical significance in image-based studies. Inf. Process Med. Imaging. 2003;18:330–341. doi: 10.1007/978-3-540-45087-0_28. [DOI] [PubMed] [Google Scholar]
- 45.Buckner RL, Andrews-Hanna JR, Schacter DL. The brain's default network: Anatomy, function, and relevance to disease. Ann. N. Y. Acad. Sci. 2008;1124:1–38. doi: 10.1196/annals.1440.011. [DOI] [PubMed] [Google Scholar]
- 46.Raichle ME. A paradigm shift in functional brain imaging. J. Neurosci. 2009;29:12729–12734. doi: 10.1523/JNEUROSCI.4366-09.2009. [DOI] [PMC free article] [PubMed] [Google Scholar]
- 47.Tregellas JR, et al. Altered default network activity in obesity. Obes. (Silver Spring) 2011;19:2316–2321. doi: 10.1038/oby.2011.119. [DOI] [PMC free article] [PubMed] [Google Scholar]
- 48.Siddik MAB, Shin AC. Recent progress on branched-chain amino acids in obesity, diabetes, and beyond. Endocrinol. Metab. (Seoul) 2019;34:234–246. doi: 10.3803/EnM.2019.34.3.234. [DOI] [PMC free article] [PubMed] [Google Scholar]
- 49.Newgard CB, et al. A branched-chain amino acid-related metabolic signature that differentiates obese and lean humans and contributes to insulin resistance. Cell Metab. 2009;9:311–326. doi: 10.1016/j.cmet.2009.02.002. [DOI] [PMC free article] [PubMed] [Google Scholar]
- 50.Breum L, Rasmussen MH, Hilsted J, Fernstrom JD. Twenty-four-hour plasma tryptophan concentrations and ratios are below normal in obese subjects and are not normalized by substantial weight reduction. Am. J. Clin. Nutr. 2003;77:1112–1118. doi: 10.1093/ajcn/77.5.1112. [DOI] [PubMed] [Google Scholar]
- 51.Layman DK, Walker DA. Potential importance of leucine in treatment of obesity and the metabolic syndrome. J. Nutr. 2006;136:319S–323S. doi: 10.1093/jn/136.1.319S. [DOI] [PubMed] [Google Scholar]
- 52.Ridaura VK, et al. Gut microbiota from twins discordant for obesity modulate metabolism in mice. Science. 2013;341:1241214. doi: 10.1126/science.1241214. [DOI] [PMC free article] [PubMed] [Google Scholar]
- 53.Koh A, et al. Microbially produced imidazole propionate impairs insulin signaling through mTORC1. Cell. 2018;175:947–961. doi: 10.1016/j.cell.2018.09.055. [DOI] [PubMed] [Google Scholar]
- 54.Hamoud AR, Weaver L, Stec DE, Hinds TD., Jr Bilirubin in the liver-gut signaling axis. Trends Endocrinol. Metab. 2018;29:140–150. doi: 10.1016/j.tem.2018.01.002. [DOI] [PMC free article] [PubMed] [Google Scholar]
- 55.Piletz JE, et al. Agmatine: Clinical applications after 100 years in translation. Drug Discov. Today. 2013;18:880–893. doi: 10.1016/j.drudis.2013.05.017. [DOI] [PubMed] [Google Scholar]
- 56.Halaris A, Plietz J. Agmatine : Metabolic pathway and spectrum of activity in brain. CNS Drugs. 2007;21:885–900. doi: 10.2165/00023210-200721110-00002. [DOI] [PubMed] [Google Scholar]
- 57.Bliss ES, Whiteside E. The gut-brain axis, the human gut microbiota and their integration in the development of obesity. Front. Physiol. 2018;9:900. doi: 10.3389/fphys.2018.00900. [DOI] [PMC free article] [PubMed] [Google Scholar]
Associated Data
This section collects any data citations, data availability statements, or supplementary materials included in this article.
Supplementary Materials
Data Availability Statement
The datasets generated and/or analyzed during the current study are not publicly available due to the fact that the data collected are a part of an ongoing study but are available from the corresponding author on reasonable request.