

Abstract
Small-cell lung cancer is an aggressive neuroendocrine lung cancer. Oncogenic MYC amplifications drive SCLC heterogeneity, but the genetic mechanisms of MYC amplification and phenotypic plasticity, characterized by neuroendocrine and non-neuroendocrine cell states is not known. Here, we integrate whole-genome sequencing, long-range optical mapping, single-cell DNA sequencing, and fluorescence in situ hybridization to find extrachromosomal DNA (ecDNA) as a primary source of MYC amplifications and driver fusions in SCLC. ecDNAs bring to proximity enhancer elements and oncogenes, creating SCLC transcription-amplifying units, driving exceptionally high MYC gene dosage. We demonstrate that cell-free nucleosome profiling can non-invasively detect ecDNA amplifications in plasma, facilitating its genome-wide interrogation in SCLC and other cancers. Altogether, our work provides the first comprehensive map of SCLC ecDNA and describe a new mechanism that governs MYC-driven SCLC heterogeneity. ecDNA-enabled transcriptional flexibility may explain the significantly worse survival outcomes of SCLC tumors harboring complex ecDNA amplifications.
Keywords: small cell lung cancer, extrachromosomal DNA, fusions, tumor heterogeneity, single-cell CNV, enhancers, HiChIP, circulating free DNA, tumor evolution, liquid biopsy
INTRODUCTION
Cancer cells from the same tumor often exhibit substantial heterogeneity in morphology, genetics, epigenetics and gene expression. The categories, origins, and organization of tumor heterogeneity are open questions of fundamental importance to cancer biology. Moreover, a better understanding of the driving forces of tumor heterogeneity might facilitate the development of more effective approaches to combat heterogeneity and its consequences.
Small-cell lung cancer (SCLC) is a model disease to study tumor heterogeneity and its clinical implications including treatment resistance and metastases. It is a high-grade neuroendocrine lung carcinoma notable for exquisite chemosensitivity at diagnosis and a dramatic shift towards chemoresistance at relapse(1). SCLC consist of tumor cells with neuroendocrine (NE) and non-neuroendocrine (non-NE) features(2–7), further defined by differential expression of the three lineage-defining transcription factors ASCL1, NEUROD1, and POU2F3. A fourth subgroup has been variously characterized by YAP1 expression(2, 8–10) or low expression of all three transcription factors accompanied by an inflamed gene signature(11). SCLC heterogeneity increases over the course of treatment, with expansion of the non-NE cell population associated with chemo-resistance(11–13). In genetically engineered mouse models (GEMMs), SCLC can arise from different cell types of origin, profoundly influencing their gene expression, chromatin accessibility and metastatic characteristics(14–17). Induction of Notch signaling, generally suppressed in NE SCLC, can induce a transition from NE to non-NE cell state(7, 18, 19). Recent studies demonstrate that MYC can activate Notch signaling to promote the temporal evolution of SCLC sequentially from an ASCL1 to a NEUROD1 to a non-NE state from a NE cell of origin(19–21). However, the genetic mechanisms that govern MYC-driven SCLC heterogeneity and transcriptional remodeling are poorly understood.
Extrachromosomal DNA (ecDNA) are extrachromosomal chromatin elements that frequently contain oncogenes(22–24). In contrast to chromosomal DNA, ecDNAs lack centromeres that dictate the organization of the mitotic spindle(22, 25), and as such they are randomly distributed across the daughter cells during mitosis leading to rapid increase of genomic heterogeneity(26). The high DNA template level generated by ecDNA amplification, coupled with its highly accessible chromatin, permits massive oncogene transcription(27). ecDNA-based oncogene amplifications have been described across multiple cancers(22, 28, 29). SCLC was one of the first tumor types wherein ecDNA and chromothripsis, the catastrophic shattering of chromosomes and a major driver of ecDNA amplification, were described(30–32). However, SCLC ecDNAs have not been characterized further and a recent pan-cancer analyses of ecDNA amplifications did not include SCLC(29). As such, the oncogenes transcribed by these structures and their role in SCLC plasticity are not known.
Although the majority of patients with SCLC present with and succumb to metastatic disease, the current understanding of SCLC heterogeneity is largely derived from mouse models(15, 33). Decoding the mechanistic underpinnings of the high degree of phenotypic heterogeneity, plasticity and rapid adaptability in human tumors is crucial(33), and may inform efforts to combat heterogeneity and its consequences. We hypothesized that ecDNAs may underlie SCLC heterogeneity and sought to systematically investigate the spectrum and impact of ecDNA in human SCLC. We also hypothesized that ecDNA may be detectable non-invasively from circulating free DNA (cfDNA), serving as highly informative biomarkers.
RESULTS
ecDNAs are a major source of SCLC gene amplifications and inter-tumor heterogeneity
To catalog oncogene amplifications in SCLC, we analyzed SCLC cell line(34–36) and primary tumor(1) whole-genome sequences (WGS) for high level gene amplifications. MYC family genes, MYCL, MYCN and MYC were the most commonly amplified genes in SCLC. High-level focal genomic amplifications (copy number >5) of the MYC paralogues were observed in 23 (47.9%) cell lines and 14 (14.74%) tumor samples, with more than 50 copies noted in some cases (Fig. 1A, summarized in Table S1), and involved MYCL and MYC more often than MYCN (Fig. 1B). Focal amplifications with high copy numbers also involved other oncogenes including FGFR1 and KRAS (Fig. S1A summarizes the COSMIC database tier 1 genes), but their numbers were limited. Focal amplifications covered tiny portions of the genome, usually between 50,000 to 1 million base pairs (Mb) in contrast to chromosome-level amplifications which covered multiple Mb (Fig. S1B). Focal amplifications were of monoallelic origin, with enrichment of one germline allele and not the other (Fig. S1C). Consistent with their known role as key drivers of SCLC transcriptional subtypes(19, 37), focal MYCL amplification was predominantly observed in ASCL1 and NEUROD1-high SCLCs (SCLC-A and SCLC-N, respectively) while MYC was commonly amplified in NEUROD1-high SCLC-N subtype (Fig. 1C, Table S1). Maximal MYC expression levels were observed particularly in SCLC-N cells with MYC focal amplifications (Fig. 1D). Of non-NE SCLCs, the YAP1 cells had lower MYC expression than NEUROD1 cells and harbored no focal amplifications. POU2F3 cells included two MYC, and one MYCL highly amplified cell lines, paired with elevated MYC expression in most cell lines. Across all SCLC subtypes, MYC copy gains were highly correlated with MYC mRNA expression (Fig. S1D).
Figure 1. Gene amplification landscape and transcriptional subtypes of SCLC.
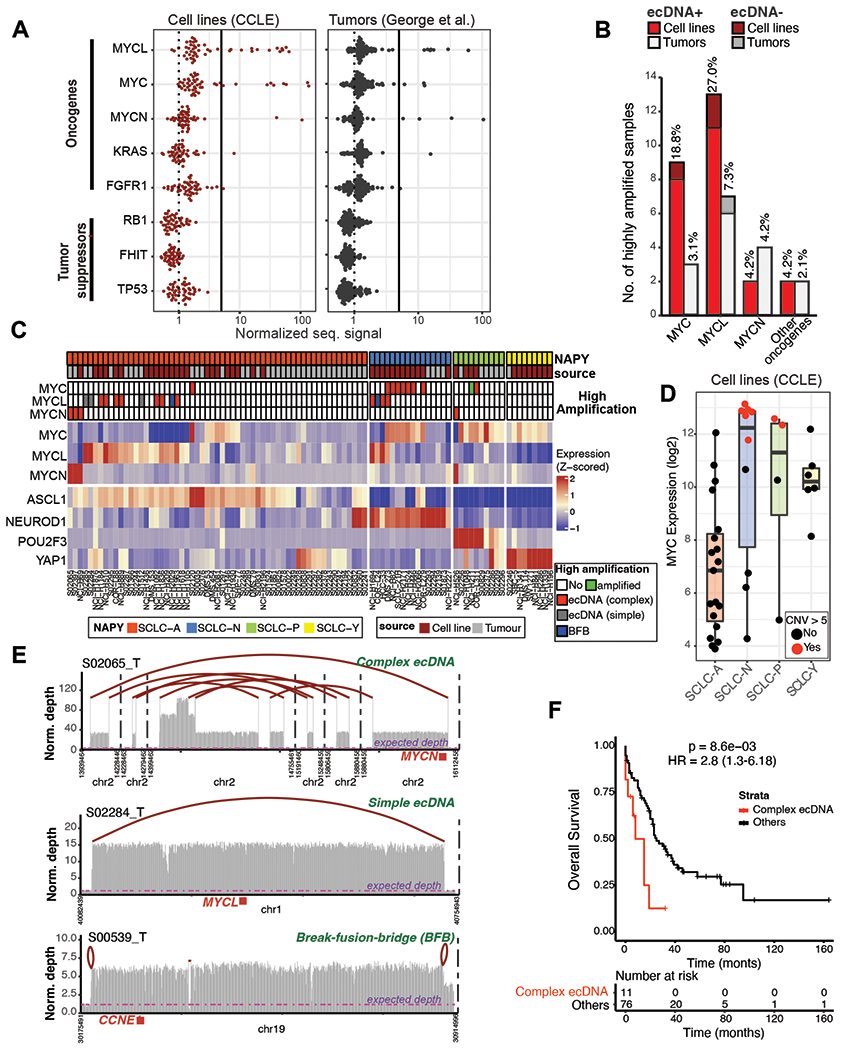
A) Normalized sequencing depth quantified from whole-genome sequencing of highly amplified oncogenes and tumor suppressor genes in SCLC cell lines (left panel) and tumors (right panel). B) Number of samples with high amplification (>5 normalized signal) of MYC and other oncogenes in cell lines (red) and tumors (grey). Fraction of samples in each cohort is shown on top of the bars. ecDNA positive cases are shaded with light red and light grey for cell lines and tumor samples, respectively. C) Expression heatmap of MYC genes and lineage-specific transcription factors differentiating SCLC subtypes. Top bars denote subtypes and sample source (tumor or cell line). Second panel shows samples with high MYC/MYCL/MYCN amplification and classification based on AmpliconArchitect defined as complex ecDNA (red), simple ecDNA (grey), break-fusion-bridge (BFB, blue), highly amplified (green) and no high amplification (white) categories. Lower panel shows the expression patterns of SCLC subtype differentiating genes. D) Expression of MYC in the 4 main SCLC subtypes with focal MYC amplification (red dots) or no focal amplification (black dots). E) Distinct rearrangement patterns at oncogenes in SCLC tumors. Top panel demonstrates a complex ecDNA, with multiple focal amplifications connected at break sites marked with red arches. Expected diploid levels of sequencing depths are marked by purple lines. The MYCN oncogene position is marked with a red box. Middle panel demonstrates a simple ecDNA pattern, where the two break sites of a single focal amplification are assembled. Lower panel demonstrates a genome integrated break-fusion-bridge, where distinct break sites are not connected together, but loop back based on sequencing data. F) Kaplan-Meier plot showing survival differences between patients with or without complex rearrangements in SCLC.
Oncogene amplification can present as ecDNA or intrachromosomal DNA elements. We applied AmpliconArchitect, an algorithm that computationally detects ecDNA, on primary SCLC WGS followed by manual curation of results (MYC paralogues seen in Fig 1C, summary in Table S1, Fig. 1 extended supplement)(1, 38). The algorithm identifies rearrangement patterns at focal amplifications, followed by assembly into continuous sequences based on orientation and alignment localization of read pairs. The assembled sequences are then classified as ecDNA or re-integrated events such as break-fusion-bridges (BFB) based on the absence or presence of “self-looping” break sites (Fig. 1E). Remarkably, most high focal amplifications in SCLC genomes coincided with regions assembled as ecDNA (Fig. 1E). We found that 18 of 96 (18.8%) tumors carried one or more ecDNA amplicons. In most cases, ecDNAs were assembled from multiple genomic segments that were amplified at distinct levels and interrupted by nonamplified or deleted regions, a profile reminiscent of complex or ‘seismic’ amplification(39). An example can be seen in Fig. 1E top, where the MYCN oncogene is highlighted in red, and the assembly of break sites are summarized with red arches. In five cases (5.2%), circular DNA was assembled from a single continuous locus, such as Fig. 1E middle, which harbors the MYCL oncogene with one single assembly arch connecting the two edges of amplification. Linear amplicons with a stepwise genomic amplification pattern were observed in eleven tumors (11.5%, Fig. 1E bottom), characteristic of BFB cycles, where paired-end reads did not support any connections between the break sites, but rather arched back to themselves. Importantly, SCLC patients whose tumors contained complex ecDNAs, regardless of the specific oncogene amplified, had significantly worse overall survival, compared to patients whose tumors harbored simple-ecDNA, non-ecDNA amplifications, or no amplifications (HR=2.8, p=8.6E-03; Fig. 1F, Fig. S1E). We fitted a Cox proportional-hazards model that tested survival after controlling for clinical variables including age, sex, and stage, and found that patients with tumors carrying complex circular amplicons had significantly higher hazard ratios for death (HR=2.7, p = 0.021, Table S1). Together, we find that most highly amplified MYC paralog genes are encoded on ecDNA (Fig 1B) and that tumors harboring complex ecDNA amplifications have significantly worse outcomes.
Assembly of SCLC ecDNA structures and epigenetic characterization
Next, we examined SCLC cell lines for ecDNA-based oncogene amplifications using the same approach described above for patient tumors(34–36). Complex circular amplicons were more frequent in cell lines than tumors, possibly reflecting the selective advantage afforded by ecDNA amplifications (Table S1). Of 32 cell lines with high focal amplifications, 28 were positive for ecDNA, three had BFB events, and one had a non-focal amplification (NCI-H211) based on the AmpliconArchitect analysis(38) (Table S1, Fig. 2 extended supplement). Circular head-to-tail junctions were predicted computationally in NCI-H889, encoding the MYCL oncogene and in NCI-H524, encoding the MYC oncogene. We used PCR and Sanger sequencing to confirm the junctional reads in NCI-H889 and NCI-H524 (blue arch in Fig. 2A, Fig. S2A).
Figure 2. ecDNAs in SCLC and their epigenetic regulation.

A) Assembly of ecDNA from whole-genome sequencing of SCLC cell lines NCI-H889 and NCI-H524. Sequencing coverage is shown with grey bars, assembled segments are connected with red arches. The validated assembly (arch) is highlighted in blue for the two cell lines. B) Assembly of ecDNA structure using long read optical mapping. Blue segments represent the reads, the orange segments represent the genome used for mapping, and the light-blue and dark blue segments represent the assembled ecDNA sequence for NCI-H889 and NCI-H524, respectively. C) FISH validation of ecDNA using MYCL probes (green) in NCI-H889 and MYC probes (light blue) in NCI-H524. DMS-114 showed chromosomal amplification of MYC (light blue). D-E) Enhancer interaction landscape in NCI-H889 (D) and NCI-H524 (E). The upper track shows the normalized interaction heatmap derived from Hi-ChIP, with oncogenic enhancer interactions highlighted in blue circles (proximal) and green oval (distal). Sequencing coverage tracks are shown for H3K27ac HiChIP (purple), H3K27ac ChIP-seq (blue), ATAC-seq (yellow, only for NCI-H524) and genome sequencing (dark grey). F) Comparison of interaction strengths of enhancers within the ecDNA, at housekeeping genes (GAPDH, B2M, TOP2A, ACTB and PGK1), and SCLC genes (ASCL1, NEUROD1, INSM1, SYP, NOTCH1, REST and YAP1) and their proximal enhancers.
Since there were multiple break sites, ecDNA structures were confirmed using optical mapping, which enabled the development of a physical map based on long contiguous pieces of DNA(40) (Fig. 2B). For example, MYCL and RLF genes are ~250kb apart in the genome but positioned in close proximity on ecDNA based on WGS assembly and optical mapping contigs in NCI-H889. Optical maps also reconstructed complex break sites within PVT1, a known regulator of MYC expression in NCI-H524. The PVT1 promoter was positioned close to MYC on ecDNA, while a PVT1 intronic segment was more distally positioned on ecDNA (Fig. S2B)(41). Next, we examined localization of MYC, MYCL, and MYCN in metaphase nuclei using fluorescence in situ hybridization (FISH) probes that target these oncogenes in multiple cell lines. Both NCI-H889 and NCI-H524 (Fig. 2C) demonstrated several copies of MYCL and MYC located outside the chromosome in each cell examined (median count of 27 and 45 ecDNA/cell in NCI-H524 and NCI-H889, respectively). As a negative control we probed DMS-114 for MYC, which showed chromosomal amplification (Fig. 2C). In addition, we probed ecDNA in additional cell lines MYC (DMS-273, NCI-H446), MYCN (NCI-H69) or MYCL (NCI-H1963, NCI-H1092) to confirm ecDNA predicted by WGS (Fig. S2C). We identified extrachromosomal signals in all cases, except NCI-H446 (Fig. S2C), which showed homogeneous staining regions (HSR), likely representing chromosomal reintegration of ecDNA(42).
EcDNA amplification is associated with increased oncogene expression (Fig. 1C, Table S1). To understand the epigenetic regulation of SCLC ecDNA, we characterized the enhancer landscape of several cell lines using Hi-ChIP, which examines chromosome conformation, targeting the enhancer-associated mark histone H3 lysine 27 acetylation. The genomic signal of H3K27ac derived from Hi-ChIP closely mirrored previously published ChIP-seq signals, which served as a validation(43, 44). In case of the MYCL ecDNA-positive NCI-H889, enhancer signal of the MYCL promoter was strong, but substantially weaker than the enhancer loci at TRIT1 or RLF, localized respectively downstream and upstream of MYCL (Fig. 2D, blue circle), suggesting that the enhancers of these neighboring genes may be key regulators. In case of the MYC ecDNA-positive NCI-H524, we observed strong enhancer-enhancer interactions between MYC and the neighboring PVT1 genes (Fig. 2E, blue circle), with high chromatin accessibility defined from assay for transposase-accessible chromatin with sequencing (ATAC-Seq)(21, 45). We also observed ecDNA-based interactions between enhancers that would be multiple megabases apart in the genome (Fig. 2E, green oval). Enhancers on ecDNA had exceptionally strong interaction signals in comparison with enhancer-enhancer pairs at housekeeping genes or key SCLC genes and their neighboring enhancers (Fig. 2F left). However, after normalizing for DNA copy number, these enhancer-enhancer interaction signals on the ecDNA were more comparable to non-ecDNA enhancers at housekeeping genes and SCLC genes (Fig. 2F right, TableS2). These data illustrate how SCLC ecDNAs function as transcription-amplifying elements(46), enabling enhancers that would otherwise be distant in the genome to be positioned in close proximity to oncogenes, which coupled with the multi-copy nature of ecDNA, drives massive oncogene transcription.
Next, we examined DNA methylation, another key regulator of gene expression which is also associated with chromatin organization, in ecDNA and non-ecDNA regions. Since DNA methylation assays can predict copy-number(47), we first tested whether ecDNA was detectable from methylation data. Indeed, ecDNA focal amplification patterns were detectable from genome-wide methylation platforms including 850k methylation array and reduced-representation bisulfite sequencing (Fig. S2D), suggesting that ecDNAs and HSRs are subject to methylation. Next, we focused on a shared region of ecDNA among three MYCL ecDNA-positive cell lines, comparing their distribution of methylation probes to three ecDNA negative cell lines(41) (Fig. S2E). The ecDNA-positive cell lines had similar distribution of methylation probes as the ecDNA-negative cell lines, although methylation levels were slightly lower (Fig. S2F). Pairwise comparison of the common methylation probes displayed high correlation between all cell lines, suggesting that much like chromosomal DNA, ecDNA may also be regulated by methylation (Fig. S2G). Similar analysis for MYC and MYCN ecDNA are summarized in Fig. S2H–I, and data summarized in Table S3.
Together, these analyses integrate WGS, long-range optical mapping, and DNA FISH to resolve SCLC ecDNA structures. Beyond serving as vehicles for oncogene amplifications, ecDNA enables juxtaposition of enhancers proximal to SCLC oncogenes regulating their expression, with distinct transcriptional consequences based on genes involved.
ecDNA are a major source of SCLC oncogenic fusions
In addition to driving high levels of oncogene transcription, ecDNAs contain significantly more gene fusions compared to noncircular amplicons(29). Seeking evidence of genomic fusions at SCLC ecDNA loci, we first examined the gene fusion landscape of SCLC cell lines. We identified five recurrent fusions (Fig. S3A) involving 12 genes (Fig. S3B) where the number of junction-supporting reads was above 100x (Table S4). Among them was RLF-MYCL (n=4 cell lines), the most frequent oncogenic fusion event in SCLC primary tumors(48, 49). To further characterize the RLF-MYCL fusion, we compared the expression of the first two exons of RLF gene, previously described as boundaries of the fusion. Five cell lines had high RLF exon 1 expression paired with elevated expression ratio of exon 1 to exon 2 (Fig. 3A, Table S4), of which four had detectable rearrangements between RLF and MYCL in the transcriptome (Fig. 3B). In the fifth cell line (HCC33), RLF was part of the ecDNA without fusions to MYCL. For further analysis, we focused on three RLF-MYCL fusion-positive cell lines with available WGS data (NCI-H889, NCI-H1092, and NCI-H1963). All three cell lines had several MYCL positive ecDNAs (median of 21, 28 and 45 ecDNAs/cell in NCI-H1092, NCI-H1963 and NCI-H889, respectively) based on MYCL metaphase spread FISH (Fig. 2C, Fig. S2C).
Figure 3. Hijacking the promoter of RLF through the RLF-MYCL fusion.
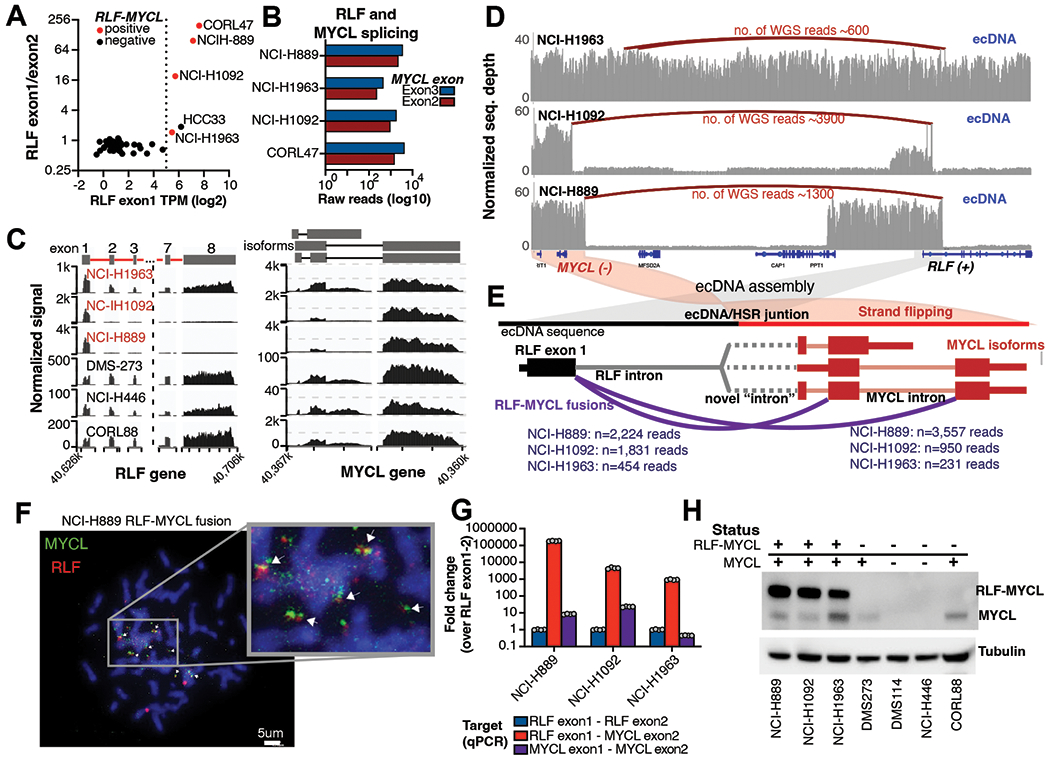
A) Gene expression analysis of RLF exon 1 and RLF exon1/exon2 ratios identifies 5 cells with elevated RLF exon 1 expression. Cell lines marked in red are positive for RLF-MYCL fusion. B) Summary of read counts that splice from RLF exon 1 to either MYCL exon 2 (red) or MYCL exon 3 (blue) based on RNA-seq data. C) Differential RLF and MYCL exon expression in three fusion-positive (red cell lines) and three fusion-negative cell lines. D) Rearrangement patterns at the RLF-MYCL locus in three fusion-positive cell lines. NCI-H1963 has rearrangements within the ecDNA sequence. NCI-H1092 and NCI-H889 both have amplifications at the RLF exon 1 that rearranges upstream of MYCL. E) RLF-MYCL fusion representation based on rearrangements on ecDNA. Number of supporting reads are shown in purple. F) Validation of the RLF-MYCL fusion using FISH. The RLF probe is colored in red, the MYCL probe in green. G) Validation of the RLF-MYCL fusion RNA using qPCR. H) The RLF-MYCL is translated to protein identified using western blot. Cell lines expressing RLF-MYCL (based on qPCR) and MYCL (based on RNA-seq) are marked with “+” on top of the graph, negative cells are marked as “-”.
Transcriptome sequencing tracings of the RLF exons further demonstrated the magnitude of differential expression of the first two exons in the ecDNA positive cells (Fig. 3C, Fig. S3C), ranging from 1.5-fold (NCI-H1963) to nearly 20- and 100-fold (NCI-1092 and NCI-H889). The three cell lines had diverse ecDNA reconstructions based on WGS data. In case of NCI-H1963, the entire RLF gene was on the ecDNA, with multiple rearrangements within the ecDNA between the RLF first intron and upstream of the MYCL promoter (Fig. 3D, Fig.S3D). NCI-H889 and NCI-H1092 had small focal amplifications at the promoter of RLF, where the break point site within the first intron of RLF was assembled to a focal amplification break site slightly upstream of MYCL (Fig. 3D). Even though the RLF and MYCL genes are ~259 kb apart and on different strands of the genome, on the ecDNAs, the RLF promoter and first exon strand “switched” orientation and fused a few kilobases upstream of the MYCL promoter (Fig. 3E), enabling RNA to splice between the two genes bringing exon 1 of RLF in frame with MYCL1 exons 2 or 3.
The fusion was detectable on long read optical mapping in NCI-H889 and NCI-H1092, (Fig. 2B, Fig. S3E), but was not observed for NCI-H1963, likely due to the high complexity of the rearrangement. Colocalization of RLF and MYCL was confirmed by imaging of metaphase nuclei by FISH using targeted probes for the RLF promoter area and MYCL, with extrachromosomal colocalization of probes seen in all three cell lines (Fig. 3F, Fig. S3F). We also confirmed the presence of in-frame RLF-MYCL fusion transcript through RNA qPCR. Splicing between RLF exon 1 and MYCL exons 2 or 3 were over 1000x higher than between RLF exon 1 to RLF exon 2 (Fig. 3G, Fig. S3G, Table S4). On Western blot, the RLF-MYCL fusion protein expression was substantially higher than endogenous MYCL expression of fusion-positive cell lines (NCI-H889, NCI-H1092 and NCI-H1963) and cell lines with chromosomal MYCL amplification (DMS-273 and CORL88) (Fig. 3H). Presence of the fusion explains why the MYCL enhancer is weaker than the RLF enhancer in the NCI-H889 (Fig. 2D) since the fusion transcript serves as the main target for MYCL expression. In murine models, RLF-MYCL1 fusion accelerates SCLC tumorigenesis while also altering the nature of cancer progression, enhancing the frequency and diversity of metastases(50). Our studies reveal ecDNA as a structural basis RLF-MYCL fusion in SCLC.
ecDNA and plasticity of SCLC neuroendocrine cell states
To understand the genetic diversity afforded by ecDNA and its role in SCLC plasticity, we focused first on DMS-273 which was predicted to contain two distinct circular amplicons by WGS: a MYC amplicon derived from chromosome 8 and a MYCL amplicon derived from chromosome 1. Two-color DNA FISH confirmed the coincident occurrence of numerous MYC and several MYCL ecDNAs in each cell (Fig. 4A, quantified in Fig. S4A) with an overall positive correlation between MYC and MYCL ecDNA/cell. Based on ecDNA reconstructions, the MYCL ecDNA was assembled from two main segments, while the MYC ecDNA had a more complex pattern (Fig. 4B), and a broader range of sequencing depths (Fig. S4B). To characterize the genetic diversity that defines cell populations with distinct ecDNA types, we performed single-cell DNA sequencing of recurrently amplified SCLC genomic loci using primers containing unique barcodes against 196 amplicons spanning 12 genes and several ecDNA areas (Table S5). MYC and MYCL ecDNA spanning amplicons had significantly higher sequencing depths in all cells compared to non-amplified genomic regions (Fig. S4C), further validating the non-uniform amplification status of the MYC positive ecDNA (Fig. S4D). Surprisingly, the MYC and MYCL copy-numbers in the individual cells ranged over an order of magnitude (5.1-59.7 and 1.9-14.9 normalized depth range between upper and lower 10% for MYC and MYCL respectively: normalized data in Table S5) suggesting large variation of copy-number profiles of ecDNA. Due to the high level of heterogeneity, in some cell clusters MYC and MYCL amplicons had comparable levels (Fig. 4C and Fig. S4E). Comparable MYC and MYCL positive ecDNA counts/cell from FISH analysis, but with higher overall MYC copy-numbers based on sequencing suggests that there may be several copies of MYC on the ecDNAs. Even though the MYC and MYCL oncogenes are part of distinct ecDNAs, there was still an overall strong correlation between the sequencing depths (Spearman correlation mean ~0.7 ranging from 0.4-.99) of MYC and MYCL targeting amplicons, suggesting that some cells had overall more or less copies of both types of ecDNAs (Fig. S4F). Previous studies in other cancer types have described intermolecular regulation between ecDNAs involving distinct oncogenes, providing a selective advantage for cells carrying multiple ecDNAs(51). In contrast, our enhancer interaction analysis using bulk H3K27ac HiChIP revealed little to no intermolecular contacts between MYCL and MYC ecDNAs in DMS-273 (Fig. 4D, Fig. S4G, Table S6).
Figure 4. Heterogeneity of SCLC and ecDNA.

A) Identification of MYC and MYCL positive ecDNA in the DMS-273 cell line using FISH. B) Assembly of MYC and MYCL ecDNAs in DMS-273 from whole-genome sequencing data. Grey bars show normalized sequencing depth, red arches represent assembly paths. C) Single-cell copy-number analysis of targeted amplicons shows differential levels of MYC and MYCL copy numbers based on normalized read depths. The heatmap shows normalized sequencing depths for 5 amplicons covering MYCL and 6 amplicons covering MYC in 2k cells. D) Enhancer-enhancer interaction analysis using HiChIP data reveals little to no interaction between the MYC and MYCL ecDNAs (blue box) in the DMS-273 cell line. E) Selection of suspension (NCI-H524S) and adherent (NCI-H524A) cells from the parental NCI-H524 cell line. F) Microscope images of suspension and adherent NCI-H524 cells. G) Western blot of MYC, NE, and non-NE genes shows non-NE differentiation in adherent NCI-H524 cell line compared to the suspension counterpart. H) MYC FISH analysis identified ecDNA in both suspension and adherent NCI-H524 cells. Quantification of MYC positive ecDNA foci is summarized below. Statistical comparison was performed using the Wilcoxon rank sum test. I) Differential amplification landscape at the MYCL locus in the adherent and suspension NCI-H524 cells. Top track shows H3K27ac HiChIP signal for the parental cell line. Lower tracks show the genomic DNA sequencing for the suspension (H524S) and adherent (H524A) cell. J) The PVT1 promoter adjacent to MYC in the parental and suspension cells is lost from the ecDNA population of adherent H524A cells. Top track shows the H3K27ac HiChIP signal from the parental NCI-H524 cell line. Lower tracks show the genomic DNA sequencing for the suspension (H524S) and adherent (H524A) cells, respectively.
Next, we sought to examine the role of ecDNA in SCLC cell states and plasticity. SCLC cells with NE features tend to remain in suspension and grow as cell aggregates. By contrast, non-NE cells show mesenchymal or spindle morphology and exhibit varying degrees of adherence(4). Some SCLC cell lines such as NCI-H524 have both suspension and adherent cell populations (Fig. 4E). We isolated subpopulations of adherent (H524A) and suspension (H524S) cells from the NCI-H524 cell line and studied them in relation to one another (Fig. 4F). Suspension cells exhibited high expression of NE proteins and MYC, potentially representing a transition between NE and non-NE states(19), while the adherent cells showed high YAP1 expression (Fig. 4G). We observed similar MYC protein expression differences when comparing suspension and adherent cells from the DMS-273 and NCI-H446 cell lines (Fig. S4H–I). Intriguingly, despite differential MYC protein expression, both the suspension and adherent cells harbored MYC ecDNAs in similar numbers by FISH (p=0.087 Wilcoxon rank sum test, median 20 and 24 for H524A and H524S, respectively) (Fig. 4H, Fig. S4J). However, adherent cells demonstrated notably diminished MYC copy numbers compared with suspension cells (Fig. 4I; ~1.7x fold higher sequencing depth in suspension cells using linear regression analysis, Fig. S4K), suggesting multiple MYC copies in ecDNA of suspension cells
In addition, the adherent cells also exhibited loss of ecDNA regions that encompass the PVT1 promoter, which has an active enhancer signal in the parental cell line that interacts with the MYC enhancer (Fig. 4J). The two enhancers have strong interactions in both the NCI-H524 and NCI-H446 (Fig. S4L), uncovering a potential regulatory relationship. Although the PVT1 promoter is included in many MYC positive ecDNAs (5/8 cell lines and 1/3 tumor samples), the amplifications only partially cover PVT1, which may result in an inactive (truncated) transcript (Fig. S4M). Taken together with previous studies that have demonstrated PVT1 promoter, located downstream of MYC on chromosome 8q24.21 region, as a key regulator of MYC expression(52), these data suggest a possible role of ecDNA as regulatory elements in remodeling SCLC plasticity between the suspension NE and the adherent non-NE cell states.
Plasma detection of ecDNA and tumor heterogeneity in patients
EcDNA has tens to hundred more copies compared to regular chromosomes. We sought to determine whether ecDNA was detectable using ChIP-seq of the H3K4me3 histone modification from plasma cell-free nucleosomes (cfChIP-seq), an approach described in more detail in a recent study (bioRxiv 2022.06.24.497386). Among 82 patients with extensive stage SCLC, we detected elevated MYC and MYCL enhancer signals in plasma cfChIP-seq from 6.1% (n=5) of patients with SCLC (summarized in Table S7). All five cases also demonstrated ecDNA-like signal traces on the sequencing depth profile outside of the promoter H3K4me3 histone modification signal. In all five cases, we found remarkably concordant ecDNA-like amplification patterns and assemblies between the tumor WGS and plasma (Fig. 5A–B, Fig. S5A). Overall, these data underscore the potential utility of cfDNA-based sequencing methods to provide non-invasive detection of tumor ecDNA and HSR amplifications.
Figure5. Identification of ecDNA using cell-free ChIP-seq and ecDNA heterogeneity across metastatic sites.

A) Overview of cfChIP-seq experiment and establishment of patient derived cell lines from metastatic sites. B) Examples of ecDNA-like focal amplifications are detectable using cell-free ChIP-seq from patient plasma samples, validated with tumor genome sequencing. C) Comparison of normalized sequencing depth of cell lines and tumor sample (top) and ecDNA assembly, and H3K4me3 signal derived from the cfChIP-seq from plasma samples. Top track shows normalized sequencing depths of all cell lines and tumor WGS samples, with assembly arches shown in purple. Middle track shows H3K4me3 cfChIP signal from the patient. Lower track shows the background sequencing depth from the cfChIP-seq sample. D) Differential copy-number validation of the MYC locus in the cell lines. E) Differential ecDNA and HSR status in the cell lines identified by FISH probing of MYC gene. F) Number of ecDNA or HSR positive cells in the patient derived cell lines. Scale bars in the lower right corner represent 5 μm. G) MYC copy-number analysis using single-cell copy-number analysis demonstrated higher MYC copy-number heterogeneity in the ecDNA positive cell line compared to the HSR positive cell line. H) Enhancer-enhancer interactions at the MYC-PVT1 locus. Highest interactions were observed in the lung tumor-derived cell line. I) Quantified enhancer signal at the MYC and PVT1 promoters. J) Differential ASCL1, NEUROD1 protein expression levels between the ecDNA positive and HSR positive cells.
To understand the impact of ecDNA-mediated oncogene amplification on tumor heterogeneity, we profiled metastatic sites and tumor-derived cell lines obtained during rapid autopsy from a SCLC patient whose plasma cfChIP-seq showed MYC ecDNA-amplification. The patient was a 65-year-old man with a 39-pack year smoking history who was diagnosed with extensive stage SCLC involving upper lobe of the right lung, mediastinal and right hilar lymph nodes. He was treated with a combination of cisplatin and etoposide for two cycles, but the disease was refractory to treatment, with appearance of new chest wall and adrenal tumors after only two cycles. The patient underwent palliative radiotherapy to the chest wall tumor, and then received immune checkpoint inhibitor combination of ipilimumab and nivolumab, followed by two sequential investigational therapeutic combinations that produced no tumor response. The patient died of progressive disease 11 months after diagnosis (Fig. S5B). A rapid autopsy was performed 2 hours postmortem. Cell lines generated from cervical lymph node, liver, lung, and adrenal as well as the parent tumors were profiled using WGS, transcriptome, long-read optical mapping, and H3K27ac HiChIP.
Cell lines obtained at rapid autopsy had similar amplification patterns at the MYC locus compared to the parent lung tumor sample, but the cell lines had variable MYC copy-number states between them (Fig. 5C). For example, normalized MYC sequencing depth varied between 15x in case of the liver and cervical lymph node to 45x for the adrenal gland-derived cell line. MYC copy number was validated using qPCR, with the adrenal and lung-derived cell lines exhibiting the highest MYC levels (Fig. 5D) in agreement with WGS data (Fig. S5C, Table S8). Next, we probed MYC in metaphase nuclei by FISH to find marked heterogeneity of MYC ecDNA and HSRs across the metastatic sites. Specifically, lung and adrenal-derived cells were predominantly MYC ecDNA positive whereas cervical lymph node and liver-derived cells exhibited MYC HSRs (Fig. 5E–F, Table S8). These cell lines were an optimal model to examine the extent of uneven segregation of ecDNA during mitosis. Single-cell copy-number analysis of amplicons targeting MYC demonstrated that the ecDNA-positive adrenal gland-derived cell line had a wide range of ecDNA copies. In comparison, the HSR-positive cervical lymph node-derived cell line displayed more stable levels of copies among the single cells, due to the MYC locus being integrated into the chromosome (Fig. 5G, Table S5). These analyses demonstrate the high levels of heterogeneity arising from ecDNAs both at the single cell level, and across metastatic sites from a single patient.
Next, we sought to understand the regulatory basis of ecDNA heterogeneity across the metastatic sites. Long-read optical mapping demonstrated multiple possible assemblies in all cell lines, with some common events: full length MYC gene with a partial PVT1 promoter downstream of MYC (without any gene fusion based on RNA-seq), and a more distal localization of part of PVT1 intronic segment (Fig. S5D), consistent with the rearrangement patterns observed in the WGS data. To understand extrachromosomal PVT1-MYC co-regulation, we performed H3K27ac HiChIP. Enhancer connectome analysis revealed high PVT1-MYC promoter contact frequency in 3D within a small but dense topologically associated domain (Fig. 5H), but with differential interaction strengths across the cell lines. The strongest enhancer signals were observed in the ecDNA-positive lung and adrenal-derived cell lines, which were over 2 to 3-fold greater than HSR-positive cervical lymph node and liver-derived cells (Fig. 5I). MYC protein expression tracked the MYC-PVT1 enhancer interaction strength (Fig. 5H), rather than the MYC enhancer strength itself (Fig. 5I), with the lung tumor-derived cell line having the highest MYC expression (Fig. 5J, Fig. S5E).
Finally, we examined the association of ecDNA MYC amplification on SCLC phenotypes. All four cell lines had positive neuroendocrine scores, calculated using a 50 gene set signature(53), consistent with the elevated expression of NE-specific lineage transcription factors ASCL1 and NEUROD1 (Fig. S5F–G). However, immunostaining and western blot experiments revealed marked heterogeneity of ASCL1 expression across cell lines from the different metastatic sites. The high MYC-expressing lung tumor-derived cell line also notably expressed NEUROD1, potentially representing a MYC-driven cell-state transition between ASCL1 and NEUROD1 (Fig. S5H–J).
While these data warrant functional studies modulating MYC ecDNA and HSR, the heterogeneity of NE cell states associated with distinct MYC amplification patterns is consistent with the current understanding of SCLC plasticity, with MYC being sufficient to promote temporal evolution of SCLC from an ASCL1-high NE cell state to a NEUROD1-high less-NE cell state(19), and suggest that specific mechanisms of MYC amplification, ecDNA or HSR, and its regulatory interactions with distal enhancers on ecDNA may underlie the dynamic evolution of cell states between metastatic sites.
Discussion
Phenotypic plasticity endows tumor cells with the capacity to convert between distinct cell identities – allowing acquisition of metastatic capacity, drug resistance, and cancer progression(54, 55). While SCLC heterogeneity and plasticity are correlated with, and likely drive therapy resistance, the genetic mechanisms underlying tumor heterogeneity and phenotypic switching between cell states are still largely unknown(56). In this study, we provide the first detailed analysis of ecDNA in SCLC patient and cell line samples. We find that ecDNAs are a major source of high focal amplifications in key SCLC oncogenes and drivers of fusions. Beyond being vehicles of oncogene amplification and fusion, ecDNAs bring distal DNA elements to close proximity, allowing chromatin contacts between distal enhancers and oncogenes that cannot normally occur in chromosomal DNA, thus functioning as SCLC transcriptional amplifying units. The transcriptional flexibility afforded by ecDNAs may underlie the rapid expansion of SCLC intratumor heterogeneity, treatment resistance, and metastases, and the significantly worse survival outcomes of SCLCs harboring complex ecDNA amplifications.
Our study introduces ecDNA as a major contributor to SCLC heterogeneity (Fig. 6). We observe distinct mechanisms of MYC amplification across multiple metastatic tumors from the same patient, with some metastatic sites harboring MYC ecDNA and others MYC HSR. Tumor cells with ecDNA amplified MYC exhibit marked heterogeneity of MYC copy states compared with MYC HSR harboring cells, further validating previous observations that ecDNA are unevenly segregated across the daughter cells during mitosis(57) leading to rapid increase of genomic heterogeneity(26, 58). Our results also reveal ecDNA as a structural basis of PVT1 amplifications(59), and suggest the PVT1 enhancer as a key regulator of MYC expression by enhancer hijacking(60, 61). Previous studies have shown that PVT1 inhibits MYC by competing promoter enhancer interactions during development(62). Cancer cells may escape this inhibitory regulation by depleting PVT1 through amplification of MYC or fusion of PVT1 promoter with MYC(51). In SCLC, we did not identify PVT1-MYC fusions, but rather MYC amplifications that occasionally harbored the PVT1 promoter area, which leads to truncated transcripts of PVT1. MYC protein expression levels and enhancer-enhancer interaction analyses revealed that the strength of MYC-PVT1 interactions were more predictive of MYC protein expression levels than simply the MYC enhancer signal strength. We find that RLF-MYCL fusion, the most common gene rearrangement in human SCLC, can be a consequence of ecDNA assemblies. MYCL oncogene hijacks the RLF promoter through ecDNA driven structural rearrangements creating a fusion protein, further elevating MYCL expression and possibly also altering the nature of MYCL signaling. Together, these findings suggest a model wherein oncogene amplifications and fusions on ecDNA shape SCLC heterogeneity and plasticity by hijacking regulatory dependencies in the non-coding genome.
Figure 6.

Summary of the study.
Our findings raise a number of fundamental issues for follow up investigation, including the biology of ecDNA formation in SCLC, the determinants of transitions between ecDNA and HSRs including the impact of drug treatments, and therapeutic approaches to overcome the resulting plasticity. The impact of ecDNA on other SCLC phenotypes including its metastatic proclivity also warrants further study. We find that the DMS-273 cell line, known for its remarkable ability to metastasize to different sites(63), harbored distinct ecDNAs with MYC and MYCL oncogenes. The heterogeneity of MYC and MYCL ecDNA in DMS-273 may underlie its high metastatic potential. We recently found that ecDNA-amplified SCLC cell lines also have elevated levels of phosphorylated histone H2AX(64), suggesting high levels of intrinsic DNA damage, instability, and replication stress(6, 64, 65). Recent studies have demonstrated that DNA circularity confers highly potent immunostimulant activity for ecDNA(66). Analysis of ecDNA regulatory sequences would be valuable for the design of enhancer-based SCLC treatment strategies.
When considering the clinical impact of ecDNA, it is important to detect and stratify ecDNA-driven tumors. To do so, we provide proof-of-concept of a cell-free DNA (cfDNA) based non-invasive approach, leveraging ChIP-seq of histone modifications, to decipher ecDNA and HSR amplifications genome-wide from patient plasma samples. The lower frequency of ecDNA+ cases detected from plasma (6.1%) in our cohort of metastatic and relapsed patients compared with SCLC primary tumors (19.9%) may be explained by the overall worse survival of ecDNA-positive patients. While our approach awaits further validation in independent datasets, detection of ecDNA and HSRs from plasma opens a wide range of diagnostic opportunities in SCLC and other cancers.
While introducing MYC ecDNA as a source of SCLC heterogeneity, the current study has not established the causality between the ecDNA vs. HSR MYC amplifications and transcriptional subtype states. However, recent studies demonstrate conclusively that MYC is sufficient to promote the conversion of SCLC sequentially from an ASCL1 to a NEUROD1 to a YAP1 state from a NE cell of origin(19–21). Further studies are also needed to better understand how transitions between ecDNA and HSRs are impacted by drug treatments, and for developing therapeutic approaches to overcome the resulting plasticity. Such studies will be challenging given the need to manipulate ecDNA copy numbers and regulatory sequences precisely in the intact nuclei. We also recognize that gene mutations and amplifications are but one mechanism that underlies the biologically distinct cellular states and phenotypic plasticity of SCLC. Epigenetic regulators such as the histone methyltransferase EZH2 have been implicated in controlling NE cell fate and driving chemoresistance(67). Increasing evidence also supports the key role of tumor microenvironment in shaping cell SCLC states(2). Further studies are needed to decipher the interplay between genetic mechanisms revealed here and the non-genetic mechanisms which together make SCLC a shapeshifting tumor.
METHODS
Analysis of published whole-genome sequencing data
Whole-genome sequencing data was obtained from the SRA for the CCLE cell lines (PRJNA523380) and through EGA for the patient tumor samples (EGAS00001000925). The data of the tumor whole-genome sequencing samples was aligned to the hg19 genome version. The CCLE cell line reads were aligned to the hg19 human genome using the BWA-MEM aligner (arXiv:1303.3997v2). Alignments in SAM format were converted to BAM format, followed by sorting using the samtools package(68). Duplicate reads were marked using the picard-tools package (https://broadinstitute.github.io/picard/). Normalized sequencing depth tracks were generated using the BAMscale program(69), setting the bin size to 100bp. Normalized gene signal was calculated from the normalized bigwig files using the rtracklayer(70) and GenomicRanges(71) package, where the mean normalized sequencing depth of each gene was calculated using the the TxDb.Hsapiens.UCSC.hg19.knownGene gene annotation summarized by the genes() function in R.
Extrachromosomal DNA (ecDNA) was assembled from the whole-genome sequencing data using the AmpliconArchitect(38) (AA) program. For each sample, reads were down-sampled to 20% of the original size to reduce run time due to the high sequencing depths. Focal amplified regions were identified from the normalized bigwig files using the rtracklayer and GenomicRanges packages in R, by selecting regions with over 5 normalized signal, and merging segments within 10kb distance. These regions were used as putative intervals during the ecDNA reconstruction with AmpliconArchitect. Assembled ecDNAs were classified as circular or BFBs using the AmpliconClassifier(29) tool. Circular ecDNAs were manually curated and categorized as complex if the assembly derived from multiple genomic focal amplifications, while single-locus ecDNAs were categorized as simple ecDNAs. Survival analysis was performed using the manually curated results from the analysis using the Survival R package.
MYC, MYCL and MYCN FISH
Metaphase chromosomes were prepared by incubating cells for 2 hours with 0.02 mg/ml Colcemid (Invitrogen, Grand Island, NY). The harvested cells were then incubated in hypotonic solution (0.075M KCl) followed by methanol/acetic acid (3:1) fixation. Metaphases were then prepared in a controlled humidity chamber (Thermotron, Holland, MI) before being aged at 37ºC before hybridization. FISH probes were purchased from Empire Genomics (Williamsville, NY). We followed our standard FISH protocol (https://ccr.cancer.gov/staff-directory/thomas-ried under resources) for hybridization and detection of the probes. The hybridized slide was imaged using the Leica Thunder Imaging microscope (Leica, Wetzlar, Germany) equipped with custom optical filters and a 60X objective. All slides were counterstained with 4′,6-diamidino-2-phenylindole.
HiChIP sample preparation and analysis
H3k27ac-HiChiP was performed following the previously published HiChIP(72). Briefly, cells grown at 70% confluency were detached, cross-linked with formaldehyde for 10mins and quenched with 125mM Glycine. Here, cells were lysed in preparation for in-situ contact generation. Isolated nuclei were permeabilized, restriction digestion was carried out for 2hrs at 37C with MboI (New England Biolabs). Restriction sites filed with dNTP’s using Biotin-14-dATP (Jena Biosciences) for 1hr at 37C. The filled ends were then ligated together using a T4 ligase at room temperature for 4 hr with before nuclei were lysed, sonicated (using Covaris) and then H3k27ac (Abcam, ab4729) immunoprecipitation was carried out overnight using antibodies. The morning after, 30ul of beads were added to collect the chromatin-antibody complex; then the ChIP DNA was collected, washed and crosslinks reversed overnight using Proteinase K. ChIP DNA was eluted and samples purified using the DNA Clean up kit. The DNA was quantified using a Qubit before biotin ligation junction capture using Streptavidin C-1 beads. Samples were washed and taken forward for Tn5 Tagmentation. Tagmentation and PCR amplification was performed as described(72). Libraries were size selected to 200–700 bp and sequenced on the HiSeq using 2 × 150 bp.
Sequenced reads were processed using the HicPro(73) pipeline (v3.1.0), aligning the data to the hg19 genome version and MboI motif for the analysis. The resulting valid read pairs were converted to a contact matrix “.hic” format with the hicpro2juicebox.sh tool from the Juicebox(74) suite. Contact quantifications from the resulting “.hic” were calculated using the straw R functions from the Juicebox suite. Hi-ChIP contact matrices and genome tracks were plotted using the gtrack package (https://github.com/mskilab/gTrack) in R. Published HiChIP data(75) (GEO accession GSE151001) that served as validation was processed with the same pipeline.
Analysis of published data ChIP-seq and ATAC-seq
ChIP-seq for the enhancer marker H3K27ac was obtained from(43, 75) (GEO accessions GSE151001, GSE115123). ATAC-seq data was obtained from(21) (GEO accession GSE156334). Raw data was trimmed using trimmomatic(76), followed by alignment to the hg19 genome using the BWA ME algorithm (arXiv:1303.3997v2). The BAM files were sorted with samtools(68), followed by duplicate marking using picard-tools. Normalized sequencing depth tracks were created using BAMscale(69). Peaks were called using MACS(77) peak caller setting the FDR value to 0.05.
DNA methylation analysis (850K EPIC array + RRBS)
DNA methylation for SCLC cell lines was obtained for the 850K EPIC array and RRBS platforms(34).
The 850K EPIC array data for the SCLC cell lines was processed using the minfi(78) package. Normalized values were calculated using the preprocessIllumina() function, from which the signal depth was calculated as the sum intensity of methylated and unmethylated signal for each probe. Probes were mapped to the genome using the mapToGenome() function.
Methylation probe beta values were calculated using the getBeta() function. Methylation beta values and sum intensities were exported to bigwig format using the rtracklayer(70) package, using the BSgenome.Hsapiens.UCSC.hg19 package as reference for sequence lengths.
Reduced-representation bisulfite sequencing (RRBS) data was aligned to the hg19 genome using the Bismark(79) aligner (v0.22.3). Bisulfite converted sequencing reads mapped to the genome were converted to methylation states using the bismark_methylation_extractor tool from the Bismark tools. The resulting coverage files were filtered to include sites with at least 20x coverage, filtering for sites either on C or G nucleotides, exporting to bedGraph format. The resulting bedGraph format files were converted to bigwig using the rtracklayer package, using the BSgenome.Hsapiens.UCSC.hg19 package as reference for sequence lengths.
RNA-seq fusion analysis and expression heatmap
The transcriptome data for the CCLE SCLC cell lines was obtained from the Sequence Read Archive (SRA) under accession PRJNA523380. Fusions were identified using the STARfusion tool (bioRxiv120295), analyzing sequenced reads against the pre-build reference (GRCh37_gencode_v19_CTAT_lib_Oct012019.plug-n-play). Gene expression levels were quantified using the TPMcalculator(80) tool, combining unique exon reads for each gene, followed by normalization with DESeq2(81), to obtain scaling factors for each sample. Normalized sequencing depth tracks were created using BAMscale, using the scaling factors determined by DESeq2.
The heatmap demonstrating the expression of NAPY genes (ASCL1, NEUROD1, POU2F3 and YAP1) and MYC paralogues (MYC, MYCL, MYCN) were created using gene expression data from the SCLC-CellMinerCDB(41) in case of cell lines, and cBioPortal(82) for the tumor samples. Normalized RNA-seq values were Z-scored for the two data sources, followed by merging of data for the heatmap visualization. Heatmaps were prepared using the ComplexHeatmap(83) package in R.
RLF-MYCL FISH experiment
All cells were incubated under standard conditions. Metaphase cells were enriched by treating cells with Karyomax (15210-040, Gibco Invitrogen) at a final concentration of 0.1 μg ml-1. Cells were collected, washed in PBS, and resuspended in 75mM KCl (6858-04, Macron Chemical) for ~15 min at 37°C. Cells were fixed by addition of an equal volume of Carnoy’s fixative (3:1 methanol: glacial acetic acid, JT Baker). Cells were washed three additional times in Carnoy’s fixative and dropped onto humidified glass slides.
Using whole genome sequencing data, probes were designed using the UCSC database using both hg19 and hg38, since the probes used in this experiment were custom builds (Empire Genomics, Williamsville, NY). Build 1 was used for line NCI-H1092, chr1: 40351718-40377194 MYCL, chr1: 40611000-40640000 RFL exon 1 area and chr1:41136523-41805548 for control region. Build 2 was used for lines NCI-H889 and NCI-H1963, chr1: 40351718-40377194 MYCL, chr1: 40596190 – 40634743 RLF exon2, chr1:41136523-41805548 for control region. MYCL was labeled in green-dUTP(5-Fluorescein), RFL was labeled with red-dUTP(5—Carboxyl-x-rhodamine) and the control was labeled gold-dUTP (Carboxyrhodamine 6G).
Metaphase spreads were equilibrated in 2x SSC (30mM sodium citrate, 300mM NaCl, pH 7) for ~5 min. They were dehydrated using successive washes of 70, 85, and 100% ethanol for 2 min each and allowed to dry. FISH probes were diluted in hybridization buffer (Empire Genomics) and 10μl was added to metaphase spreads on slides, along with 22-mm2 coverslips. Samples were placed on ThermoBrite (Leica) for co-denaturation and hybridization, the program was set to denature at 75°C for 3 min and hybridize 37 °C for overnight in humid conditions (ThermoBrite Leica). Samples were washed successively in 0.4x SSC/0.3% Tween20 at 73°C for 2 minutes and 2xSSC with 0.1% Tween-20 at room temperature for 2 minutes. Samples were briefly rinsed with H2O. Samples were mounted with Prolong Gold Antifade with DAPI (P36935, Invitrogen, Life Technologies), #1.5 coverslips.
Fluorescent microscope images of the hybridized metaphases were acquired using Hyper Spectral Imaging system (Applied Spectral Imaging Inc., CA) mounted on top of an epi-fluorescence microscope (Imager Z2, Zeiss). Images were analyzed using acquisition software (HiFISHv8.2.2, Genasis, Applied Spectral Imaging Inc., CA). An average of 5-25 mitoses of comparable staining intensity and quality was examined per cell-line. Images were subsequently analyzed in paint3D to perform cropping, any additional adjustments to image brightness.
Cell culture
Cell lines were cultured in RPMI-1640 (ThermoFisher Scientific, cat# 11875-119) supplemented with 10% heat-inactivated fetal bovine serum (Gemini Bio-products, cat# 100-106-500) and 1% penicillin-streptomycin (ThermoFisher Scientific, cat# 15140122) at in a 37 °C/5% CO2 humidified incubator. Cell lines were tested as negative for mycoplasmas (Lonza, cat# LT07–418). Adherent NCI-H524 cells were selected by removing three quarters of the floating cells at regular intervals to avoid the medium to turn yellow. Adherent NCI-H524 were first collected by trypsinization and transferred to new flasks when ~ 50% confluency was achieved. Suspension cells for NCI-H446 (adherent) and DMS273 (loosely adherent) were created by serially transferring the non-adherent cells to new flasks. Around 8 and 15 passages were necessary to obtain suspensions populations for H446 and DMS273 respectively. Suspension cell cultures were maintained by transferring suspension cells only to new flasks during cell passage.
Cell lines
The NCI-H889, NCI-H524, NCI-H1092, NCI-H69, NCI-H1963, DMS-114 and NCI-H446 were obtained from ATCC (https://www.atcc.org/), while the DMS-273 and CORL88 were obtained from Sigma Aldrich (https://www.sigmaaldrich.com/). The DMS-273, NCI-H446, NCI-H524, COR-L88 and NCI-H69 were tested by genotyping (Laragen Sequencing and Genotyping, Laragen Inc, CA USA). Cell lines were tested for mycoplasma using a MycoAlert mycoplasma detection kit (Lonza, cat# LT07–418) following the manufacturer instructions. Cell lines are routinely tested before freezing and after thawing. Cells were used after at least 5 passages from thawing.
Western blotting
Cell pellets containing one million cells were harvested by centrifugation at 2700×g for 5 min at 4 °C, washed twice with 1× phosphate-buffered saline (PBS PH 7.4) (ThermoFisher Scientific, cat# 10010-072) at 18,000 × g for 5 min at 4 °C and resuspended in two hundred μl 2× Laemmli sample buffer (Bio-Rad, Cat# 1610737) supplemented with 5% 2-mercaptoethanol (Sigma Life Sciences, cat# M3148-100ML). The resulting total cell lysates were vortexed, boiled for 5 min and then centrifuged at 11,000 × g for 5 min at 4 °C. Seven μl of the lysate supernatants were separated by SDS-polyacrylamide gel electrophoresis (PAGE) (ThermoFisher Scientific, cat# XP04205BOX) then transferred onto PVDF membranes (Millipore Sigma, cat# IPVH304F0 prior to immunodetection). Protein bands from Western blot images were quantified using the ImageJ software (https://imagej.nih.gov/ij/index.html).
The following primary antibodies were used: anti-ASCL1 (Santa Cruz Biotechnology, cat# SC-374104), anti-c-MYC (Cell Signaling, cat# 5605S), anti-L-MYC (Cell Signaling, cat# 76266S), anti-N-MYC (Cell Signaling, cat# 51705S), anti-alpha tubulin (Millipore Sigma, cat# T9026-.2ML), anti-NEUROD1 (Cell Signaling, cat# 7019S), anti-YAP1 (Cell Signaling, cat# 4912S), anti-INSM1 (Santa Cruz Biotechnology, cat# SC-271408) (1:1,000 dilutions). The following secondary antibodies were used: HRP-linked anti-mouse IgG (Cell Signaling, 7076S), HRP-linked anti-rabbit IgG (Cell Signaling, 7074S), Alexa 647 conjugated anti-mouse IgG (Invitrogen, cat# A28181), Alexa 488 conjugated anti-rabbit IgG (Invitrogen, cat# A11034) (1:2,000 dilutions).
Immunofluorescence analysis
Cell collected by centrifugation or after trypsinization were fixed in 2% paraformaldehyde (PFA) and washed twice in PBS. Two hundred μl cell solution (1.5 to 3 million cells/ mL were then spotted on slides by cytospin (Thermo Shandon Cytospin3, 800 RPM, 4 min). After cytospin, slides were dried quickly, placed in PBS for 15 min and then permeabilized with pre-chilled ethanol 70% overnight. Slides were then washed twice with PBS (total wash of 15 min). For blocking and antibody incubations, PBS was replaced with PBS containing 0.5% tween-20 and 0.1% triton X-100 for blocking and antibody incubations (= PBS-TT). Cells were blocked with 5% Bovine Serum Albumin (BSA) (Sigma-aldrich, cat# A9647-100G) in PBS-TT for 1 hr. After a 5-min wash in PBS, primary antibodies were incubated 2 hr [1:500 in 1% BSA in PBS-TT] followed by 3 washes with PBS 95 min each) and 1-hr incubations with Alexa-conjugated IgG antibodies. After a 5-min with PBS, samples were incubated with DAPI for 10 min (2μl of a 20μg/ml DAPI solution per 1 ml PBS). After a quick wash with PBS, samples were mounted with PI-containing mounting medium containing (Vectashield, Vector Laboratories, cat# H-1200) and sealed with nail polish. Slides were imaged using a ZEISS LSM780 microscope
The following primary antibodies were used: anti-ASCL1 (Santa Cruz Biotechnology, cat# SC-374104), anti-c-MYC (Cell Signaling, cat# 5605S), anti-NEUROD1 (Cell Signaling, cat# 7019S) (1:500 dilutions). The following secondary antibodies were used: Alexa 568 conjugated anti-mouse IgG (Invitrogen, cat# A11004), Alexa 488 conjugated anti-rabbit IgG (Invitrogen, cat# A11034) (1:500 dilutions).
EcDNA junction sequencing
Genomic DNA samples from five million cells were prepared using the Qiagen DNeasy blood and tissue kit (69504). Genomic DNA was diluted to 100 ng/μl prior to its use for PCR. Nested PCR, involving two sequential amplification reactions, was used to generate DNA fragments with ecDNA junctions. Primers used for PCR reactions were: PCR1 (5’ GGATTAAGTCGTCCGCAGTC 3’ and 5’AGGAACCTGAAGCTCTATGTGA 3’), PCR2 (5’ TGGCTGTCTGTTCTCTCCAG 3’ and 5’ CTTGGCCAAGCACAGAACTC 3’). Settings for PCR1 reaction: 1. Initial denaturation 95°C / 5min, 2. Denaturation 94°C / 40 s, 3. Annealing 60°C / 40 sec, 4. Elongation 72°C 1min, 39 repeat for steps 2 to 4 and final extension for 10 min at 72°C. The reaction volume was 25 μl. Settings for PCR2 reaction: 1. Initial denaturation 95°C / 5min, 2. Denaturation 94°C / 40 s, 3. Annealing 59°C / 40 sec, 4. Elongation 72°C 1min 10sec, 39 repeat steps for 2 to 4 and final extension for 10 min at 72°C. The reaction volume was 50 μl. Fragment from PCR2 was isolated and purified from agarose gel using a gel extraction kit (New England Biolabs, cat# T1020S), following the manufacturer instructions. Sanger sequencing of the Junction was performed using the primers 5’ ATGCAGAATCCAGCAGCCCC 3’ and 5’ AACAGTGATTGGCCCAGGGG 3’.
RLF-MYCL validation using qPCR and western blot
Cell lines were plated at 1 million cells in a 10cm dish and 24 hours later collected. RNA was collected using the Qiagen RNeasy Mini Kit per manufacturer’s instructions. cDNA was generated using the Applied Biosystems High Capacity cDNA Reverse Transcription kit and a MiniAmp thermal cycler per manufacturer’s instructions. QPCR was performed using Applied Biosystems Fast SYBYR Green Master Mix and a Quant Studio 5 per manufacturer’s instructions. Probes utilized:
RLF-E2: TGGACGTGCACTGGCAAAGC
RLF-E1b: GTCTCCCTTTCCGTCCGCC
RLF-E1a: ACTACTGCCGGAGCTTCTGC
MYCL-E1a: GGCAGCCAGCACACACGCAC
MYCL-E1b: GTGCGTGTGTGCTGGCTGC
MYCL-E2a: CGAGTCGTAGTCCATGTCCG
MYCL-E2b: CAAGCGACTCGGGTAAGGAC
MYCL-E3a: GCTTCATGCAGGGATCCAGG
MYCL-E3b: CGGGCAGCATAGTTGTGCTG
Western blot:
Cells were washed twice with PBS, then lysed with RIPA buffer containing protease inhibitor cocktail (Thermo Fisher Scientific) and micrococcal nuclease (Thermo Fisher Scientific). The resulting mixtures were incubated on ice for 30 minutes, then centrifuged 20 minutes to get the supernatants. After adding Tris-Glycine SDS sample buffer including 5% of 2-Mercaptoethanol, the lysates were boiled for 10 min, analyzed by SDS–polyacrylamide gel electrophoresis (SDSPAGE), and immunoblotted with RLF-L-MYC antibody (Cell Signaling Technology, Cat# 76266). The immunoblotted membrane was stripped and re probed with antibody against Tubulin as loading control.
Long read optical mapping data
DNA preparation.
Ultra-high molecular weight (UHMW) gDNA was extracted from several human small cell lung cell lines with the Bionano Prep SP Blood and Cell DNA Isolation Kit (Bionano Genomics, 80030) as described in the Bionano Prep SP Frozen Cell Pellet DNA Isolation Protocol (Bionano Genomics). Brifely, between 1.3 and 2 million frozen pelleted cells were thawed in a 37 ºC bath and resuspended in DNA Stabilizing Buffer (Bionano Genomics). After that, the cells were lysed in the presence of detergents, proteinase K, and RNase A and the UHMW gDNA was bound to a silica Nanobind Disk (Bionano Genomics), washed, and eluted. The extracted gDNA was equilibrated for 3 days at room temperature to homogenize and quantified with Qubit dsDNA BR assay kit (Thermo Fisher Scientific, Q32850).
DNA labeling and data collection.
The isolated UHMW gDNA was fluorescently labeled using the Bionano Prep DNA Labeling Kit-DLS (Bionano Genomics, 80005) according to the Prep Direct Label and Stain (DLS) Protocol (Bionano Genomics). In short, Direct Label Enzyme (DLE-1) and DL-green fluorophores were used to label 750 ng of purified gDNA at a specific sequence motif. After a cleanup of the fluorophores excess, DNA backbone was counterstained overnight before quantitation with Qubit dsDNA HS assay kit (Thermo Fisher Scientific, Q32851). Finally, the labeled UHMW gDNA molecules were loaded on a Saphyr G2.3 chip for sequentially imaging across nanochannels on the Saphyr instrument (Bionano Genomics).
Data analysis.
Genome analysis was performed using Bionano Solve-v 3.7, Access 1.7 provided by Bionano Genomics. For genome assembly and variant analysis, subsampling was performed for each sample to obstain70x – 90x coverage of the reference genome. Bionano De novo assembly pipeline was run to assembly a genome from the molecule files (*bnx) for each sample with human GRCh38 reference provided. The Bionano assembly consensus genome map (CMAP) file was generated for each sample. CMAPs were assembled from clustered molecules which identified the same variant. SVs were identified based on discrepant alignment between molecules of each sample and reference sequence. CMAPs were realigned to reference genome sequence with SV confirmed by consensus to generate the final SV call set. Finally, copy number analysis was performed from alignment of molecules and labels against GRCh38 using alignmolvref. The molecule label coverage was normalized against relative coverage from normal human control, baseline CN state estimated from calculating mode of coverage of all labels. CN states of segmented genomic intervals were assessed for significant increase/decrease from the baseline. The corresponding duplication and deletion copy number variant calls were output as result. For cell lines where optical mapping was performed, reads were realigned to the hg38 genome, followed by ecDNA assembly using ampliconArchitect. The reference sequence of ecDNAs was prepared using the AmpliconReconstructor(83) tool with default settings. Inputs used for the analysis were the de novo assembly results from the Bionano analysis tools and the amplicons calculated from the whole genome sequencing data calculated by the AmpliconArchitect tool.
Single-cell CNV analysis using targeted sequencing data
Targeted amplicons were designed to cover amplified ecDNA regions for the DMS-273, NCI-H889 and the patient derived RA022 cell lines, as well as certain tumor suppressor genes (TP53, RB1 and FHIT) and background sites. The design covered a total of 199 sites, summarized in TableS5.
Cryopreserved cells were quickly thawed by gently swirling the vials in the 37C water bath. Cells were suspended and washed with 1X DPBS at room temperature. Cells were then resuspended in Mission Bio cell buffer at a concentration of 3,000-4,000 cells/ul. Afterwards, the cells were microfluidically encapsulated, lysed, and barcoded in Tapestri platform. Barcoded samples were then simultaneously PCR-amplified in droplets with a custom 199-amplicons panel covering 16 genes. Amplified products were purified and ligated with Illumina specific P5 and P7 indices. In the next step, libraries were quantified with an Agilent Bioanalyzer for quality control, pooled and sequenced on an Illumina NovaSeq platform.
Pooled libraries were sequenced on NovaSeq 6000 SP with paired-end sequencing (2 x 151 cycles). Sequencing run was demultiplexed using Bcl2fastq v2.20. The fastq files were processed through Mission Bio’s Tapestri pipeline v2.0.1 with default parameters. Briefly, the adapter sequences were trimmed from raw reads using Cutadapt(83) v1.18. Reads that are too short with less than 30bps were discarded. Trimmed reads were mapped to the reference genome hg19 using BWA-MEM1 v0.7.17. The CellFinder module extracted the barcodes from the mapped reads to identify captured cells. Barcodes that passed a total reads cutoff (the number of amplicons in the panel x 8 reads) are selected from at least 80% of good-performing amplicons (with the number of reads more than 0.2 x the mean of all amplicon reads). In the next step, the GATK HaplotypeCaller was used to call variants individually on each cell, and then GATK GenotypeGVCFs was applied to jointly genotype all cells using genotype likelihoods from the previous step based on the GATK Best Practices. The unfiltered VCF was parsed into an HDF5 file, which contains single-cell variants and per-amplicon read count matrices compatible with downstream analysis.
Raw amplicon quantifications for the cell lines were analyzed using R. Data was normalized using the Seurat(84) package, using the NormalizeData() function, setting the method to “RC”, minimum number of cells to 3, and minimum features to 25. Since many of the amplicons targeted ecDNA regions, normalization was first performed on background amplicons and amplicons targeting tumor suppressor genes, from which the scaling factors were obtained. The normalized read counts for all amplicons were calculated using the obtained scaling factors. Normalization was performed for each of the cell lines separately (DMS-273, NCI-H889 and the patient derived cells together), to exclude any variation in copy number of the non-ecDNA regions.
Sample preparation and analysis of adherent and suspension cells
NCI-H524 cell lines was obtained from ATCC (www.atcc.org) and tested for mycoplasmas (Lonza, LT07-418). Human H524 cells were grown at 37 °C in a 5% CO2 atmosphere in RPMI 1640 medium (ThemoFisher, 11875119), supplemented with 10% fetal calf serum (GeminiBio, 100-106). Cells were passage by splitting cells 1:3 to 1:4, keeping cells below 0.5 x 10⁵/mL. Adherent NCI-H524 cells were selected by removing three quarters of the floating cells at regular intervals to avoid the medium to turn yellow. Adherent NCI-H524 were first collected by trypsinization and transferred to new flasks when ~ 50% confluency was achieved.
Western blots were done with whole-cell lysates by adding 200μl SDS loading buffer (Biorad, 1610737) per 1 million cell pellets. Samples were heated at 100°C for 5 minutes, centrifuged, and the supernatant was used for Western blot. Immunoblotting signals were detected using the ChemiDoc MP imaging system (BioRad). The following primary antibodies were used: anti-c-Myc (Cell Signaling Technology, 5605S), anti-NEUROD1 (Cell Signaling Technology, 7019S), anti-YAP1 (Cell Signaling Technology, 4912S), anti-INSM1 (Santa Cruz, SC-271408) and anti-α tubulin (Millipore-Sigma, T9026).
Genomic DNA samples from five million cells were prepared using the Qiagen DNeasy blood and tissue kit (69504). DNA samples were sequenced using the Novaseq S1 sequencing system (150bp, paired-end reads) to obtain more than 300 million total reads (319,758,170 for H524A and 431,577,608 for H524).
Raw data was trimmed using trimmomatic14, followed by alignment to the hg19 genome using the BWA MEM1 algorithm. The BAM files were sorted with samtools2, followed by duplicate marking using picard-tools. Normalized sequencing depth tracks were created using BAMscale3. ecDNA assembly was performed using the AmpliconArchitect tool.
cfChIP samples and data analysis
For cfChiP-seq, plasma samples were collected from patients with small cell cancer who received care at the National Cancer Institute (NCI). Patients were enrolled in therapeutic clinical trials (ClinicalTrials.gov #NCT02484404; NCI protocol #15-C-0145; ClinicalTrials.gov #NCT02487095; NCI protocol #15-C-0150; ClinicalTrials.gov #NCT02769962; NCI protocol #16-C-0107; ClinicalTrials.gov # NCT03554473; NCI protocol #18-C-0110; and ClinicalTrials.gov # NCT03896503; NCI protocol #20-C-0009). We also collected samples from small cell cancer patients who were enrolled in the NCI thoracic malignancies natural history protocol (ClinicalTrials.gov # NCT02146170; NCI protocol #14-C-0105). Rapid autopsy was performed to collect metastatic tumor samples from a patient with small lung cancer under NCI protocol #13-C-0131. Human subjects committee at NCI approved the studies; all patients provided written informed consent per Declaration of Helsinki principles. Sample preparation and sequence analysis was performed similarly to a previous study(85). Highly amplified oncogenes were detected based on the normalized genic signal from regions outside of detected H3K3me3 peaks.
Patient derived cell lines
Samples were obtained from five patients diagnosed with thoracic malignancies who underwent rapid autopsy. Informed consent for rapid autopsy was obtained under an IRB approved protocol 13-C-0131 (NCT01851395) entitled “A Pilot Study of Inpatient Hospice with Procurement of Tissue on Expiration in Thoracic Malignancies.” Patients previously treated at the NCI and with life expectancy less than 3 months were offered inpatient hospice treatment at the Clinical Center of the National Institutes of Health and upon death autopsies were initiated within 3 hours. Clinical information, including the sex, gender of each patient is available in Table S1. One patient, RA003, elected to receive end of life care at home and was subsequently transported to the NIH Clinical Center post-mortem. Prioritization of lesions removed at autopsy was based on CT scan performed within one month before death. All tumors within each patient were removed by an experienced pathologist and macro dissected to remove surrounding non-neoplastic tissue. Punch biopsy needles were used to obtain spatially distinct cores from each tumor. One-third of each tissue core sample was fixed in 10% buffered formalin, one-third in optimal cutting temperature compound (OCT) and the remaining tissue was immediately flash frozen in liquid nitrogen and stored at −80°C. Part of each fresh tumor tissue was stored in RPMI. Within 1 hr, tumors were mechanically minced into 1 mm3 pieces and enzymatically digested with PBS containing collagenase and hyaluronidase for 1 hr at 37 degrees Celsius. Single cell suspensions were passed through a 70 uM cell strainer and RBC lysis performed for 5 min. Cells were washed with PBS and then placed in a 25 cm3 flask containing RPMI with 10% FBS. Media was changed weekly until adequate cell growth. For each tissue sample, a 5-μm section was taken to create a hematoxylin and eosin slide to visualize neoplastic cellularity using a microscope.
MYC CNV
Cell lines were plated at 1 million cells in a 10cm dish and 24 hours later collected. DNA was collected using the Qiagen DNeasy Blood and Tissue Kit per manufacturer’s instructions. To assess copy number state we utilized Thermo Fisher Scientific TaqMan™ Genotyping Master Mix along with Taqman Copy Number Assay MYC and Taqman Copy Number Reference Assay RNase P and a Quant Studio 5 per manufacturer’s instructions.
Western blot results for RLF-MYCL and patient-derived cell lines
Cells were washed twice with PBS, then lysed with RIPA buffer containing protease inhibitor cocktail (Thermo Fisher Scientific) and micrococcal nuclease (Thermo Fisher Scientific). The resulting mixtures were incubated on ice for 30 minutes, then centrifuged 20 minutes to get the supernatants. After adding Tris-Glycine SDS sample buffer including 5% of 2-Mercaptoethanol, the lysates were boiled for 10 min, analyzed by SDS–polyacrylamide gel electrophoresis (SDSPAGE), and immunoblotted with the antibodies against to RLF-L-MYC (Cell Signaling Technology, Cat# 76266), C-MYC (Santa Cruz, Cat# sc-40), ASCL1 (Santa Cruz, Cat# sc-390794), NEUROD1 (Cell Signaling Technology, Cat# 4373S) .The immunoblotted membrane was stripped and re probed with antibody against α-Tubulin (Sigma-Aldrich, Cat# T9026) as loading control.
Data availability
The sequencing data of H3K27ac HiChIP, scCNV and whole genome for previously characterized cell lines was deposited at GEO under accession number GSE206354 (H3K27ac HiChIP: GSE206351; scCNV: GSE206352; whole genome GSE206353). The long-read optical mapping data for previously characterized cell lines is available at the GenBank repository (NCI-H889: PRJNA849929; NCI-H524: PRJNA849955; NCI-H1092: PRJNA849961; NCI-H1963: PRJNA849963). The newly generated patient derived cell line H3K27ac HiChIP data, RNA-seq, genome sequencing data and long read optical mapping data, as well as patient-derived genome sequencing data is available at phs003190.v1.p1.
Ethics Reporting
All patients provided written informed consent per Declaration of Helsinki principles.
Supplementary Material
Statement of Significance.
MYC drives SCLC progression, but the genetic basis of MYC-driven SCLC evolution is unknown. Using SCLC as a paradigm, we report how ecDNA amplifications function as MYC amplifying units, fostering tumor plasticity and a high degree of tumor heterogeneity.
Acknowledgement
We gratefully acknowledge the contributions of our patients who participated in the study and their families. This work utilized the computational resources of the NIH HPC Biowulf cluster. (http://hpc.nih.gov). This work was supported by the intramural programs of the Center for Cancer Research, National Cancer Institute (ZIA BC 011793).
Conflict of interest statement
A. Thomas reports grants to the institution from EMD Serono, Astra Zeneca, Immunomedics, Prolynx, Immunomedics, and Tarveda during the conduct of the study.
REFERENCES
- 1.George J, Lim JS, Jang SJ, Cun Y, Ozretic L, Kong G, et al. Comprehensive genomic profiles of small cell lung cancer. Nature. 2015;524(7563):47–53. [DOI] [PMC free article] [PubMed] [Google Scholar]
- 2.Lissa D, Takahashi N, Desai P, Manukyan I, Schultz CW, Rajapakse V, et al. Heterogeneity of neuroendocrine transcriptional states in metastatic small cell lung cancers and patient-derived models. Nat Commun. 2022;13(1):2023. [DOI] [PMC free article] [PubMed] [Google Scholar]
- 3.Gazdar AF, Carney DN, Nau MM, Minna JD. Characterization of Variant Subclasses of Cell-Lines Derived from Small Cell Lung-Cancer Having Distinctive Biochemical, Morphological, and Growth-Properties. Cancer Res. 1985;45(6):2924–30. [PubMed] [Google Scholar]
- 4.Zhang W, Girard L, Zhang YA, Haruki T, Papari-Zareei M, Stastny V, et al. Small cell lung cancer tumors and preclinical models display heterogeneity of neuroendocrine phenotypes. Transl Lung Cancer R. 2018;7(1):32-+. [DOI] [PMC free article] [PubMed] [Google Scholar]
- 5.Calbo J, van Montfort E, Proost N, van Drunen E, Beverloo HB, Meuwissen R, et al. A Functional Role for Tumor Cell Heterogeneity in a Mouse Model of Small Cell Lung Cancer. Cancer Cell. 2011;19(2):244–56. [DOI] [PubMed] [Google Scholar]
- 6.Thomas A, Takahashi N, Rajapakse VN, Zhang X, Sun Y, Ceribelli M, et al. Therapeutic targeting of ATR yields durable regressions in small cell lung cancers with high replication stress. Cancer Cell. 2021;39(4):566–79 e7. [DOI] [PMC free article] [PubMed] [Google Scholar]
- 7.Roper N, Velez MJ, Chiappori A, Kim YS, Wei JS, Sindiri S, et al. Notch signaling and efficacy of PD-1/PD-L1 blockade in relapsed small cell lung cancer. Nat Commun. 2021;12(1). [DOI] [PMC free article] [PubMed] [Google Scholar]
- 8.McColl K, Wildey G, Sakre N, Lipka MB, Behtaj M, Kresak A, et al. Reciprocal expression of INSM1 and YAP1 defines subgroups in small cell lung cancer. Oncotarget. 2017;8(43):73745–56. [DOI] [PMC free article] [PubMed] [Google Scholar]
- 9.Qu S, Fetsch P, Thomas A, Pommier Y, Schrump DS, Miettinen MM, et al. Molecular Subtypes of Primary SCLC Tumors and Their Associations With Neuroendocrine and Therapeutic Markers. J Thorac Oncol. 2022;17(1):141–53. [DOI] [PMC free article] [PubMed] [Google Scholar]
- 10.Owonikoko TK, Dwivedi B, Chen Z, Zhang C, Barwick B, Ernani V, et al. YAP1 Expression in SCLC Defines a Distinct Subtype With T-cell-Inflamed Phenotype. J Thorac Oncol. 2021;16(3):464–76. [DOI] [PMC free article] [PubMed] [Google Scholar]
- 11.Gay CM, Stewart CA, Park EM, Diao LX, Groves SM, Heeke S, et al. Patterns of transcription factor programs and immune pathway activation define four major subtypes of SCLC with distinct therapeutic vulnerabilities. Cancer Cell. 2021;39(3):346-+. [DOI] [PMC free article] [PubMed] [Google Scholar]
- 12.Stewart CA, Gay CM, Xi Y, Sivajothi S, Sivakamasundari V, Fujimoto J, et al. Single-cell analyses reveal increased intratumoral heterogeneity after the onset of therapy resistance in small-cell lung cancer. Nat Cancer. 2020;1:423–36. [DOI] [PMC free article] [PubMed] [Google Scholar]
- 13.Wagner AH, Devarakonda S, Skidmore ZL, Krysiak K, Ramu A, Trani L, et al. Recurrent WNT pathway alterations are frequent in relapsed small cell lung cancer. Nat Commun. 2018;9. [DOI] [PMC free article] [PubMed] [Google Scholar]
- 14.Yang D, Denny SK, Greenside PG, Chaikovsky AC, Brady JJ, Ouadah Y, et al. Intertumoral Heterogeneity in SCLC Is Influenced by the Cell Type of Origin. Cancer Discov. 2018;8(10):1316–31. [DOI] [PMC free article] [PubMed] [Google Scholar]
- 15.Ferone G, Lee MC, Sage J, Berns A. Cells of origin of lung cancers: lessons from mouse studies. Genes Dev. 2020;34(15–16):1017–32. [DOI] [PMC free article] [PubMed] [Google Scholar]
- 16.Olsen RR, Ireland AS, Kastner DW, Groves SM, Spainhower KB, Pozo K, et al. ASCL1 represses a SOX9(+) neural crest stem-like state in small cell lung cancer. Genes Dev. 2021;35(11–12):847–69. [DOI] [PMC free article] [PubMed] [Google Scholar]
- 17.Chen J, Guanizo A, Luong Q, Jayasekara WSN, Jayasinghe D, Inampudi C, et al. Lineage-restricted neoplasia driven by Myc defaults to small cell lung cancer when combined with loss of p53 and Rb in the airway epithelium. Oncogene. 2022;41(1):138–45. [DOI] [PubMed] [Google Scholar]
- 18.Lim JS, Ibaseta A, Fischer MM, Cancilla B, O’Young G, Cristea S, et al. Intratumoural heterogeneity generated by Notch signalling promotes small-cell lung cancer. Nature. 2017;545(7654):360-+. [DOI] [PMC free article] [PubMed] [Google Scholar]
- 19.Ireland AS, Micinski AM, Kastner DW, Guo B, Wait SJ, Spainhower KB, et al. MYC Drives Temporal Evolution of Small Cell Lung Cancer Subtypes by Reprogramming Neuroendocrine Fate. Cancer Cell. 2020;38(1):60–78 e12. [DOI] [PMC free article] [PubMed] [Google Scholar]
- 20.Mollaoglu G, Guthrie MR, Bohm S, Bragelmann J, Can I, Ballieu PM, et al. MYC Drives Progression of Small Cell Lung Cancer to a Variant Neuroendocrine Subtype with Vulnerability to Aurora Kinase Inhibition. Cancer Cell. 2017;31(2):270–85. [DOI] [PMC free article] [PubMed] [Google Scholar]
- 21.Patel AS, Yoo S, Kong RR, Sato T, Sinha A, Karam S, et al. Prototypical oncogene family Myc defines unappreciated distinct lineage states of small cell lung cancer. Science Advances. 2021;7(5). [DOI] [PMC free article] [PubMed] [Google Scholar]
- 22.Turner KM, Deshpande V, Beyter D, Koga T, Rusert J, Lee C, et al. Extrachromosomal oncogene amplification drives tumour evolution and genetic heterogeneity. Nature. 2017;543(7643):122–5. [DOI] [PMC free article] [PubMed] [Google Scholar]
- 23.Wu S, Turner KM, Nguyen N, Raviram R, Erb M, Santini J, et al. Circular ecDNA promotes accessible chromatin and high oncogene expression. Nature. 2019;575(7784):699–703. [DOI] [PMC free article] [PubMed] [Google Scholar]
- 24.Verhaak RGW, Bafna V, Mischel PS. Extrachromosomal oncogene amplification in tumour pathogenesis and evolution. Nat Rev Cancer. 2019;19(5):283–8. [DOI] [PMC free article] [PubMed] [Google Scholar]
- 25.deCarvalho AC, Kim H, Poisson LM, Winn ME, Mueller C, Cherba D, et al. Discordant inheritance of chromosomal and extrachromosomal DNA elements contributes to dynamic disease evolution in glioblastoma. Nat Genet. 2018;50(5):708–17. [DOI] [PMC free article] [PubMed] [Google Scholar]
- 26.Nathanson DA, Gini B, Mottahedeh J, Visnyei K, Koga T, Gomez G, et al. Targeted Therapy Resistance Mediated by Dynamic Regulation of Extrachromosomal Mutant EGFR DNA. Science. 2014;343(6166):72–6. [DOI] [PMC free article] [PubMed] [Google Scholar]
- 27.Morton AR, Dogan-Artun N, Faber ZJ, MacLeod G, Bartels CF, Piazza MS, et al. Functional Enhancers Shape Extrachromosomal Oncogene Amplifications. Cell. 2019;179(6):1330-+. [DOI] [PMC free article] [PubMed] [Google Scholar]
- 28.Nathanson DA, Gini B, Mottahedeh J, Visnyei K, Koga T, Gomez G, et al. Targeted therapy resistance mediated by dynamic regulation of extrachromosomal mutant EGFR DNA. Science. 2014;343(6166):72–6. [DOI] [PMC free article] [PubMed] [Google Scholar]
- 29.Kim H, Nguyen NP, Turner K, Wu SH, Gujar AD, Luebeck J, et al. Extrachromosomal DNA is associated with oncogene amplification and poor outcome across multiple cancers. Nat Genet. 2020;52(9):891-+. [DOI] [PMC free article] [PubMed] [Google Scholar]
- 30.Cox D, Yuncken C, Spriggs AI. Minute Chromatin Bodies in Malignant Tumours of Childhood. Lancet. 1965;2(7402):55-+. [DOI] [PubMed] [Google Scholar]
- 31.Stephens PJ, Greenman CD, Fu BY, Yang FT, Bignell GR, Mudie LJ, et al. Massive Genomic Rearrangement Acquired in a Single Catastrophic Event during Cancer Development. Cell. 2011;144(1):27–40. [DOI] [PMC free article] [PubMed] [Google Scholar]
- 32.Shoshani O, Brunner SF, Yaeger R, Ly P, Nechemia-Arbely Y, Kim DH, et al. Chromothripsis drives the evolution of gene amplification in cancer. Nature. 2021;591(7848):137–41. [DOI] [PMC free article] [PubMed] [Google Scholar]
- 33.Thomas A, Desai P, Takahashi N. Translational research: A patient-centered approach to bridge the valley of death. Cancer Cell. 2022;40(6):565–8. [DOI] [PubMed] [Google Scholar]
- 34.Ghandi M, Huang FW, Jane-Valbuena J, Kryukov GV, Lo CC, McDonald ER, 3rd, et al. Next-generation characterization of the Cancer Cell Line Encyclopedia. Nature. 2019;569(7757):503–8. [DOI] [PMC free article] [PubMed] [Google Scholar]
- 35.Tlemsani C, Pongor L, Elloumi F, Girard L, Huffman KE, Roper N, et al. SCLC-CellMiner: A Resource for Small Cell Lung Cancer Cell Line Genomics and Pharmacology Based on Genomic Signatures. Cell Rep. 2020;33(3):108296. [DOI] [PMC free article] [PubMed] [Google Scholar]
- 36.Pongor LS, Tlemsani C, Elloumi F, Arakawa Y, Jo U, Gross JM, et al. Integrative epigenomic analyses of small cell lung cancer cells demonstrates the clinical translational relevance of gene body methylation. iScience. 2022;25(11):105338. [DOI] [PMC free article] [PubMed] [Google Scholar]
- 37.Kim DW, Wu N, Kim YC, Cheng PF, Basom R, Kim D, et al. Genetic requirement for Mycl and efficacy of RNA Pol I inhibition in mouse models of small cell lung cancer. Genes Dev. 2016;30(11):1289–99. [DOI] [PMC free article] [PubMed] [Google Scholar]
- 38.Deshpande V, Luebeck J, Nguyen NPD, Bakhtiari M, Turner KM, Schwab R, et al. Exploring the landscape of focal amplifications in cancer using AmpliconArchitect. Nat Commun. 2019;10. [DOI] [PMC free article] [PubMed] [Google Scholar]
- 39.Rosswog C, Bartenhagen C, Welte A, Kahlert Y, Hemstedt N, Lorenz W, et al. Chromothripsis followed by circular recombination drives oncogene amplification in human cancer. Nat Genet. 2021;53(12):1673-+. [DOI] [PubMed] [Google Scholar]
- 40.Cao HZ, Hastie AR, Cao DD, Lam ET, Sun YH, Huang HD, et al. Rapid detection of structural variation in a human genome using nanochannel-based genome mapping technology. Gigascience. 2014;3. [DOI] [PMC free article] [PubMed] [Google Scholar]
- 41.Tlemsani C, Pongor L, Elloumi F, Girard L, Huffman KE, Roper N, et al. SCLC-CellMiner: A Resource for Small Cell Lung Cancer Cell Line Genomics and Pharmacology Based on Genomic Signatures. Cell Rep. 2020;33(3). [DOI] [PMC free article] [PubMed] [Google Scholar]
- 42.Shimizu N, Shingaki K, Kaneko-Sasaguri Y, Hashizume T, Kanda T. When, where and how the bridge breaks: anaphase bridge breakage plays a crucial role in gene amplification and HSR generation. Exp Cell Res. 2005;302(2):233–43. [DOI] [PubMed] [Google Scholar]
- 43.Huang YH, Klingbeil O, He XY, Wu XLS, Arun G, Lu B, et al. POU2F3 is a master regulator of a tuft cell-like variant of small cell lung cancer. Gene Dev. 2018;32(13–14):915–28. [DOI] [PMC free article] [PubMed] [Google Scholar]
- 44.Borromeo MD, Savage TK, Kollipara RK, He M, Augustyn A, Osborne JK, et al. ASCL1 and NEUROD1 Reveal Heterogeneity in Pulmonary Neuroendocrine Tumors and Regulate Distinct Genetic Programs. Cell Rep. 2016;16(5):1259–72. [DOI] [PMC free article] [PubMed] [Google Scholar]
- 45.Kumar P, Kiran S, Saha S, Su Z, Paulsen T, Chatrath A, et al. ATAC-seq identifies thousands of extrachromosomal circular DNA in cancer and cell lines. Sci Adv. 2020;6(20):eaba2489. [DOI] [PMC free article] [PubMed] [Google Scholar]
- 46.Zhu YF, Gujar AD, Wong CH, Tjong H, Ngan CY, Gong L, et al. Oncogenic extrachromosomal DNA functions as mobile enhancers to globally amplify chromosomal transcription. Cancer Cell. 2021;39(5):694-+. [DOI] [PMC free article] [PubMed] [Google Scholar]
- 47.Feber A, Guilhamon P, Lechner M, Fenton T, Wilson GA, Thirlwell C, et al. Using high-density DNA methylation arrays to profile copy number alterations. Genome Biology. 2014;15(2). [DOI] [PMC free article] [PubMed] [Google Scholar]
- 48.Vastrik I, Makela TP, Koskinen PJ, Saksela K, Alitalo K. Myc, Max, and a Novel Rlf-L-Myc Fusion Protein in Small-Cell Lung-Cancer. Princess Takamatsu S. 1992;22:307–18. [PubMed] [Google Scholar]
- 49.Rudin CM, Durinck S, Stawiski EW, Poirier JT, Modrusan Z, Shames DS, et al. Comprehensive genomic analysis identifies SOX2 as a frequently amplified gene in small-cell lung cancer. Nat Genet. 2012;44(10):1111-+. [DOI] [PMC free article] [PubMed] [Google Scholar]
- 50.Ciampricotti M, Karakousi T, Richards AL, Quintanal-Villalonga A, Karatza A, Caeser R, et al. Rlf-Mycl Gene Fusion Drives Tumorigenesis and Metastasis in a Mouse Model of Small Cell Lung Cancer. Cancer Discov. 2021;11(12):3214–29. [DOI] [PMC free article] [PubMed] [Google Scholar]
- 51.Hung KL, Yost KE, Xie L, Shi Q, Helmsauer K, Luebeck J, et al. ecDNA hubs drive cooperative intermolecular oncogene expression. Nature. 2021;600(7890):731–6. [DOI] [PMC free article] [PubMed] [Google Scholar]
- 52.Tseng YY, Moriarity BS, Gong W, Akiyama R, Tiwari A, Kawakami H, et al. PVT1 dependence in cancer with MYC copy-number increase. Nature. 2014;512(7512):82–6. [DOI] [PMC free article] [PubMed] [Google Scholar]
- 53.Zhang W, Girard L, Zhang YA, Haruki T, Papari-Zareei M, Stastny V, et al. Small cell lung cancer tumors and preclinical models display heterogeneity of neuroendocrine phenotypes. Transl Lung Cancer Res. 2018;7(1):32–49. [DOI] [PMC free article] [PubMed] [Google Scholar]
- 54.Gupta PB, Pastushenko I, Skibinski A, Blanpain C, Kuperwasser C. Phenotypic Plasticity: Driver of Cancer Initiation, Progression, and Therapy Resistance. Cell Stem Cell. 2019;24(1):65–78. [DOI] [PMC free article] [PubMed] [Google Scholar]
- 55.Boumahdi S, de Sauvage FJ. The great escape: tumour cell plasticity in resistance to targeted therapy. Nat Rev Drug Discov. 2020;19(1):39–56. [DOI] [PubMed] [Google Scholar]
- 56.Sutherland KD, Ireland AS, Oliver TG. Killing SCLC: insights into how to target a shapeshifting tumor. Genes Dev. 2022;36(5–6):241–58. [DOI] [PMC free article] [PubMed] [Google Scholar]
- 57.Thakur BL, Ray A, Redon CE, Aladjem MI. Preventing excess replication origin activation to ensure genome stability. Trends Genet. 2022;38(2):169–81. [DOI] [PMC free article] [PubMed] [Google Scholar]
- 58.Turner KM, Deshpande V, Beyter D, Koga T, Rusert J, Lee C, et al. Extrachromosomal oncogene amplification drives tumour evolution and genetic heterogeneity. Nature. 2017;543(7643):122-+. [DOI] [PMC free article] [PubMed] [Google Scholar]
- 59.Iwakawa R, Takenaka M, Kohno T, Shimada Y, Totoki Y, Shibata T, et al. Genome-wide identification of genes with amplification and/or fusion in small cell lung cancer. Genes Chromosomes Cancer. 2013;52(9):802–16. [DOI] [PMC free article] [PubMed] [Google Scholar]
- 60.Weischenfeldt J, Dubash T, Drainas AP, Mardin BR, Chen Y, Stutz AM, et al. Pan-cancer analysis of somatic copy-number alterations implicates IRS4 and IGF2 in enhancer hijacking. Nat Genet. 2017;49(1):65–74. [DOI] [PMC free article] [PubMed] [Google Scholar]
- 61.Spielmann M, Lupianez DG, Mundlos S. Structural variation in the 3D genome. Nat Rev Genet. 2018;19(7):453–67. [DOI] [PubMed] [Google Scholar]
- 62.Cho SW, Xu J, Sun R, Mumbach MR, Carter AC, Chen YG, et al. Promoter of lncRNA Gene PVT1 Is a Tumor-Suppressor DNA Boundary Element. Cell. 2018;173(6):1398–412 e22. [DOI] [PMC free article] [PubMed] [Google Scholar]
- 63.Jin X, Demere Z, Nair K, Ali A, Ferraro GB, Natoli T, et al. A metastasis map of human cancer cell lines. Cancer Res. 2021;81(13). [Google Scholar]
- 64.Takahashi N, Kim S, Schultz CW, Rajapakse VN, Zhang Y, Redon CE, et al. Replication stress defines distinct molecular subtypes across cancers. Cancer Res Commun. 2022;2(6):503–17. [DOI] [PMC free article] [PubMed] [Google Scholar]
- 65.Thomas A, Pommier Y. Small cell lung cancer: Time to revisit DNA-damaging chemotherapy. Sci Transl Med. 2016;8(346). [DOI] [PMC free article] [PubMed] [Google Scholar]
- 66.Wang Y, Wang M, Djekidel MN, Chen H, Liu D, Alt FW, et al. eccDNAs are apoptotic products with high innate immunostimulatory activity. Nature. 2021;599(7884):308–14. [DOI] [PMC free article] [PubMed] [Google Scholar]
- 67.Gardner EE, Lok BH, Schneeberger VE, Desmeules P, Miles LA, Arnold PK, et al. Chemosensitive Relapse in Small Cell Lung Cancer Proceeds through an EZH2-SLFN11 Axis. Cancer Cell. 2017;31(2):286–99. [DOI] [PMC free article] [PubMed] [Google Scholar]
- 68.Li H, Handsaker B, Wysoker A, Fennell T, Ruan J, Homer N, et al. The Sequence Alignment/Map format and SAMtools. Bioinformatics. 2009;25(16):2078–9. [DOI] [PMC free article] [PubMed] [Google Scholar]
- 69.Pongor LS, Gross JM, Vera Alvarez R, Murai J, Jang SM, Zhang H, et al. BAMscale: quantification of next-generation sequencing peaks and generation of scaled coverage tracks. Epigenetics Chromatin. 2020;13(1):21. [DOI] [PMC free article] [PubMed] [Google Scholar]
- 70.Lawrence M, Gentleman R, Carey V. rtracklayer: an R package for interfacing with genome browsers. Bioinformatics. 2009;25(14):1841–2. [DOI] [PMC free article] [PubMed] [Google Scholar]
- 71.Lawrence M, Huber W, Pages H, Aboyoun P, Carlson M, Gentleman R, et al. Software for computing and annotating genomic ranges. PLoS Comput Biol. 2013;9(8):e1003118. [DOI] [PMC free article] [PubMed] [Google Scholar]
- 72.Mumbach MR, Satpathy AT, Boyle EA, Dai C, Gowen BG, Cho SW, et al. Enhancer connectome in primary human cells identifies target genes of disease-associated DNA elements. Nat Genet. 2017;49(11):1602–12. [DOI] [PMC free article] [PubMed] [Google Scholar]
- 73.Servant N, Varoquaux N, Lajoie BR, Viara E, Chen CJ, Vert JP, et al. HiC-Pro: an optimized and flexible pipeline for Hi-C data processing. Genome Biol. 2015;16. [DOI] [PMC free article] [PubMed] [Google Scholar]
- 74.Durand NC, Robinson JT, Shamim MS, Machol I, Mesirov JP, Lander ES, et al. Juicebox Provides a Visualization System for Hi-C Contact Maps with Unlimited Zoom. Cell Syst. 2016;3(1):99–101. [DOI] [PMC free article] [PubMed] [Google Scholar]
- 75.Pozo K, Kollipara RK, Kelenis DP, Rodarte KE, Ullrich MS, Zhang XY, et al. ASCL1, NKX2-1, and PROX1 co-regulate subtype-specific genes in small-cell lung cancer. Iscience. 2021;24(9). [DOI] [PMC free article] [PubMed] [Google Scholar]
- 76.Bolger AM, Lohse M, Usadel B. Trimmomatic: a flexible trimmer for Illumina sequence data. Bioinformatics. 2014;30(15):2114–20. [DOI] [PMC free article] [PubMed] [Google Scholar]
- 77.Zhang Y, Liu T, Meyer CA, Eeckhoute J, Johnson DS, Bernstein BE, et al. Model-based Analysis of ChIP-Seq (MACS). Genome Biol. 2008;9(9). [DOI] [PMC free article] [PubMed] [Google Scholar]
- 78.Aryee MJ, Jaffe AE, Corrada-Bravo H, Ladd-Acosta C, Feinberg AP, Hansen KD, et al. Minfi: a flexible and comprehensive Bioconductor package for the analysis of Infinium DNA methylation microarrays. Bioinformatics. 2014;30(10):1363–9. [DOI] [PMC free article] [PubMed] [Google Scholar]
- 79.Krueger F, Andrews SR. Bismark: a flexible aligner and methylation caller for Bisulfite-Seq applications. Bioinformatics. 2011;27(11):1571–2. [DOI] [PMC free article] [PubMed] [Google Scholar]
- 80.Alvarez RV, Pongor LS, Marino-Ramirez L, Landsman D. TPMCalculator: one-step software to quantify mRNA abundance of genomic features. Bioinformatics. 2019;35(11):1960–2. [DOI] [PMC free article] [PubMed] [Google Scholar]
- 81.Love MI, Huber W, Anders S. Moderated estimation of fold change and dispersion for RNA-seq data with DESeq2. Genome Biol. 2014;15(12). [DOI] [PMC free article] [PubMed] [Google Scholar]
- 82.Gao JJ, Aksoy BA, Dogrusoz U, Dresdner G, Gross B, Sumer SO, et al. Integrative Analysis of Complex Cancer Genomics and Clinical Profiles Using the cBioPortal. Sci Signal. 2013;6(269). [DOI] [PMC free article] [PubMed] [Google Scholar]
- 83.Gu ZG, Eils R, Schlesner M. Complex heatmaps reveal patterns and correlations in multidimensional genomic data. Bioinformatics. 2016;32(18):2847–9. [DOI] [PubMed] [Google Scholar]
- 84.Hao YH, Hao S, Andersen-Nissen E, Mauck WM, Zheng SW, Butler A, et al. Integrated analysis of multimodal single-cell data. Cell. 2021;184(13):3573-+. [DOI] [PMC free article] [PubMed] [Google Scholar]
- 85.Sadeh R, Sharkia I, Fialkoff G, Rahat A, Gutin J, Chappleboim A, et al. ChIP-seq of plasma cell-free nucleosomes identifies gene expression programs of the cells of origin (vol 71, pg 515, 2021). Nat Biotechnol. 2021;39(5):642-. [DOI] [PubMed] [Google Scholar]
Associated Data
This section collects any data citations, data availability statements, or supplementary materials included in this article.
Supplementary Materials
Data Availability Statement
The sequencing data of H3K27ac HiChIP, scCNV and whole genome for previously characterized cell lines was deposited at GEO under accession number GSE206354 (H3K27ac HiChIP: GSE206351; scCNV: GSE206352; whole genome GSE206353). The long-read optical mapping data for previously characterized cell lines is available at the GenBank repository (NCI-H889: PRJNA849929; NCI-H524: PRJNA849955; NCI-H1092: PRJNA849961; NCI-H1963: PRJNA849963). The newly generated patient derived cell line H3K27ac HiChIP data, RNA-seq, genome sequencing data and long read optical mapping data, as well as patient-derived genome sequencing data is available at phs003190.v1.p1.