

Abstract
Glioblastoma (GBM) constitutes the most lethal primary brain tumor for which immunotherapy has provided limited benefit. The unique brain immune landscape is reflected in a complex tumor immune microenvironment (TIME) in GBM. Here, single cell sequencing of the GBM TIME revealed that microglia were under severe oxidative stress, which induced nuclear receptor subfamily 4 group A member 2 (NR4A2)-dependent transcriptional activity in microglia. Heterozygous Nr4a2 (Nr4a2+/−) or microglia-specific Nr4a2 (Nr4a2fl/flCx3cr1cre) genetic targeting reshaped microglia plasticity in vivo by reducing alternatively activated microglia and enhancing antigen presentation capacity for CD8+ T cells in GBM. In microglia, NR4A2 activated squalene monooxygenase (SQLE) to dysregulate cholesterol homeostasis. Pharmacological NR4A2 inhibition attenuated the pro-tumorigenic TIME, and targeting the NR4A2 or SQLE enhanced therapeutic efficacy of immune checkpoint blockade in vivo. Collectively, oxidative stress promotes tumor growth through NR4A2-SQLE activity in microglia, informing novel immune therapy paradigms in brain cancer.
Keywords: Glioblastoma, microglia, lipid metabolism, immune checkpoint blockade, NR4A2, SQLE, glioma
INTRODUCTION
Glioblastoma (GBM) constitutes one of the most lethal cancers (1,2). Despite multimodal treatment, the median survival time of GBM patients under 70 remains only 12 to 18 months (3). Although the molecular basis for gliomagenesis has been extensively investigated, targeted therapies have largely failed in clinical trials (4,5). Although immunotherapies have improved patient outcomes in other cancer types, numerous immune-oncology efforts – cell-based therapies, oncolytic viruses, immune checkpoint inhibition, etc. – have offered limited benefit against GBM in clinical trials (6–9). As the brain immune environment is unique and GBMs display low tumor mutational burden (10), modeling the specific regulation of immune responses in normal and neoplastic brain have been a high priority to design targeted therapies to improve GBM care through combinatorial paradigms (11).
Microglia are primary immune cells in the brain, uniquely derived from yolk sac hematopoietic stem cells during development (12), whereas systemically-derived macrophages serve both overlapping and complementary functions (13–15). In GBM, microglia and macrophages constitute the major non-tumor stromal cells and impact on tumor growth (16,17). Microglia enhance GBM growth, at least in part, by regulating mammalian target of rapamycin (mTOR)-mediated immunosuppression of the tumor microenvironment (18). Therefore, microglia have been proposed as a potential target for GBM immunotherapies (19–21).
Metabolic reprogramming of tumor and stromal cells is prevalent in many cancers (22,23). A key histologic criterion of GBM is necrosis, which is characterized by immune infiltration, hypoxia, and nutrient restriction. Single cell analyses have revealed glioma cells under environmental stress display epigenetic plasticity (24). The Tumor Immune Microenvironment (TIME) in many cancers reflects the effects of hypoxia, nutrient deprivation, and other stressors, suggesting crosstalk between tumor metabolism and immune responses through immunometabolic rewiring (25–27). Oxidative stress plays a critical role in a wide spectrum of cancers (28,29). For example, oxidative stress facilitates the transition of breast cancer stem cells from a ROSlow mesenchymal subtype to a ROShi epithelial state (30). Oxidative stress induces an immunosuppressive tumor milieu; e.g., tumor regulatory T cells (Treg cells) undergo apoptosis to impair spontaneous and PD-L1-blockade-mediated antitumor T cell immunity (31). Treg cell apoptosis derives from weak NF-E2–related factor 2 (NRF2)-associated antioxidant responses and high vulnerability to free oxygen species in the TIME. However, the value of targeting oxidative stress-induced TIME immunometabolic reprogramming as a potential Achilles’ heel for GBM, either as a monotherapy or combined with immune checkpoint blockade, remains unresolved. Here, we probed the immune landscape of gliomas to identify novel, targetable molecular mechanisms that could be interrogated as novel therapeutic approaches in the management of GBM.
RESULTS
Microglia endure oxidative stress in GBM and support tumor growth
Based on the hypothesis that the TIME landscape in GBM informs novel therapeutic targets, we interrogated a syngeneic murine glioma in vivo model to characterize the TIME using comparative single cell RNA sequencing (scRNA-seq) analysis between tumor-bearing and tumor-free brains (Figures 1A and 1B). Similar to previous reports (32), microglia constituted the majority of CD45+ cells in tumor-bearing brains (Figure 1C) and the cluster identified as microglia expressed microglial markers, including Tmem119, Cx3cr1, P2ry12, and Crybb1, at higher levels compared with other cell types (Supplemental Figure S1A) (33). Among the CD45+ cells, eight clusters of microglia with different functions were identified in glioma-bearing mice and control, respectively (Supplemental Figures S1B and S1C). We performed Venn diagram analysis to identify overlapping gene ontology (GO) terms among the differential gene expression of the microglia cluster in the single cell analysis of our GL261 scRNA-seq dataset as well as two glioma patient sample single cell analysis datasets (GSE117891 and GSE162631)(34,35) (Figure 1D). Nine GO terms overlapped among the three datasets, with “Response to oxidative stress” ranked topmost (Figure 1E). The upregulated expression of oxidative stress genes was more prominent in microglia compared with other immune cell types in the glioma microenvironment (Supplemental Figure S1D). Most microglia clusters in glioma-bearing mice displayed an elevated expression of an oxidative stress gene signature compared with controls (Figure 1F). In addition, re-analysis of public dataset GSE162631, which contains scRNA-seq analysis of freshly isolated cells in four GBM patients from the tumor core and paired surrounding peripheral tissues, showed that oxidative stress gene expression was elevated in the most microglia clusters of the tumor cores compared with that of tumor peripheral tissues (Supplemental Figures S1E and S1F). In addition, we isolated microglia from tumor tissues and surrounding healthy brain parenchyma in GL261-bearing mice and sent them for RNA sequencing analysis (Supplemental Figure S1G); oxidative stress gene expression was elevated in the microglia from tumor tissues compared with surrounding healthy brain parenchyma (Supplemental Figure S1H). These data suggested that tumor infiltrating microglia within gliomas endure oxidative stress.
Figure 1. The microglia population is under oxidative stress challenge and has oncogenic properties.
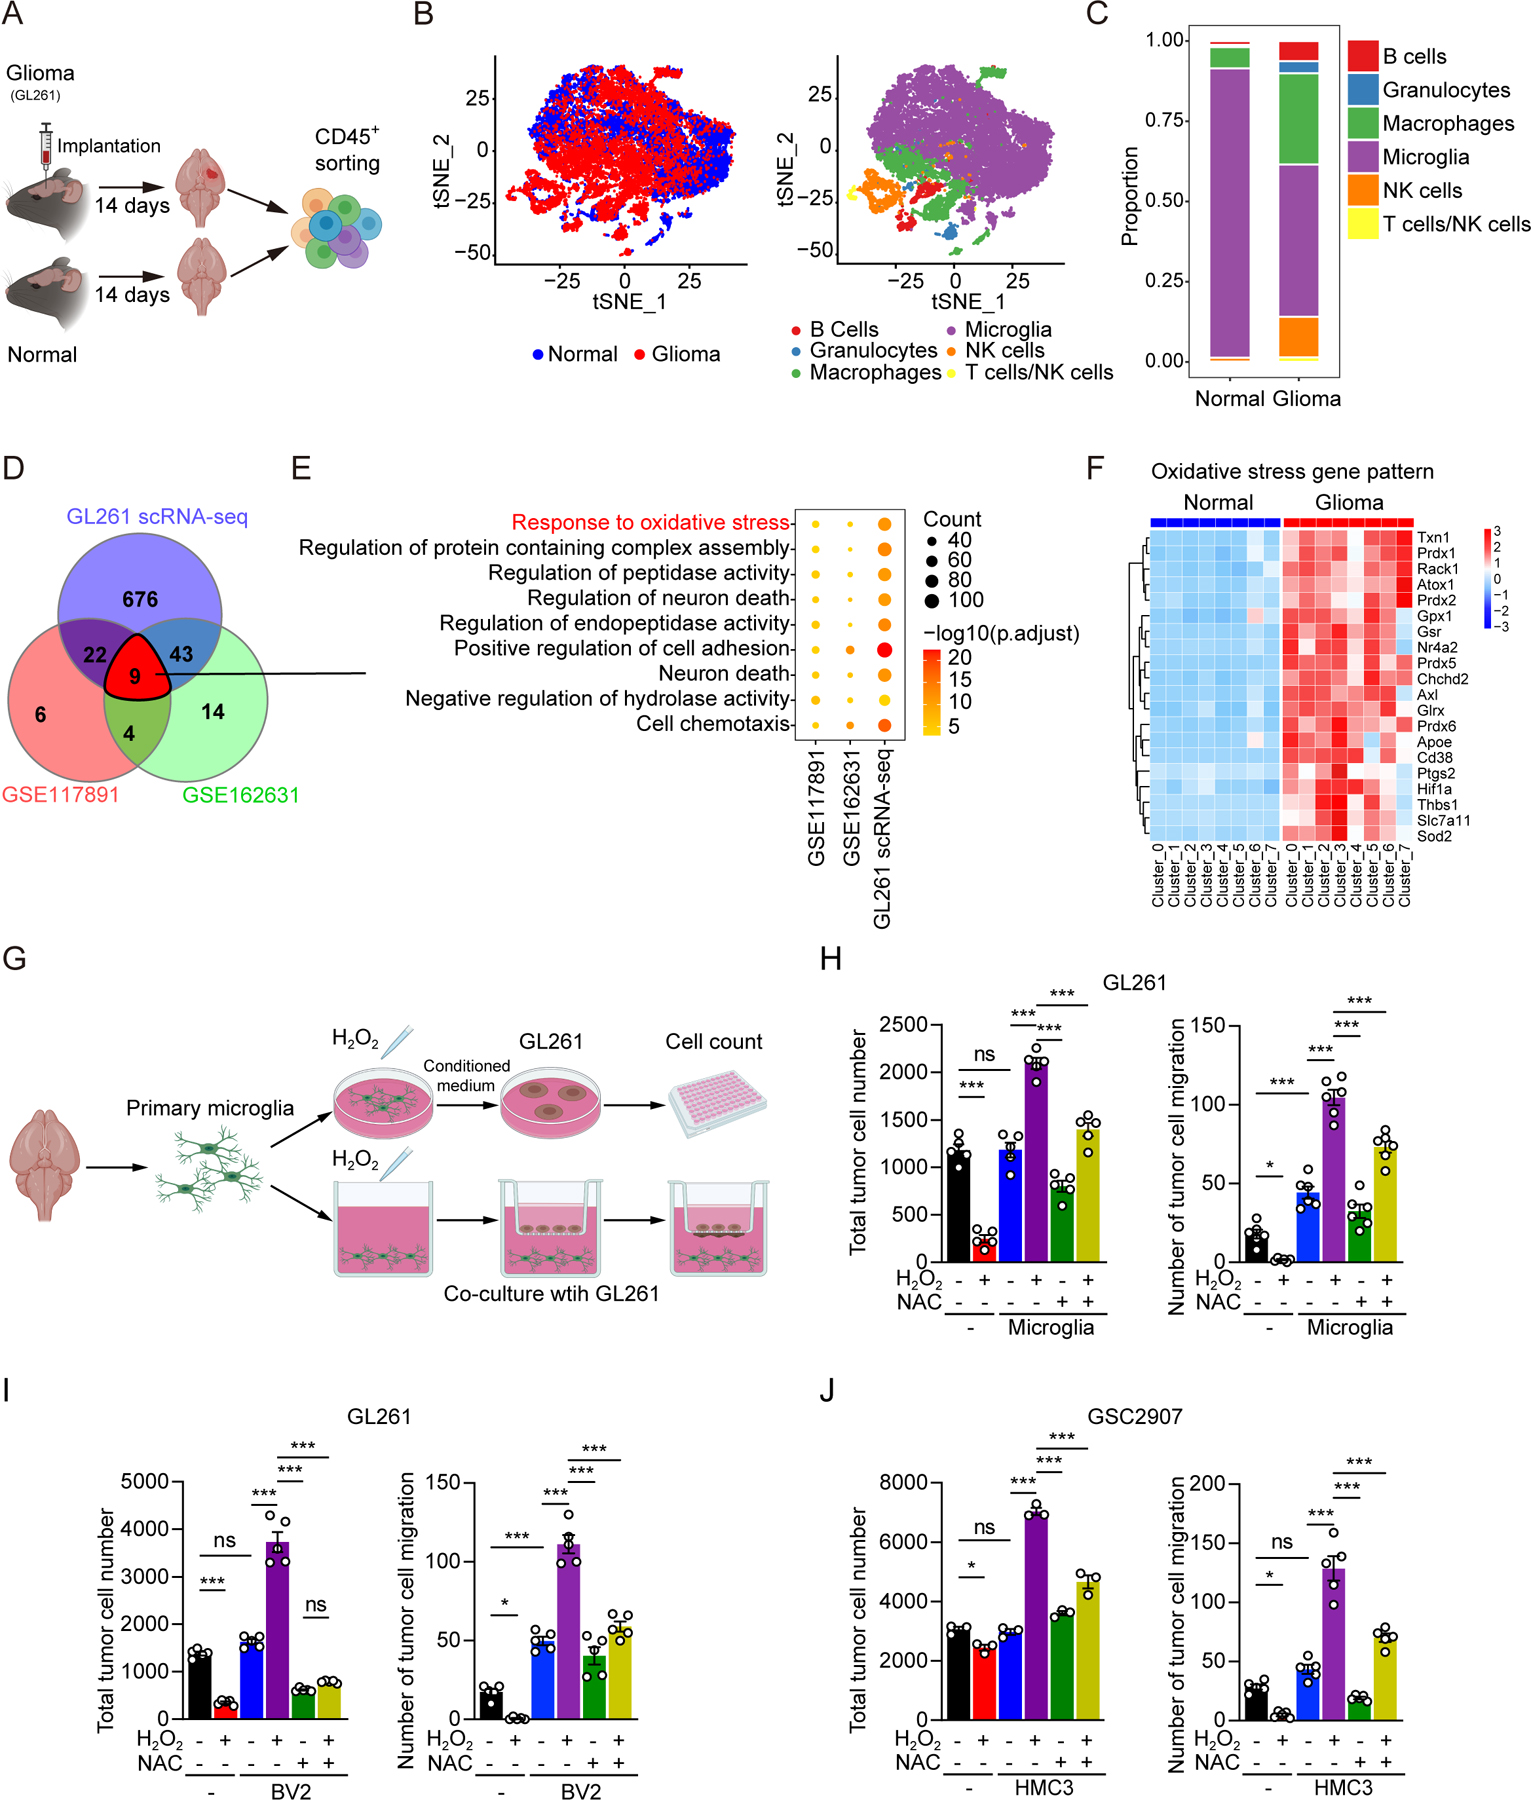
(A) A schematic model to describe the single cell RNA sequencing analysis of CD45+ cells isolated from tumor tissues of GL261 glioma-bearing mice and the cortex of control mice.
(B) t-SNE plots display and graph-based clustering of CD45+ cells from tumor tissue and normal brain (left). Clusters are further grouped by cell type (right).
(C) Relative cellular composition of CD45+ cells in tumor tissue and normal brain.
(D, E) Venn diagram showing the overlapping enriched GO terms of DEGs in microglia based on three glioma single cell RNA-seq datasets (GSE117891, GSE162631 and our GL261 scRNA-seq) (D). Nine enriched GO terms were shared in the three datasets (E).
(F) Heat map of DEGs from GO term ‘Response to oxidative stress’ per single cell cluster of microglia. Eight clusters from microglia in glioma tissue and normal brain respectively for visualization.
(G) A schematic model to evaluate the impact of microglia under different conditions on glioma cells. Effects of oxidative stress in microglia on cell proliferation and migration of glioma cells were examined in vitro. Primary microglia isolated from neonatal mice brain were treated with H2O2 (500 µM) in the absence or presence of NAC (5 mM) for 12 hours. Conditional medium from treated primary microglia was used to incubate with glioma cells (GL261) for 24 hours or GSC2907 for 48hours. Cell proliferation and migration of glioma cells were assessed by cell counts and transwell assays, respectively. CM, conditional medium. NAC, N-Acetyl-L-cysteine, antioxidant.
(H-J) Quantification of cell proliferation and migration of glioma cells (GL261) treated by conditional medium from primary microglia (H) or BV2 cells (I) in respective group. (J) Quantification of cell proliferation and migration of patient-derived glioma stem cells (GSC2907) treated by conditional medium from human microglia cell line (HMC3).
Data are shown as mean ± SEM. In (H), (I) and (J), P value was calculated using one-way ANOVA analysis. *p < 0.05, **p < 0.01, ***p < 0.001.
As oxidative stress has been associated with induction of oncogenic effects in multiple cancer types (36–38), we interrogated the functional impact of oxidative stress on the function of microglia. We isolated primary microglia from the cerebral cortices of neonatal C57BL/6 mice, treated them with hydrogen peroxide (H2O2) to induce oxidative stress, then measured their effects on tumor cell growth in co-culture experiments (Figure 1G). H2O2-treated primary murine microglia enhanced tumor cell proliferation and migration compared with control cells (Figure 1H), which was attenuated by co-administration of N-Acetyl-L-cysteine (NAC), a potent antioxidant. In validation experiments, H2O2 treatment enhanced oncogenic effects of murine BV2 microglia co-cultured with murine GL261 glioma cells (Figure 1I) and human HMC3 microglia cells co-cultured with patient-derived GSC2907 human GBM cells (Figure 1J), as measured by cell proliferation and migration compared with the control groups. These effects were impaired by co-administration with NAC (Figures 1I and 1J). Similar results were also observed in the functions of primary microglia from the cerebral cortices of adult C57BL/6 mice (Supplemental Figure S1I). Moreover, we co-cultured GL261 cells with microglia isolated from either control brains or GL261-bearing brains and found that similar to glioma growth-promoting functions of H2O2-treated microglia in vitro, microglia derived from GL261-bearing brains enhanced GL261 growth compared with that from normal brains (Supplemental Figure S1J). However, other myeloid cells resident in the central nervous system, such as neutrophils, did not show growth-promoting effects for glioma, even after oxidative stress challenge (Supplemental Figure S1K). Collectively, our results support that oxidative stress reprograms microglia towards an alternatively activated state, which promotes the proliferation and aggressiveness of glioma cells.
Microglia are associated with an immunosuppressive milieu in glioma
To investigate the impact of oxidative stress on microglial function in vivo, primary microglia were treated with H2O2, then co-implanted with murine glioma cells that had been stably transfected with a firefly luciferase reporter gene (GL261-luc or CT2A-luc cells) into syngeneic hosts (Figure 2A). The elevated ROS levels of microglia lasted for at least 13 days after co-implantation with murine glioma cells in vivo (Supplemental Figures S2A and S2B). The apoptosis-inducing effects of H2O2 treatment on microglia were minimal (Supplemental Figure S2C), suggesting that peroxide stress altered tumor growth through cell-cell interactions. H2O2-pretreated primary microglia cells induced more rapid tumor growth than either tumor cells implanted alone or tumor cells together with untreated primary microglia cells in vivo (Figures 2B and 2C). In parallel to in vitro results, NAC treatment reversed the glioma growth-promoting effects of H2O2-pretreated primary microglia (Figures 2B and 2C). Differences in tumor size reflected differential survival times of tumor-bearing mice; mice bearing glioma cells together with H2O2-pretreated primary microglia had the shortest survival compared with mice bearing tumor cells alone or with untreated primary microglia cells (Figure 2D). NAC treatment selectively attenuated the survival effects of H2O2-pretreated primary microglia (Figure 2D). CT2A murine glioma cells displayed similar results to GL261 cells (Figures 2E–G), suggesting that these results were not model specific.
Figure 2. Microglia in the TIME of GBM is associated with an immunosuppressive milieu.

(A) A schematic model to describe intracranial glioma xenograft establishment. Primary microglia were pretreated by H2O2 (500 µM) in the absence or presence of NAC (5 mM) for 12 hours. Glioma cells (GL261-luc, 2×10⁵ cells; CT2A-luc, 2×10⁴ cells) incubated with conditional medium of pretreated primary microglia cells for 12 hours. Treated glioma cells and treated primary microglia (1:1) were inoculated together into the frontal region of cerebral cortex. In vivo bioluminescence-based imaging was conducted on day 10–14 after orthotopic injection.
(B) Representative in vivo bioluminescence-based images and Hematoxylin and Eosin (H&E) staining of GL261-luc glioma-bearing C57BL/6J mice in respective group. Scale bars, 2 mm.
(C) Quantification of tumor volume based on bioluminescence in respective group (n=5 per group).
(D) Survival curves of C57BL/6J mice implanted with GL261-luc in five groups (n=5 per group).
(E, F) Representative in vivo bioluminescence-based images (E) of CT2A-luc glioma-bearing C57BL/6J mice and quantification (F) of tumor volume based on bioluminescence (n≥4 per group).
(G) Survival curves of C57BL/6J mice implanted with CT2A-luc in five groups (n=6 per group).
(H) A schematic model to describe establishment of intracranial tumor xenograft followed by flow cytometry analysis for tumor infiltrating T cells on day 14 after orthotopic injection.
(I-K) Flow cytometry analysis to evaluate the abundance of infiltrated CD8+ T cells and CD4+ T cells of glioma in respective groups (I). Quantification of CD8+ T cells (J) and CD4+ T cells (K) in CD45+ T cells (n=3 per group).
(L-N) Flow cytometry analysis to evaluate the expression of PD1 in CD8+ T cells with respective treatment (L). Quantification of PD1 (M) and IFN-γ (N) levels in CD8+ T cells (n=3 per group).
(O-P) Flow cytometry analysis to evaluate the abundance of infiltrated CD8+ T cells and CD4+ T cells levels (O), PD1 and IFN-γ (P) levels in CD8+ T cells of CT2A-luc glioma in respective groups (n=3 per group).
Data are shown as mean ± SEM. In (D) and (G), survival difference was calculated by log-rank test; in (C), (F), (J), (K), (M), (N), (O) and (P), P value was calculated using one-way ANOVA analysis. *p < 0.05, **p < 0.01, ***p < 0.001.
We hypothesized that oxidative stress induced microglia to reprogram the TIME, specifically tumor-infiltrating T cells. We examined the functional states of T cell subsets in the context of oxidative stress-challenged primary microglia in vivo (Figure 2H). Tumors grown in mice co-implanted with H2O2-treated primary microglia and GL261-luc cells displayed reduced numbers of CD8+ T cells and increased numbers of CD4+ T cells (but not Treg cells) compared with tumors from mice co-implanted with control primary microglia and GL261-luc cells (Figures 2I–K and Supplemental Figure S2D). Co-treatment with NAC blocked the changes in T cell numbers, supporting an on-target effect of oxidative stress (Figures 2I–K). H2O2-treated primary microglia increased expression of the immune checkpoint marker, programmed cell death protein 1 (PD1) on CD8+ T cells in tumor-bearing mice compared with mice co-implanted with tumor cells and control microglia, which was inhibited by co-treatment with NAC (Figures 2L and 2M). Interferon gamma (IFNγ) was also reduced on CD8+ T cells in the mice bearing tumor cells co-implanted with H2O2-treated primary microglia compared with mice bearing tumor cells and control microglia, which could be reversed by co-treatment with NAC (Figure 2N). In CT2A in vivo allografts, tumors grown in mice co-implanted with H2O2-treated primary microglia and CT2A-luc cells displayed reduced numbers of CD8+ T cells and nonsignificant changes of CD4+ T cells compared with tumors from mice co-implanted with control primary microglia and CT2A-luc cells (Figure 2O). Co-treatment with NAC blocked the changes in CD8+ T cell numbers (Figure 2O). H2O2-treated primary microglia increased expression of PD1 on CD8+ T cells in tumor-bearing mice compared with mice co-implanted with tumor cells and control microglia, which was inhibited by co-treatment with NAC (Figure 2P). IFNγ was reduced in CD8+ T cells in the mice bearing tumor cells co-implanted with H2O2-treated primary microglia compared with mice bearing tumor cells and control microglia, which could be rescued by co-treatment with NAC (Figure 2P). These results demonstrate that oxidative stress-mediated immune reprogramming of the brain TIME favors tumor growth.
Oxidatively stressed microglia assume an alternatively activated state with impaired antigen presentation of CD8+ T cells
Based on the effects of oxidative stress on the TIME, we hypothesized that antigen presentation is influenced by oxidative stress. Therefore, we generated a glioma line transfected with ovalbumin gene (GL261-OVA) to model specific in vivo antigen presentation in OT-I (C57BL/6-Tg(TcraTcrb)1100Mjb/J) mice, which results in MHC class I-restricted, ovalbumin-specific, CD8+ T cell responses (Figure 3A). Primary microglia induced proliferation of CD8+ T cells in vitro, confirming antigen presentation functions of oxidative-stress-challenged microglia (Figure 3B). However, H2O2 treatment impaired antigen presentation by microglia, which was partially rescued by NAC treatment (Figure 3B). Secretion of IFNγ and tumor necrosis factor alpha (TNFα) by CD8+ T cells in OT-I mice was reduced in co-cultured H2O2-pretreated primary microglia and GL261-OVA compared with co-cultured untreated primary microglia and GL261-OVA (Figure 3C). These effects were reduced by NAC co-treatment (Figure 3C).
Figure 3. Microglia are alternatively activated and their antigen-presenting capacities for CD8+ T cells were decreased.
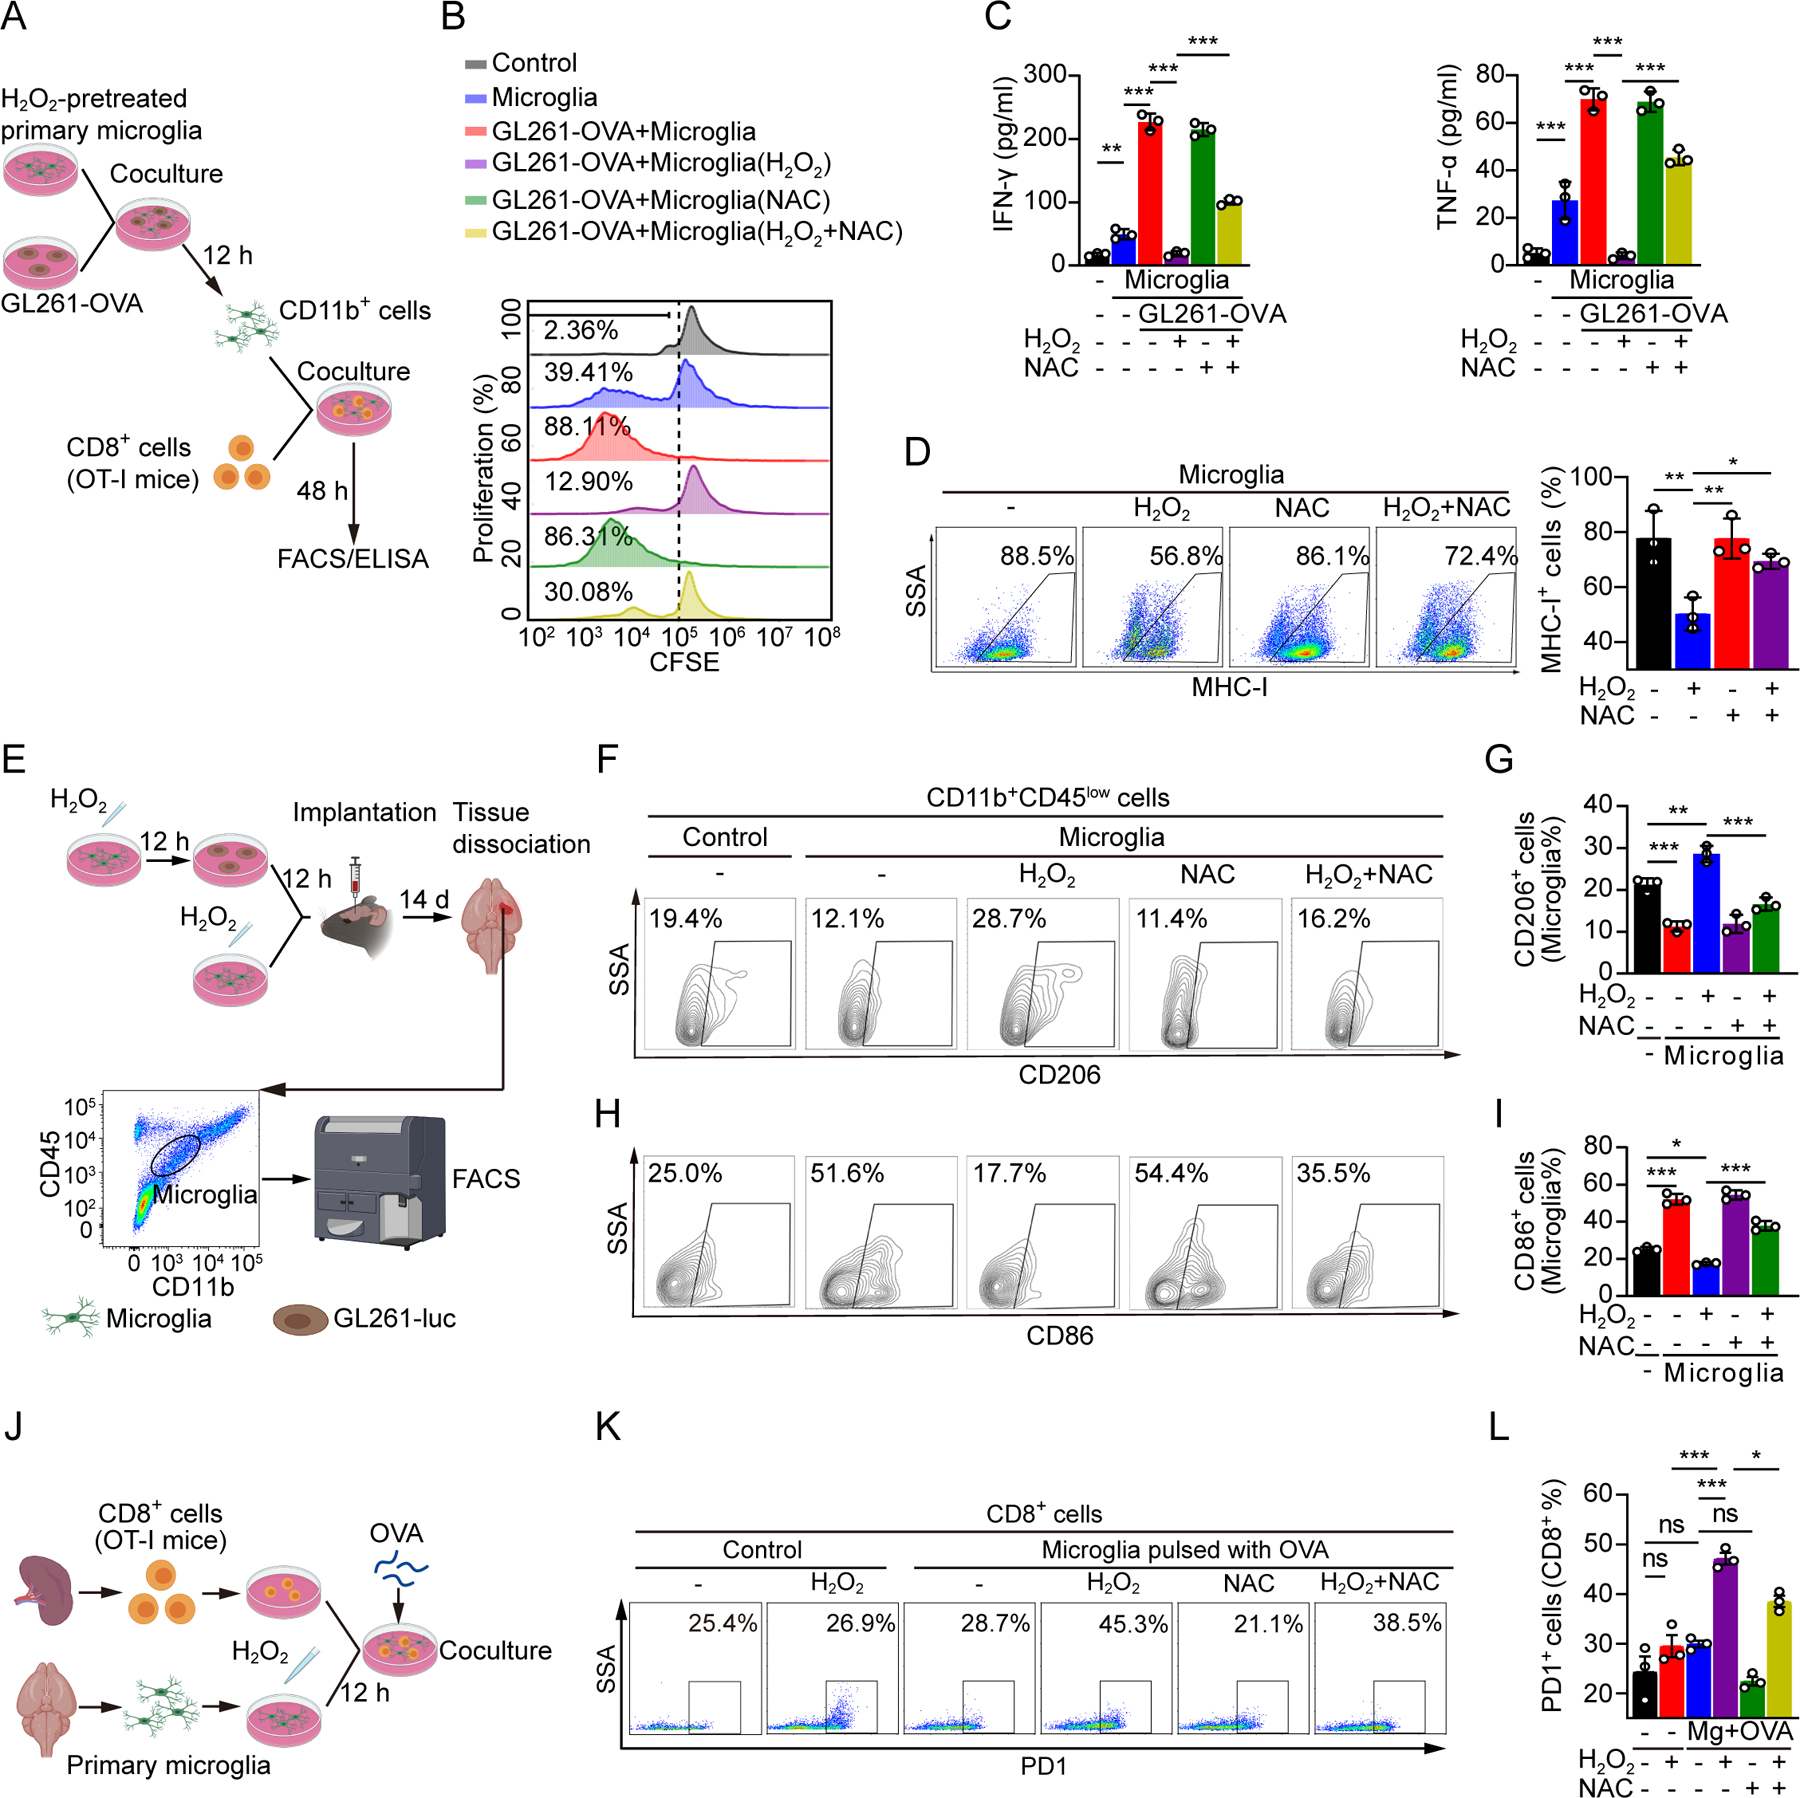
(A) A schematic model to describe antigen presentation experiment. Primary microglia were treated by H2O2 (500 µM) in the absence or presence of NAC (5 mM) for 12 hours. Treated microglia was cultured with GL261-OVA cells (1:1) for 12 hours. Microglia purified by microbeads were co-cultured with CD8+ T cells (1:10) of OT-I mice for 48 hours.
(B, C) Flow cytometry plot to evaluate T cell proliferation (B). IFN-γ and TNF-α were enumerated by ELISA. Statistical data are shown (C).
(D) Flow cytometry analysis of MHC-I expression in primary microglia treated with H2O2 (500 µM) in the absence or presence of NAC (5 mM) for 12 hours. Statistical data are shown (n=3 per group).
(E) A schematic model to describe flow cytometry analysis of microglia from glioma tissue. Treated glioma cells and treated primary microglia (2×10⁵ cells, 1:1) were inoculated together into the frontal region of cerebral cortex. Flow cytometry analysis was conducted on day 14 after orthotopic injection. CD11b+CD45low cells were identified as microglia.
(F-I) Flow cytometry analysis of CD206 (F) and CD86 (H) in microglia (CD11b+CD45low) of tumor tissue from glioma-bearing mice. Proportions of CD206+ cells (G) and CD86+ cells (I) in microglia were shown.
(J) A schematic model that assess the impact of microglial oxidative stress on PD1 expression in CD8+ T cells in vitro. Primary microglia were treated by H2O2 (500 µM) in the absence or presence of NAC (5 mM) for 12 hours. CD8+ T cells from OT-I mice were cocultured with pre-treated microglia (10:1) pulsed with OVA peptide for 24 hours.
(K, L) Flow cytometry plot (K) and quantification (L) of PD1 expression in CD8+ T cells with respective treatment (n=3 per group).
Data are shown as mean ± SEM. In (C), (D), (G), (I) and (L), P value was calculated using one-way ANOVA analysis. *p < 0.05, **p < 0.01, ***p < 0.001.
We next investigated the biological functions of microglia in the TIME under oxidative stress. Oxidative stress reduced the expression of major histocompatibility complex I (MHC-I) in primary murine microglia, which was rescued after co-treatment with NAC (Figure 3D). To identify the cellular mechanisms through which these effects were mediated, we analyzed the effects of oxidative stress on the expression of markers for classically activated microglia (CD86) and alternatively activated microglia (CD206) in primary microglia derived from GL261-luc-tumor bearing brains (Figure 3E). Oxidative stress increased CD206 expression (Figures 3F and 3G), whereas CD86 expression was reduced (Figures 3H and 3I). These effects could be rescued by co-treatment with NAC (Figures 3F–I). Similar results were also observed in CT2A-luc-tumor bearing mice (Supplemental Figures S2E and S2F).
We next examined the expression of several myeloid-related functional genes in microglia. In murine BV2 microglia and human HMC3 microglia, oxidative stress downregulated expression of NOS2 and IL6 (markers of classical activation of myeloid cells) and upregulated expression of ARG-1 and IL10 (markers of alternative activation of myeloid cells), which was rescued by co-treatment with NAC (Supplemental Figures S2G and S2H). Next, we isolated primary microglia from normal murine brains and assessed the impact of oxidative stress on microglia plasticity (Supplemental Figure S2I). Similar to the results from GL261-luc-bearing mice, oxidative stress induced the expression of CD206 in primary microglia (Supplemental Figure S2J). Expression analysis revealed that oxidative stress decreased mRNA levels of immune-activation-related genes, including TNFα, IFNγ, and IL1β, and increased expression of immune-suppression-related genes, including IL10, CXCL1, CXCL5, CXCL12, CX3CL1, and CCL22, in primary murine microglia (Supplemental Figure S2K). Comparative RNA sequencing (RNA-seq) of control and H2O2-treated BV2 microglia as well as control and H2O2-treated primary microglia isolated from glioma bearing mice revealed that oxidative stress induced a specific transcriptional pattern related with either immunoactivation or immunosuppression (Supplemental Figure S2L). Oxidative stress induced biological processes that included angiogenesis, reactive oxygen species metabolic process, and response to transforming growth factor-β, as well as immune activation-related processes, such as positive regulation of leukocyte proliferation, positive regulation of lymphocyte activation, and cellular response to TNF (Supplemental Figure S2M). However, oxidative stress primarily induced upregulation of immune-activation-related genes, including Nos2, IFNγ, and IL1β, and downregulation of immune-suppression-related genes, including Arg1, TGFβ1, CXCL1, CXCL5, and CX3CL1 in neutrophils (Supplemental Figure S2N).
These findings led us to explore the impacts of oxidative stress-challenged microglia on T cells in the brain by co-culturing CD8+ T cells with microglia in the presence of OVA antigen ex vivo (Figure 3J), which increased PD1 expression with microglia that were pretreated with H2O2 compared to control conditions, and this increase was blocked by NAC co-treatment (Figures 3K and 3L). Thus, oxidative stress induces microglia towards an alternatively activated state and disrupts their antigen presentation functions for CD8+ T cells.
Integrated analysis identifies NR4A2 as a nuclear-localized transcription factor in oxidative-stress microglia
To identify key regulators in the phenotypic switch of oxidative stress-challenged microglia in GBM, we performed chromatin immunoprecipitation enrichment analysis master regulator discovery (39) to identify potential transcription factors mediating transcriptional alterations in microglia. A systems network biology approach was used to construct the transcription factor-based regulatory network, which identified 15 transcription factors potentially causal in the transcriptome-wide alterations in oxidative stress-challenged microglia (Figure 4A). We prioritized nuclear receptors, as they are more amenable to therapeutic targeting. Among the 15 transcription factor candidates, only two were nuclear receptors, hepatocyte nuclear factor 4α (HNF4α) and NR4A2 (Figure 4B). Validation with quantitative PCR (qPCR) supported only Nr4a2 as upregulated in microglia upon oxidative stress treatment (Figure 4C), with NAC co-treatment downregulating Nr4a2 levels (Supplemental Figure S3A). We next checked the expression changes of Nr4a2 in our RNA sequencing data of both BV2 cell line and primary microglia. Nr4a2 expression was increased after H2O2 challenge in BV2 compared with control (Figure 4D) and similarly, Nr4a2 expression was also increased in primary microglia isolated from mouse glioma samples compared with that from surrounding healthy parenchyma (Figure 4E). Interrogation of in silico sc-RNA seq analysis of human patient GBM surgical specimens (GSE84465) (40) revealed that a population of myeloid cells displayed high expression of Nr4a2 (Figure 4F). Further re-analysis of both our GL261 single cell RNA sequencing analysis data and GSE162631 human glioma single cell RNA sequencing analysis data (35) demonstrated that Nr4a2 expression was up-regulated in the microglia of tumor samples compared with control brain (Figures 4G and 4H). We next examined the expression of NR4A2 in the microglia of clinical samples and found that the abundance of NR4A2+ microglia was higher in GBM (grade 4 glioma) patient tumor tissues compared with that in nonneoplastic brain and grade 1–3 glioma patient tumor tissues (Supplemental Figures S3B and S3C). These data led us to further characterize the functional roles of NR4A2 in microglia response to oxidative stress.
Figure 4. Systems biology analysis identifies NR4A2 as the master regulator for immunosuppressive functions of oxidative stress-challenged microglia.

(A) The correlation with the up-regulated DEGs of BV2 cells after H2O2 treatment (500 µM, 12h) was established using ChIP-seq enrichment using the TRANSFAC and JASPAR databases in Enrichr, covering 15 transcription factors (TFs) and their possible targets. Among them two TFs were druggable (red). Predicted genes regulated by the TFs were shown according to their differential expression after H2O2 treatment.
(B) Statistical significance of overrepresentation of a TF’s regulon for up-regulated genes vs. statistical significance of predicted DEG targets regulated by TF. The size and color of each dot represented fold change of TF and druggable/undruggable, respectively.
(C) Expression levels of two druggable TFs, Nr4a2 and Hnf4α, in primary microglia treated with H2O2 (500 µM) (n=3 per group).
(D-E) FPKM expression values for NR4A2 in BV2 after H2O2 treatment and control (D). FPKM expression values for NR4A2 in primary microglia from surrounding healthy parenchyma and tumor of glioma bearing C57BL/6J mice (E).
(F-H) t-SNE plots showing distribution of Nr4a2 by single cell RNA sequencing in published GBM datasets (GSE84465 (F) and GSE 162631 (H)) and our GL261 scRNA seq in this study(G).
(I-J) Immunofluorescence staining for NR4A2 on primary microglia cultured on glass coverslips. Scale bars, 20 μm (I). Quantification of marker-positive cell fractions (J).
(K) Western blotting analysis of NR4A2 protein levels in the nucleus, the cytoplasm and total cell lysates of microglia treated with H2O2 (500 μM) in the absence or presence of NAC (5 mM) for 24 hours (n=3 per group).
(L) Correlation between percentage of NR4A2+ IBA1+ microglia and 8-OHdG+ IBA1+ microglia (Left) or number of CD8+ T cells and NR4A2+ IBA1+ microglia in each vision field of glioma patient brain sections (n≥30 vision fields).
(M) Primary microglia were transfected by siNr4a2 for 48 hours. Nr4a2-knockdown microglia treated with H2O2 (500 µM) in the absence or presence of NAC (5 mM) for 12 hours. Flow cytometry plot to evaluate the expression of PD1 in CD8+ T cells cocultured with treated Nr4a2-knockdown microglia pulsed with OVA peptide (above). Flow cytometry plot of MHC-I expression in treated Nr4a2-knockdown microglia (below).
(N-P) Effects of Nr4a2 knockdown on the antigen presentation capacities of microglia for CD8+ T cells. Primary microglia transfected with siNr4a2 for 48 hours was treated with H2O2 (500 µM) in the absence or presence of NAC (5 mM) for 12 hours. Treated microglia was cultured with GL261-OVA cells (1:1) for 12 hours. Microglia purified by microbeads were co-cultured with CD8+ T cells (1:10) of OT-I mice for 48 hours. Flow cytometry plot to evaluate T cell proliferation (N). IFN-γ (O) and TNF-α (P) were measured by ELISA.
(Q) mRNA levels of Nr4a2 in primary microglia treated with Bay-11-7082 compared with control cells with or without H2O2 challenge.
(R) Representative in vivo bioluminescence-based images and H&E staining of GL261-luc-bearing C57BL/6J mice treated by Bay-11-7082 and control. Bay-11-7082 was given intraperitoneally at a dose of 25 mg/kg per mouse every 2 days on day 3 after tumor inoculation. Scale bars, 2 mm.
(S) Survival curves of C57BL/6J mice implanted with GL261-luc (2×10⁴ cells) in each treatment group (n=6 per group).
In (L), coefficient of determination (r) and statistical significance levels were determined by linear regression with linear model method. Data are shown as mean ± SEM. In (C-E), P value was calculated using the two-tailed Student’s t test. In (J), (O), (P) and (Q), P value was calculated using one-way ANOVA analysis. In (S), survival difference was calculated by log-rank test. *p < 0.05, **p < 0.01, ***p < 0.001.
As the subcellular localization of nuclear receptors is stimulus-responsive, we examined the effects of oxidative stress on the subcellular localization of NR4A2 in microglia. In primary murine microglia, H2O2 treatment induced upregulation of NR4A2 expression and nuclear translocation of NR4A2, while NAC treatment blocked these effects (Figures 4I and 4J). These results were validated in murine BV2 and human HMC3 microglia (Supplemental Figures S3D–F). Quantification of subcellular NR4A2 protein levels in microglia by immunoblot analysis revealed that H2O2 treatment increased total NR4A2, whereas NAC co-treatment downregulated NR4A2 levels (Figure 4K and Supplemental Figure S3G), primarily due to an increase in nuclear NR4A2, which was blocked by co-treatment with NAC, whereas cytoplasmic NR4A2 levels did not substantially vary between treatment groups (Figure 4K and Supplemental Figure S3G). These data suggest that oxidative stress induces NR4A2 nuclear entry in oxidative-stress microglia.
NR4A2 regulates the phenotypic plasticity of microglia in glioma
To determine the functional importance of NR4A2 in oxidatively-stressed microglia, we quantified NR4A2+ Iba1+ cells in surgical biopsies from a cohort of grade I-IV glioma patient specimens, revealing a positive correlation with the abundance of 8-hydroxy-2’-deoxyguanosine (8-OHdG)+ Iba1+ cells (8-OHdG is a specific marker to measure oxidative stress levels), which marks microglia with high oxidative levels (r = 0.648, P <0.001) (Figure 4L). In contrast, the abundance of CD8+ T cells negatively correlated with the abundance of Nr4a2+ Iba1+ cells in both IDH wild type and mutant patients (r = −0.2834, P = 0.01) (Figure 4L). Therefore, we co-cultured murine CD8+ T cells with primary murine microglia under different conditions. OT-I mice CD8+ T cells co-cultured with H2O2-treated primary murine microglia pulsed with OVA displayed increased PD1 expression, which could be reversed when co-cultured with primary microglia with NR4A2 knockdown (Figure 4M and Supplemental Figures S3H and S3I). Concordantly, H2O2 treatment reduced MHC-I expression on primary murine microglia, which could be rescued by knockdown of NR4A2 in microglia (Figure 4M and Supplemental Figure S3J). We next co-cultured GL261-OVA cells with primary murine microglia under different conditions and then isolated primary microglia using magnetic beads. Isolated primary microglia were co-cultured with OT-I mice CD8+ T cells. Proliferation of CD8+ T cells was measured by carboxyfluorescein succinimidyl amino ester (CFSE) staining, which fluorescently labels live cells intracellularly. With H2O2-treated primary microglia, CD8+ T cell proliferation was reduced, with effects reversed by knockdown of NR4A2 in microglia (Figure 4N and Supplemental Figure S3K). OT-I mice CD8+ T cells co-cultured with H2O2-treated primary microglia displayed reduced secretion of both IFNγ (Figure 4O) and TNFα (Figure 4P), which was blocked by NR4A2 knockdown in microglia. We explored the potential mechanisms of increased expression of PD1 in CD8+ T cells after co-cultured with H2O2-treated primary microglia. As previous reports have showed that IL10 could enhance expression of PD1 in CD8+ T cells (41), we considered whether the impact of H2O2-treated primary microglia on PD1 expression in CD8+ T cells was also mediated by IL10. Blockade of IL10 using a neutralization antibody decreased H2O2-treated primary microglia induction of PD1 expression in CD8+ T cells (Supplemental Figure S3L). Moreover, while conditioned media from H2O2-treated microglia promoted cell proliferation and migration of GL261 tumor cells, NR4A2 knockdown in H2O2-treated microglia blocked these effects (Supplemental Figures S3M and S3N). NR4A2 knockdown also decreased the expression of CD206 in H2O2-treated microglia, and increased the expression of CD86 in H2O2-treated microglia (Supplemental Figure S3O).
Based on the goal to translate our findings into potential therapeutic paradigms with clinical significance, we leveraged a pharmacologic NR4A2 inhibitor, Bay-11-7082 (42). In murine GL261 allografts, we examined the mRNA expression of NR4A2 in microglia and other cell types and found that microglial NR4A2 mRNA level was higher compared with other cell types (Supplemental Figure S3P). We hypothesized that pharmacologic targeting of NR4A2 primarily alters the antigen presentation functions of microglia in GBM. Bay-11-7082 treatment decreased Nr4a2 mRNA levels in H2O2-challenged primary microglia, but did not alter Nr4a2 mRNA levels in untreated primary microglia (Figure 4Q). Bay-11-7082 administration reduced the growth of GL261-luc-derived tumors in vivo, as measured by both luciferase imaging of tumor-bearing mice and histologic staining (Figure 4R and Supplemental Figure S3Q). The effects of Bay-11-7082 treatment on tumor size translated into prolonged survival of GL261-luc-bearing mice (p = 0.001, Figure 4S). In tumors derived from the Bay-11-7082 treatment group, CD206+ microglia were reduced in frequency compared with tumors treated with vehicle control, whereas the abundance of MHC-I+ microglia and CD8+ T cells was increased, as measured by flow cytometry (Supplemental Figures S3R and S3S). Bay-11-7082 treatment increased the expression of effector molecules, including TNFα, IFNγ, and granzyme B on CD8+ T cells and decreased expression of immune checkpoint molecules, including PD1 and TIM3 on CD8+ T cells (Supplemental Figure S3T). To address NR4A2 function in tumor cells, rather than immune cells, we knocked down NR4A2 in CT2A cells, but did not find changes in tumor growth and tumor-bearing mouse overall survival in vivo (Supplemental Figures S3U–X), suggesting a specific role of NR4A2 in the TIME. Collectively, NR4A2 pharmacologic inhibition blocks oxidative stress impairment of antigen presentation and mediates phenotypic switch of microglia towards alterative activation, manifesting as reduced tumor growth.
NR4A2-mediated transcriptional machinery induces altered cholesterol metabolism in microglia
As NR4A2 is an orphan nuclear receptor superfamily and a transcription factor, we performed chromatin immunoprecipitation followed by deep sequencing (ChIP-seq) to identify its target DNA elements. Among the peaks identified, the top genes identified included serine protease inhibitor A3N (Serpina3n), WAP, Kazal, immunoglobulin, Kunitz and NTR domain-containing protein 1 (Wfikkn1), protein SFI1 homolog (Sfi1), dynamin-3 (Dnm3), Dixin (Dixdc1), squalene monooxygenase (Sqle), high mobility group protein HMG-I/HMG-Y (Hmga1), and T-cell activation GTPase-activating protein 1 (Tagap1) (Figure 5A). GO enrichment analysis revealed that genes transcriptionally regulated by NR4A2 were primarily involved in glycosylation, phosphorylation, cell motility, kinase signaling, and gene transcription (Figure 5B). Comparative RNA-seq of Nr4a2-knockdown and control microglia was used to construct a Venn diagram to identify overlapping genes that met the three criteria: 1) genes on whose promoter regions bound NR4A2 identified by ChIP-seq; 2) genes upregulated in microglia under oxidative stress identified by RNA-seq; and 3) genes downregulated in microglia after NR4A2 knockdown identified by RNA-seq. Only three genes overlapped satisfying the criteria: Sqle, Tagap1, and Hmga1 (Figure 5C). We examined which of these genes were bona fide downstream targets transcriptionally regulated by NR4A2 in microglia. NR4A2 knockdown reduced mRNA levels of both Nr4a2 and Sqle in primary microglia, but did not cause substantial change in the mRNA levels of Hmga1 or Tagap1 (Figure 5D). Aligned with the reported functions of SQLE (43), NR4A2 knockdown in microglia downregulated expression of genes primarily involved in lipid metabolism (Supplemental Figure S4A) and upregulated expression of genes involved in MHC-I complex and antigen presentation (Supplemental Figure S4B).
Figure 5. NR4A2 transcriptionally regulates downstream cholesterol metabolic alterations in microglia of GBM.

(A) Hockey stick plot showing potential target genes regulated by Nr4a2 in microglia ranked by “microglia specificity score,” which depended on number of gained Nr4a2 peaks in microglia compared to input and the fold change mRNA difference of down-regulated genes in Nr4a2 knockdown microglia.
(B) Pathway enrichment bubble plot shows gene sets enriched among potential target genes regulated by Nr4a2.
(C) Venn diagram showing the overlapping genes which were upregulated after oxidative stress challenge, downregulated after Nr4a2-knockdown and bound by Nr4a2 at the promoter regions in microglia.
(D) mRNA levels of Nr4a2 and 3 potential Nr4a2 target genes, Sqle, Hmga1 and Tagap1, in primary microglia transfected with siNr4a2, compared with control.
(E) A schematic model to illustrate the establishment of Nr4a2 genetic KO mice using CRISPR-CAS9 strategies.
(F) Fluorescence-activated cell sorting strategy to purify microglia from the brain of Nr4a2+/− mice and control mice.
(G) mRNA levels of Nr4a2 and Sqle in primary microglia in respective group.
(H) ChIP-qPCR analysis of selected Nr4a2 binding sites on the promoter of Sqle gene. ChIP-qPCR was used to amplify chromatin derived from immunoprecipitations with anti-Nr4a2 antibody (n=5 per group).
(I, J) Dual luciferase assay interaction between Nr4a2 and the respective promoter region of Sqle.
(K) Western blotting analysis of SQLE protein levels in microglia treated with H2O2 (500 µM) in the absence or presence of NAC (5 mM) for 24 hours, or transfected with siNr4a2 for 48 hours.
(L-M) Immunofluorescence co-staining for IBA1, NR4A2 and SQLE on glioma tissues and nonneoplastic tissues of glioma (L). Scale bars, 50 μm. Quantification of SQLE+NR4A2+ microglia levels in respective group (M).
(N) Expression levels of Sqle, immune activation marker (IL-6 and Nos2) and immune suppression marker (Arg-1 and IL-10) in primary microglia treated with H2O2 (500 µM) in the absence or presence of NB-598, compared with control cells.
Data are shown as mean ± SEM. In (D), (G), (H), (I), (J) and (M), P value was calculated using the two-tailed Student’s t test. In (N), P value was calculated using one-way ANOVA analysis. *p < 0.05, **p < 0.01, ***p < 0.001.
To genetically study NR4A2 function, we constructed Nr4a2 knockout mice using CRISPR-CAS9 strategies (Figure 5E). As previous studies reported that homozygous Nr4a2 knockout mice die within 12 hours after birth (44), we used heterozygous Nr4a2 knockout mice (Nr4a2+/−) for functional studies. Primary microglia were isolated from Nr4a2+/− mice (Figure 5F), which expressed lower levels of both Nr4a2 and Sqle compared with wild-type mice (Figure 5G). Under oxidative stress, binding of NR4A2 to the promoter region of the Sqle gene was elevated compared with control by ChIP-qPCR analysis (Figure 5H). Confirmatory luciferase reporter assays were used to explore transcriptionally regulation of Sqle by NR4A2. We cloned the Sqle-3’-UTR into the pGL4.10 basic vector and produced a pGL4.10 vector harboring the Sqle promoter region. Co-transfection of pGL4.10-Sqle and Nr4a2 overexpressing plasmid increased luciferase activity compared with control, suggesting that NR4A2 directly targets Sqle (Figure 5I). To validate that NR4A2 specifically controls Sqle gene expression by the predicted binding sites in the promoter region, we generated a mutant construct, pGL4.10-Sqle-Mut, in which the NR4A2 binding site sequences on Sqle-3’-UTR were mutated. Co-transfection of this mutant construct with the Nr4a2 plasmid into cells demonstrated that mutation of the NR4A2 binding sites from the 3’-UTR of Sqle attenuated the effects of NR4A2 on luciferase activity (Figure 5J). Immunoblotting demonstrated that H2O2 treatment induced SQLE protein expression, which was reversed by either co-treatment with NAC or Nr4a2 knockdown (Figure 5K). In glioma patient tumor samples, NR4A2+Iba1+ microglia co-expressed SQLE, whereas NR4A2+SQLE+Iba1+ microglia were rarely observed in nonneoplastic brain (Figures 5L and 5M). Moreover, we observed that the abundance of SQLE+ microglia was higher in GBM patient samples compared with grade 1–3 glioma or nonneoplastic patients (Supplemental Figures S4C and S4D). Therefore, Sqle is a bona fide transcriptionally-regulated downstream target of NR4A2 in GBM microglia.
SQLE catalyzes the stereospecific oxidation of squalene to 2,3-oxidosqualene and is considered to be a rate-limiting enzyme in steroid biosynthesis (43). Therefore, we examined the impact of oxidative stress on cholesterol metabolism in oxidative-stress microglia. In microglia, neither H2O2 treatment nor NR4A2 knockdown affected the levels of the substrate, squalene; however, H2O2 treatment increased 2,3-oxidosqualene levels and this effect was reversed by Nr4a2 knockdown (Supplemental Figure S4E). Treatment with the SQLE specific inhibitor, NB-598 (45), alleviated the phenotypic alterations caused by H2O2 challenge in primary microglia, as measured by the mRNA levels of IL-6, Nos2, Arg-1, and IL-10 (Figure 5N). These data suggest that NR4A2 mediates cholesterol metabolic alterations in microglia.
Genetic knockout of Nr4a2 in microglia reverses tumor-associated immunosuppression and impairs tumor growth
To interrogate the function of NR4A2 in microglia, we generated both global heterozygous Nr4a2 KO mice and myeloid cell-specific homozygous Nr4a2 KO mice. We constructed Nr4a2-flox transgenic mice (Figure 6A) and crossed them onto a Cx3cr1+ myeloid cell-targeting Cre expressing background, Cx3cr1-cre, to generate Cx3cr1+ myeloid cell-specific Nr4a2 KO mice (Nr4a2fl/flCx3cr1Cre mice) (Figure 6B). While no significant reduction of microglia numbers was observed in Nr4a2fl/flCx3cr1Cre mice compared with control mice (Supplemental Figures S5A and S5B), NR4A2+Iba1+ cell numbers were reduced in the brains of Nr4a2fl/flCx3cr1Cre mice bearing GL261-luc cells compared with those in Nr4a2fl/fl mice by immunofluorescent analysis (Figures 6C and 6D). Tumor sizes of GL261-luc-derived tumors grown in Nr4a2fl/flCx3cr1Cre mice implanted were smaller than those grown in Nr4a2fl/fl mice (Figures 6E and 6F). Nr4a2fl/flCx3cr1Cre mice bearing intracranial GL261-luc cells displayed prolonged survival compared with Nr4a2fl/fl tumor-bearing mice (p = 0.005, Figure 6G). The number of SQLE+Iba1+ cells in the brains of Nr4a2fl/flCx3cr1cre mice bearing GL261-luc cells was also reduced compared with those in Nr4a2fl/fl mice (Figures 6H and 6I). CD206+Iba1+ cell numbers in both tumor and peritumoral regions were deceased in Nr4a2fl/flCx3cr1cre mice compared with those in Nr4a2fl/fl mice (Figures 6J–L). Flow cytometry analysis showed that MHC-I+ microglia and CD8+CD45+ T cells were increased in Nr4a2fl/flCx3cr1cre mice compared with those in Nr4a2fl/fl mice (Figure 6M), whereas the frequency of CD206+ microglia were reduced (Supplemental Figure S5C). Significant changes in the frequency of CD86+ cells and CD4+CD45+ T cells were not observed (Supplemental Figure S5C). Expression levels of immune checkpoint molecules, including PD1, CTLA4, and TIM3, on CD8+ T cells were reduced in the brains of Nr4a2fl/flCx3cr1cre mice implanted with GL261-luc cells compared with those in Nr4a2fl/fl mice, while expression levels of effector molecules, including TNFα and IFNγ, were increased in Nr4a2fl/flCx3cr1cre mice (Figure 6M). To prove that the impact of microglial NR4A2 on glioma cells was mediated through the immune system, we used a CD8 neutralization antibody to deplete CD8+ T cells in vivo. The prolonged survival of glioma-bearing Nr4a2fl/flCx3cr1cre mice compared with control mice was abolished by administration of the CD8 neutralization antibody (Figure 6N), indicating that this effect was indeed CD8+ T cell-dependent. To examine the possible effects of monocytes-derived macrophages on glioma tumor growth in the conditional knockout mouse models, we analyzed NR4A2 expression in the macrophages of either normal brain or tumor-bearing brain in our GL261 single cell RNA-seq dataset and found that different from microglia, there was no significant difference between the two groups (Supplemental Figure S5D). In vitro co-culture experiments revealed that H2O2-treated macrophages did not promote tumor growth of GL261 cells (Supplemental Figure S5E). We further isolated the primary microglia from either GL261-bearing brain or normal brains to detect the expression of Nr4a2 and found that Nr4a2 was prominently increased in the microglia of glioma-bearing brains compared with control brains (Supplemental Figures S5F and S5G). In addition, a previous study suggested that glioma size increases in Ccr2 (a classical marker for monocytes-derived macrophages) (46,47) knockout mice compared to wild type, suggesting that monocyte-derived macrophages may play a tumor-inhibiting, instead of tumor-promoting, role in glioma growth (48). These data suggest that the primary tumor suppressive effects in Nr4a2fl/flCx3cr1cre mice compared with control mice were likely derived from Nr4a2 inhibition in microglia.
Figure 6. Microglia-specific knockout of Nr4a2 reverses alternative activation and improves antigen presentation capacities of microglia in GBM.

(A, B) Microglia-specific deletion of Nr4a2 in mice (Nr4a2ΔMCs/ΔMCs or Nr4a2fl/flCx3cr1cre). Floxed Nr4a2 (Nr4a2LoxP/LoxP) mice were bred with mice expressing microglia-specific Cx3cr1-cre to generate Nr4a2fl/flCx3cr1cre mice (A). Tumor size, T cell functions and antigen presentation capacities of microglia were compared in respective group after inoculation of GL261-luc cells (B).
(C, D) Immunofluorescence staining for IBA1 and NR4A2 on the brain sections of Nr4a2fl/flCx3cr1cre and Nr4a2fl/fl GL261-luc-bearing mice (C). Scale bars, 50 μm. Proportions of NR4A2+ IBA1+ cells in respective group were shown (D).
(E, F) Representative in vivo bioluminescence-based images of GL261-luc (2×10⁴ cells) bearing Nr4a2fl/flCx3cr1cre and Nr4a2fl/fl mice (E). Quantification of tumor volume based on bioluminescence (F) (n≥3 per group).
(G) Survival curve of Nr4a2fl/flCx3cr1cre and Nr4a2fl/fl mice inoculated with GL261-luc cells (n=6 per group).
(H, I) Immunofluorescence staining for IBA1 and SQLE on the brain sections of Nr4a2fl/flCx3cr1cre and Nr4a2fl/fl GL261-luc-bearing mice (H). Scale bars, 50 μm. Proportions of SQLE+IBA1+ cells were shown (I).
(J-L) Immunofluorescence staining for CD206 of microglia on glioma or peritumor tissues of Nr4a2fl/fl (J) and Nr4a2fl/flCx3cr1cre GL261-luc-bearing mice (K). Scale bars, 50 μm. Proportions of CD206+IBA1+ cells were shown (L).
(M) Flow cytometry analysis to examine antigen presentation capacities of microglia as well as cytotoxic functions and immune checkpoint molecule expressions of CD8+ T cells in glioma tissues from Nr4a2fl/flCx3cr1cre and Nr4a2fl/fl GL261-bearing mice.
(N) Survival curves of Nr4a2fl/fl and Nr4a2fl/flCx3cr1cre glioma-bearing mice (2×10⁴ cells) in the absence or presence of αCD8 treatment. Anti-CD8 mAbs were given intraperitoneally at a dose of 800 µg per mouse twice a week on day 0 after tumor inoculation (n=6 per group).
(O-Q) Representative in vivo bioluminescence-based images of GL261-luc (2×10⁴ cells) bearing Nr4a2+/− and control mice (O). Quantification of tumor volume based on bioluminescence in each group (P). Survival curves of each group were shown (Q) (n=6 per group).
Data are shown as mean ± SEM. In (D), (F), (I), (M) and (P), P value was calculated using the two-tailed Student’s t test. In (L), P value was calculated using one-way ANOVA analysis. In (G), (N) and (P), survival difference was calculated by log-rank test. *p < 0.05, **p < 0.01, ***p < 0.001.
In validation studies, tumors derived from GL261-luc cells grown in Nr4a2+/− mice were smaller than those grown in wild-type mice (Figures 6O and 6P). Nr4a2+/− mice bearing GL161-luc cells also displayed improved survival (p = 0.01, Figure 6Q). Immunofluorescent assay revealed that CD206+Iba1+ microglia were reduced in Nr4a2+/− mice bearing GL261-luc-derived tumors compared with wild-type mice (Supplemental Figures S5H and S5I). mRNA levels of classically activated myeloid marker Nos2 were slightly increased, whereas the mRNA levels of alternatively activated myeloid markers, including Arg-1 and IL-10, were reduced in tumor-bearing Nr4a2+/− mice (Supplemental Figure S5J). Further flow cytometry analysis showed that CD206+ microglia were reduced in Nr4a2+/− mice compared with wild-type mice, although minimal changes were observed for MHC-I+ and CD86+ microglia (Supplemental Figure S5K). The abundance of CD8+ T cells was increased in Nr4a2+/− mice compared with wild-type mice and the expressions of immune checkpoint molecules, including PD1 and TIM3, were reduced on CD8+ T cells, while effector molecules TNF-α and IFNγ were increased (Supplemental Figure S5L). Thus, genetic targeting of NR4A2 in microglia suppresses tumor growth due to reduced immunosuppression.
Pharmacologic targeting of NR4A2 or SQLE augments efficacy of immune checkpoint blockade therapy
Immune checkpoint blockade therapy has shown limited therapeutic efficacy against GBM (49,50). We found that PD1 antibody treatment synergized with microglia-specific NR4A2 knockout in glioma-bearing mice compared with control, anti-PD1 monotherapy or in microglia-specific NR4A2 knockout mice (Supplemental Figure S6A). To translate our findings into a potential preclinical therapeutic paradigm, we interrogated the anti-tumor efficacy of inhibiting the NR4A2-SQLE axis using pharmacologic inhibitors of NR4A2 (Bay-11-7082) (51) or SQLE (terbinafine) (52,53) in combination with immune checkpoint blockade. We first analyzed the alterations of components of TIME with each monotherapy and combination regimens. Combined treatment with Bay 11-7082 and anti-PD1 increased the abundance of CD8+ T cells in tumor-bearing mice, whereas expression levels of immune checkpoint molecules, including PD1, CTLA4, LAG3, and TIM3, on CD8+ T cells were reduced compared with other three treatment groups (Figure 7A). In parallel, combined treatment with terbinafine and anti-PD1 downregulated expression levels of immune checkpoint molecules, such as PD1, CTLA4 and TIM3, on CD8+ T cells compared with the other treatment groups (Figures 7B and 7C). While anti-PD1 monotherapy showed limited efficacy in GL261-luc-bearing mice, combined treatment using anti-PD1 and Bay-11-7082 induced tumor regression and prolonged survival compared with monotherapies or treatment control (Figures 7D and 7E and Supplemental Figure S6B). Combinatory administration with terbinafine and anti-PD1 also induced tumor regression and prolonged survival for GL261-luc-bearing mice compared with each monotherapy or treatment control (Figures 7F and 7G and Supplemental Figure S6B). Similar synergistic effects were observed in CT2A-luc-bearing mice (Supplemental Figure S6C–J). These data indicated that pharmacological inhibition of the NR4A2-SQLE axis augments efficacy of immune checkpoint blockade therapy.
Figure 7. Synergistic therapeutic efficacy of NR4A2/SQLE axis inhibition and immune checkpoint blockade therapy and oxidative stress-NR4A2-SQLE axis as a predictor of poor prognosis in glioma patients.

(A) Flow cytometry analysis to examine CD8+ T cells, immune checkpoint molecules of CD8+ T cells in GL261-luc-bearing C57BL/6J mice with combination treatment of Bay-11-7082 and αPD1.
(B, C) Flow cytometry analysis to examine immune checkpoint molecules of CD8+ T cells in GL261-luc-bearing C57BL/6J mice with combination treatment of terbinafine and αPD1 (B). Quantification of percentage of CD8+ T cells that express each immune checkpoint molecule was shown (C).
(D-E) Representative in vivo bioluminescence-based images of GL261-luc-bearing C57BL/6J mice (2×10⁵ cells) with αPD1 in the absence or presence of Bay-11-7082. Bay-11-7082 was given intraperitoneally at a dose of 25 mg/kg per mouse every 2 days on day 3 after tumor inoculation. αPD1 was given intraperitoneally at a dose of 200 µg per mouse every 2 days on day 3 after tumor cell implantation (D). Survival curves of each group were shown (E). (n=4 to 6 per group).
(F-G) Representative in vivo bioluminescence-based images of GL261-luc-bearing C57BL/6J mice (2×10⁵ cells) with αPD1 in the absence or presence of Terbinafine. Terbinafine was given by oral gavage at a dose of 560 mg/kg per mouse every 2 days on day 3 after tumor inoculation. αPD1 was given intraperitoneally at a dose of 200 µg per mouse every 2 days on day 3 after tumor cell implantation (F). Survival curves of each group were shown (G) (n=3 to 6 per group).
(H) Kaplan-Meier analysis of glioma patients based on a tissue microarray of 125 individuals. According to immunofluorescence staining for oxidative stress marker (8-OHdG) and microglia maker (IBA1) on glioma tissues, glioma patients were stratified into two groups: 8-OHdG+ microgliahigh patients and 8-OHdG+ microglialow patients. Left, all glioma patients (n=125), middle, grade I/II glioma patients (n=77) and right, grade III/IV glioma patients (n=48), respectively.
(I) Quantification of 8-OHdG+Iba1+ microglia in grade I/II and grade III/IV glioma patients, respectively.
(J) Analysis of ROS in live primary microglia marked with CD45 and CD11b antibodies by flow cytometry in glioma tissues and brain tissues of peritumoral area. FITC signals represent ROS production.
(K, L) Immunofluorescence staining for oxidative stress marker (8-OHdG) and microglia maker (IBA1) on glioma tissues and nonneoplastic tissues in glioma patients Scale bars, 50 μm. Quantification of 8-OHdG+ microglia levels in respective group.
Data are shown as mean ± SEM. In (A) and (C), P value was calculated using one-way ANOVA analysis. In (I) and (L), P value was calculated using the two-tailed Student’s t test. In (E), (G) and (H), survival difference was calculated by log-rank test. *p < 0.05, **p < 0.01, ***p < 0.001.
The oxidative stress-NR4A2-SQLE axis portends a poor patient prognosis
To explore the clinical relevance as well as whether oxidative stress-challenged microglia informed patient outcome, we further included 125 glioma patients based on tissue microarray and stratified the patients based on levels of oxidative stress, as measured by 8-OHdG+ microglia levels. Overall survival of glioma patients whose tumors had high levels of 8-OHdG+ microglia had worse overall survival compared with 8-OHdG+ microglia-low group patients, with survival differences in both low-grade and high-grade glioma patients (Figure 7H). Abundance of 8-OHdG+ microglia correlated with tumor grade (Figure 7I) and the levels of reactive oxygen species (ROS) were higher in tumor regions compared to peritumor regions or nonneoplastic brains (Figures 7J–L and Supplemental Figures S7A and S7B). We next explored the spatial relationship between CD8+ T cells and oxidative stressed microglia in an in-house cohort of patient samples. Oxidative stress levels of microglia, assessed by 8-OHdG staining, were inversely correlated with the abundance of CD8+ T cells (Supplemental Figures S7C–E). Contact between CD8+ T cells and microglia was reduced in patient tumors with high oxidative stress compared with that in low oxidative stress (Supplemental Figure S7F). Regional variation within tumors showed that areas of low oxidative stress, microglia were more likely to be in contact with CD8+ T cells, while in areas of high oxidative stress microglia displayed reduced contact with CD8+ T cells (Supplemental Figure S7G). Both the number of CD8+ T cells and the contact between CD8+ T cells and microglia were negatively correlated with the abundance of 8-OHdG+Iba1+ cells in glioma patients (Supplemental Figure S7H). Moreover, in glioma tumor regions from clinical samples, the abundance of 8-OHdG+CD206+Iba1+ microglia were higher than that from nonneoplastic brains (Supplemental Figures S7I and S7J).
Univariate and multivariate Cox regression analysis of six factors (MGMT, IDH mutation, 8-OHdG, age, GFAP and EMA) in the 125 glioma patients demonstrated that high oxidative stress level of microglia was an independent factor of poor prognosis in glioma patients (Supplemental Figure S7K and S7L). As CX3CR1 is a well-established marker of microglia, we performed subgroup analysis of TCGA GBM dataset (54), which revealed that in CX3CR1high GBM patients, high Nr4a2 expression was associated with a worse prognosis compared with those with low expression Nr4a2 (Supplemental Figure S7M). In contrast, in CX3CR1low GBM patients, NR4A2high and NR4A2low groups did not differ in prognosis (Supplemental Figure S7M). Similarly, in NR4A2high GBM patients, high expression of CX3CR1 had a worse prognosis compared with low CX3CR1 expression (Supplemental Figure S7N). However, in Nr4a2low GBM patients, CX3CR1high and CX3CR1low groups did not display differences in survival (Supplemental Figure S7N). Thus, the oxidative stress-NR4A2-SQLE axis in microglia informs GBM patient clinical outcome.
DISCUSSION
In this study, we found that in the TIME of GBM microglia are under severe oxidative stress and upregulate NR4A2-dependent transcriptional machinery. NR4A2 regulates SQLE expression and cholesterol metabolism. Functional experiments in Nr4a2+/− mice and Nr4a2fl/flCx3cr1cre mice demonstrated that this metabolic reprogramming reshaped microglia phenotypic plasticity and disrupted their antigen presentation capacity for CD8+ T cells. Pharmacologic targeting of NR4A2 or SQLE augmented of immune checkpoint blockade therapy in vivo. Our findings support a new therapeutic paradigm in GBM through inhibition of an oxidative stress/NR4A2/SQLE axis in microglia.
The blood–brain barrier (BBB) or neurovascular unit limits interplay between the central nervous system and the peripheral circulation, reflected in the GBM TIME with the majority of immune cells being tissue-resident myeloid cells and rare infiltration of adaptive immune cells (55,56). Microglia and macrophages, as major tissue-resident myeloid cells, display extensive phenotypic plasticity in the context of GBM (16). When stimulated with pro-tumorigenic external signals, macrophage and microglia usually assume alternatively activated and immunosuppressive states (17), while upon tumor treatment, they assume M1-like polarization to suppress tumor growth (19). Strategies to induce M1-like states in microglia and macrophages have been developed to treat GBM patients (57–59).
Oxidative stress directly modulates the malignancy and metabolic state of cancer cells themselves (36,60), as well as conditioning microenvironmental niche components, including immune cells and fibroblasts. For instance, tumor-infiltrating Tregs sustain and amplify their tumor suppressor capacity through death via oxidative stress (31). These findings suggest that the oxidative pathway may serve as a metabolic checkpoint that links the molecular interactions between cancer cells and the immune cells as well as the immune-immune interface within the TIME.
NR4A2, as a member of nuclear receptor superfamily, functions in both physiological (61–63) and pathological circumstances (64,65). NR4A2 also serves as a key factor in tumorigenesis and cancer progression. Jing and colleagues found that NR4A2-osteopontin-Wnt signaling contributes to hepatic stellate cell-induced cancer-promotion in intrahepatic cholangiocarcinoma (66). Cyclooxygenase-2 inhibitors suppress colorectal cancer growth by down-regulating osteopontin and NR4A2 (67). The role of NR4A2 in antitumor immunity has recently been investigated; while CAR T cells have been less effective against solid tumors, CAR T cells lacking all three NR4A transcription factors (Nr4a triple knockout, including Nr4a2) promoted tumor regression and prolonged the survival of solid tumor-bearing mice (68). Inhibition of NR4A2 receptors enhances chemotherapy-related antitumor immunity by breaking Treg-mediated immune tolerance (69). The reported toxicities of NR4A2 inhibitors have been minimal (70), suggesting NR4A2 is a potentially safe and potent immunotherapeutic target.
Cholesterol homeostasis is an essential metabolic pathway for cancer cells. In GBM, tumor cells rely on exogenous cholesterol for survival, taking up cholesterol by suppressing liver X receptor (LXR) ligand synthesis with the LXR-cholesterol axis revealed as a potential therapeutic target (71). Moreover, IDH mutation enhances 24(S)-hydroxycholesterol production and alters cholesterol homeostasis in glioma (72). SQLE catalyzes the stereospecific oxidation of squalene to (S)-2,3-epoxysqualene and is a rate-limiting enzyme in cholesterol metabolism. SQLE supports tumor growth in multiple cancer types (73,74) and is a viable pharmaceutical target (75,76). SQLE inhibitors demonstrate acceptable toxicities in preclinical cancer models (75,77). However, SQLE activity in the immune system and its potential value in cancer immunotherapy has remained obscure. Our findings demonstrate that oxidative stress induced NR4A2 upregulation and nuclear translocation in microglia, transcriptionally activating downstream Sqle expression. Dysregulation of SQLE resulted in altered cholesterol metabolism in microglia and an immune suppressive TIME, favorable for GBM growth and progression. However, how cholesterol synthesis is intricately linked to immunosuppressive functions of microglia warrants further in-depth exploration.
Although immunotherapy has transformed the care of patients afflicted with many cancer types, clinical trials of immunotherapies as monotherapy or combined with other regimens for GBM patients have demonstrated infrequent successes (9,49,50), with numerous negative studies, supporting the critical need to develop novel therapeutic combinations. TIM3 and PD1 blockade show survival benefit in preclinical GBM models (78), and a phase I clinical trial to evaluate the treatment efficacy of sabatolimab, a first-in-class anti-TIM3 monoclonal antibody, in combination with anti-PD1 and stereotactic radiosurgery in recurrent GBM is underway (ClinicalTrials.gov Identifier: NCT03961971). Antigen presentation in the immune system acts as a critical step to activate cytotoxic T lymphocytes to defend against both pathogens and tumors. Antigen-presenting cells include dendritic cells, macrophage, and neutrophils. Stimulated adult microglia cross-prime CD8+ T cells injected in the brain (79). Our data showed that NR4A2-regulated transcriptional machinery functionally impairs the antigen presentation capacities of microglia for CD8+ T cells and inhibition of NR4A2 synergizes with PD1 therapy in GBM models. This finding potentially creates a new opportunity by increasing antigen presentation capacities of microglia to enhance immune checkpoint therapy for GBM patients.
Taken together, we leveraged a single cell sequencing-based integrated strategy to interrogate the immune landscape of GBM to reveal an oxidative stressed microglial immune state. These microglia displayed a NR4A2-regulated transcriptional machinery to rewire cholesterol metabolism, generating an alternatively activated phenotype and impaired antigen presentation capacity for CD8+ T cells in GBM. Inhibition of NR4A2/SQLE axis in microglia augmented the therapeutic effects of immune checkpoint blockade therapy in preclinical GBM models. Future prospective clinical trials to investigate the therapeutic benefit of this approach in GBM patients may be warranted.
METHODS
Patient samples
This study was approved by the Institutional Ethics Committee of Sichuan University and Sichuan Provincial People’s Hospital. Written informed consents were obtained from all patients prior to analysis. All patient samples were archived in snap-frozen or formalin-fixed paraffin-embedded state. Paraffin-embedded or snap-frozen tumor tissues from glioma patients were used for immunofluorescent staining. Glioma patients and tissue sample information of glioma tissue microarray, which was purchased from SHANGHAI OUTDO BIOTECH CO., LTD, was shown in Table S1. Among them, samples from glioma patients were used for ROS-level evaluation by Reactive Oxygen Species Assay Kit (Beyotime, S0033S) or anti-8-OHdG (GeneTex, GTX35250).
Mice
All animal studies were reviewed and approved by the Institutional Ethics Committee of Sichuan University. Heterozygous Nr4a2-knockout mice, Nr4a2-floxed mice and OT-I mice were constructed and purchased from GemPharmatech Co., Ltd (China). CX3CR1-Cre and female C57BL/6 mice were purchased from Cyagen (China) and Chengdu Dossy Experimental Animals CO., Ltd (China), respectively. For intracranial xenografts generation, mice (4–6 weeks age) were anesthetized and inoculated with 2×10⁵ or 2×10⁴ tumor cells (GL261-luc or CT2A-luc)/3 µl into the frontal region of the cerebral cortex, a site 2.5 mm lateral (right), 1.5 mm anterior, and 3.5 mm ventral with respect to the bregma.
In oxidative stress experiments, primary microglia were treated by H2O2 (500 µM) either in the absence or presence of NAC (5 mM) for 12 hours. Murine glioma cells (GL261-luc, 2×10⁵ cells; CT2A-luc, 2×10⁴ cells) were incubated with conditional medium of treated primary microglia for 12 hours. Treated glioma cells and primary microglia (1:1, 2×10⁵ or 2×10⁴ cells) treated by H2O2 were inoculated together into the frontal region of cerebral cortex. In vivo bioluminescence-based imaging was conducted by QuikView 3000 (Bio-Real) or IVIS® Lumina III (PerkinElmer). ROS-level of microglia was evaluated by Reactive Oxygen Species Assay Kit (Beyotime, S0033S).
For in vivo therapy, anti-PD1 mAbs (BE0146, Bioxcell) were administered intraperitoneally at a dosage of 200–500 μg per mouse on day 3 after tumor cell implantation and then every 2 days for the duration of the experiment. Anti-CD8 mAbs (BE0061, Bioxcell) were given intraperitoneally at a dose of 800 μg per mouse after tumor inoculation and then twice a week for the duration of the experiment. Bay-11-7082 (Targetmol, T1902) was given intraperitoneally at a dose of 25 mg/kg per mouse on day 3 after tumor inoculation and then every 2 days for the duration of the experiment. Terbinafine (Targetmol, T6702) was given by oral gavage at a dose of 560 mg/kg per mouse on day 3 after tumor inoculation and then every 2 days for the duration of experiment.
Mice with neurological deficits or moribund appearance were sacrificed. Neurologic signs or signs of morbidity included hunched posture, gait changes, lethargy and weight loss. Brains were harvested and fixed in 4% formaldehyde for 48 hours, and were processed for paraffin embedded blocks.
Primary cell culture and cell lines
Primary microglia cultures were prepared as previously described (80). Briefly, brains from the cerebral cortex of neonatal C57BL/6 mice (P0–P2) were minced using a scalpel and dissociated in 1640 medium containing 0.125% trypsin and 50ug/ml DNAse I at 37 °C for 10min. Cells were isolated by centrifugation at 300×g for 10 min at 4 °C, and were seeded on the plate and cultured with DMEM/F12 supplemented with 10% FBS, and 50 ng/ml mouse M-CSF (PEPROTECH, 300–25). After 10–15 days in culture, microglia were isolated by mechanical shaking (400rpm, 1 h). The purity of microglia was further determined by FACS sorting.
In adult mice, including Nr4a2+/− mice and C57BL/6 mice, primary microglia were sorted by flow cytometry. Brain of 4–6 weeks old mice were triturated and digested by 2mg/ml Papain and 50ug/ml DNAse I at 37 °C for 10min and then passed through a 70-µM cell strainer. Flow cytometry sorting was used to purify CD11b+CD45low cells from brain tissue. OT-I CD8+ T cells were isolated from spleen of 6 to 12-week-old mice. Selection was carried out with a negative CD8 isolation kit (Miltenyi Biotec, 130-104-075) following manufacturer’s instructions. Neutrophils and macrophages were isolated from bone marrow of 6–8 weeks C57BL/6 mice, which were harvested in RPMI 1640 medium. For neutrophils, bone marrow were laid on top of histopaque-1077 and histopaque-1119, followed by centrifugation at 600 g for 20 min. Neutrophils were enriched in the interface of histopaque-1077/1119. For macrophages, bone marrow cells were stimulated with M-CSF (20 ng/ml) after lysed with Red Blood Cell Lysis Buffer. Culture medium was half changed every 3 days. On day 7, macrophages were collected for further experiments.
For cell lines, the murine GBM cell line GL261, murine GBM cell line CT2A, human embryonic kidney cell line 293T, as well as human microglia cell line HMC3 were cultured in Dulbecco’s Modified Eagle’s Medium (DMEM). Murine microglia cell line BV2 cells were cultured in Dulbecco’s Modified Eagle Medium: F-12 (DMEM/F-12). These cell lines were cultured in indicated medium containing 10% FBS (Gibco) and 1:100 antibiotic-antimycotic (Gibco). GL261 and CT2A cell lines were transduced with a lentiviral vector containing a luciferase reporter together with the puromycin resistance gene (GL261-Luc, CT2A-Luc). Gl261 cells were transfected with OVA plasmid, which was gifted from Professor Yuquan Wei, Sichuan University, China. Conditioned media were collected from treated or untreated cells as indicated after culturing for 12 hours. GSC2907 was derived by our laboratory as reported previously (81). GSCs were cultured in Neurobasal media (Invitrogen) supplemented with B27 without vitamin A (Invitrogen), EGF, and bFGF (20 ng/mL each; PEPROTECH), sodium pyruvate and Glutamax. All cells were confirmed to be mycoplasma-free, and maintained at 37℃ and 5% CO2.
Tissue immunofluorescent staining
Immunofluorescent staining of tissues was performed as described previously (82), employing the following primary antibodies: anti-Iba1 (Abcam, ab5076, 1:100), anti-CD8 (Abcam, ab217344, 1:100 or HuaBio, ER1905-98, 1:50), anti-8-OHdG (GeneTex, GTX35250, 1:100), anti-Nurr1 (Abcam, ab176184, 1:100 or Proteintech, 10975-2-AP, 1:50 or Santa Cruz, sc-376984, 1:50), anti-Sqle (Proteintech, 12544-1-AP, 1:50), anti-CD206 (HuaBio, ET1702-04, 1:50 or Proteintech, 60143-1-Ig, 1:50), anti-SOD2 (Proteintech, 24127-1-AP, 1:100), anti-MGMT (Proteintech, 67476-1-Ig, 1:100), anti-IDH (Dianova, DIA-H09, 1:50) and secondary antibodies with Alexa Fluor dyes (Thermo Fisher Scientific). Detailed information for these antibodies could be found in Table S2. Next, specimens counterstained with DAPI were imaged by laser-scanning confocal microscopy (LSM 880, Zeiss) at ×40 magnification with at least ten fields per section. Isotype-matched antibodies were employed for the negative control to adjust the immunofluorescence signal. Immunofluorescence images were analyzed by ZEN lite (blue edition) software to identify infiltrated CD8+ T cells and 8-OHdG+ cells in the samples.
Cell proliferation assay
Cell proliferation was assessed by counting tumor cell number under microscope or flow cytometry. Briefly, GL261 cells or GSC2907 were seeded into 96-well plates at a density of 3000 cells/100ul and incubated overnight at 37℃. Conditional medium was added in respective group and incubated cells for 24–48 hours. GL261 cells number was counted with Incucyte Live-Cell Analysis under 10× lens and GSC2907 cells were digested into single cell suspensions, and counted by flow cytometry.
Migration assay
Transwell 24-well chambers (Corning or Millipore) were applied for in vitro cell migration assay as described previously (83). More than five contiguous fields of each sample were assessed to obtain a representative number of cells that had migrated across the membrane.
Flow cytometry analysis
Mouse or human cells were stained with the following antibodies at a dilution ratio of 1:50: anti-CD45 PerCP-Cy5.5 (BD biosciences, 550994), anti-CD11b FITC (Biolegend, 101206), anti-CD86 APC (Biolegend, 105011), anti-CD206 PE (Biolegend, 141706), anti-CD8a FITC (Biolegend, 100706), anti-CD4 APC (Biolegend, 100516), anti-MHCI PE (Biolegend, 114607), anti-Foxp3 PE (BD biosciences, 563101), anti-IFN-γ PE (BD biosciences, 554412), anti-TNF-α PE/Cyanine7 (Biolegend, 506324), anti-Granzyme B PE/Cyanine7 (Biolegend, 396410), anti-PD1 PE/Cyanine7 (Biolegend, 109110), anti-Tim3 PE (Biolegend, 134003), anti-CTLA4 PE (Biolegend, 106305) and anti-LAG3 PE (Biolegend, 125207). For intracellular staining, the cells were fixed in Fixation and Permeabilization kit (eBioscience, 00-5521-00). After washed with Fixation and Permeabilization buffer, the cells were stained intracellularly for 30 min in the dark. All samples were acquired on BD LSRFortessa (BD Biosciences) or ACEA NovoCyte (ACEA Biosciences), and were analyzed using FlowJo (FlowJo LLC) or NovoExpress software (ACEA Biosciences).
In vitro antigen presentation of T cells by microglia
Primary microglia were prepared as described above. Microglia were treated with H2O2 (500 µM) or NAC (5 mM) for 12 hours, and co-cultured with GL261-OVA at the ratio of 1:1 for 12h. Subsequently, the CD11b+ microglia were positively purified by CD11b (Microglia) MicroBeads (Miltenyi Biotec, 130-093-634). The CD8+ T cells were isolated from OT-I mice as described above, and were labelled with 2 mM CFSE (eBioscience, 65-0850-84) by incubating at 37℃ for 10 minutes. The CD11b+ microglia were incubated with CFSE-labelled CD8+ T cells at the ratio of 1:10 for 2 days. The supernatant was collected for cytokine quantitation, including IFN-γ and TNF-α, which were detected by Mouse IFN-γ ELISA Kit (Proteintech, KE10001) and Mouse TNF-α ELISA Kit (Proteintech, KE10002), respectively. T-cell proliferation was analyzed by FACS in terms of CFSE dilution. To detect PD1+ T cells, microglia were treated with H2O2 (500 µM) or NAC (5 mM) for 12 hours. The CD8+ T cells isolated from OT-I mice were co-cultured with H2O2-treated microglia pulsed with OVA for 24h. The proportion of PD1+ T cells were analyzed by FACS.
siRNA and shRNA knockdown
BV2 and primary microglia were transfected with Nr4a2 siRNA (5’-UCAACAAUGGAAUCAAUCCAUUCCC-3’) (RiboBio, Guangzhou, China) using Lipofectamine RNAiMAX (Invitrogen) according to the manufacturer’s instructions. The concentrations were 50nM equally in both experimental and control groups. The shRNAs specific for mouse Nr4a2(pLKO.1 vector) were purchased from Tsingke. The target sequences are as follows: 5’-UCAACAAUGGAAUCAAUCCAUUCCC-3’. To generate lentivirus, 293T cells were co-transfected with pLKO.1-shRNA plasmid, and packaging plasmids PSPAX2 and PMD2.G using transfection reagent (jetPRIME). CT2A cells were transduced by culturing with viral supernatants in the presence of polybrene (OBIO).
Transcriptome sequencing, single cell RNA sequencing and data analysis
Whole-transcriptome sequencing libraries were constructed as described previously (84). The libraries were sequenced on the Illumina HiSeq platform (Novogen, China; Oebiotech, China). RNA integrity was assessed using the RNA Nano 6000 Assay Kit of the Bioanalyzer 2100 system (Agilent Technologies, CA, USA). A total amount of 3 μg RNA per sample was used as input material for the RNA sample preparations. Briefly, mRNA was purified from total RNA using poly-T oligo-attached magnetic beads. Fragmentation was carried out using divalent cations under elevated temperature in First Strand Synthesis Reaction Buffer(5X). First strand cDNA was synthesized using random hexamer primer and M-MuLV Reverse Transcriptase (RNase H-). Second strand cDNA synthesis was subsequently performed using DNA Polymerase I and RNase H. Remaining overhangs were converted into blunt ends via exonuclease/polymerase activities. After adenylation of 3’ ends of DNA fragments, Adaptor with hairpin loop structure were ligated to prepare for hybridization. In order to select cDNA fragments of preferentially 370~420 bp in length, the library fragments were purified with AMPure XP system (Beckman Coulter, Beverly, USA). Then PCR was performed with Phusion High-Fidelity DNA polymerase, Universal PCR primers and Index (X) Primer. At last, PCR products were purified (AMPure XP system) and library quality was assessed on the Agilent Bioanalyzer 2100 system. The clustering of the index-coded samples was performed on a cBot Cluster Generation System using TruSeq PE Cluster Kit v3-cBot-HS (Illumia) according to the manufacturer’s instructions. After cluster generation, the library preparations were sequenced on an Illumina Novaseq platform and 150 bp paired-end reads were generated. Raw data (raw reads) of fastq format were firstly processed through in-house perl scripts. In this step, clean data (clean reads) were obtained by removing reads containing adapter, reads containing ploy-N and low-quality reads from raw data. At the same time, Q20, Q30 and GC content the clean data were calculated. All the downstream analyses were based on the clean data with high quality. For reads mapping to the reference genome: Reference genome and gene model annotation files were downloaded from genome website directly. Index of the reference genome was built using Hisat2 v2.0.5 and paired-end clean reads were aligned to the reference genome using Hisat2 v2.0.5. We selected Hisat2 as the mapping tool for that Hisat2 can generate a database of splice junctions based on the gene model annotation file and thus a better mapping result than other non-splice mapping tools. Quantification of gene expression level: featureCounts v1.5.0-p3 was used to count the reads numbers mapped to each gene. Then FPKM of each gene was calculated based on the length of the gene and reads count mapped to this gene. FPKM, expected number of Fragments Per Kilobase of transcript sequence per Millions base pairs sequenced, considers the effect of sequencing depth and gene length for the reads count at the same time, and is currently the most commonly used method for estimating gene expression levels. Gene functional annotation: GO analysis were performed with R package clusterProfiler (85), which supports statistical analysis and visualization of functional profiles for genes and gene clusters.
For scRNA-seq, live CD45+ sorted cells population from control and glioma-bearing mice brain were run on 10x Genomics Chromium platform (Oebiotech, China). Single-cell RNA-seq libraries were prepared with Chromium Single cell 3’ Reagent v2 (or v3) Kits according to the manufacturer’s protocol. Single-cell suspensions were loaded on the Chromium Single Cell Controller Instrument (10×Genomics) to generate single cell gel beads in emulsions (GEMs). Briefly, CD45+ single cells were suspended in calcium- and magnesium-free PBS containing 0.04% weight/volume BSA. About CD45+ cells were added to each channel with a targeted cell recovery estimate of cells. After generation of GEMs, reverse transcription reactions were engaged barcoded full-length cDNA followed by the disruption of emulsions using the recovery agent and cDNA clean up with DynaBeads Myone Silane Beads (Thermo Fisher Scientific). cDNA was then amplified by PCR with appropriate cycles which depend on the recovery cells. Subsequently, the amplified cDNA was fragmented, end-repaired, A-tailed, index adaptor ligated and library amplification. Then these libraries were sequenced on the Illumina sequencing platform (HiSeq X Ten) and 150 bp paired-end reads were generated. Single-cell RNA-seq data preprocessing: The Cell Ranger software pipeline (version 3.0.2 or others) provided by 10×Genomics was used to demultiplex cellular barcodes, map reads to the genome and transcriptome using the STAR aligner, and down-sample reads as required to generate normalized aggregate data across samples, producing a matrix of gene counts versus cells. The R package Seurat (version 4) (86) was used for data scaling, transformation, clustering, dimensionality reduction, differential expression analysis, most visualization, alignment and quality control of sequencing data. Briefly, sequencing reads were aligned against the mm10–3.0.0 mouse reference genome with STAR (87), and count matrices were built from the resulting BAM files. Quality of cells were then assessed based on three metrics step by step: (1) The number of detected genes per cell; (2) The proportion of mitochondrial gene counts. The following criteria were then applied to filter low-quality cells: gene number < 200 or >7000, or mitochondrial gene proportion > 0.25. Integration of cells from different samples: Gene-cell matrix of all samples was integrated with Seurat to remove batch effects across different samples. In parameter settings, the first 15 dimensions of principal-component analysis (PCA) were used. Dimensionality reduction and visualization: The filtered gene-cell matrix was first normalized using ‘glmGamPoi’ methods in Seurat v.4 with default parameters. The top 3000 variable genes were used in Seurat SelectIntegrationFeatures function. Then tSNE was performed on the top 15 principal components for visualizing the cells. Clustering of cells: Graph-based clustering was performed on the PCA-reduced data for clustering analysis with Seurat v.4. The resolution was set to 0.4 to obtain a finer result. Briefly, the first 15 PCs of the integrated gene-cell matrix were used to construct a shared nearest-neighbor graph (SNN; FindNeighbors() in Seurat) and this SNN was used to cluster the dataset (FindClusters()) using a graph-based modularity-optimization algorithm of the Louvain method for community detection. Cluster-specific biomarker analysis: PrepSCTFindMarkers () + FindAllMarkers () were used to perform differential gene expression analysis with array data of SCT.
For microglia reclustering analysis in GL261 scRNA-seq data, the filtered microglia gene-cell counts matrix was firstly normalized by using ‘glmGamPoi’ methods in Seurat v.4 with default parameters. The top 3000 variable genes were used in Seurat SelectIntegrationFeatures function. Then, tSNE was performed on the top 15 principal components for visualizing the cells. Clustering of cells: Graph-based clustering was performed on the PCA-reduced data for clustering analysis with Seurat v.4. The resolution was set to 0.2 to obtain a finer result. Briefly, the first 15 PCs of the integrated gene-cell matrix were used to construct a shared nearest-neighbor graph (SNN; FindNeighbors() in Seurat) and this SNN was used to cluster the dataset (FindClusters()) using a graph-based modularity-optimization algorithm of the Louvain method for community detection. Cluster-specific biomarker analysis: PrepSCTFindMarkers() + FindAllMarkers() were used to perform differential genes expression analysis with array data of SCT.
Chromatin immunoprecipitation sequencing assay and data analysis
Nr4a2 ChIP assays were performed with 107 cells using SimpleChIP Enzymatic Chromatin IP Kit (Cell Signaling Technology, #9003) according to manufacturer’s instructions. Briefly, cells were fixed with 1% formaldehyde at room temperature for 10 minutes, and subsequently quenched with 0.125M glycine. Then, we removed media and washed cells twice with ice-cold PBS, completely removing wash from culture dish each time and suspended with lysis buffer supplemented with Protease Inhibitor Cocktail II. Chromatin was sonicated to obtain DNA fragments with an average length of 150–900 bp for sequencing by Micrococcal Nuclease. Soluble fraction of sheared chromatin was diluted with ChIP dilution buffer and incubated with Nr4a2 antibody (Abcam). Incubate IP samples 4h to overnight at 4°C with rotation. Protein G Magnetic Beads were added to each IP reaction and incubated for 2 h at 4°C with rotation.
Chromatin-captured beads were collected by Magnetic Separation Rack and washed by low salt wash and high salt wash at 4°C for 5min with rotation. Beads were resuspended in elution buffer for 30 min at 65°C and removed by magnet and eluted chromatin supernatant were collected by Magnetic Separation Rack. Reverse-crosslinked DNA were reversed cross-links by adding 5M NaCl and Proteinase K, and incubate 2h at 65°C. DNA was purified using purification columns. Eluted DNA was used to do quantitative PCR (qPCR) or sequencing library preparation. ChIP quantitative RT-PCR was performed by using ChamQ SYBR qPCR Master Mix (Vazyme) on a CFX96™ Real Time System (BioRad). The sequences of the primers used for all qPCR assays are in Table S3. The libraries were sequenced on the Illumina HiSeq platform (Novogen, China). The low-quality reads from raw reads were removed by SOAPnuke programs (88). The remained reads were mapped to the reference genome (UCSC mm10) by Bowtie2 (89). To determine the target genes of Nr4a2, the Model-based Analysis of ChIP-seq (MACS) version 2.2.6 was used to identify the specific peak region. The region was defined as a peak with p-value < 0.05. ChIP peak annotation by ChIPseeker, a R bioconductor package (90).
RNA isolation and quantitative RT-PCR
The mRNA level of each gene was measured via quantitative RT-PCR. Following procedures previously described(84), cellular RNA was isolated using RNeasy kit and reverse-transcribed to cDNA using cDNA synthesis kit (Norgen). Then quantitative RT-PCR was measured using ChamQ SYBR qPCR Master Mix (Vazyme) on a CFX96™ Real Time System (BioRad). Data were analyzed using the ΔΔCt method. The endogenous control transcripts were used for normalization. The sequences of the primers used for all qPCR assays are in Table S3.
Dual-luciferase reporter assay
The 2-kb region directly upstream of Sqle was predicted using JASPAR software. Sqle promoter construct contained the Nr4a2-binding sites 1 (Sqle site 1: –1417 ~ –1424), 2 (Sqle site 2: –1280~ –1287), 3 (Sqle site 3: –395 ~ –402), 4 (Sqle site 3: –1574 ~ –1581). Dual-luciferase assay was performed using the Dual-luciferase Reporter Assay kit (Beyotime, RG089S). Briefly, 1×10⁵ cells were seeded in each well of a 24-well tissue culture plate. The 293T cells were incubated until 70% confluent. Cells in each well were transfected with pGL4.10 basic vector or the pGL4.10 vector harboring the Sqle promoter regions (2-kb region upstream of Sqle) or the pGL4.10 vector harboring the mutated Sqle promoter region (Sqle site 2: –1280~ –1287) using Lipofectamine 3000 reagent. To examine the relationship between NR4A2 and Sqle promoter activity, reporter plasmid was co-transfected with Nr4a2 or vector. The renilla luciferase reporter pGMLR-TK plasmid, 0.01μg per well, was co-transfected as the internal control. 48 hours later, the cells were treated with passive lysis buffer. The Dual-luciferase Reporter Assay System (E1910, Promega) was used according to the manufacturer’s instructions. Luciferase activities were normalized to the renilla activity value, and promoter transcription activity was compared with basic pGL4.10 vector control.
Western blot analysis
For blots of NR4A2 and SQLE, microglia were treated with H2O2 or NAC for 24 hours. Whole-protein was prepared in RIPA Lysis Buffer containing a protease inhibitor cocktail (Thermo Scientific Halt, 87786). Nuclear protein or cytoplasmic protein were prepared by Nuclear and Cytoplasmic Extraction Reagents (Solarbio, R0050), which was used according to the manufacturer’s instructions. Cell lysates were sonicated and clarified by centrifugation. Supernatants were collected and quantified for protein concentration, mixed with SDS-PAGE protein loading buffer (Beyotime, P0286) at 95°C for 10min. The same amount of protein was separated by SDS-PAGE. Protein was transferred to 0.45mm or 0.2mm polyvinylidene difluoride (PVDF) membranes (Milipore, IPVH00010 or ISEQ00010). 5% non-fat milk in TBST (TBS with 0.1% tween20) was used for blocking and dilution of primary and second antibodies. Membranes were blocked at room temperature (RT) for 1h and incubated with primary antibody overnight in 4°C. Secondary antibodies were applied after wash and incubated at RT for 1h. Membranes were then washed with TBST and signals were developed with a Western ECL kit (BIO-RAD, #1705061) and detected with Thermo Fisher Scientific iBright.
Metabolite profiling and isotope tracing
For lipid metabolite profiling experiments, the squalene and 2,3-oxidosqualene was measured as previously described (74). Briefly, BV2 cells were transfected with siNr4a2 for 48 hours, and treated with H2O2 for 12 hours. Cells (1×10⁶) were collected and resuspended in 600 μl of cold LC/MS grade methanol, and non-polar metabolites extracted by consecutive addition of 300 μl LC/MS grade water followed by 400 μl of LC/MS grade chloroform. After centrifugation for 10 min at 10,000g and 4 °C, the lower lipid-containing layer was carefully collected and dried under nitrogen. Dried lipid extracts were reconstituted in 50 μl 65:30:5 acetonitril: isopropanol: water (v/v/v) and detected with mass spectrometer. The XCalibur QuanBrowser 2.2 (Thermo Fisher Scientific) was used a 5-ppm mass tolerance and referenced an in-house library of chemical standards. Total lipid signal calculated with LipidSearch was used to normalize raw peak areas to generate relative abundance.
Data and code availability
The accession numbers for gene expression data and microglia cell ChIP short-read sequencing data reported in this paper are PRJNA769541, PRJNA767182, PRJNA889561, PRJNA890930, GSE185758 and GSE185759 available at the Solicitors Regulation Authority (SRA) and Gene Expression Omnibus repository (GEO, http://www.ncbi.nlm.nih.gov/geo/ ), respectively. Biomarkers to identify specific cell types in single cell sequencing data were listed in Table S4.
Quantification and statistical analysis
Statistical analyses were performed using R (version3.4.3, www.r-project.org). GraphPad Prism 7.0 was used to analyze and present data. Cutoff values for Nr4a2 expression levels in tumor-infiltrating microglia cells were obtained with X-tile software version 3.6.1 (Yale University School of Medicine) for clinical sample grouping (TCGA-GBM). Kaplan-Meier curves were generated to show survival significance calculated based on log-rank tests. Pearson correlation were employed to assess the association between infiltration of CD8+ T cells and percentage of 8-OHdG or Nr4a2 levels of microglia in tumors. Two-sided Student’s t-tests were used to assess differences between two groups. One-way ANOVA analysis was used for comparation of more than two groups. Univariate and multivariate Cox regression analysis were used to identify the factors related to overall survival (OS). p value of < 0.05 were considered statistically significant. Statistical significance is shown as *P < 0.05, **P < 0.01, and ***P < 0.001.
Supplementary Material
SIGNIFICANCE.
Metabolic reprogramming of microglia in glioblastoma informs synergistic vulnerabilities for immune checkpoint blockade therapy in this immunologically-cold brain tumor.
ACKNOWLEDGMENTS
The authors would thank Bo Peng from Fudan University, China for helpful discussion and constructive suggestions. This work was supported by grants from National Natural Science Foundation of China (grant #82273255, #81822034, #81821002, and #81773119 to S.Z, grant #82103127 to Z.Y., grant #82202889 to X.A.), National Key Research and Development Program of China (grant #2022YFA1106600, #2017YFA0106800 and #2018YFA0109200 to S.Z), Sichuan Science-Technology Project (grant #22ZYZYTS0070 and #2019YFH0144 to S.Z), Direct Scientific Research Grants from West China Second Hospital, Sichuan University (grant #KS021 and #K1907 to S.Z), NIH grants (grant CA197718, NS103434, CA268634, and CA238662 to J.N.R), Computational Genomic Epidemiology of Cancer (CoGEC) Program at Case Comprehensive Cancer Center (grant #T32CA094186 to K.Y), Young Investigator Award in Glioblastoma from ASCO Conquer Cancer Foundation (to K.Y), and RSNA Research Resident Grant (to K.Y.).
Footnotes
Additional information:
Conflict of interest: No conflict of interest is declared.
REFERENCES
- 1.Ostrom QT, Gittleman H, Liao P, Vecchione-Koval T, Wolinsky Y, Kruchko C, et al. CBTRUS Statistical Report: Primary brain and other central nervous system tumors diagnosed in the United States in 2010–2014. Neuro Oncol 2017;19:v1–v88. [DOI] [PMC free article] [PubMed] [Google Scholar]
- 2.Weller M, Wick W, Aldape K, Brada M, Berger M, Pfister SM, et al. Glioma. Nat Rev Dis Primers 2015;1:15017. [DOI] [PubMed] [Google Scholar]
- 3.Stupp R, Hegi ME, Mason WP, Van-Den-Bent MJ, Taphoorn MJ, Janzer RC, et al. Effects of radiotherapy with concomitant and adjuvant temozolomide versus radiotherapy alone on survival in glioblastoma in a randomised phase III study: 5-year analysis of the EORTC-NCIC trial. Lancet Oncol 2009;10:459–66. [DOI] [PubMed] [Google Scholar]
- 4.Lee EQ, Kaley TJ, Duda DG, Schiff D, Lassman AB, Wong ET, et al. A multicenter, phase II, randomized, noncomparative clinical trial of radiation and temozolomide with or without vandetanib in newly diagnosed glioblastoma patients. Clin Cancer Res 2015;21:3610–8. [DOI] [PMC free article] [PubMed] [Google Scholar]
- 5.Lu-Emerson C, Duda DG, Emblem KE, Taylor JW, Gerstner ER, Loeffler JS, et al. Lessons from anti-vascular endothelial growth factor and anti-vascular endothelial growth factor receptor trials in patients with glioblastoma. J Clin Oncol 2015;33:1197–213. [DOI] [PMC free article] [PubMed] [Google Scholar]
- 6.Brown CE, Alizadeh D, Starr R, Weng L, Wagner JR, Naranjo A, et al. Regression of glioblastoma after chimeric antigen receptor T-cell therapy. N Engl J Med 2016;375:2561–9. [DOI] [PMC free article] [PubMed] [Google Scholar]
- 7.Desjardins A, Gromeier M, Herndon JE 2nd, Beaubier N, Bolognesi DP, Friedman AH, et al. Recurrent glioblastoma treated with recombinant poliovirus. N Engl J Med 2018;379:150–61. [DOI] [PMC free article] [PubMed] [Google Scholar]
- 8.Hilf N, Kuttruff-Coqui S, Frenzel K, Bukur V, Stevanović S, Gouttefangeas C, et al. Actively personalized vaccination trial for newly diagnosed glioblastoma. Nature 2019;565:240–5. [DOI] [PubMed] [Google Scholar]
- 9.Cloughesy TF, Mochizuki AY, Orpilla JR, Hugo W, Lee AH, Davidson TB, et al. Neoadjuvant anti-PD-1 immunotherapy promotes a survival benefit with intratumoral and systemic immune responses in recurrent glioblastoma. Nat Med 2019;25:477–86. [DOI] [PMC free article] [PubMed] [Google Scholar]
- 10.Hodges TR, Ott M, Xiu J, Gatalica Z, Swensen J, Zhou S, et al. Mutational burden, immune checkpoint expression, and mismatch repair in glioma: implications for immune checkpoint immunotherapy. Neuro Oncol 2017;19:1047–57. [DOI] [PMC free article] [PubMed] [Google Scholar]
- 11.Aldape K, Brindle KM, Chesler L, Chopra R, Gajjar A, Gilbert MR, et al. Challenges to curing primary brain tumours. Nat Rev Clin Oncol 2019;16:509–20. [DOI] [PMC free article] [PubMed] [Google Scholar]
- 12.Sheng J, Ruedl C, Karjalainen K. Most tissue-resident macrophages except microglia are derived from fetal hematopoietic stem cells. Immunity 2015;43:382–93. [DOI] [PubMed] [Google Scholar]
- 13.Ginhoux F, Greter M, Leboeuf M, Nandi S, See P, Gokhan S, et al. Fate mapping analysis reveals that adult microglia derive from primitive macrophages. Science 2010;330:841–5. [DOI] [PMC free article] [PubMed] [Google Scholar]
- 14.Goldmann T, Wieghofer P, Jordão MJ, Prutek F, Hagemeyer N, Frenzel K, et al. Origin, fate and dynamics of macrophages at central nervous system interfaces. Nat Immunol 2016;17:797–805. [DOI] [PMC free article] [PubMed] [Google Scholar]
- 15.Hoeffel G, Chen J, Lavin Y, Low D, Almeida FF, See P, et al. C-Myb(+) erythro-myeloid progenitor-derived fetal monocytes give rise to adult tissue-resident macrophages. Immunity 2015;42:665–78. [DOI] [PMC free article] [PubMed] [Google Scholar]
- 16.Klemm F, Maas RR, Bowman RL, Kornete M, Soukup K, Nassiri S, et al. Interrogation of the microenvironmental landscape in brain tumors reveals disease-specific alterations of immune cells. Cell 2020;181:1643–60 e17. [DOI] [PMC free article] [PubMed] [Google Scholar]
- 17.Liu H, Sun Y, Zhang Q, Jin W, Gordon RE, Zhang Y, et al. Pro-inflammatory and proliferative microglia drive progression of glioblastoma. Cell Rep 2021;36:109718. [DOI] [PubMed] [Google Scholar]
- 18.Dumas AA, Pomella N, Rosser G, Guglielmi L, Vinel C, Millner TO, et al. Microglia promote glioblastoma via mTOR-mediated immunosuppression of the tumour microenvironment. EMBO J 2020;39:e103790. [DOI] [PMC free article] [PubMed] [Google Scholar]
- 19.Sarkar S, Döring A, Zemp FJ, Silva C, Lun X, Wang X, et al. Therapeutic activation of macrophages and microglia to suppress brain tumor-initiating cells. Nat Neurosci 2014;17:46–55. [DOI] [PubMed] [Google Scholar]
- 20.Gao X, Li S, Ding F, Liu X, Wu Y, Li J, et al. A virus-mimicking nucleic acid nanogel reprograms microglia and macrophages for glioblastoma therapy. Adv Mater 2021;33:e2006116. [DOI] [PubMed] [Google Scholar]
- 21.Yeini E, Ofek P, Pozzi S, Albeck N, Ben-Shushan D, Tiram G, et al. P-selectin axis plays a key role in microglia immunophenotype and glioblastoma progression. Nat Commun 2021;12:1912. [DOI] [PMC free article] [PubMed] [Google Scholar]
- 22.Hanahan D Hallmarks of cancer: new dimensions. Cancer Discov 2022;12:31–46. [DOI] [PubMed] [Google Scholar]
- 23.Shi R, Tang YQ, Miao H. Metabolism in tumor microenvironment: implications for cancer immunotherapy. MedComm (2020) 2020;1:47–68. [DOI] [PMC free article] [PubMed] [Google Scholar]
- 24.Johnson KC, Anderson KJ, Courtois ET, Gujar AD, Barthel FP, Varn FS, et al. Single-cell multimodal glioma analyses identify epigenetic regulators of cellular plasticity and environmental stress response. Nat Genet 2021;53:1456–68. [DOI] [PMC free article] [PubMed] [Google Scholar]
- 25.Yang W, Bai Y, Xiong Y, Zhang J, Chen S, Zheng X, et al. Potentiating the antitumour response of CD8(+) T cells by modulating cholesterol metabolism. Nature 2016;531:651–5. [DOI] [PMC free article] [PubMed] [Google Scholar]
- 26.Weinberg SE, Singer BD, Steinert EM, Martinez CA, Mehta MM, Martínez-Reyes I, et al. Mitochondrial complex III is essential for suppressive function of regulatory T cells. Nature 2019;565:495–9. [DOI] [PMC free article] [PubMed] [Google Scholar]
- 27.Field CS, Baixauli F, Kyle RL, Puleston DJ, Cameron AM, Sanin DE, et al. Mitochondrial integrity regulated by lipid metabolism is a cell-Intrinsic checkpoint for Treg suppressive function. Cell Metab 2020;31:422–37.e5. [DOI] [PMC free article] [PubMed] [Google Scholar]
- 28.Forman HJ, Zhang H. Targeting oxidative stress in disease: promise and limitations of antioxidant therapy. Nat Rev Drug Discov 2021;20:689–709. [DOI] [PMC free article] [PubMed] [Google Scholar]
- 29.Martinez-Reyes I, Chandel NS. Cancer metabolism: looking forward. Nat Rev Cancer 2021;21:669–80. [DOI] [PubMed] [Google Scholar]
- 30.Luo M, Shang L, Brooks MD, Jiagge E, Zhu Y, Buschhaus JM, et al. Targeting breast cancer stem cell state equilibrium through modulation of redox signaling. Cell Metab 2018;28:69–86 e6. [DOI] [PMC free article] [PubMed] [Google Scholar]
- 31.Maj T, Wang W, Crespo J, Zhang H, Wang W, Wei S, et al. Oxidative stress controls regulatory T cell apoptosis and suppressor activity and PD-L1-blockade resistance in tumor. Nat Immunol 2017;18:1332–41. [DOI] [PMC free article] [PubMed] [Google Scholar]
- 32.Pombo Antunes AR, Scheyltjens I, Lodi F, Messiaen J, Antoranz A, Duerinck J, et al. Single-cell profiling of myeloid cells in glioblastoma across species and disease stage reveals macrophage competition and specialization. Nat Neurosci 2021;24:595–610. [DOI] [PubMed] [Google Scholar]
- 33.Ochocka N, Segit P, Walentynowicz KA, Wojnicki K, Cyranowski S, Swatler J, et al. Single-cell RNA sequencing reveals functional heterogeneity of glioma-associated brain macrophages. Nat Commun 2021;12:1151. [DOI] [PMC free article] [PubMed] [Google Scholar]
- 34.Yu K, Hu Y, Wu F, Guo Q, Qian Z, Hu W, et al. Surveying brain tumor heterogeneity by single-cell RNA-sequencing of multi-sector biopsies. Natl Sci Rev 2020;7:1306–18. [DOI] [PMC free article] [PubMed] [Google Scholar]
- 35.Xie Y, He L, Lugano R, Zhang Y, Cao H, He Q, et al. Key molecular alterations in endothelial cells in human glioblastoma uncovered through single-cell RNA sequencing. JCI Insight 2021;6. [DOI] [PMC free article] [PubMed] [Google Scholar]
- 36.Takahashi N, Chen HY, Harris IS, Stover DG, Selfors LM, Bronson RT, et al. Cancer cells co-opt the neuronal redox-sensing channel TRPA1 to promote oxidative-stress tolerance. Cancer Cell 2018;33:985–1003 e7. [DOI] [PMC free article] [PubMed] [Google Scholar]
- 37.Su H, Yang F, Fu R, Li X, French R, Mose E, et al. Cancer cells escape autophagy inhibition via NRF2-induced macropinocytosis. Cancer Cell 2021;39:678–93.e11. [DOI] [PMC free article] [PubMed] [Google Scholar]
- 38.Wiel C, Le Gal K, Ibrahim MX, Jahangir CA, Kashif M, Yao H, et al. BACH1 stabilization by antioxidants stimulates lung cancer metastasis. Cell 2019;178:330–45.e22. [DOI] [PubMed] [Google Scholar]
- 39.Kuleshov MV, Jones MR, Rouillard AD, Fernandez NF, Duan Q, Wang Z, et al. Enrichr: a comprehensive gene set enrichment analysis web server 2016 update. Nucleic Acids Res 2016;44:W90–7. [DOI] [PMC free article] [PubMed] [Google Scholar]
- 40.Darmanis S, Sloan SA, Croote D, Mignardi M, Chernikova S, Samghababi P, et al. Single-cell RNA-seq analysis of infiltrating neoplastic cells at the migrating front of human glioblastoma. Cell Rep 2017;21:1399–410. [DOI] [PMC free article] [PubMed] [Google Scholar]
- 41.Sawant DV, Yano H, Chikina M, Zhang Q, Liao M, Liu C, et al. Adaptive plasticity of IL-10(+) and IL-35(+) T(reg) cells cooperatively promotes tumor T cell exhaustion. Nat Immunol 2019;20:724–35. [DOI] [PMC free article] [PubMed] [Google Scholar]
- 42.Wang J, Yang ZH, Chen H, Li HH, Chen LY, Zhu Z, et al. Nemo-like kinase as a negative regulator of nuclear receptor Nurr1 gene transcription in prostate cancer. BMC Cancer 2016;16:257. [DOI] [PMC free article] [PubMed] [Google Scholar]
- 43.Brown AJ, Chua NK, Yan N. The shape of human squalene epoxidase expands the arsenal against cancer. Nat Commun 2019;10:888. [DOI] [PMC free article] [PubMed] [Google Scholar]
- 44.Montarolo F, Martire S, Perga S, Spadaro M, Brescia I, Allegra S, et al. NURR1 deficiency is associated to ADHD-like phenotypes in mice. Transl Psychiatry 2019;9:207. [DOI] [PMC free article] [PubMed] [Google Scholar]
- 45.Yoshioka H, Coates HW, Chua NK, Hashimoto Y, Brown AJ, Ohgane K. A key mammalian cholesterol synthesis enzyme, squalene monooxygenase, is allosterically stabilized by its substrate. Proc Natl Acad Sci U S A 2020;117:7150–8. [DOI] [PMC free article] [PubMed] [Google Scholar]
- 46.Liu Z, Liao F, Zhu J, Zhou D, Heo GS, Leuhmann HP, et al. Reprogramming alveolar macrophage responses to TGF-β reveals CCR2+ monocyte activity that promotes bronchiolitis obliterans syndrome. J Clin Invest 2022;132. [DOI] [PMC free article] [PubMed] [Google Scholar]
- 47.Fang W, Zhai X, Han D, Xiong X, Wang T, Zeng X, et al. CCR2-dependent monocytes/macrophages exacerbate acute brain injury but promote functional recovery after ischemic stroke in mice. Theranostics 2018;8:3530–43. [DOI] [PMC free article] [PubMed] [Google Scholar]
- 48.Felsenstein M, Blank A, Bungert AD, Mueller A, Ghori A, Kremenetskaia I, et al. CCR2 of tumor microenvironmental cells Is a relevant modulator of glioma biology. Cancers (Basel) 2020;12. [DOI] [PMC free article] [PubMed] [Google Scholar]
- 49.Reardon DA, Brandes AA, Omuro A, Mulholland P, Lim M, Wick A, et al. Effect of nivolumab vs bevacizumab in patients with recurrent glioblastoma: the CheckMate 143 phase 3 randomized clinical trial. JAMA Oncol 2020;6:1003–10. [DOI] [PMC free article] [PubMed] [Google Scholar]
- 50.Schalper KA, Rodriguez-Ruiz ME, Diez-Valle R, Lopez-Janeiro A, Porciuncula A, Idoate MA, et al. Neoadjuvant nivolumab modifies the tumor immune microenvironment in resectable glioblastoma. Nat Med 2019;25:470–6. [DOI] [PubMed] [Google Scholar]
- 51.McEvoy C, de Gaetano M, Giffney HE, Bahar B, Cummins EP, Brennan EP, et al. NR4A receptors differentially regulate NF-κB signaling in myeloid cells. Front Immunol 2017;8:7. [DOI] [PMC free article] [PubMed] [Google Scholar]
- 52.Li C, Wang Y, Liu D, Wong CC, Coker OO, Zhang X, et al. Squalene epoxidase drives cancer cell proliferation and promotes gut dysbiosis to accelerate colorectal carcinogenesis. Gut 2022;71:2253–65. [DOI] [PMC free article] [PubMed] [Google Scholar]
- 53.Sun H, Li L, Li W, Yang F, Zhang Z, Liu Z, et al. p53 transcriptionally regulates SQLE to repress cholesterol synthesis and tumor growth. EMBO Rep 2021;22:e52537. [DOI] [PMC free article] [PubMed] [Google Scholar]
- 54.Network TCGAR. Comprehensive genomic characterization defines human glioblastoma genes and core pathways. Nature 2008;455:1061–8. [DOI] [PMC free article] [PubMed] [Google Scholar]
- 55.Hara T, Chanoch-Myers R, Mathewson ND, Myskiw C, Atta L, Bussema L, et al. Interactions between cancer cells and immune cells drive transitions to mesenchymal-like states in glioblastoma. Cancer Cell 2021;39:779–92.e11. [DOI] [PMC free article] [PubMed] [Google Scholar]
- 56.Neftel C, Laffy J, Filbin MG, Hara T, Shore ME, Rahme GJ, et al. An integrative model of cellular states, plasticity, and genetics for glioblastoma. Cell 2019;178:835–49.e21. [DOI] [PMC free article] [PubMed] [Google Scholar]
- 57.Saha D, Martuza RL, Rabkin SD. Macrophage polarization contributes to glioblastoma eradication by combination immunovirotherapy and immune checkpoint blockade. Cancer Cell 2017;32:253–67.e5. [DOI] [PMC free article] [PubMed] [Google Scholar]
- 58.Pyonteck SM, Akkari L, Schuhmacher AJ, Bowman RL, Sevenich L, Quail DF, et al. CSF-1R inhibition alters macrophage polarization and blocks glioma progression. Nat Med 2013;19:1264–72. [DOI] [PMC free article] [PubMed] [Google Scholar]
- 59.Zhai K, Huang Z, Huang Q, Tao W, Fang X, Zhang A, et al. Pharmacological inhibition of BACE1 suppresses glioblastoma growth by stimulating macrophage phagocytosis of tumor cells. Nat Cancer 2021;2:1136–51. [DOI] [PMC free article] [PubMed] [Google Scholar]
- 60.Hayes JD, Dinkova-Kostova AT, Tew KD. Oxidative stress in cancer. Cancer Cell 2020;38:167–97. [DOI] [PMC free article] [PubMed] [Google Scholar]
- 61.Sekiya T, Kashiwagi I, Yoshida R, Fukaya T, Morita R, Kimura A, et al. Nr4a receptors are essential for thymic regulatory T cell development and immune homeostasis. Nat Immunol 2013;14:230–7. [DOI] [PubMed] [Google Scholar]
- 62.Pei L, Waki H, Vaitheesvaran B, Wilpitz DC, Kurland IJ, Tontonoz P. NR4A orphan nuclear receptors are transcriptional regulators of hepatic glucose metabolism. Nat Med 2006;12:1048–55. [DOI] [PubMed] [Google Scholar]
- 63.Sekiya T, Kashiwagi I, Inoue N, Morita R, Hori S, Waldmann H, et al. The nuclear orphan receptor Nr4a2 induces Foxp3 and regulates differentiation of CD4+ T cells. Nat Commun 2011;2:269. [DOI] [PMC free article] [PubMed] [Google Scholar]
- 64.Doi Y, Oki S, Ozawa T, Hohjoh H, Miyake S, Yamamura T. Orphan nuclear receptor NR4A2 expressed in T cells from multiple sclerosis mediates production of inflammatory cytokines. Proc Natl Acad Sci U S A 2008;105:8381–6. [DOI] [PMC free article] [PubMed] [Google Scholar]
- 65.Le WD, Xu P, Jankovic J, Jiang H, Appel SH, Smith RG, et al. Mutations in NR4A2 associated with familial Parkinson disease. Nat Genet 2003;33:85–9. [DOI] [PubMed] [Google Scholar]
- 66.Jing CY, Fu YP, Zhou C, Zhang MX, Yi Y, Huang JL, et al. Hepatic stellate cells promote intrahepatic cholangiocarcinoma progression via NR4A2/osteopontin/Wnt signaling axis. Oncogene 2021;40:2910–22. [DOI] [PubMed] [Google Scholar]
- 67.Zagani R, Hamzaoui N, Cacheux W, de Reyniès A, Terris B, Chaussade S, et al. Cyclooxygenase-2 inhibitors down-regulate osteopontin and Nr4A2-new therapeutic targets for colorectal cancers. Gastroenterology 2009;137:1358–66.e1–3. [DOI] [PubMed] [Google Scholar]
- 68.Chen J, López-Moyado IF, Seo H, Lio CJ, Hempleman LJ, Sekiya T, et al. NR4A transcription factors limit CAR T cell function in solid tumours. Nature 2019;567:530–4. [DOI] [PMC free article] [PubMed] [Google Scholar]
- 69.Hibino S, Chikuma S, Kondo T, Ito M, Nakatsukasa H, Omata-Mise S, et al. Inhibition of Nr4a receptors enhances antitumor immunity by breaking Treg-mediated immune tolerance. Cancer Res 2018;78:3027–40. [DOI] [PubMed] [Google Scholar]
- 70.Willems S, Kilu W, Ni X, Chaikuad A, Knapp S, Heering J, et al. The orphan nuclear receptor Nurr1 is responsive to non-steroidal anti-inflammatory drugs. Communications Chemistry 2020;3:85. [DOI] [PMC free article] [PubMed] [Google Scholar]
- 71.Villa GR, Hulce JJ, Zanca C, Bi J, Ikegami S, Cahill GL, et al. An LXR-cholesterol axis creates a metabolic co-dependency for brain cancers. Cancer Cell 2016;30:683–93. [DOI] [PMC free article] [PubMed] [Google Scholar]
- 72.Yang R, Zhao Y, Gu Y, Yang Y, Gao X, Yuan Y, et al. Isocitrate dehydrogenase 1 mutation enhances 24(S)-hydroxycholesterol production and alters cholesterol homeostasis in glioma. Oncogene 2020;39:6340–53. [DOI] [PubMed] [Google Scholar]
- 73.Liu D, Wong CC, Fu L, Chen H, Zhao L, Li C, et al. Squalene epoxidase drives NAFLD-induced hepatocellular carcinoma and is a pharmaceutical target. Sci Transl Med 2018;10. [DOI] [PubMed] [Google Scholar]
- 74.Garcia-Bermudez J, Baudrier L, Bayraktar EC, Shen Y, La K, Guarecuco R, et al. Squalene accumulation in cholesterol auxotrophic lymphomas prevents oxidative cell death. Nature 2019;567:118–22. [DOI] [PMC free article] [PubMed] [Google Scholar]
- 75.Mahoney CE, Pirman D, Chubukov V, Sleger T, Hayes S, Fan ZP, et al. A chemical biology screen identifies a vulnerability of neuroendocrine cancer cells to SQLE inhibition. Nat Commun 2019;10:96. [DOI] [PMC free article] [PubMed] [Google Scholar]
- 76.Kalogirou C, Linxweiler J, Schmucker P, Snaebjornsson MT, Schmitz W, Wach S, et al. MiR-205-driven downregulation of cholesterol biosynthesis through SQLE-inhibition identifies therapeutic vulnerability in aggressive prostate cancer. Nat Commun 2021;12:5066. [DOI] [PMC free article] [PubMed] [Google Scholar]
- 77.Hong Z, Liu T, Wan L, Fa P, Kumar P, Cao Y, et al. Targeting squalene epoxidase interrupts homologous recombination via the ER stress response and promotes radiotherapy efficacy. Cancer Res 2022;82:1298–312. [DOI] [PMC free article] [PubMed] [Google Scholar]
- 78.Kim JE, Patel MA, Mangraviti A, Kim ES, Theodros D, Velarde E, et al. Combination therapy with anti-PD-1, anti-TIM-3, and focal radiation results in regression of murine gliomas. Clin Cancer Res 2017;23:124–36. [DOI] [PMC free article] [PubMed] [Google Scholar]
- 79.Jarry U, Jeannin P, Pineau L, Donnou S, Delneste Y, Couez D. Efficiently stimulated adult microglia cross-prime naive CD8+ T cells injected in the brain. Eur J Immunol 2013;43:1173–84. [DOI] [PubMed] [Google Scholar]
- 80.Zabala A, Vazquez-Villoldo N, Rissiek B, Gejo J, Martin A, Palomino A, et al. P2X4 receptor controls microglia activation and favors remyelination in autoimmune encephalitis. EMBO Mol Med 2018;10. [DOI] [PMC free article] [PubMed] [Google Scholar]
- 81.Gimple RC, Kidwell RL, Kim LJY, Sun T, Gromovsky AD, Wu Q, et al. Glioma stem cell-specific superenhancer promotes polyunsaturated fatty-acid synthesis to support EGFR signaling. Cancer Discov 2019;9:1248–67. [DOI] [PMC free article] [PubMed] [Google Scholar]
- 82.Yang Z, Wang W, Zhao L, Wang X, Gimple RC, Xu L, et al. Plasma cells shape the mesenchymal identity of ovarian cancers through transfer of exosome-derived microRNAs. Sci Adv 2021;7. [DOI] [PMC free article] [PubMed] [Google Scholar]
- 83.Zhao L, Ji G, Le X, Wang C, Xu L, Feng M, et al. Long noncoding RNA LINC00092 acts in cancer-associated fibroblasts to drive glycolysis and progression of ovarian cancer. Cancer Res 2017;77:1369–82. [DOI] [PubMed] [Google Scholar]
- 84.Zhao L, Wang W, Huang S, Yang Z, Xu L, Yang Q, et al. The RNA binding protein SORBS2 suppresses metastatic colonization of ovarian cancer by stabilizing tumor-suppressive immunomodulatory transcripts. Genome Biol 2018;19:35. [DOI] [PMC free article] [PubMed] [Google Scholar]
- 85.Yu G, Wang LG, Han Y, He QY. ClusterProfiler: an R package for comparing biological themes among gene clusters. OMICS 2012;16:284–7. [DOI] [PMC free article] [PubMed] [Google Scholar]
- 86.Hao Y, Hao S, Andersen-Nissen E, Mauck WM 3rd, Zheng S, Butler A, et al. Integrated analysis of multimodal single-cell data. Cell 2021;184:3573–87 e29. [DOI] [PMC free article] [PubMed] [Google Scholar]
- 87.Dobin A, Davis CA, Schlesinger F, Drenkow J, Zaleski C, Jha S, et al. STAR: ultrafast universal RNA-seq aligner. Bioinformatics 2013;29:15–21. [DOI] [PMC free article] [PubMed] [Google Scholar]
- 88.Chen Y, Chen Y, Shi C, Huang Z, Zhang Y, Li S, et al. SOAPnuke: a MapReduce acceleration-supported software for integrated quality control and preprocessing of high-throughput sequencing data. Gigascience 2018;7:1–6. [DOI] [PMC free article] [PubMed] [Google Scholar]
- 89.Langmead B, Salzberg SL. Fast gapped-read alignment with Bowtie 2. Nat Methods 2012;9:357–9. [DOI] [PMC free article] [PubMed] [Google Scholar]
- 90.Yu G, Wang LG, He QY. ChIPseeker: an R/Bioconductor package for ChIP peak annotation, comparison and visualization. Bioinformatics 2015;31:2382–3. [DOI] [PubMed] [Google Scholar]
Associated Data
This section collects any data citations, data availability statements, or supplementary materials included in this article.
Supplementary Materials
Data Availability Statement
The accession numbers for gene expression data and microglia cell ChIP short-read sequencing data reported in this paper are PRJNA769541, PRJNA767182, PRJNA889561, PRJNA890930, GSE185758 and GSE185759 available at the Solicitors Regulation Authority (SRA) and Gene Expression Omnibus repository (GEO, http://www.ncbi.nlm.nih.gov/geo/ ), respectively. Biomarkers to identify specific cell types in single cell sequencing data were listed in Table S4.