

Abstract
A very sensitive and selective colorimetric biosensor for the measurement of mercury ion (Hg2+) in environmental samples has been developed using functionalized gold nanoparticles with bromelain enzyme (brn-AuNPs). This work has shown that Hg2+ measurement based on spectrophotometer and digital image analysis is a very innovative and successful method for providing an effective preliminary system and has promise for the future of water quality biomonitoring. Response Surface Methodology (RSM), a Box–Behnken design-based technique, was used to identify the optimum levels of functionalization of bromelain to AuNPs. The created model's validity was confirmed, and statistical analysis revealed that the ideal functionalize conditions were 1 mM of AuNPs, functionalize with 0.59 mM bromelain concentration on 14 ℃ temperature and 72 h incubation time. The lowest colorimetric detection concentration (LOD) of brn-AuNPs of Hg2+ was 0.0092 ppm and 0.011 ppm for spectrophotometer and digital image analysis. As shown, digital image analysis had advantages based on the LOD result comparable to UV–VIS spectrophotometer. The practical application of the brn-AuNPs sensing was proven with mercury determination in water samples. The present study developed a robust sensor, which successfully implemented in a compact portable sensor kit, turning this sensor into a very potent tool for the development water quality biomonitoring system of Hg2+ application.
Keywords: Mercury, Gold nanoparticles, Bromelain, Colorimetric detection, Response surface methodology
Introduction
Mercury ion (Hg2+) is an environmentally very significant chemical element because of its highly toxicity to living organisms and environment. Hg2+ contamination is common and can emerge from both natural and human sources (Driscoll et al. 2013). It is available and present in many products used in daily life such as paints, electronic compartment, batteries and so on (Horowitz et al. 2014). While they are useful to various industries, mercury and its derivatives are adversely affecting and have major negative impacts on the environment and public health (Ye et al. 2016). Hg2+ is a cumulative pollutant that can give an impact on the cardiovascular, gastrointestinal, neurological, haematological, and renal systems, among other multiple body systems of human (Mahurpawar 2015). Kids are especially susceptible to the neurotoxic effects and even at the lowest amounts of exposure can result in irreversible neurological damage and reproductive issues in some cases (Davidson et al. 2004). Considering the toxicity of Hg2+, regular monitoring of Hg2+ is essential for assessing the safety of various samples such as food supplies sources as well as for environmental monitoring of rivers and larger bodies of water (Xing et al. 2020). Traditionally, inductively coupled plasma mass spectrometry and atomic absorption/fluorescence spectroscopy are widely utilized to determine trace amount of Hg2+ in various samples but this method requires very expensive equipment and needs time-consuming sample preparation (Ma et al. 2017). Hence, searching for innovative Hg2+-sensing strategies with simple, quick, and precise Hg2+ determination is of current interest, particularly in circumstances where existing approaches are inapplicable, such as during on-site or in situ investigations and for quick screening applications (Guo et al. 2011). To fulfil this, much effort has been given and emphasis on the development of quick, accurate, and inexpensive Hg2+ detection.
Recently, gold nanoparticles (AuNPs) have been utilized for the fabrication of miniaturized optical devices, sensor, and photonic circuits due to a variety of intriguing chemical and physical characteristics. Colorimetric assays based on gold nanoparticles (AuNP) are promising for the development of portable, economical and efficient biosensors (Saha et al. 2012). AuNPs have lately been employed for the detection of numerous chemicals based on the unique property of AuNP that well-dispersed AuNP solution is red in colour, whereas aggregated AuNPs seem blue (or purple) in colour in the presence of specific analyte (Sun et al. 2020). The colour of AuNPs solutions transforms from red to blue as they aggregate, and the surface plasmon band broadens and switches to a longer wavelength. Based on this approach, we may develop AuNPs sensor functionalized with a specific molecule and can recognize specific analytes only with naked human eye at trace levels. The biggest benefit of AuNP-based assays is that molecular processes can be easily translated into colour changes which can be seen well with naked eye, requiring no sophisticated equipment. Numerous protein-based colorimetric sensors using AuNPs as sensing components have now been invented. For instances, Guo et al. (2011) described a simple colorimetric method utilizes papain coated-gold nanoparticles (PAuNPs) to detect Hg2+, Pb2+, and Cu2+. The colour of the P-AuNPs mixture would transform from red to blue upon interaction with Hg2+, Pb2+, or Cu2+ (or a combination of these ions) due to AuNP aggregation caused by the interaction between both the metals and papain enzyme. It was reported that many protease enzymes including papain are sensitive to certain toxic metals (Sahlani et al. 2014; Shukor et al. 2009, 2008). Hence, there is a need to further screened more plant-based protease to find a better system in terms of sensitivity to certain heavy metals. Therefore, the aim of this study is to carry out to evaluate the capability of bromelain enzyme to detect toxic metal ions using gold nanoparticles as a tool for simple colorimetric detection system.
Bromelain (EC 3.4.22.4) is a cysteine protease enzyme from pineapple fruit that contains a thiol group in the active sites that can be inhibited by trace amounts of heavy metals (Shukor et al. 2008). Gold nanoparticles (AuNPs), prepared by citrate reduction method, were combined with bromelain protein from Ananas comosus for use as a modifier for the detection of mercury (Hg2+). The AuNPs were characterized by different spectroscopic technique, and the functionalization of AuNPs to bromelain protease increases the sensitivity of this detection systems. In this technique, the thiol of the bromelain enzyme allowed functionalization to AuNPs via electrostatic and hydrophobic interactions for ultrasensitive detection. Binding of bromelain to AuNPs (brn-AuNPs) contribute to the stability of the enzyme and increase the sensitivity of AuNPs (Paul and Tiwari 2015). The interaction of brn-AuNPs complex with Hg2+ will result in the aggregation of AuNPs from red to blue (Fig. 1) that can be visibly examined via a colour change to determine instantly the existence or non-existence of the mercury ions in various samples (Guo et al. 2011; Paul and Tiwari 2015). The colour production after the reaction was measured using spectrophotometer and the images of the colour change were captured using smartphone for digital image analysis (Gan et al. 2020).
Fig. 1.
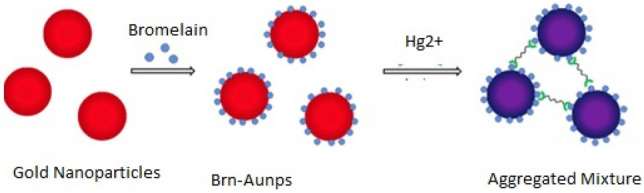
Schematic illustration for the interaction between brn-AuNPs and Hg2+
Lately, digital image analysis based on colorimetry has received considerable attention as an alternative to traditional methods for quantifying chemical reactions because it is an environmentally friendly, inexpensive, portable, and simple analytical approach for analyzing and evaluating chemical compounds, which include heavy metals, organics, biochemical compounds, and medical applications (Firdaus et al. 2019). The range of the digital image value depicted by red–green–blue (RGB colour) range from 0 to 255. These values are much wider as compared to spectrophotometry methods based on absorbance range between 0 and 4.0 offering possibility to increase and enhance the detection sensitivity (Attaallah and Amine 2022). The main criterion for quantitative analysis using the digital image analysis is that the target solution must be coloured and the images taken can serve as the data basis for quantitative analysis (Firdaus et al. 2019; Wang et al. 2019). Generally, the analyst uses organic ligands such as protein, DNA etc. specific to the colourless metal of interest, and the coloured metal can be quantified using the RGB values extracted from the images captured via the smartphone. This new type of colorimetry detection strategy, using digital imaging and specific nanoparticles is, therefore, becoming increasingly important for the detection of hazardous metal ions in various samples. The limit of detection (LOD), however, is still too high to detect mercury pollution in drinking water equivalent to that of traditional colorimetry and spectrophotometry approaches. The LOD of the previously suggested colorimetry approaches must, therefore, be improved (Wang et al. 2018).
The One Factor at a Time (OFAT) strategy involves changing only one of several independent variables while keeping all of the other variables the same. This procedure, on the other hand, is tedious, time-consuming, and only partially effective (Selamat et al. 2018). As a result, the Box–Behnken design (BBD) is a matrices of response surface methodology (RSM) has been used to identify the potential interactions and higher-order effects and establishes the ideal operating conditions by evaluating the simultaneous, systematic, and effective variation of the important parameters for optimizing the best conditions during functionalization of specific proteins on gold nanoparticles. (Zin et al. 2020). There four crucial stages make up this design process: designing and carrying out a series of experiments to provide adequate and reliable evaluation of the response of interest; developing a second-order mathematical model with the best fittings; identifying the ideal set of experimental parameters that yield the ideal value of response; and describing the straightforward interactive influence of significant parameters via graphical plots. (Shahbazi and Zare-Dorabei 2019). In this works, the optimum parameters (concentration of gold nanoparticle, bromelain’s concentration, temperature and incubation time) for the bromelain enzyme functionalization towards AuNPs were determined based on Box–Behnken model. The optimized brn-AuNPs were further characterized and tested with selected toxic metal ions including Hg2+. Due to the recurrence of Hg pollution, the aim of this paper is to provide a comprehensive research regarding a simple and robust preliminary method to detect Hg2+ pollution based on bromelain functionalized with AuNPs (brn-AuNPs) and comparative analysis employing spectrophotometry and images-based colorimetry. Hopefully, this method could be useful for future preliminary detection of Hg2+ in various samples without disadvantages conventional methods.
Materials and methods
Materials
HAuCl4 (G4022-1G) and trisodium citrate (C7254-1 KG) purchased from Sigma–Aldrich, a commercial stem bromelain (EC 3.4.22.32) lyophilized powder was purchased from Sigma (USA) and stored in a refrigerator at − 20 ℃. Mercury standard solution, silver standard solution, titanium standard solution, zinc standard solution, silicon standard solution, copper standard solution, nickel standard solution, molybdenum standard solution, cobalt standard solution, chromium standard solution, and cadmium standard solution were obtained from Merck Germany in NaOH (0.5 mol/l, 1000 mg/l) each.
Instrumentation
Absorption spectra in the wavelength range on 524 nm were recorded on a UV–Visible Spectrophotometer (Varian Cary 50 Bio, Varian Australia Pty Ltd) at room temperature to determine the formation of gold nanoparticles and as well as nanoparticle dispersion and aggregation status. Dynamic Light Scattering (DLS) and transmission electron microscopy were used to assess the particle size, properties, and distribution of AuNP, brn-AuNPs, and changes in colometric parameters. Transmission Electron Microscopy (Hitachi HAQ7-7100) analysis was measured at the Institute of Bioscience’s Microscopic Unit. A Sigma 3 K 15 centrifuge was employed for centrifugation.
TEM sample preparation
Transmission electron microscopy was used to characterize the morphology and size distribution of the gold nanoparticles. Samples for TEM imaging were prepared by drop-casting the AuNPs, brn-AuNPs and brn-AuNPs that have been mixed with heavy metals onto the carbon coated copper grid and let dried for about 1 h. TEM observations were carried using Transmission electron microscopy (TEM) (Hitachi H-7100) and was done in Microscopic Unit, Institute of Bioscience, Universiti Putra Malaysia (UPM). A Leica microtome was used to place a drop of gold nanoparticles samples on top of the 400 Mesh copper grid. The TEM was operated and images processed at 120 kV under room temperature environment (Hondow et al. 2012). The images of the samples were captured and saved into the computer.
Quantification using UV–visible (UV–Vis) spectrophotometer
UV–Vis spectrophotometer (Varian Cary 50 Bio, Varian Australia Pty Ltd) was employed to conduct the measurement results at ambient temperature to ascertain the formation of gold nanoparticles and also to assess nanoparticle dispersion and aggregation state (Cheng et al. 2011). Experimental absorbance was measured at wavelength 524 and 626 nm, and all absorption spectra were recorded between 400 and 800 nm. The spectrophotometer's baseline correction was performed using deionized water as a blank reference (Guo et al. 2011).
Quantification of the digital image using smart phone and image J
To validate quantification of the digital image, the following manual image processing procedures are described as follows. Basically, the digital images were captured using the smartphone camera (Iphone 7plus) and images were transferred to the computer. Using Fiji (Fiji Is Just ImageJ), the image's average RGB colour values were retrieved (Fernandes et al. 2020). In this instance, a smartphone camera's digital picture is employed as a spectrophotometer to measure the colour of the mixture of the AuNPs before and after the reaction (Firdaus et al. 2019). The plot of RGB values against concentration produces a hyperbolic trend. To obtain a linear line for further simple usage, such as standard calibration curve, the initial RGB colour values were converted to log ratios following the Lambert–Beer law derivation formula as follows:
The effective intensities for red, green, and blue are IR, IG, and IB, respectively. The red, green, and blue colour values of the blank and sample, respectively, are R0, G0, B0 and Rs, Gs, Bs (Firdaus et al. 2019). Digital cameras serve as spectrophotometers in this regard, evaluating the color the Hg2+ solution before and after the reaction. It should be noted that the term “intensity” employed here refers to the value R, G, and B colour exist in the digital image, as opposed to how it is used in UV–Visible spectrophotometry. Based on this analysis, the measurement of mercury ions in the samples can be quantified using the logarithmic conversion of RGB colour values, which is directly proportional to the quantity of mercury ions.
Synthesis of gold nanoparticles
Throughout the experiment, deionized water was used. All glasswares used in the preparation and storage of gold nanoparticles were cleaned with aqua regia (3:1 HCl: HNO3), rinsed with distilled water and oven dried. AuNPs were synthesized using citrate reduction according to the reported method (Turkevich et al. 1951). 20 mg (1 mM) of HAuCl4 will be dissolved in deionized water. The pale yellow colour solution is heated to the boiling point by vigorous stirring. 20 mL of 38.8 mM trisodium citrate will be added quickly. The colour of solution changed from colourless to deep purple to deep red. The heat will be turn off, the solution will be refluxed and stirred for 15 min. The obtained sample will be stored in a refrigerator at 4 ℃ prior to use. The synthesized reaction will be as below:
Optimization of optimization of brn-AuNPs functionalization parameters by response surface methodology (RSM)
Response Surface Methodology is a statistical experimental technique to investigate the main effects of significant parameters on the preparations of bromelain functionalization to AuNPs. The four significant processes—independent parameters in this investigation—were optimized using the Box–Behnken experimental design under RSM generated by Design Expert software (version 10.0.1.0, Stat-Ease, Inc., USA) (Halmi et al. 2016). The RSM approach was applied to examine the conceivable optimal levels of the impact operating condition that had a favourable effect on the size of AuNPs. It is required because the performance of nanoparticles is inversely related to particle size (Pandey et al. 2012). Independent variables namely AuNPs concentration, bromelain concentration, temperature, and incubation time were optimized by RSM using a Box–Behnken design of experiments (Table 1). Each variable was studied at three different levels (-1, 0, + 1) for AuNPs concentration (1, 0.6, 0.2 mM), bromelain concentration (1, 0.505, 0.01 mM), Incubation (24, 72, and 120 h), and temperature (4°, 14°, and 24 °C). Experimental design included 29 runs, with three replicates having all fours variables at their central coded values (Table 2). Upon completion of experiments, absorbance at 524 nm was taken as a dependent variable or response Y. Mathematical relationship of response Y (absorbance at 524 nm) and independent variable X (AuNPs concentration, bromelain concentration, temperature, and incubation time c) was simulated by quadratic model equation.
Table 1.
Design of experiment
| Design summary | |||
|---|---|---|---|
| Study type | Response Surface | Runs | 29 |
| Initial design | Box–Behnken | Blocks | No Blocks |
| Design model | Quadratic | Subtype | Randomized |
| Factor | Name | Units | Minimum | Maximum | Values | Mean | Std. Dev |
|---|---|---|---|---|---|---|---|
| A | AuNPs concentration | mM | 0.2 | 1 | 1.000 = 1 | 0.6 | 0.261861 |
| B | Bromelain concentration | mM | 0.01 | 1 | 1.000 = 1 | 0.505 | 0.324054 |
| C | Incubation | Hours | 24 | 120 | 1.000 = 120 | 72 | 31.4234 |
| D | Temperature | Celsius | 4 | 24 | 1.000 = 24 | 14 | 6.54654 |
Table 2.
Box–Behnken experimental design in various runs and the correspondent responses for optimization
| Run | Factor 1 | Factor 2 | Factor 3 | Factor 4 | R1 |
|---|---|---|---|---|---|
| A:AuNPs concentration (mM) |
B:bromelain concentration (mM) |
C:incubation time (Hours) |
D:temperature (celsius) |
Absorbance (524 nm) | |
| 1 | 0.6 | 0.505 | 72 | 14 | 0.5385 |
| 2 | 0.6 | 0.01 | 72 | 24 | 2.9006 |
| 3 | 0.2 | 1 | 72 | 14 | 0.5782 |
| 4 | 1 | 1 | 72 | 14 | 0.3187 |
| 5 | 0.2 | 0.505 | 24 | 14 | 0.3485 |
| 6 | 0.6 | 0.505 | 120 | 24 | 0.6383 |
| 7 | 0.6 | 1 | 120 | 14 | 0.2522 |
| 8 | 0.2 | 0.505 | 72 | 4 | 0.3161 |
| 9 | 0.6 | 1 | 72 | 4 | 0.4267 |
| 10 | 0.2 | 0.505 | 72 | 24 | 0.18 |
| 11 | 0.6 | 0.505 | 120 | 4 | 0.2312 |
| 12 | 1 | 0.01 | 72 | 14 | 3.006 |
| 13 | 1 | 0.505 | 72 | 24 | 0.1187 |
| 14 | 1 | 0.505 | 120 | 14 | 0.1656 |
| 15 | 0.6 | 0.01 | 72 | 4 | 2.1044 |
| 16 | 0.6 | 1 | 24 | 14 | 0.251 |
| 17 | 0.6 | 0.505 | 24 | 4 | 0.2005 |
| 18 | 0.6 | 0.505 | 72 | 14 | 0.5273 |
| 19 | 1 | 0.505 | 24 | 14 | 0.182 |
| 20 | 0.6 | 0.505 | 24 | 24 | 0.2107 |
| 21 | 0.6 | 0.01 | 120 | 14 | 2.5882 |
| 22 | 0.6 | 0.505 | 72 | 14 | 0.8821 |
| 23 | 0.2 | 0.01 | 72 | 14 | 2.0243 |
| 24 | 0.6 | 1 | 72 | 24 | 0.3613 |
| 25 | 1 | 0.505 | 72 | 4 | 0.25 |
| 26 | 0.6 | 0.01 | 24 | 14 | 2.9698 |
| 27 | 0.6 | 0.505 | 72 | 14 | 0.3306 |
| 28 | 0.2 | 0.505 | 120 | 14 | 0.2901 |
| 29 | 0.6 | 0.505 | 72 | 14 | 0.217 |
The required experimental number for the Box–Behnken design is calculated based on N = k2 + k + cp, where k is the factor number and cp is the central point's duplicate number (Souza et al. 2005). As a result, 29 sets of experiments for a four-factor design were conducted and their values were fitted to the second-order polynomial model as follows:
where Y is the dependent variable, A, B, C and D are the independent variables, β0 is the regression coefficient at centre point, β1, β2, and β3 are the linear coefficients; β11, β22, and β33 are the quadratic coefficients, and β12, β13, and β23 are the second-order interaction coefficients (Manohar et al. 2013). The level of variable selected for the Box–Behnken design is shown in Table 2. Fisher’s F test and other statistical models were used to assess the developed model, including analysis of variance (ANOVA). The coefficient of determination, or R2, was used to describe how accurately the model equation fit the experimental data. The relationship between both values was then shown using the fitted model in the form of contour and surface plot. Based on the model, the predicted optimal combination of the effects was generated. Next, sets of tests were carried out using the indicated optimum combination to validate the established Box–Behnken model (Ram Talib et al. 2019).
Preparation of brn-AuNPs
The preparation of brn-AuNPs was carried out according to the optimum point predicted by Response surface methodology. Solid bromelain was prepared in ultrapure water at concentration up to 1 mM. Then, a bromelain solution was incorporated with chemically AuNPs solutions. Next, both mixtures were shaken for about 30 min and incubated in chiller at 14 ℃ for five days (Guo et al. 2011). The mixture was then centrifuged at 14,000 rpm for 45 min and re-dispersed in deionized water. Centrifugation was repeated for three times in water to remove excess inactive bromelain from the solution. The sediments were re-suspended again and ready to be tested with toxic metal ions.
Screening the effect of toxic metals ions to brn-AuNPs
To investigate the performance of brn-AuNPs, samples were tested with each of the eight toxic metals ions (Pb2+, Cu2+, Hg2+, Ni2+, Zn2+, Al2+ Cr2+, Cd2+, As+) and deionized water was used as control in this experiment (Guo et al. 2011). 1 ppm and 10 ppm of each heavy metal solutions (400 µl) were added into a brn-AuNPs solution (600 uL). The colour change of brn-AuNPs from red to blue was rapidly visualized in less than 5 min incubation time through the naked eye. The measurement of the reactions was carried out using UV–Vis spectrophotometer. An Android smartphone camera resolution was used for photographing the samples after the colorimetric reaction for quantification of the digital images (Srivastava and Sharma 2021). The metal ions which showed the positive result was further characterized and quantified at different concentrations for determination of Limit Detection (LOD) and Limit of Quantification (LOQ) (Muhammad-Aree and Teepoo 2020).
Effect of difference concentration of Hg2+ to brn-AuNPs system
Colorimetric detection of Hg2+ was used to evaluate the lowest detection concentration of metal ions of the brn-AuNPs system. During the colorimetric detection of mercury ion, different concentrations of Hg2+ solutions ranging from 0.002 to 4 ppm (400 µl) were added into a brn-AuNPs solution (600 uL) to obtain the limit of detection using UV VIS spectrophotometer and RGB digital images analysis for comparative analysis (Fan et al. 2021; Guo et al. 2011). Calculation of Limit of Detection (LOD) and Limit of Quantification (LOQ) were calculated from the data obtained from the slope linear calibration studies. LODs and LOQs were calculated using Eqs. (1 and 2), respectively (Martins and Mainardes 2017):
| 1 |
| 2 |
Where σ is standard deviation of the response; S is slope of the calibration curve.
Analysis of real water sample
To investigate the feasibility of brn-AuNPs, water samples from Industrial outlets in Selangor and Universiti Putra Malaysia (UPM) were collected, respectively, and filtered prior to use. The pH of aqueous samples was adjusted to neutral and spiked with each of the 0.05 ppm Hg2+. Standards and samples were prepared in equal state and all experiments were repeated three times to confirm reproducibility (Guo et al. 2011).
Results and discussion
Synthesis and characterization of gold nanoparticles
The simplest way to synthesize gold nanoparticles (AuNPs) is by the reduction of HAuCl 4 with sodium citrate in water or known as Turkevich Method. The Turkevich method is a straightforward procedure that involves quickly pouring an aqueous solution of sodium citrate into a boiling aqueous solution of HAuCl 4 while stirring (Turkevich et al. 1951). The synthesis using this method showed the PDI value and size for AuNPs were 0.231and 29.87 nm, respectively (Table 3), thus, indicates that the AuNPs are highly monodisperse (Bhattacharjee 2016). Low value of PDI indicates the AuNPs are well-dispersed, absence aggregation, uniform in size and shape, and stable in colloidal form. According to Fig. 2, the measurement signals are evaluated with respect to their fluctuations. DLS addresses those fluctuations, which are caused by the thermal motion of the scattering objects and which occur at rather small time scales (microseconds and even nanoseconds). The PDI is a well-defined measurand for the width of a particle size distribution and it typically depicts the intensity of light scattered by various fractions of the particles differing in their sizes and is calculated by (width/mean) 2 for each peak. While PDI of ≤ 0.1 is considered to be highly monodisperse values of 0.1–0.4 and > 0.4 are considered to be moderately and highly polydisperse, respectively (Babick 2020).
Table 3.
Efficient diameter size and PDI of AuNPs
| Concentration of AuNPs (mM) | AuNPs size (nm) | PDI |
|---|---|---|
| 1 | 29.87 | 0.231 |
Fig. 2.

Multimodal size distribution graph
Optimization of optimization of brn-AuNPs functonalization parameters by response surface methodology (RSM) by response surface methodology (RSM)
The influence of the main variables including (A) AuNPs concentration, (B) Bromelain concentration, (C) Incubation time and (D) Temperature on the preparation of brn-AuNPs was studied. For this purpose, four levels of these factors, as shown in Table 1 were used. Based on four variables, totally 29 experiments had to be designed using BBD with polynomial analysis. The design matrix for 29 experimental set and the obtained response (R1) values are given in Table 2. The obtained experimental results were used to estimate a model that adequately predicts the response variables. The relationship between independent variables and response was obtained using regression equation coefficients data fitted to polynomial equation. Response, absorbance of functionalization of bromelain to AuNPs can be expressed in regression equation in Terms of Coded Factors as:
Statistical testing of model was performed with Fisher’s statistical test for analysis of variance (ANOVA) (Table 4). Very high degree of quadratic regression showed that the model was significant because value of F test (< 0.05) indicated significance of model terms. Non-significant value of lack of fit (> 0.1000) showed that quadratic model was valid for present study. R2 value closer to 1.0 indicates stronger model and better response prediction (Halmi et al. 2016). The R2 and Adjusted R2 value of 0.9705 and 0.9344 for suggested that model was significant. A very low value of coefficient of variation (CV) 29%) clearly indicated precision and a good deal of reliability of experimental values (Table 5). The predicted response fitted well with that of the experimentally obtained response. The adequate approximation of the selected model was measured by applying the diagnostic plots available in the Design Expert version 10.0.10 software, namely the externally studentized residuals plotted against the normal probability, the predicted versus studentized residuals, the runs versus studentized residuals, and the actual responses versus the predicted response values. Figure 3a shows that the externally studentized residuals plotted against the normal probability yielded a straight line showing the normal distribution of the experimental data. As shown in Fig. 3b and c, residual versus predicted and the externally studentized residuals versus run, respectively, lie below the interval of ± 4.00, indicating that the approximation of the model was good, with no data errors.
Table 4.
Analysis of variance (ANOVA) for functionalization
| Source | Sum of squares |
df | Mean Square |
F value |
p value Prob > F |
|
|---|---|---|---|---|---|---|
| Model | 25.23 | 14 | 1.8 | 32.89 | < 0.0001 | Significant |
| A-AuNPs | 7.69E-03 | 1 | 7.69E-03 | 0.14 | 0.7135 | |
| B-bromelain concentration | 14.97 | 1 | 14.97 | 273.34 | < 0.0001 | |
| C-incubation | 8.01E-07 | 1 | 8.01E-07 | 1.46E-05 | 0.997 | |
| D-temperature | 0.065 | 1 | 0.065 | 1.18 | 0.2957 | |
| AB | 0.39 | 1 | 0.39 | 7.03 | 0.019 | |
| AC | 4.41E-04 | 1 | 4.41E-04 | 8.05E-03 | 0.9298 | |
| AD | 5.76E-06 | 1 | 5.76E-06 | 1.05E-04 | 0.992 | |
| BC | 0.037 | 1 | 0.037 | 0.67 | 0.4272 | |
| BD | 0.19 | 1 | 0.19 | 3.39 | 0.087 | |
| CD | 0.039 | 1 | 0.039 | 0.72 | 0.4108 | |
| A2 | 0.14 | 1 | 0.14 | 2.62 | 0.1281 | |
| B2 | 7.87 | 1 | 7.87 | 143.72 | < 0.0001 | |
| C2 | 0.041 | 1 | 0.041 | 0.76 | 0.3992 | |
| D2 | 0.11 | 1 | 0.11 | 1.96 | 0.1834 | |
| Residual | 0.77 | 14 | 0.055 | |||
| Lack of fit | 0.51 | 10 | 0.051 | 0.79 | 0.6523 | Not significant |
| Pure error | 0.26 | 4 | 0.064 | |||
| Cor total | 26 | 28 |
Table 5.
Summary of regression analysis
| Std. dev | 0.23 | R-squared | 0.9705 |
|---|---|---|---|
| Mean | 0.81 | Adj R-Squared | 0.941 |
| C.V. % | 29 | Pred R-Squared | 0.8716 |
| PRESS | 3.34 | Adeq Precision | 16.959 |
Fig. 3.

Diagnostic plots showing a the externally studentized residuals plotted against the normal probability, b the predicted versus the externally studentized residuals, c the run number versus the externally studentized residuals, and d the actual responses versus the predicted response
Response surface plots of the affecting parameters
The surface response from the quadratic models utilized to visualize the effects each parameter, as depicted in Fig. 4a–f. The three-dimensional response plots are the graphical representations from the regression equations. The response surface is designed to efficiently observe the optimum values of the parameters. The optimum response range can easily be calculated by analyzing the plots. The 3D response surface plots by RSM (Fig. 4a–f) show how the concentrations of AuNPs (A) and concentration of bromelain (B), incubation (C), and temperature (D) influenced the absorbance (response variable Y). While the third factor was kept constant, the relationship of two variables was investigated. The interaction effect of the concentrations of bromelain (B) and AuNPs (A) on a 3D surface is demonstrated in Fig. 4a. The concentration of AuNPs and bromelain increased along with the absorbance. If AuNPs and the right concentration of bromelain were not added to the solution, the surface plot of RSM suggested that absorbance would be low. The optimal functionalization of AuNPs, which serve as the primary body, and bromelain, the capping agent that binds to the body, depends on both of these parameters (Guo et al. 2011). Figure 4b depicts the interaction impact of (C) incubation period and AuNPs (A) on a 3D response surface. The surface plot of RSM revealed that 0.6 mM and 72 h, respectively, were the ideal AuNP concentrations and incubation times. Additionally, at a concentration and incubation above that, the absorbance could rise, indicating that the particles are evenly distributed in the solution, and this monodispersity is a crucial aspect of the nanoparticles (Babick 2020). The ability of nanoparticles to become functionalized may decrease with a longer incubation time. Figure 4c depicts the interaction impact of (D) temperature and AuNPs (A) on a 3D response surface. Based on the graph, it showed that the absorbance increased when the AuNPs and temperature increased. The optimum points of AuNPs and temperature were at 0.4 mM and 14 °C for RSM plot. To obtain an optimum absorbance, the brn-AuNPs preferred to functionalize in an environment with moderate temperature. Figure 4d depicts the interaction impact of (C) incubation period and (B) bromelain concentration on a 3D response surface. The graph demonstrated that the absorbance was very low with increasing bromelain concentrations at very short incubation times. The brn-AuNPs preferred to functionalize under ideal conditions employing a lower concentration of bromelain with sufficient incubation time to achieve favourable conditions for colorimetric detection. Figure 4e shows the interaction effect of (D) temperature and (B) bromelain concentration. The absorbance increased with decreasing concentrations of bromelain and increasing temperature to ambient temperature. However, at a higher concentration of bromelain and temperature, absorbance was slowly inhibited. The activity of the bromelain can be increased by gradually adopting more demanding conditions, such as lower temperatures in each succeeding round of selection. Bromelain's affinity for metals can also be increased by progressively lowering the concentration of the metal ion (Zhang 2013). Figure 4f depicts the interaction impact of (D) temperature and incubation time on a 3D response surface. The best times for incubation and temperature for the RSM plot were 72 h and 14 ℃. The brn-AuNPs favoured functionalization in an adequate incubation period at a moderate temperature for the best conditions (Knecht and Sethi 2009).
Fig. 4.

Response Surface Method plots showing interactive effect of a (B) bromelain concentration; (A) AuNPs concentration; b. (C)incubation time and (A)AuNPs concentration; c (D) temperature and (A) AuNPs concentration; d (C) incubation time and (B) bromelain concentration; e (D) Temperature and (B) Bromelain concentration; f (D) Temperature and (C) incubation time
Determination and validation of optimal conditions
The best absorbance of functionalization was accomplished by the desirability function technique. The desirability function approach has provided the optimal functionalization absorbance for gold nanoparticles to bromelain (brn-AuNPs). This method includes the desires and requirements for each of the variables to create a system for determining the relationship in both the expected absorbance for each variable and the desirability of the experiments (Sanusi et al. 2016). RSM through the desirability function predicted the following ideal conditions: 0.59 mM of AuNPs concentration, 0.985 Mm Bromelain concentration, 120 h Incubation time, and 14 ℃ Temperature which resulted in an overall 0.47 absorbance with a desirability value of 0.999 (Table 6). A validation experiment was carried out in accordance with the projected condition obtained to validate this predicted optimum condition. The validation result was compared to the predicted values from the RSM model by determining the deviation between the two values. Based on this, validity and appropriateness of the projected RSM models were demonstrated by experiments conducted under the expected circumstances given. The final results acquired from the validation from the experiment indicate that these proposed quadratic models are proven to generate the optimal values of the process parameter. It should be emphasized that the suitability of the developed quadratic models, and these optimal values are valid within the given range of process parameter values.
Table 6.
The optimum conditions were obtained using the desirability function technique
| A:AuNPs concentration (mM) |
B:Bromelain concentration (mM) |
C:incubation (Hours) |
D:temperature (celsius) |
Experimental absorbance | Predicted absorbance |
|---|---|---|---|---|---|
| 1 | 0.59 | 120 | 14.00 | 0.46 | 0.47 |
Functionalization and characterization brn-AuNPs
After centrifugation of the brn-AuNPs solution, the brn -AuNPs were stably dispersed in water (Fig. 5). The UV–vis absorption spectra of brn-AuNPs showed an apparent broadening and a slight red shift (Fig. 6), demonstrating that the PDI ranges from 0 to 1 and has no dimensions or dimensionless. Brn-AuNPs' PDI of 0.278 suggests that they are narrowly monodisperse colloidal, which is crucial for the growth of spherical AuNPs with a restricted size distribution (Table 7). Size of nanoparticles of 39.56 nm in Table 7 is designated as narrowly monodisperse by the PDI classification. Low PDI values imply that brn-AuNPs are well-dispersed, absence aggregation, uniform in size and shape, and stable in colloidal form (Bhattacharjee 2016). Transmission electron microscope (TEM) images confirmed the formation of AuNps and the functionalization of bromelain to AuNps (Fig. 7a and b). Figure 7a shows that the AuNPs were spherical in shape, uniform and independent from each other. Figure 7b shows that the outer layer of the bromelain-encapsulated around the AuNPs lighter than the core area. Bromelain protease hydrophobic nature enables it to be contained in the hydrophobic part of the AuNPs (Guo et al. 2011). As shown in Fig. 7, considering the AuNPs sizes with respective scale bars, no abnormality in sizes is observed. Bromelain was found to be highly interactive and an effective capping agent for AuNPs (Khan et al. 2019). However, the capability of bromelain protease to act as a capping agent against heavy metal detection has not yet been established. Hereby, we hypothesized that if we functionalize AuNPs with bromelain, we would be able to visually detect Hg2+ with brn-AuNPs detection system. In addition, the bromelain enzyme assay is unaffected by many xenobiotics, which combined with the wide pH and temperature range for activity means that it is suitable for large-scale environmental monitoring of Hg2+ (Shukor et al. 2008).
Fig. 5.
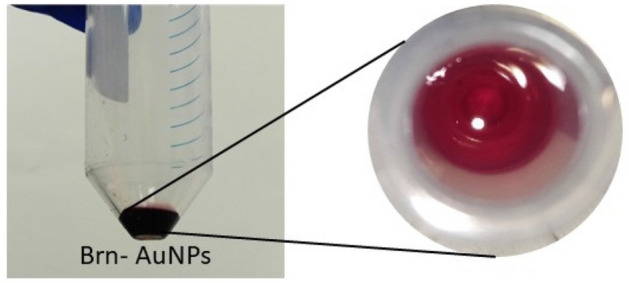
Re-dispersed functionalized brn-AuNPs
Fig. 6.
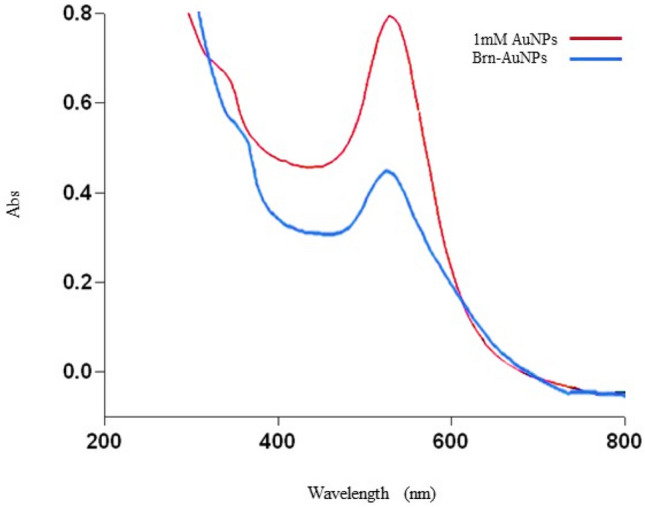
UV–vis absorption spectra of AuNPs and brn-AuNPs at 524 nm
Table 7.
Efficient diameter size and PDI of brn-AuNPs
| Concentration of AuNPs (mM) | AuNPs size (nm) | PDI |
|---|---|---|
| 1 | 39.56 | 0.278 |
Fig. 7.

a Transmission Electron Microscopy image of AuNPs at 50 nm magnification. AuNPs were spherical in shape, uniform and independent from each other. b Transmission Electron Microscopy image of brn-AuNPs at 50 nm magnification shows that the outer layer of the bromelain-encapsulated around the AuNPs lighter than the core area. Bromelain protease hydrophobic nature enables it to be contained in the hydrophobic part of the AuNPs
Screening the effect of toxic metals ions to brn-AuNPs
The applicability of the improved brn-AuNPs as a colorimetric sensor in the presence of different metal ions at a concentration of 1 ppm was examined. To assess the sensitivity of brn-AuNPs to different metal ions, 1 ppm of metal ions were introduced. With the addition of several toxic metal ions (Pb2+, Cu2+, Hg2+, Ni2+, Zn2+, Al2+ Cr2+and Cd2+, As2+) to the brn-AuNPs solution, the colour remained bright red. However, a remarkable change in the intensity of the Surface Plasmon Resonance band was observed when Hg2 + was added, and the colour of the solution changed from red to blue for Hg2+ (Fig. 8). Hg2+ caused the aggregation and agglutination of Brn-AuNPs with more obvious colour change due to the interaction among the brn-AuNPs indicating the capability of the system to detect Hg2+ alone. After functionalization, the mixture of brn-AuNPs were stably dispersed in the solution due to the adsorbed bromelain. Just after incorporation of 1 ppm of Hg2+ to brn-AuNPs mixtures, the color turns from red to blue resulting to the interaction of Hg2+with bromelain functional group, which reduced the distance between AuNPs, causing a significant shift in the plasmon band energy to longer wavelengths and a colour change from red to blue (Fig. 9). The cause may result from bromelain enzyme has cysteine residues and a number of functional groups, comprising carboxyl, amino, hydroxyl, and others (Shukor et al. 2008). Hg2+ may interact to these residues more strongly than other metal ions to induce the aggregation of brn-AuNPs. Furthermore, the charged, aromatic, and hydroxyl-containing amino acids can also react with Hg2+ through non-covalent interactions. Guo et al. (2011) reported the selectivity of Papain functionalized gold nanoparticles (P-AuNPs) on different type of metals with Hg2+, Pb2+ and Cu2+ causing agglutination to the system. However, although both detection system could be a potential tool detection of these heavy metals but brn-AuNPs is more selective for detection of Hg2+.
Fig. 8.

The cropped digital image of brn-AuNPs with different heavy metals after colorimetry reaction
Fig. 9.
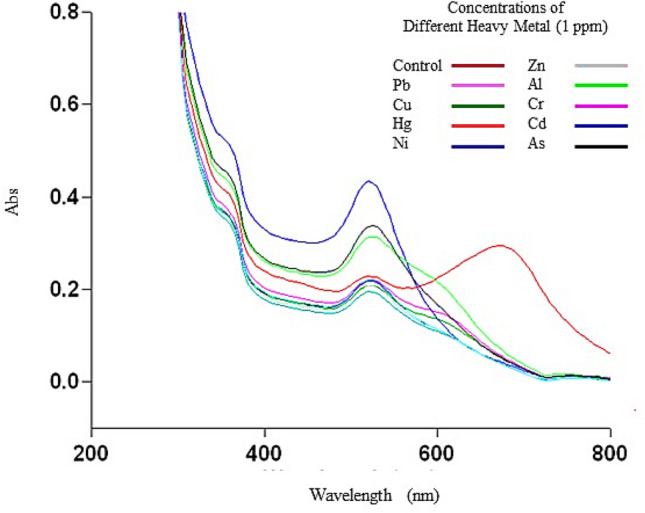
UV–vis absorption spectra of brn-AuNPs on different heavy metals
Effect difference concentration of Hg2+ toward Brn-AuNPs
To evaluate the detectable minimum concentration of Hg2+ in aqueous solution by colour change, different concentrations of Hg2+ were added into the brn-AuNPs solution. As shown in Fig. 10, the colour of the brn-AuNPs solution changed from red to blue gradually with the increase of Hg2+ concentration in less than 5 min incubation time. The colour change was proven by UV–VIS Spectrophotometer by measuring the absorption spectra of Brn-AuNPs (Fig. 11). The UV–vis absorption spectra of brn-AuNPs in addition of increase concentrations of Hg2+ showed a shift to longer. With increase of Hg2+ concentration, the colour of the brn-AuNPs solution gradually turned blue, resulting an increase of aggregation of AuNPs. UV–vis absorption spectra of brn-AuNPs became broader and shifted to the right as the concentration of the Hg2+ increases and its colour became much purple grey (Fig. 10). As the increase of concentration of Hg2+, the ratio A626/A524 increased gradually, showed that the agglutination between brn-AuNPs and Hg2 + increases. The result showed that the LOD of concentration in determine the proportion of variance for independent variable, R2. The lowest colorimetric detection concentration (LOD) of brn-AuNPs of Hg2+ was 0.0092 ppm and limit of quantification (LOQ) was 0.0277 ppm (Fig. 12). Using linear regression analysis, the value of R2 = 0.9944 approved that the data are fit and were significant value for Hg2 + detection of future prediction in real samples. Therefore, the lowest colorimetric detection concentration of brn-AuNPs (LOD) of Hg2+ was 0.0092 ppm. Thus, the brn-AuNPs system is a potential candidate for monitoring of Hg2+ in environmental samples with and without naked ice.
Fig. 10.

The cropped digital image of brn-AuNPs contained different concentration of mercury (ppm) after colorimetry reaction
Fig. 11.

UV–vis absorption spectra of brn-AuNPs on different concentration of mercury
Fig. 12.
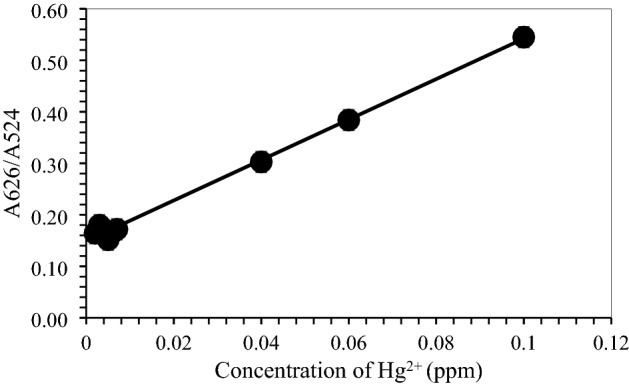
A626/A524 of Brn-AuNPs versus the different concentration of Hg2+
In the past, heavy metals measurement is performed in the laboratory using bulk machine, for example, inductively-coupled plasma-optical emission spectrometry (ICP-OES). Nowadays, a more user-friendly method using smartphone is available to correlate change in color with mercury contamination in water samples for simultaneous detection (Özdemir et al. 2017). When the brn-AuNPs reaction mixture was exposed to Hg2+, the colors appeared that were then recorded with a smartphone followed by processing using Image processing software, IMAGE J to extract out RGB Effective intensity. Based on the regression method, the results of the effective intensity R (red) provided the best linearity with R2 0.927 as compared to effective intensity G (Green) and effective intensity B (Blue). Therefore, the effective intensity R (red) was used for quantitative analysis Hg2+. The lowest colorimetric detection concentration (LOD) of brn-AuNPs of Hg2+ was 0.011 ppm and limit of quantification was 0.033 ppm (Fig. 13). Using linear regression analysis, the value of R2 = 0.9344 approved that the data are fit and were significant value for Hg2+ future prediction in real samples using Image processing technique. As shown, our brn-AuNPs detection system had advantages over the mentioned methods based on the LOD and LOQ result comparable to UV–VIS Spectrophotometer for near real time-monitoring of Hg2+ in real samples. Considering this outcome, the smartphone technology based on built-in color imaging sensor of the phone cameras has made a much more attractive platform for developing and inventing cost-effective, simple and fast portable devices in environmental monitoring field (Sivakumar and Lee 2021).
Fig. 13.
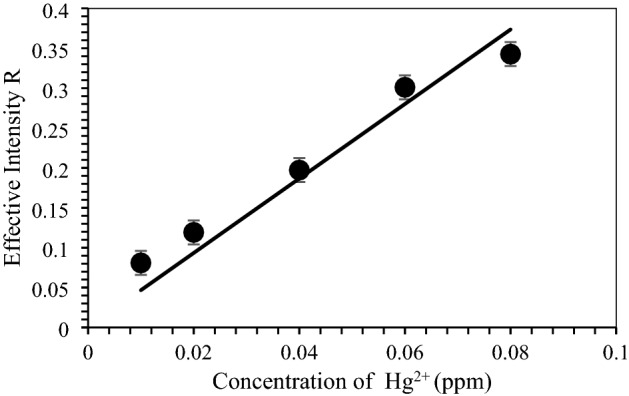
Plotted graph mercury different concentration against effective intensity of color R
Validation using TEM
In the presence of Hg2+ ions, the aggregation of brn-AuNPs was confirmed by TEM analysis (Fig. 14). Transmission electron microscopy studies have provided foresight into the morphology, size and crystallinity of the brn-AuNPs. The image indicates the formation of brn-AuNPs aggregates through metal–ligand interaction containing functional groups on the surface of the AuNPs with Hg2+ ions. TEM images showed the aggregation of brn-AuNPs in the presence of 1 ppm and 10 ppm Hg2+ respectively (Fig. 14a and b). The brn-AuNPs remained well dispersed in the absence of Hg2+. However, after the addition of 1 ppm and 10 ppm of Hg2+, it aggregated rapidly. These results indicated that brn-AuNPs could be used to detect Hg2+ in aqueous solution.
Fig. 14.

Representative TEM images with scale bar at 50 nm of a brn-AuNPs in the presence of 1 ppm of Hg2+; b brn-AuNPs in the presence of 10 ppm of Hg2+
Real samples analysis for Hg2+ detection
To evaluate the potential use of brn-AuNPs in the identification of different ions in water, we evaluated the colorimetric reaction of metal ions in lake water and tap water sampled from UPM area. However, the collected water did not cause the brn-AuNP solution's colour shift suggesting that Hg2+ in these real water samples was not detected. When these water samples were spiked with 0.05 ppm of Hg2+, resulting in shifted colour from red to blue less than 5 min incubation (Fig. 15). The field trials with brn-AuNP gave very satisfactory results. The findings in this work suggest that the brn-AuNPs assay system is suitable for use to indicate the presence of Hg2+ in various water samples with good sensitivity. The rapidity and simplicity of the system allow the development of a simple test kit assisted with or without smartphone to monitor Hg2+ in the environmental or in other sample. Thus, brn-AuNPs system is a potential tool for assay of this ion in environmental samples without complicated pre-treatment.
Fig. 15.

The cropped digital image of brn-AuNPs after reaction with different water samples
Conclusion
In conclusion, this work has utilized a straightforward, affordable, and quick colorimetric technique for Hg2+ detection utilising Brn-AuNPs. The Brn-AuNPs detection system colour shift could be used to track the presence of metal ions like Hg2+. The method reported here showed relatively good selectivity for Hg2+ over other metal ions with the lowest detection concentration detection concentration (LOD) of brn-AuNPs of Hg2+ was 0.0092 ppm and 0.011 ppm for spectrophotometer and digital image analysis. Thus, the Brn-AuNPs sensing system has potential applicability for future preliminary monitoring water quality in developing regions.
Acknowledgements
This material is based on a work supported by the Ministry of Higher Education (MOHE) Malaysia through FRGS grant project number: 01-01-18-1960FR Vote Number 5540085.
Data availability
The presented data is available from the corresponding author on reasonable request.
Declarations
Conflict of interest
The Author(s) declare(s) that there is no conflict of interest.
Contributor Information
Nurul Azreen Suhaidi, Email: nurulazreensuhaidi01@gmail.com.
Mohd Izuan Effendi Halmi, Email: m_izuaneffendi@upm.edu.my.
Asraf Alif Rashidi, Email: rashidiasrafalif@gmail.com.
Mohd Firdaus Mohd Anuar, Email: m.firdaus@upm.edu.my.
Khairil Mahmud, Email: khairilmahmud@upm.edu.my.
Norzila Kusnin, Email: norzilakusnin87@gmail.com.
Siti Salwa Abd Gani, Email: ssalwaag@upm.edu.my.
Mohd Yunus Abd Shukor, Email: mohdyunus@upm.edu.my.
References
- Attaallah R, Amine A. Highly selective and sensitive detection of cadmium ions by horseradish peroxidase enzyme inhibition using a colorimetric microplate reader and smartphone paper-based analytical device. Microchem J. 2022;172:106940. doi: 10.1016/j.microc.2021.106940. [DOI] [Google Scholar]
- Babick F. Characterization of Nanoparticles. New York: Elsevier; 2020. Dynamic light scattering (DLS) pp. 137–172. [Google Scholar]
- Bhattacharjee S. DLS and zeta potential–what they are and what they are not? J Control Release. 2016;235:337–351. doi: 10.1016/j.jconrel.2016.06.017. [DOI] [PubMed] [Google Scholar]
- Davidson PW, Myers GJ, Weiss B. Mercury exposure and child development outcomes. Pediatrics. 2004;113:1023–1029. doi: 10.1542/peds.113.S3.1023. [DOI] [PubMed] [Google Scholar]
- Driscoll CT, Mason RP, Chan HM, Jacob DJ, Pirrone N. Mercury as a global pollutant: sources, pathways, and effects. Environ Sci Technol. 2013;47:4967–4983. doi: 10.1021/es305071v. [DOI] [PMC free article] [PubMed] [Google Scholar]
- Fan Y, Li J, Guo Y, Xie L, Zhang G. Digital image colorimetry on smartphone for chemical analysis: a review. Measurement. 2021;171:108829. doi: 10.1016/j.measurement.2020.108829. [DOI] [Google Scholar]
- Fernandes GM, Silva WR, Barreto DN, Lamarca RS, Gomes PCFL, da Petruci SJF, Batista AD. Novel approaches for colorimetric measurements in analytical chemistry–a review. Anal Chim Acta. 2020;1135:187–203. doi: 10.1016/j.aca.2020.07.030. [DOI] [PubMed] [Google Scholar]
- Firdaus ML, Aprian A, Meileza N, Hitsmi M, Elvia R, Rahmidar L, Khaydarov R. Smartphone coupled with a paper-based colorimetric device for sensitive and portable mercury ion sensing. Chemosensors. 2019;7:25. doi: 10.3390/chemosensors7020025. [DOI] [Google Scholar]
- Gan Y, Liang T, Hu Q, Zhong L, Wang X, Wan H, Wang P. In-situ detection of cadmium with aptamer functionalized gold nanoparticles based on smartphone-based colorimetric system. Talanta. 2020;208:120231. doi: 10.1016/j.talanta.2019.120231. [DOI] [PubMed] [Google Scholar]
- Guo Y, Wang Z, Qu W, Shao H, Jiang X. Colorimetric detection of mercury, lead and copper ions simultaneously using protein-functionalized gold nanoparticles. Biosens Bioelectron. 2011;26:4064–4069. doi: 10.1016/j.bios.2011.03.033. [DOI] [PubMed] [Google Scholar]
- Halmi MIEB, Abdullah SRS, Wasoh H, Johari WLW, Ali MS, Shaharuddin NA, Shukor MY. Optimization and maximization of hexavalent molybdenum reduction to Mo-blue by Serratia sp. strain MIE2 using response surface methodology. Rendiconti Lincei. 2016;27:697–709. doi: 10.1007/s12210-016-0552-4. [DOI] [Google Scholar]
- Horowitz HM, Jacob DJ, Amos HM, Streets DG, Sunderland EM. Historical mercury releases from commercial products: global environmental implications. Environ Sci Technol. 2014;48:10242–10250. doi: 10.1021/es501337j. [DOI] [PubMed] [Google Scholar]
- Khan I, Saeed K, Khan I. Nanoparticles: properties, applications and toxicities. Arab J Chem. 2019;12:908–931. doi: 10.1016/j.arabjc.2017.05.011. [DOI] [Google Scholar]
- Knecht MR, Sethi M. Bio-inspired colorimetric detection of Hg2+ and Pb2+ heavy metal ions using Au nanoparticles. Anal Bioanal Chem. 2009;394:33–46. doi: 10.1007/s00216-008-2594-7. [DOI] [PubMed] [Google Scholar]
- Ma S, Li L, She M, Mo Y, Zhang S, Liu P, Li J. Synthesis and application of highly sensitive fluorescent probe for Hg2+ regulated by sulfur. Chin Chem Lett. 2017;28:2014–2018. doi: 10.1016/j.cclet.2017.09.027. [DOI] [Google Scholar]
- Mahurpawar M. Effects of Heavy Metals on Human Health. Int J Res Granthaalayah. 2015;530:1–7. doi: 10.29121/granthaalayah.v3.i9SE.2015.3282. [DOI] [Google Scholar]
- Manohar M, Joseph J, Selvaraj T, Sivakumar D. Application of Box Behnken design to optimize the parameters for turning Inconel 718 using coated carbide tools. Int J Sci Eng Res. 2013;4:620–644. [Google Scholar]
- Martins LG, Mainardes RM. Application of a validated HPLC-PDA method for the determination of melatonin content and its release from poly (lactic acid) nanoparticles. J Pharm Anal. 2017;7:388–393. doi: 10.1016/j.jpha.2017.05.007. [DOI] [PMC free article] [PubMed] [Google Scholar]
- Muhammad-Aree S, Teepoo S. On-site detection of heavy metals in wastewater using a single paper strip integrated with a smartphone. Anal Bioanal Chem. 2020;412:1395–1405. doi: 10.1007/s00216-019-02369-x. [DOI] [PubMed] [Google Scholar]
- Özdemir GK, Bayram A, Kılıç V, Horzum N, Solmaz ME. Smartphone-based detection of dyes in water for environmental sustainability. Anal Methods. 2017;9:579–585. doi: 10.1039/C6AY03073D. [DOI] [Google Scholar]
- Pandey S, Oza G, Mewada A, Sharon M. Green synthesis of highly stable gold nanoparticles using Momordica charantia as nano fabricator. Arch Appl Sci Res. 2012;4:1135–1141. [Google Scholar]
- Paul B, Tiwari A. A brief review on the application of gold nanoparticles as sensors in multi dimensional aspects. IOSR J Environ Sci Toxicol Food Technol. (IOSR-JESTFT) 2015;1:1–7. [Google Scholar]
- Ram Talib NS, Halmi MIE. Artificial neural networks (ANNs) and response surface methodology (RSM) approach for modelling the optimization of chromium (VI) reduction by newly isolated Acinetobacter radioresistens strain NS-MIE from agricultural soil. BioMed Res Int. 2019;2019:5785387. doi: 10.1155/2019/5785387. [DOI] [PMC free article] [PubMed] [Google Scholar]
- Saha K, Agasti SS, Kim C, Li X, Rotello VM. Gold nanoparticles in chemical and biological sensing. Chem Rev. 2012;112:2739–2779. doi: 10.1021/cr2001178. [DOI] [PMC free article] [PubMed] [Google Scholar]
- Sahlani M, Halmi MIE, Masdor NA, Wasoh H, Syed MA, Shukor MY. A rapid inhibitive assay for the determination of heavy metals using α-chymotrypsin; a serine protease. Nanobio and BioNano. 2014;1:41–46. [Google Scholar]
- Sanusi SNA, Halmi MIE, Abdullah SRS, Hassan HA, Hamzah FM, Idris M. Comparative process optimization of pilot-scale total petroleum hydrocarbon (TPH) degradation by Paspalum scrobiculatum L. Hack using response surface methodology (RSM) and artificial neural networks (ANNs) Ecol Eng. 2016;97:524–534. doi: 10.1016/j.ecoleng.2016.10.044. [DOI] [Google Scholar]
- Selamat SN, Halmi MIEB, Abdullah SRS, Idris M, Hasan HA, Anuar N. Optimization of lead (Pb) bioaccumulation in Melastoma malabathricum L. by response surface methodology (RSM) Rendiconti Lincei Scienze Fisiche e Naturali. 2018;29:43–51. doi: 10.1007/s12210-017-0656-5. [DOI] [Google Scholar]
- Shahbazi N, Zare-Dorabei R. A novel “off-on” fluorescence nanosensor for sensitive determination of sulfide ions based on carbon quantum dots and gold nanoparticles: central composite design optimization. Microchem J. 2019;145:996–1002. doi: 10.1016/j.microc.2018.12.022. [DOI] [Google Scholar]
- Shukor M, Masdor N, Baharom N, Jamal J, Abdullah M, Shamaan N, Syed M. An inhibitive determination method for heavy metals using bromelain, a cysteine protease. Appl Biochem Biotechnol. 2008;144:283–291. doi: 10.1007/s12010-007-8063-5. [DOI] [PubMed] [Google Scholar]
- Shukor M, Bakar N, Othman A, Yunus I, Shamaan N, Syed M. Development of an inhibitive enzyme assay for copper. J Environ Biol. 2009;30:39–44. [PubMed] [Google Scholar]
- Sivakumar R, Lee NY. Recent progress in smartphone-based techniques for food safety and the detection of heavy metal ions in environmental water. Chemosphere. 2021;275:130096. doi: 10.1016/j.chemosphere.2021.130096. [DOI] [PubMed] [Google Scholar]
- Souza AS, dos Santos WN, Ferreira SL. Application of Box-Behnken design in the optimisation of an on-line pre-concentration system using knotted reactor for cadmium determination by flame atomic absorption spectrometry. Spectrochim Acta, Part B. 2005;60:737–742. doi: 10.1016/j.sab.2005.02.007. [DOI] [Google Scholar]
- Srivastava S, Sharma V. Ultra-portable, smartphone-based spectrometer for heavy metal concentration measurement in drinking water samples. Appl Water Sci. 2021;11:1–8. doi: 10.1007/s13201-021-01519-w. [DOI] [Google Scholar]
- Sun J, Lu Y, He L, Pang J, Yang F, Liu Y. Colorimetric sensor array based on gold nanoparticles: design principles and recent advances. TrAC, Trends Anal Chem. 2020;122:115754. doi: 10.1016/j.trac.2019.115754. [DOI] [Google Scholar]
- Turkevich J, Stevenson PC, Hillier J. A study of the nucleation and growth processes in the synthesis of colloidal gold. Discuss Faraday Soc. 1951;11:55–75. doi: 10.1039/df9511100055. [DOI] [Google Scholar]
- Wang X, Li F, Cai Z, Liu K, Li J, Zhang B, He J. Sensitive colorimetric assay for uric acid and glucose detection based on multilayer-modified paper with smartphone as signal readout. Anal Bioanal Chem. 2018;410:2647–2655. doi: 10.1007/s00216-018-0939-4. [DOI] [PubMed] [Google Scholar]
- Wang H, et al. Semiquantitative visual detection of lead ions with a smartphone via a colorimetric paper-based analytical device. Anal Chem. 2019;91:9292–9299. doi: 10.1021/acs.analchem.9b02297. [DOI] [PubMed] [Google Scholar]
- Xing Y, Zhu Q, Zhou X, Qi P. A gold nanoparticle-based colorimetric mercury (II) biosensor using a DNA probe with phosphorothioate RNA modification and exonuclease III-assisted signal amplification. Microchim Acta. 2020;187:1–8. doi: 10.1007/s00604-020-4184-0. [DOI] [PubMed] [Google Scholar]
- Ye B-J, et al. Evaluation of mercury exposure level, clinical diagnosis and treatment for mercury intoxication. Ann Occup Environ Med. 2016;28:1–8. doi: 10.1186/s40557-015-0086-8. [DOI] [PMC free article] [PubMed] [Google Scholar]
- Zhang G. Functional gold nanoparticles for sensing. Appl Nanotechnol Rev. 2013;2:269–288. doi: 10.1515/ntrev-2012-0088. [DOI] [Google Scholar]
- Zin KM, Effendi Halmi MI, Abd Gani SS, Zaidan UH, Samsuri AW, Abd Shukor MY. Microbial decolorization of triazo dye, direct blue 71: an optimization approach using response surface methodology (RSM) and artificial neural network (ANN) BioMed Res Int. 2020 doi: 10.1155/2020/2734135. [DOI] [PMC free article] [PubMed] [Google Scholar]
Associated Data
This section collects any data citations, data availability statements, or supplementary materials included in this article.
Data Availability Statement
The presented data is available from the corresponding author on reasonable request.