

Abstract
Atomoxetine hydrochloride (ATX) is a potent and non-stimulant drug which was approved for the treatment of attention-deficit hyperactivity disorder. Owing to its importance, two green, simple and validated spectrofluorimetric methods were developed for its sensitive assay in pure and capsule forms. The first method (Method I) relied on measuring the enhanced fluorescence of ATX by the use of sodium dodecyl sulfate in alkaline medium at λex 227 nm/λem 298 nm. The second method (Method II) involved complex formation of ATX with Erythrosine B (EB) in aqueous acidic solution resulting in quantitative quenching of the EB naive fluorescence. This complex was formed in the presence of Britton–Robinson buffer (pH 4.0). The difference in fluorescence intensity was measured at λex 527/λem550 nm. The calibration curves were linear through the ranges of 0.2–2.0 µg ml−1 for Method I, 0.2–4.0 µg ml−1 for Method II with good correlation coefficient (r = 0.9998) for both methods. The suggested methods were perfectly applied for determination of ATX in its commercial capsules and content uniformity test. The greenness of the proposed methods was confirmed by three different assessment tools and it was found that both methods were green, eco-friendly and environmentally safe.
Keywords: atomoxetine, spectrofluorimetry, SDS, Erythrosine B, content uniformity testing, green analysis
1. Introduction
Atomoxetine HCl (figure 1a) is chemically defined as (3R)-N-Methyl-3-(2-methylphenoxy)-3-phenylpropan-1-amine hydrochloride [1]. It is a potent and selective norepinephrine reuptake inhibitor used to treat attention-deficit hyperactivity disorder in children, adolescents and adults [2].
Figure 1.

Chemical structure of ATX (a) and EB (b).
ATX is official in the United States Pharmacopeia (USP) [3] as well as in the British Pharmacopeia (BP) [4]. USP recommended an HPLC method for the assay of ATX using C8 column and acetonitrile/phosphate buffer in the ratio (38 : 62 V/V) as a mobile phase with UV detection at 220 nm [3]. BP also recommended a liquid chromatographic method using end capped octylsilyl silica gel column with UV detection at 215 nm. The mobile phase used for separation is a mixture of propanol and 0.059% sodium octanesulfonate solution in phosphoric acid (pH 2.5) in the ratio (27:73 V/V) [4].
Literature shows that there are many analytical methods for the assay of ATX in different matrices as spectrofluorimetric [5,6], spectrophotometric [5,7,8], HPLC [9–12], electrochemical [13,14], capillary electrophoretic [15] and LC-MS [16–19] methods.
Most of the reported methods relied on chromatographic techniques which suffered from many disadvantages such as expensive instruments, higher quantities of hazardous solvents required, the need for a highly trained person, and a tedious and time-consuming sample pre-treatment process. On the other side, the spectroscopic methods are simpler and rapid with low cost. In addition, spectrofluorimetric methods have the merits of being more sensitive and selective. The previously reported spectrofluorimetric methods are based on the drug reactions with either 4-Chloro-7-nitrobenzo-2-oxa-1,3-diazole (NBD-CL) in alkaline medium [5] or eosin in acidic medium [6].
Although the reported method [5] is more sensitive (10.0–500.0 ng ml−1), the proposed methods are more rapid, simpler and do not require heating or time for the reaction to proceed. Moreover, the suggested methods are greener because they use a green solvent (water) while the reported method [5] used a non-green and hazardous organic solvent (methanol).
Reviewing the literature showed that no spectrofluorimetric method has been published about the native fluorescence of ATX. In addition, none of the previously published fluorimetric methods [5,6] include assessment of a method's greenness.
The proposed techniques aimed to develop two spectrofluorimetric methods for sensitive and selective determination of ATX. The proposed methods depended on either the enhanced native fluorescence of ATX in alkaline organized medium or the formation of ion-pair complex with Erythrosine B (EB) in acidic medium. These proposed methods were efficaciously applied to the assay of ATX in pure form and commercial capsules. In addition, the content uniformity testing and assessment of method greenness were performed. Furthermore, the limiting logarithmic method and stern volmer plots were used to explain the mechanism of formation of ATX-EB complex.
2. Practical
2.1. Instrumentation
Fluorescence intensity (FI) was measured using a fluorescence spectrophotometer (Agilent Cary Eclipse, USA) and the sensitivity was adjusted at 800 for Method I and 650 for Method II. Standard quinine sulfate solution was used to check the calibration and linearity of the device.
A Jenway 3510 pH meter was used for adjusting pH (UK).
A water bath from England Cambridge Ltd (Shaker) was used to monitor the temperature.
2.2. Materials and reagents
HPLC grade solvents and analytical reagent grade chemicals were used.
Atomoxetine hydrochloride (ATX) was kindly obtained as a gift from Multi-Apex Pharma S.A.E, (Badr City, Cairo, Egypt) with a purity of 99.93 ± 1.84% as calculated by the comparison method [4].
Atomox Apex® capsules claimed to contain 10 mg and 40 mg with batch no. 25 960 and 25 963, respectively (Multi-Apex Pharma S.A.E, Badr City, Cairo, Egypt).
Aqueous solution (1.7 × 10⁻⁴ M) of Erythrosine B was prepared (Acros-organics, Belgium).
Acetonitrile, methanol and ethanol (Fisher Scientific UK, Loughborough, Leics (UK)).
Sodium dodecyl sulfate (SDS), tween-80, β-cyclodextrin, phosphoric acid, acetic acid, hydrochloric acid, boric acid and sodium hydroxide were bought from El-Gomhouria Company (Mansoura, Egypt), but cetrimide was obtained from Winlab (UK).
1.0% (w/v) aqueous solutions of all organized media were prepared.
2.3. Buffer solutions
Britton–Robinson buffer (BRB) solution was prepared over a pH range 2.0–12.0 by mixing equimolar (0.04 M) of boric acid, acetic acid and phosphoric acid with equal volumes. Then, 0.2 M NaOH solution was used to adjust the pH. [20]
Borate buffer with pH range 6.0–10.0 was obtained by adding the appropriate volume of 0.2 M of sodium hydroxide to 0.2 M boric acid.
2.4. Standard solution preparation
0.02 g of ATX was dissolved in distilled water to prepare an aqueous stock solution (200 µg ml−1) for both methods (I and II). Then standard working solutions were prepared by further dilution of the stock solution with distilled water.
The solution was stored in a refrigerator at 2–8°C and was stable for at least 14 days.
2.5. Procedures
2.5.1. Construction of calibration curves
2.5.1.1. Method I
Various volumes of ATX aqueous solution were added to a series of volumetric flasks (10 ml), then 1.3 ml of 1 M NaOH and 0.7 ml of 1% SDS solution were added. The resulting solutions were then completed with distilled water to the mark and mixed well. The relative fluorescence intensities (RFIs) of the ATX final solutions were instantaneously measured at λex 227 nm / λem 298 nm parallel with blank measurement. Then a calibration curve was constructed by plotting RFI values against drug concentrations to obtain the corresponding regression equation.
2.5.1.2. Method II
Various volumes of ATX aqueous solution were added to a set of volumetric flasks (10 ml), then 1.0 ml of BRB solution (pH 4.0) and 0.6 ml of 1.7 × 10⁻⁴ M EB solution were added. Flasks were completed to the volume with distilled water and mixed well. The difference in FI of EB before and after the addition of ATX (ΔF) was immediately measured at 550 nm after being excited at 527 nm. The study was performed simultaneously against a blank measurement. ΔF values were plotted against ATX final concentration (μg ml−1) to obtain the desired calibration curve where the corresponding regression equation can be obtained.
2.5.2. Analysis of atomoxetine hydrochloride in Atomox Apex® capsules 40 mg
Ten capsules were weighed, evacuated and their contents were mixed well. A quantity equivalent to 20.0 mg of ATX was taken from the mixed powder and added to a 100 ml volumetric flask, then completed to mark with distilled water, sonicated for about 45 min and filtered. Next, procedures under §2.5.1. were performed as illustrated before. From pre-constructed calibration curves for both methods, the correlative regression equations were used to obtain ATX concentration in its pharmaceutical dosage form.
2.5.3. Content uniformity testing
Ten capsules of Atomox Apex® 10 mg were evacuated separately and each capsule content was added to a volumetric flask (100 ml) then completed with distilled water to the mark, sonicated for 45 min and filtered. The procedures in §2.5.1 for both methods to determine ATX concentration in its commercial capsules were then applied and each capsule % found was obtained from the previously established calibration curves for both methods. The test was performed according to the United States Pharmacopeial Guidelines [21].
3. Results and discussion
ATX has a relatively low intrinsic fluorescence in water at λex 222/λem301 nm, as shown in figure 2. So, two methods have been described for improving its sensitivity. The first method is based on using an ionic surfactant (SDS) solution in alkaline medium which leads to greatly enhanced ATX fluorescence (350%). This enhanced FI was measured at 298 nm after being excited at 227 nm as indicated in figure 3. This suggested procedure led to the development of a highly sensitive technique for estimation of ATX in its pure and pharmaceutical dosage form.
Figure 2.

Excitation and emission fluorescence spectra of (a,b) blank (water). (a′, b′) native fluorescence of ATX (2.0 µg ml−1) in water.
Figure 3.

Excitation and emission fluorescence spectra of (a,b) blank alkaline SDS solution (1.3 ml of 1 M NaOH + 0.7 ml of 1% SDS). (a′, b′) ATX (0.9 µg ml−1) in alkaline SDS solution (1.3 ml of 1 M NaOH + 0.7 ml of 1% SDS).
The fluorescence quenching technique is another method that was adopted to increase the sensitivity of the ATX analysis in pure form and capsules. It is based on the fact that the EB aqueous solution exhibits a very high native FI in acidic medium at 554 nm when excited at 527 nm. After addition of ATX to EB in BRB solution (pH 4.0), a non-fluorescent ion-pair was formed producing a remarkable decrease in the EB FI as in figure 4.
Figure 4.

Excitation and emission fluorescence spectra of (a,b) blank EB (1.7 × 10⁻⁴ M) in BRB (pH 4.0). (a′, b′) ATX (2.0 µg ml−1) complex with EB(1.7 × 10⁻⁴ M).
EB (figure 1b) was previously used for estimation of compounds of pharmaceutical interest such as flubendazole and mebendazole [22], tamoxifen citrate and clomiphene citrate [23] and duloxetine [24]. It is an acidic dye which has a free phenolic hydroxyl group that more readily ionized in slightly acidic conditions (pH 4.0). Under the same acidic conditions, the cationic form of ATX is predominant because of the ionization of its secondary amino group. Then, two compounds form a complex via electrostatic interaction between the two oppositely charged ions.
3.1. Experimental conditions optimization
Different parameters affecting both suggested methods were then studied and optimized.
3.1.1. Method I
3.1.1.1. Effect of organized media
RFI of ATX was examined using different organized media like SDS, tween 80, cetrimide and β-cyclodextrin. It was found that cetrimide had no effect, while β-cyclodextrin and tween 80 decreased RFI of ATX. However, RFI was enhanced greatly in the presence of SDS. Therefore, SDS was used in this study.
3.1.1.2. Effect of 1% sodium dodecyl sulfate volume
Different volumes of 1% SDS (0.1–2 ml) were examined and it was found that 0.7 ml was the best volume (figure 5).
Figure 5.

Effect of volume of (1.0% w/v) SDS solution on native FI of ATX (2.0 µg ml−1).
3.1.1.3. Effect of pH
To study this effect, 0.2 M borate buffer of pH range 6.0–10.0, 0.2 M BRB buffer of pH range 2.0–12.0, 1 M NaOH and 1 M HCl were tried. It was found that using the buffer media and 1 M HCl had no significant effect. However, the RFI of ATX was increased by using 1 M NaOH solution. Hence, it was used during this study.
3.1.1.4. The effect of volume of 1 M NaOH
Different volumes of 1 M NaOH were tried and it was found that 1.3 ml achieved the optimal RFI of ATX (figure 6)
Figure 6.

Effect of volume of 1 M NaOH on FI of ATX (2.0 µg ml−1).
3.1.1.5. The effect of different diluting solvents
Different solvents like methanol, distilled water, ethanol and acetonitrile were tried. It was found that the greatest RFI value was obtained by using distilled water as a diluting solvent during this work. (figure 7)
Figure 7.

Effect of different diluting solvents on FI of ATX (2.0 µg ml−1).
3.1.2. Method II
3.1.2.1. The effect of Britton–Robinson buffer solution pH and volume
The formation and stability of ATX-EB complex were significantly influenced by the pH of BRB solution. So, different pH values (2.0–8.0) were tried (figure 8a). The maximum ΔF value was observed by using pH 4.0. It has been observed that decreasing or increasing the pH values from 4.0 results in decreasing ΔF values. Consequently, BRB of pH 4.0 ± 0.1 was used in this work to obtain the greatest sensitivity.
Figure 8.

(a) Effect of pH of BRB on the fluorescence quenching of EB by ATX (2.0 µg ml−1). (b) Effect of volume of BRB (pH 4.0) on the fluorescence quenching of EB by ATX (2.0 µg ml).
The effect of BRB volume was studied in the range of 0.2–2 ml. It was found that ΔF values slightly increased by increasing the BRB volume to 1 ml, and after that no more increase or even decrease was obtained. Consequently, 1.0 ml of BRB (pH 4.0) was the best choice for ATX-EB ion-pair formation (figure 8b).
3.1.2.2. The effect of Erythrosine B volume
The effect of volume of 1.7 × 10⁻⁴ M EB on ΔF values was observed over the range 0.2–1.4 ml. The greatest ΔF values were obtained by using 0.6 ± 0.1 ml of EB (figure 9).
Figure 9.

Effect of volume of EB (1.7 × 10⁻⁴ M) on the complex formation with ATX (2.0 µg ml−1).
3.1.2.3. The effect of organized media
For the sake of optimizing the ATX quenching effect on the native FI of EB, different organized media, such as SDS, tween 80, cetrimide and β-cyclodextrin were tried. It was found that no positive effect on ΔF values was obtained by using these organized media. Therefore, none of them were used in this work.
3.1.2.4. The effect of different diluting solvent
To select the most suitable solvent for the reaction between ATX and EB, different solvents, such as ethanol, methanol, acetonitrile and distilled water were tried. It was found that the highest ΔF values were observed by using distilled water. So, it was the best solvent of choice throughout this study.
3.1.2.5. The effect of time on atomoxetine hydrochloride–Erythrosine B complex formation and stability
The reaction between ATX and EB was studied at different periods. It was found that the reaction was instantaneous and the resulting complex was stable for about 100 min.
3.2. Atomoxetine hydrochloride and Erythrosine B reaction mechanism
3.2.1. The stoichiometry of the reaction between atomoxetine hydrochloride and Erythrosine B
The molar ratio was attained by applying the limiting logarithmic method [25]. By plotting log ΔF values against log[ATX] and log ΔF versus log[EB], two straight lines were obtained, and their slopes were calculated and found to be 0.90 and 0.99, respectively. (figure 10a,b).
Figure 10.

Stoichiometry of the reaction between ATX with EB using limiting logarithmic method.
This proved a 1 : 1 molar reactivity. This ratio was explained by the presence of one amino group in ATX. The ATX positively charged amino group reacted with the EB negatively charged hydroxyl group by electrostatic interactions, leading to the ion-pair complex formation. Based on the obtained molar ratio, the reaction mechanism between ATX and EB was proposed in scheme 1.
Scheme 1.

The reaction mechanism for complex formation between ATX and EB.
3.2.2. The mechanism of quenching of the ion-pair between atomoxetine hydrochloride and Erythrosine B
There are various examples of molecular interactions that cause quenching of fluorescence, [26] such as molecular rearrangement, static, dynamic quenching, excited-state and energy transfer reactions. Consequently, the Stern–Volmer method [27,28] was applied to determine quenching type in the suggested EB–ATX interaction. The Stern–Volmer plots were obtained by plotting F°/F versus [Q] according to the equation:
where KSV is the Stern–Volmer quenching constant, [Q] is the molar concentration of ATX, F and F0 are the EB fluorescence intensities with and without the addition of ATX, respectively.
It was found from the linear relationship (r = 0.99, 0.99 and 0.99) between F0/F and [Q] that there is only one type of quenching process (static or dynamic) as shown in (figure 11a).
Figure 11.

(a) Stern–Volmer plot for fluorescence quenching at 303 K, 313 K and 323 K. (b) Modified Stern–Volmer plot for fluorescence quenching at 303 K, 313 K and 323 K.
ΔF were measured at room and high temperatures (301–313–323)°K to determine the type of quenching process and by constructing Stern–Volmer plots at these raised temperatures, it was shown that KSV increased at elevated temperature indicating a dynamic quenching behaviour [27–29] (table 1).
Table 1.
Summary of the Stern–Volmer method for the reaction of ATX with EB.
| temperature (°K) | Stern–Volmer quenching constant (KSV) × 106 (l mol−1) | correlation coefficient (r) | bimolecular quenching constant (Kq) × 1015 (L mol−1 S) |
|---|---|---|---|
| 301 | 0.2696 | 0.99 | 3.03 |
| 313 | 0.2809 | 0.99 | 3.16 |
| 323 | 0.2961 | 0.99 | 3.33 |
Moreover, the bimolecular quenching constant (Kq), which is an indicator of the efficiency of the fluorescence and accessibility of the EB (fluorophore) to ATX (the quencher), can be calculated, according to equation [29]:
where KSV is the Stern–Volmer quenching constant and τ0 is the native radiation lifetime of EB (89 ps) [30]. Kq is the bimolecular quenching constant. It was found that the calculated values of Kq were 3.03 × 10¹⁵, 3.16 × 10¹⁵ and 3.33 × 10¹⁵ l mol−1 S−1 at (301–313–323)°K, respectively.
3.2.3. Calculation of the rate constants (Kb), binding sites and free energy changes (ΔG°)
By using the modified Stern–Volmer plot (figure 11b), the number of binding sites (n) and rate constant of the reaction between ATX and EB (Kb) can be calculated from the following equation [31,32]:
where Kb is the reaction rate constant, n is the binding sites number, [D] is the ATX molar concentration, F0 and F are the FI of EB in the absence and presence of ATX, respectively. Kb was calculated and found to be 16.74 × 10⁵ l mol−1 and the number of binding sites was approximately one. This confirms the molar ratio (1 : 1) resulting from the limiting logarithmic method as shown in table 2.
Table 2.
Binding sites, rate constants and free energy changes.
| temperature (°K) | reaction rate constant (Kb) (×105 l mol−1) | n | Gibb's free energy (ΔG) (kJ mol−1) |
|---|---|---|---|
| 301 | 16.7492 | 1.1647 | −35.616 |
| 313 | 2.7980 | 1.000 | −33.216 |
| 323 | 1.2711 | .9234 | −31.215 |
Using the Kb value within the following equation to calculate Gibb's free energy (ΔG°):
where Kb is the reaction rate constant, R (8.314 J K−1 mol−1) is the universal gas constant and T is the temperature in Kelvin.
ΔG° was calculated and its value was −35.61 kJ mol−1 (table 2).
Furthermore, this negative value indicates the spontaneity and feasibility of the reaction at ambient temperature.
3.3. Validation of the two spectrofluorimetric methods
Both methods were validated according to (ICH) Guidelines [33]. All parameters of validation including linearity, range, accuracy, precision, specificity, limit of detection and limit of quantitation were studied.
3.3.1. Linearity and concentration range
For Method I: the constructed calibration curve shows a linear dependence of RFI values on ATX concentrations throughout the specified range (0.2–2.0 µg ml−1). The derived regression equation was
For Method II: The calibration curve was obtained by plotting (ΔF) values versus corresponding concentrations of the ATX, linearity was achieved within the range 0.2–4.0 µg ml−1 and the resulting regression equation was as follows:
Correlation coefficients (r), intercepts (a) and slopes (b) for the calibration data for both methods are elucidated in table 3.
Table 3.
Performance data for the determination of ATX using the proposed methods.
| parameters | Method I | Method II |
|---|---|---|
| linearity range (µg ml−1) | 0.2–2.0 | 0.2–4.0 |
| intercept (a) | 14.58 | 7.16 |
| slope (b) | 183.98 | 97.62 |
| correlation coefficient (r) | 0.9998 | 0.9998 |
| s.d. of residuals (Sy/x) | 2.93 | 2.83 |
| s.d. of intercept (Sa) | 2.28 | 1.90 |
| s.d. of slope (Sb) | 1.88 | 0.84 |
| s.d. | 1.28 | 1.45 |
| % RSD | 1.28 | 1.44 |
| % error | 0.52 | 0.59 |
| LOD (µg ml−1) | 0.04 | 0.06 |
| LOQ (µg ml−1) | 0.12 | 0.19 |
High correlation coefficients proved the excellent linearity [34] of the suggested methods. Moreover, the small values of the intercept s.d. (Sa), slope standard deviation (Sb) and residual standard deviation (Sy/x) indicated small degree scattering of the points around the calibration curves (table 3).
3.3.2. Accuracy
Six different concentrations through the specified range were analysed three times. The obtained results showed high degree of closeness between the true and measured values. In addition, the obtained values from Student's t-test and variance ratio F-test of both methods were lower than the tabulated ones [34], indicating that there was no significant difference between the two suggested methods and the comparison method. The comparison method described the spectrofluorimetric technique using eosin in acidic medium [6]. These obtained results show the good accuracy of both suggested methods (table 4).
Table 4.
Assay results for the determination of ATX in the pure form using proposed and comparison methods. N.B the tabulated t- and F-values at p = 0.05 are 2.31 and 5.41, respectively [34].
| parameter | Method I |
Method II |
comparison method [6] | ||
|---|---|---|---|---|---|
| conc. taken (µg ml−1) | % founda | conc. taken (µg ml−1) | % founda | % founda | |
| 0.2 | 100.00 | 0.2 | 101.00 | 98.40 | |
| 0.4 | 98.25 | 0.5 | 101.80 | 100.40 | |
| 0.8 | 99.13 | 1.0 | 101.60 | 102.30 | |
| 1.2 | 102.00 | 2.0 | 98.05 | 98.60 | |
| 1.6 | 100.31 | 3.0 | 99.30 | ||
| 2.0 | 99.30 | 4.0 | 100.73 | ||
| mean | 99.83 | 100.41 | 99.93 | ||
| s.d. | 1.28 | 1.45 | 1.84 | ||
| t-test | 0.10 | 0.47 | |||
| F-test | 2.04 | 1.63 | |||
aEach result is the mean of three separate determinations.
3.3.3. Precision
Intra-day precision (repeatability) and inter-day (intermediate) precision for both methods were determined by analysing three different concentrations three times in the same day and over three successive days (table 5).
Table 5.
Precision data for the determination of ATX using the proposed methods.
| method | conc. (µg ml−1) | intra-day precision |
inter-day precision |
||||
|---|---|---|---|---|---|---|---|
| mean ± s.d. | % RSD | % error | mean ± s.d. | % RSD | % error | ||
| Method I | 0.4 | 98.62 ± 1.05 | 1.06 | 0.61 | 97.72 ± 0.68 | 0.69 | 0.40 |
| 1.2 | 101.19 ± 0.46 | 0.45 | 0.26 | 101.87 ± 0.22 | 0.22 | 0.13 | |
| 2.0 | 99.10 ± 0.29 | 0.30 | 0.17 | 98.63 ± 0.14 | 0.14 | 0.08 | |
| Method II | 1.0 | 100.21 ± 1.03 | 1.02 | 0.59 | 101.06 ± 0.78 | 0.77 | 0.45 |
| 2.0 | 97.73 ± 0.52 | 0.53 | 0.30 | 97.99 ± 0.26 | 0.27 | 0.15 | |
| 3.0 | 99.30 ± 0.34 | 0.34 | 0.19 | 99.47 ± 0.17 | 0.17 | 0.10 | |
The good repeatability and reliability of both suggested methods were confirmed by very low % RSD values.
3.3.4. Sensitivity
The limits of detection (LOD = 3.3 Sa/b) and limits of quantification (LOQ = 10 Sa/b) were calculated (table 3) according to ICH guidelines [33], where Sa is the intercept standard deviation and b is the slope of the calibration curve.
The small values of LOD and LOQ for both methods confirmed the good sensitivity of both methods.
3.3.5. Robustness
For evaluation of the robustness of both developed methods, minor modifications in the experimental parameters were carried out, such as 1% SDS volume (0.7 ± 0.1 ml), 1 M NaOH volume (1.3 ± 0.1 ml) for Method I and 0.2 M BRB pH (4.0 ± 0.1) and 1.7 × 10⁻⁴ M EB volume (0.6 ± 0.1 ml) for Method II.
It was observed that the resulting values were nearly constant with these minor modifications, which confirmed the robustness of the two proposed methods (table 6).
Table 6.
Robustness of the suggested techniques for ATX.
| parameter | mean ± s.d. | % RSD |
|---|---|---|
| Method I | ||
| 1% SDS volume (0.7 ± 0.1 ml), | 99.78 ± 0.92 | 0.92 |
| 1 M NaOH volume (1.3 ± 0.1 ml) | 97.22 ± 0.68 | 0.70 |
| Method II | ||
| pH of 0.2 M BRB solution (4.0 ± 0.1) | 99.43 ± 0.54 | 0.54 |
| 1.7 × 10⁻⁴ M EB volume (0.6 ± 0.1 ml) | 96.71 ± 0.51 | 0.53 |
3.3.6. Specificity
Specificity for both methods was confirmed by determining ATX in its pharmaceutical dosage forms and table 7 showed good % was found without any interference from the excipients and additives in ATX capsules, which confirmed the good specificity of both methods.
Table 7.
Assay results for the determination of ATX in commercial capsules.
| parameter | Method I |
Method II |
comparison method [6] | ||
|---|---|---|---|---|---|
| conc. taken (µg ml−1) | % founda | conc. taken (µg ml−1) | % founda | % founda | |
| Atomox Apex ® capsules (40.0 mg ATX/cap) | 0.2 | 101.69 | 0.2 | 102.77 | 101 |
| 0.4 | 98.13 | 0.5 | 100.21 | 99.9 | |
| 0.8 | 102.19 | 1.0 | 102.25 | 98.4 | |
| 1.2 | 100.29 | 2.0 | 98.67 | 100.85 | |
| 1.6 | 99.33 | 3.0 | 102.59 | ||
| mean | 99.93 | 101.29 | 100.03 | ||
| s.d. | 1.78 | 1.79 | 1.19 | ||
| t- test | 0.10 (2.36)b | 0.67 (2.31)b | |||
| F-test | 2.22 (9.01)b | 3.61 (9.11)b | |||
aEach result is the mean of three separate determinations.
bThe values between brackets tabulated t- and F- values at p = 0.05[34].
3.4. Applications
3.4.1. Pharmaceutical dosage form
Both methods were applied for the determination of ATX in Atomox Apex® capsules and the obtained results were compared statistically with the results of the comparison method [6] (table 7) by using Student's t-test and variance ratio F-test [34]. These results showed that the calculated values were smaller than the tabulated ones, which indicates that there was no significant difference in the accuracy and precision of both methods. The good sensitivity, accuracy and precision of both methods confirms the suitability of these methods for analysis of ATX in its dosage forms.
3.4.2. Content uniformity test
The proposed methods were perfectly suitable for testing content uniformity of ATX in its commercial capsules because of their high sensitivity and ability to determine ATX in single capsule extract with sufficient accuracy and precision. The test steps were performed following USP guidelines [21], where the acceptance value (AV) was calculated and found to be less than the maximum allowed value AV (L1) [21]. These results indicate the excellent uniformity of ATX in its commercial capsules (table 8).
Table 8.
Results of content uniformity test using the proposed methods.
| parameter | capsule no. | percentage of the label claim (Method I) | percentage of the label claim (Method II) |
|---|---|---|---|
| data | 1 | 100.01 | 97.77 |
| 2 | 97.81 | 98.41 | |
| 3 | 99.33 | 101.29 | |
| 4 | 98.32 | 102.88 | |
| 5 | 102.73 | 99.05 | |
| 6 | 99.16 | 98.73 | |
| 7 | 98.69 | 99.69 | |
| 8 | 100.08 | 102.25 | |
| 9 | 99.37 | 100.97 | |
| 10 | 102.05 | 101.61 | |
| mean | 99.75 | 100.27 | |
| s.d. | 1.56 | 1.76 | |
| %RSD | 1.56 | 1.75 | |
| acceptance value (AV) | 3.74 | 4.22 | |
| max. allowed AV (L1) [21] | 15.00 | 15.00 |
3.5. Assessment of greenness of the proposed methods
Recently the greenness of an analytical method has had the same importance as its sensitivity since it protects humans from the harmful effects of chemicals. The analytical method is considered green if it is performed without the use of toxic organic solvents, time-consuming derivatization procedures, hazardous waste production and excessive energy consumption.
There are various techniques to assess the greenness of analytical methods, including: The National Environmental Methods Index (NEMI) [35], analytical eco-scale score [36] and recently the Green Analytical Procedure Index (GAPI) [37].
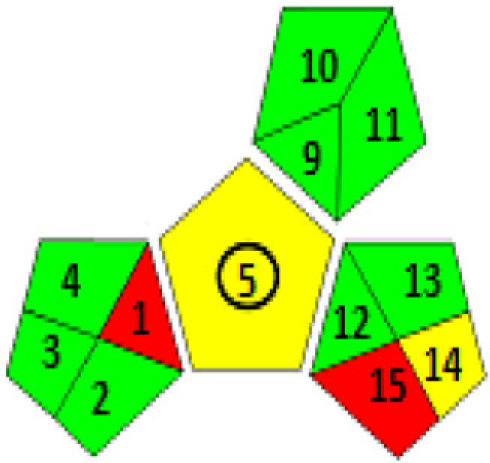
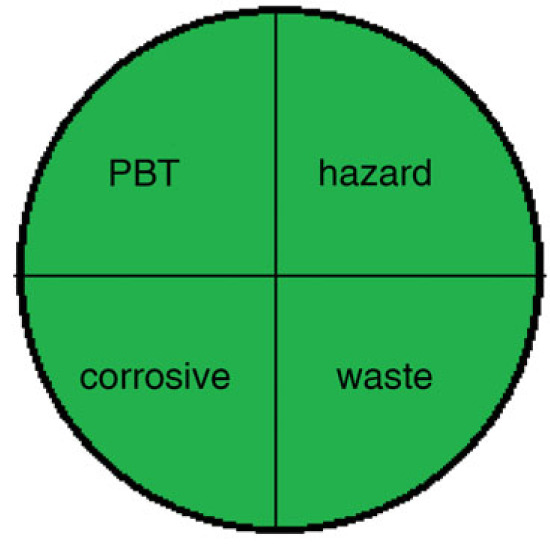
These assessment methods were applied to the proposed techniques, as in table 9. The NEMI pictogram was carried out and revealed that these methods met all the criteria to be green. The used reagents were not considered persistent, bio accumulative, toxic [38] and hazardous [39] by the EPA's Toxic Release Inventory [40,41], volume of waste was less than 50 g or L and pH value was found to be within the range 2–12. Even though NEMI is time-consuming and provides only qualitative determination, it is a feasible readable technique [35].
Table 9.
Results for assessment of greenness of the proposed methods.
| (1) Green Analytical Procedure Index (GAPI) For both methods | |
 |
 |
| Method I | Method II |
| (2) NEMI pictogram for both methods | |
 |
 |
| Method I | Method II |
| (3) analytical eco-scale score for both methods | |
| for Method I | |
| item | penalty points |
| 1-reagent | |
| SDS, 0.7 ml | 0 |
| 2-spectrofluorimeter | 0 |
| 3-occupational hazard | 0 |
| 4-waste | 3 |
| total penalty points | 3 |
| analytical eco- scale score | 97 |
| for Method II | |
| item | penalty points |
| 1-reagent | |
| EB, 0.6 ml | 1 |
| BRB, 1 ml | 2 |
| 2-spectrofluorimeter | 0 |
| 3-occupational hazard | 0 |
| 4-waste | 3 |
| total penalty points | 6 |
| analytical eco-scale score | 94 |
Analytical eco-scale is a semi-quantitative tool which relies on various factors including the hazardousness and amount of reagents, waste production and method of treatment, and energy consumed. It requires that the total penalty points are calculated and subtracted from 100 (reference value) and the nearer the value to 100, the greener the analytical method. In these suggested techniques, the score was 97 for Method I and 94 for Method II, confirming the excellent greenness of these approaches [36].
In addition, a new technique was recently developed for evaluating the greenness [GAPI]. It also applies a pictogram to assess the environmental effect of each stage of an analytical method by the use of colour scale of three levels: green, yellow and red, indicating low, medium and high environmental effect. [37].
Table 9 illustrates that the major criteria of GAPI were fulfilled in these proposed techniques except for fields 1,15 (red) which related to the off-line sampling and no treatment of the waste, respectively. And fields 5,14 were coloured yellow because of carrying out the sampling procedure and the formation of 10 ml waste per sample, respectively. Despite this, GAPI was applied for the estimation of ATX in their capsules; the outcomes were coloured yellow, indicating simple preparation (filtration) and the usage of green solvent (distilled water). Overall, these results indicated the greenness of the proposed techniques and their safety for humans and the environment.
4. Conclusion
Two green, simple and economic spectrofluorimetric methods were described and validated as per the ICH Guidelines [33] for sensitive determination of ATX in its pure and commercial capsules. These methods involved simple measurement of either the enhanced native fluorescence of ATX or its quenching effect on the EB native fluorescence.
The suggested methods are accurate, specific and highly sensitive for application to the assay of ATX in its capsules and to verify the content uniformity of capsules. Furthermore, neither method required complicated handling associated with other techniques such as HPLC or capillary electrophoresis and did not use hazardous organic solvents, which means they are time saving, cost effective and have a lower impact on the environment. In addition, the assay used a simple fluorimetric apparatus which made the presented techniques perfectly suitable for routine quality control in pharmaceutical manufacturing based on their greenness, high sensitivity and selectivity.
Ethics
Our work did not include any ethical issues.
Data accessibility
The data are available from the Dryad Digital Repository: https://doi.org/10.5061/dryad.280gb5mt4 [42].
Authors' contributions
N.T.B.: conceptualization, data curation, formal analysis, investigation, methodology, software, validation, writing—original draft and writing—review and editing; A.E.: supervision and writing—review and editing; M.E.F.: conceptualization, project administration, supervision and writing—review and editing.
All authors gave final approval for publication and agreed to be held accountable for the work performed therein.
Conflict of interest declaration
We declare that we have no competing interests.
Funding
We received no funding for this study.
References
- 1.Moffat AC, Osselton MD, Widdop B, Galichet LY. 2011. Clarke's analysis of drugs and Poisons, 4th edn. London, UK: Pharmaceutical Press. [Google Scholar]
- 2.Buckingham R. 2020. Martindale: the complete drug reference, 40th edn. London, UK: Pharmaceutical Press. [Google Scholar]
- 3.The United States Pharmacopeia. 2017 The United States Pharmacopoeia, 40th revision: the National Formulary, 35th ed. Rockville, MD: United States Pharmacopeial Convention.
- 4.The British Pharmacopoeia Commission. 2022 The British Pharmacopoeia, pp. 223-225. London, UK: The Stationery Office.
- 5.Ulu ST. 2011. Spectrophotometric and spectrofluorimetric determination of atomoxetine in pharmaceutical preparations. Pharmazie 66, 831-835. [PubMed] [Google Scholar]
- 6.Derayea SM, Omar MA, Abu-Hassan AA. 2018. Studying the association complex formation of atomoxetine and fluvoxamine with eosin Y and its application in their fluorimetric determination. R. Soc. Open Sci. 5, 170943. ( 10.1098/rsos.170943) [DOI] [PMC free article] [PubMed] [Google Scholar]
- 7.Koradia SK, Shah PT, Rana RR, Vaghani SS, Pandey S, Jivani NP. 2009. Spectrophotometric determination of atomoxetine hydrochloride from its pharmaceutical dosage forms. Asian J. Res. Chem. 2, 258-259. [Google Scholar]
- 8.Raghubabu K, Santhi Swarup L, Kalyana Ramu B, Narayanarao M, Ramdas C. 2011. Assay of atomoxetine hydrochloride in bulk and its solid dosage forms by visible spectrophotometry using two aromatic aldehydes. Rasayan J. Chem. 4, 784-789. [Google Scholar]
- 9.Patel SK, Patel NJ. 2010. Development and validation of a stability-indicating RP-HPLC method for determination of atomoxetine hydrochloride in tablets. J. AOAC Int. 93, 1207-1214. ( 10.1093/jaoac/93.4.1207) [DOI] [PubMed] [Google Scholar]
- 10.Faridi N, Ghasemi N, Qomi M, Ramezani M. 2019. Prediction of the trace amounts of atomoxetine in biological samples using optimized solvent bar microextraction technique coupled with HPLC-UV. J. Appl. Chem. Res. 13, 28-41. [Google Scholar]
- 11.Sumalatha M, Kumar DB, Geetha A, Sisira S, Shruthi A. 2012. Validated RP-HPLC method for the estimation of atomoxetine in pharmaceutical dosage forms. Int. J. Res. Pharm. Biomed. Sci. 3, 1147-1152. [Google Scholar]
- 12.Ulu ST. 2012. Sensitive high performance liquid chromatographic method for determination of atomoxetine in Plasma and urine precolumn derivatization with 1-dimethyl amino naphthalene-5-sulphonyl chloride. J. Liq. Chromatogr. 35, 747-756. ( 10.1080/10826076.2011.608232) [DOI] [Google Scholar]
- 13.Pérez-Ortiz M, Muñoz C, Zapata-Urzúa C, Álvarez-Lueje A. 2010. Electrochemical behavior of atomoxetine and its voltammetric determination in capsules. Int. J. Pure Appl. Chem. 82, 398-403. [DOI] [PubMed] [Google Scholar]
- 14.Abu shawish H, Saadeh S, Tamous H, Tbaza A. 2018. Determination of atomoxetine hydrochloride in biological fluids using potentiometric carbon paste electrode modified by TiO2 Nano particles. Acta. Chim. Slov. 65, 811-822. ( 10.17344/acsi.2018.4383) [DOI] [PubMed] [Google Scholar]
- 15.Zeng H, Yang R, Zhang Y, Lib JJ, Qub L. 2015. Capillary electrophoresis coupled with electrochemiluminescence for determination of atomoxetine hydrochloride and the study on its interactions with three proteins. Luminescence 3, 124-130. ( 10.1002/bio.2700) [DOI] [PubMed] [Google Scholar]
- 16.Marchei E, Papaseit E, Garcia-Algar OQ, Farrè M, Pacifici R, Pichini S. 2012. Determination of atomoxetine and its metabolites in conventional and non-conventional biological matrices by liquid chromatography–tandem mass spectrometry. J. Pharm. Biomed. Anal. 60, 26-31. ( 10.1016/j.jpba.2011.11.009) [DOI] [PubMed] [Google Scholar]
- 17.Papaseit E, Marchei E, Mortali C, Aznar G, Garcia-Algar OQ, Farrè M, Pacifici R, Pichini S. 2012. Development and validation of a liquid chromatography–tandem mass spectrometry assay for hair analysis of atomoxetine and its metabolites: application in clinical practice. Forensic Sci. Int. 218, 62-67. ( 10.1016/j.forsciint.2011.10.012) [DOI] [PubMed] [Google Scholar]
- 18.Appel DI, Brinda B, Markowitz JS, Newcorn JH, Zhu HJ. 2012. A liquid chromatography/tandem mass spectrometry assay for the analysis of atomoxetine in human plasma and in vitro cellular samples. Biomed. Chromatogr. 26, 1364-1370. ( 10.1002/bmc.2706) [DOI] [PMC free article] [PubMed] [Google Scholar]
- 19.Choi CI, Jang CG, Bae JW, Lee SY. 2013. Validation of an analytical LC-MS/MS method in human plasma for the pharmacokinetic study of atomoxetine. J. Anal. Chem. 68, 986-991. ( 10.1134/S1061934813110051) [DOI] [Google Scholar]
- 20.Britton HTS, Robinson RA. 1931. Universal buffer solutions and the dissociation constant of veronal. J. Chem. Soc. 0, 1456. [Google Scholar]
- 21.The United States Pharmacopeia.2009 The United States Pharmacopeia 32, the National formulary 27, Electronic version. Rockville, MD: US Pharmacopeial Convention.
- 22.Derayea SM, Hamad AA, Ali R, Ali HRH. 2019. Investigating erythrosine B as a fluorimetric probe for the determination of benzimidazole drugs via facile complexation reaction. Microchem. J. 149, 104-124. ( 10.1016/j.microc.2019.104024) [DOI] [Google Scholar]
- 23.Tolba MM, Salim MM. 2021. Insights for applying erythrosine B as a green fluorescence probe for estimation of anticancer tamoxifen and its analog; clomiphene in nanogram concentration. Spectrochim. Acta A Mol. Biomol. Spectrosc. 263, 120-156. ( 10.1016/j.saa.2021.120156) [DOI] [PubMed] [Google Scholar]
- 24.Derayea SM, Ali R, Abu-hassan AA. 2021. Two facile approaches based on association complex with erythrosine-B for nano-level analysis of duloxetine application to content uniformity. R. Soc. Open Sci. 9, 210922. ( 10.1098/rsos.210922) [DOI] [PMC free article] [PubMed] [Google Scholar]
- 25.Rose J. 1964. Advanced physicochemical experiments, p. 67. London, UK: Pitman. [Google Scholar]
- 26.Lakowicz JR. 2013. Principles of fluorescence spectroscopy, 2nd edn. Springer Science & Business Media. [Google Scholar]
- 27.Wang X, Wu P, Lv Y, Hou X. 2011. Ultrasensitive fluorescence detection of glutaraldehyde in water samples with bovine serum Albumin-Au nanoclusters. Microchem. J. 99, 327-331. ( 10.1016/j.microc.2011.06.004) [DOI] [Google Scholar]
- 28.Wu Q, Li C, Hu Y, Liu Y. 2009. Study of caffeine binding to human serum albumin using optical spectroscopic methods. Sci. China Ser. B 52, 2205-2212. ( 10.1007/s11426-009-0114-z) [DOI] [Google Scholar]
- 29.Afkham S, Hanaee J, Zakariazadeh M, Fathi F, Shafiee S, Soltani S. 2022. Molecular mechanism and thermodynamic study of Rosuvastatin interaction with human serum albumin using a surface plasmon resonance method combined with a multi-spectroscopic, and molecular modeling approach. Eur. J. Pharm. Sci. 168, 106005. ( 10.1016/j.ejps.2021.106005) [DOI] [PubMed] [Google Scholar]
- 30.Boens N, et al. 2007. Fluorescence lifetime standards for time and frequency domain fluorescence spectroscopy. Anal. Chem. 79, 2137-2149. ( 10.1021/ac062160k) [DOI] [PMC free article] [PubMed] [Google Scholar]
- 31.Bi S, Ding L, Tian Y, Song D, Zhou X, Liu X, Zhang H. 2004. Investigation of the interaction between flavonoids and human serum albumin. J. Mol. Struct. 703, 37-45. ( 10.1016/j.molstruc.2004.05.026) [DOI] [Google Scholar]
- 32.Ross PD, Subramanian S. 1981. Thermodynamics of protein association reactions: forces contributing to stability. Biochemistry 20, 3096-3102. ( 10.1021/bi00514a017) [DOI] [PubMed] [Google Scholar]
- 33.ICH 2013 ICH Harmonized Tripartite Guidelines, Validation of analytical procedures: text and methodology, Q2(R1). Geneva, Switzerland: International Conference on Harmonization.
- 34.Miller J, Miller JC. 2018. Statistics and chemometrics for analytical chemistry. London, UK: Pearson Education. [Google Scholar]
- 35.Tobiszewski M, Marc M, Galuszka A, Namiesnik J. 2015. Green chemistry metrics with special reference to green analytical chemistry. Molecules 20, 928-946. ( 10.3390/molecules200610928) [DOI] [PMC free article] [PubMed] [Google Scholar]
- 36.Gałuszka A, Migaszewski ZM, Konieczka P, Namieśnik J. 2012. Analytical eco-scale for assessing the greenness of analytical procedures. Trends Anal. Chem. 37, 61-72. ( 10.1016/j.trac.2012.03.013) [DOI] [Google Scholar]
- 37.Płotka-Wasylka J. 2018. A new tool for the evaluation of the analytical procedure: green analytical procedure index. Talanta 181, 204-209. ( 10.1016/j.talanta.2018.01.013) [DOI] [PubMed] [Google Scholar]
- 38.USEPA 2022 Persistent Bioaccumulative Toxic (PBT) Chemicals Covered by the TRI Program, United States Environmental Protection Agency. Washington, DC: USEPA. See https://www.epa.gov/toxics-release-inventory-tri-program/persistent-bioaccumulative-toxic-pbt-chemicals-covered-tri.
- 39.USEPA 2012 United States Environmental Protection Agency, Hazardous Waste Listings. Washington, DC: USEPA. See https://www.epa.gov/sites/production/files/2016-01documents/hw_listref_sep2012.pdf.
- 40.De La Guardia M, Ruzicka J. 1995. Guest editorial. Towards environmentally conscientious analytical chemistry through miniaturization, containment and reagent replacement. Analyst 120, 231. ( 10.1039/an9952000231) [DOI] [Google Scholar]
- 41.De La Guardia M, Khalaf KD, Carbonell V, Morales-Rubio A. 1995. Clean analytical method for the determination of propoxur. Anal. Chim. Acta. 308, 462-468. ( 10.1016/0003-2670(94)00625-V) [DOI] [Google Scholar]
- 42.Barakat NT, El-Brashy AM, Fathy ME. 2023. Data from: Two green spectrofluorimetric methods for the assay of atomoxetine hydrochloride in pure form and commercial capsules with application to content uniformity testing. Dryad Digital Repository. ( 10.5061/dryad.280gb5mt4) [DOI] [PMC free article] [PubMed]
Associated Data
This section collects any data citations, data availability statements, or supplementary materials included in this article.
Data Citations
- Barakat NT, El-Brashy AM, Fathy ME. 2023. Data from: Two green spectrofluorimetric methods for the assay of atomoxetine hydrochloride in pure form and commercial capsules with application to content uniformity testing. Dryad Digital Repository. ( 10.5061/dryad.280gb5mt4) [DOI] [PMC free article] [PubMed]
Data Availability Statement
The data are available from the Dryad Digital Repository: https://doi.org/10.5061/dryad.280gb5mt4 [42].