

Abstract
Many artificial intelligence models have been developed to predict clinically relevant biomarkers for colorectal cancer (CRC), including microsatellite instability (MSI). However, existing deep learning networks require large training datasets, which are often hard to obtain. In this study, based on the latest Hierarchical Vision Transformer using Shifted Windows (Swin Transformer [Swin‐T]), we developed an efficient workflow to predict biomarkers in CRC (MSI, hypermutation, chromosomal instability, CpG island methylator phenotype, and BRAF and TP53 mutation) that required relatively small datasets. Our Swin‐T workflow substantially achieved the state‐of‐the‐art (SOTA) predictive performance in an intra‐study cross‐validation experiment on the Cancer Genome Atlas colon and rectal cancer dataset (TCGA‐CRC‐DX). It also demonstrated excellent generalizability in cross‐study external validation and delivered a SOTA area under the receiver operating characteristic curve (AUROC) of 0.90 for MSI, using the Molecular and Cellular Oncology dataset for training (N = 1,065) and the TCGA‐CRC‐DX (N = 462) for testing. A similar performance (AUROC = 0.91) was reported in a recent study, using ~8,000 training samples (ResNet18) on the same testing dataset. Swin‐T was extremely efficient when using small training datasets and exhibited robust predictive performance with 200–500 training samples. Our findings indicate that Swin‐T could be 5–10 times more efficient than existing algorithms for MSI prediction based on ResNet18 and ShuffleNet. Furthermore, the Swin‐T models demonstrated their capability in accurately predicting MSI and BRAF mutation status, which could exclude and therefore reduce samples before subsequent standard testing in a cascading diagnostic workflow, in turn reducing turnaround time and costs.
Keywords: digital pathology, deep learning, colorectal cancer, biomarkers, Swin Transformer
Introduction
Artificial intelligence (AI) and deep learning (DL) models using hematoxylin and eosin (H&E)‐stained histology whole‐slide images (WSIs) have been developed to predict clinically relevant molecular biomarkers for colorectal cancer (CRC), such as microsatellite instability (MSI) [1, 2, 3], genetic mutations [4, 5, 6], tumor‐infiltrating lymphocytes (TILs) [7], and molecular subtypes [6, 8]. In particular, MSI prediction is of great clinical utility since it is one of the approved biomarkers to select patients for immune checkpoint inhibitors [9]. The US Food and Drug Administration (FDA) granted accelerated approval for anti‐PD1 antibodies (such as pembrolizumab and nivolumab) for the treatment of MSI‐high or mismatch repair deficient (dMMR) cancers, including CRC (the FDA's first tissue/site‐agnostic approval) [10, 11].
Kather et al [1] developed the first fully automated DL model for predicting MSI/dMMR status in CRC in 2019. Since then, multiple models have been published [1, 2, 3, 4, 6, 12, 13, 14, 15, 16, 17]. Recently, the Vision Transformer (ViT) [18] has emerged as a new modeling framework in the field of computer vision and has shown great potential to replace the convolutional neural network (CNN) [15, 18], which has been the backbone of the vast majority of DL models in digital pathology (including MSI models). Earlier versions of ViT still require very large datasets to achieve a performance comparable to that of CNN models [18, 19].
In the medical imaging domain, datasets are usually limited and often accompanied by weak (slide‐level) labels [20]. In addition, attention‐based DL models such as ViT are complex and data‐hungry in nature [20, 21]. These challenges pose a significant barrier to the development and application of DL models in digital pathology. For example, the current state‐of‐the‐art (SOTA) performance for predicting MSI status was achieved using extremely large pooled datasets from different studies (N > 8,000 WSIs) [12]. Therefore, achieving clinical‐grade prediction of MSI status and other key biomarkers for CRC using limited data remains an active research question. The latest Hierarchical Vision Transformer using Shifted Windows (Swin Transformer; Swin‐T hereafter) reduces computational complexity and can flexibly process pictures with different scales [19]. Therefore, Swin‐T may have the potential to circumvent the limitations of small datasets in medical image studies.
In this study, we aimed to develop an efficient workflow using Swin‐T that can use relatively small training datasets but achieve the best SOTA predictive performance for MSI status and other key biomarkers in CRC (BRAF mutation, TP53 mutation, CpG island methylator phenotype [CIMP], hypermutation, and chromosomal instability [CING]), using H&E‐stained images of colorectal tumors.
Materials and methods
The workflow for processing the WSIs and modeling the data is illustrated in Figure 1. In this study, we developed a novel Swin‐T‐based DL pipeline for predicting key biomarkers in CRC patients, including MSI status. This pipeline included two Swin‐T models: a tissue classifier to detect tumor tissue and a biomarker classifier to predict the binary biomarker status.
Figure 1.
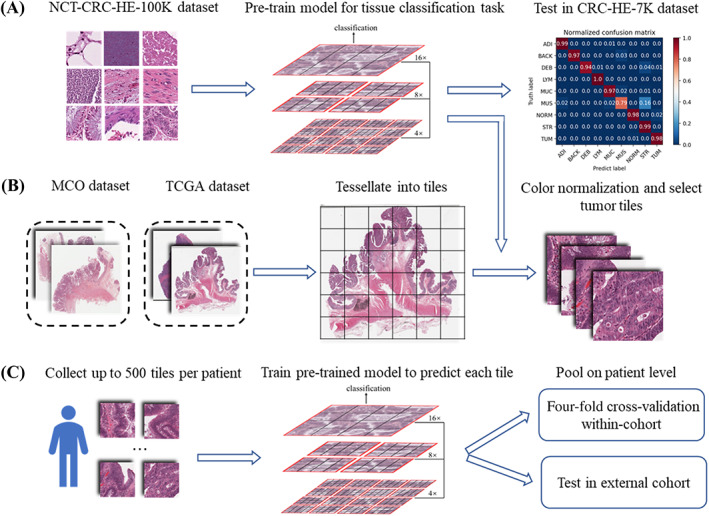
The workflow of the data preprocessing and the training process of the DL model. (A) Tiles images of NCT‐CRC‐HE‐100K are downloaded from the publicly available website (https://zenodo.org/record/1214456) to pre‐train a tissue classifier based on Swin‐T. The classifier has excellent performance of classifying tissues (overall accuracy = 96.3%) and detecting tumor tiles (accuracy = 98%) in an external dataset: CRC‐VAL‐HE‐7K. (B) WSIs in the SVS format of the MCO dataset and TCGA dataset are preprocessed to tessellate into nonoverlapping tiles with a size of 512 × 512 pixels. These tiles are then resized to the smaller 224 × 224 pixels tiles and color normalized. The tumor tiles are selected. (C) For each patient, up to 500 tiles are randomly sampled for subsequent experiments. The pre‐trained tissue classifier model in (A) is then fine‐tuned to predict biomarker status of each tile. The probability values of the tiles are averaged to derive the prediction at the patient level. The performance of the models is evaluated in two separate experiments: an intra‐cohort four‐fold cross‐validation and an inter‐cohort external validation.
Imaging and clinical data
Two international CRC datasets were analyzed in this study. The Molecular and Cellular Oncology (MCO) [22, 23] study prospectively enrolled more than 1,500 patients who underwent surgical resection for CRC between 1994 and 2010. Germline DNA from patients who had developed CRC and consented for genetic research studies was obtained for this study. For MSI status, all the ground‐truth labels of the MCO dataset were determined by MMR immunohistochemistry (IHC). The presence of BRAF mutation (V600E) was done by means of IHC, PCR assay, or Sanger sequencing. The MCO CRC dataset was made available through the SREDH Consortium (www.sredhconsortium.org, accessed on 15 November 2022).
The TCGA‐CRC dataset (‘The Cancer Genome Atlas’, publicly available at https://portal.gdc.cancer.gov/, USA) is a multicentric collection of tissue specimens, which include tumors of all stages in the TCGA‐COAD and TCGA‐READ datasets. For TCGA‐CRC, the ground‐truth labels of MSI were obtained by 5‐plex PCR [24] and the molecular analytical methods of other biomarkers were provided by Liu et al [24]. Anonymized H&E‐stained WSIs were collected from two datasets with matched genomic data. Details of selecting the patients and WSIs can be found in Supplementary materials and methods. All the items in the Standards for Reporting Diagnostic accuracy studies (STARD) are provided in supplementary material, Table S1.
Data preprocessing and training strategy
Scanned WSIs were downloaded in SVS format and tessellated into small image tiles. A Swin‐T tissue classifier was trained to detect and select tiles with tumor tissue using a publicly available dataset. A stepwise strategy was adopted during the model development. Additional details are provided in the Supplementary materials and methods.
Experimental setup
Three experiments were conducted to evaluate the performance of our Swin‐T models. First, we compared the predictive performance of the Swin‐T models with that of SOTA models for predicting six CRC biomarkers (hypermutation, MSI, CING, CIMP, BRAF, and TP53 mutations) from two recent publications [4, 6] using intra‐study cross‐validation. For all six biomarkers, we used the same training‐to‐test dataset split of The Cancer Genome Atlas colon and rectal cancer (TCGA‐CRC‐DX) dataset for four‐fold cross‐validation, used and published by Kather et al [6] or/and Bilal et al [4]. The split‐match of the TCGA‐CRC‐DX cohort facilitated the comparison of model performance with previous publications. In cross‐validation, one‐fold of the training set was used as the validation set to select the best‐performing model, which was saved for testing on the unseen test fold.
Second, the predictive performance of Swin‐T models was compared with SOTA models from recent publications using cross‐study external validation for predicting MSI and BRAF mutation [12, 15]. For the external validation experiments, the pre‐trained Swin‐T models were fine‐tuned using the MCO cohort to develop models for predicting MSI status, BRAF mutations, and CIMP status, as the molecular data for these three biomarkers are available in both TCGA and MCO cohorts. In this experiment, the fine‐tuned models were tested externally on the unseen TCGA‐CRC‐DX cohort to facilitate comparison with publications in which external validation was performed on the same cohort.
Finally, sensitivity analyses were performed to understand (1) the impact of the sample size of the training data on the performance of the Swin‐T models, (2) contributions of non‐tumor tissues to the model prediction, (3) impact of different aggregation strategies on the model prediction, (4) impact of overweighting, influential individual cases on model performance, and (5) impact of number of tumor tiles (surrogate for tumor volume) on model performance. Additional details are provided in the Supplementary materials and methods.
Statistical analyses
The predictive performance of the DL models was evaluated using different statistical metrics, such as the area under the receiver operating characteristic curve (AUROC) and the area under the precision‐recall curve (AUPRC). Please refer to the Supplementary materials and methods for more details.
Reader study
To identify signature and important histological features of MSI/true‐positive (TP) and microsatellite stable (MSS)/true‐negative (TN) samples and the potential reasons for misclassified cases, i.e. false‐positive (FP) and false‐negative (FN) cases, we carried out a reader study. An experienced pathologist (MMY), who was blinded to other clinicopathological features, reviewed representative cases (n = 20 TP/TN cases and n = 15 FP/FN). In addition, to better interpret the results of the reader study, the Grad‐CAM algorithm [25], a visualization method using Python package pytorch_grad_cam (https://github.com/jacobgil/pytorch-grad-cam), was applied to visualize the activation feature map of the Swin‐T model and interpret the model‐identified features.
Results
Swin‐T provides an excellent predictive performance
Intra‐study cross‐validation using the TCGA‐CRC‐DX dataset
In this experiment, six molecular biomarkers (MSI, hypermutation, CIMP, CING, BRAF mutation, and TP53 mutation) were predicted using Swin‐T. Kather et al [6] and Bilal et al [4] used the TCGA‐CRC‐DX dataset to develop and evaluate their DL models for MSI status and other key biomarkers for CRC, via intra‐study cross‐validation (Figure 2). To facilitate comparison with their existing models, we used the same patient cohort and the same four‐fold splits of the TCGA dataset published by Bilal et al [4].
Figure 2.
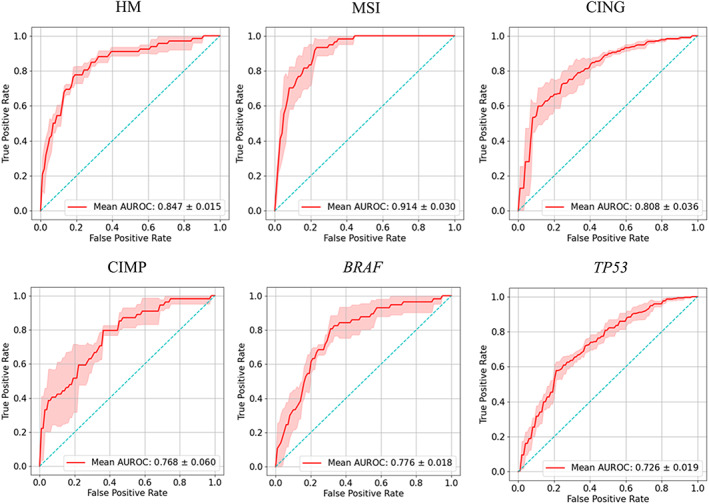
Predictive performance of four‐fold cross‐validation of Swin‐T based prediction of colorectal cancer biomarkers in the TCGA‐CRC‐DX cohort. AUROC plots for prediction of hypermutation (HM), MSI, CING, CIMP, BRAF mutation status, and TP53 mutation status. The true positive rate represents sensitivity and the false positive rate represents 1 − specificity. The red shaded areas represent the SD. The value in the lower right of each plot represents mean AUROC ± SD.
For predicting the MSI status, our Swin‐T model achieved a mean validation AUROC of 0.91 ± 0.03 (mean ± SD), which represented approximately 6 and 23% improvement over recently published AUROC values on the same dataset, 0.86 from Bilal et al [4] and 0.74 from Kather et al [13], respectively (Table 1). For predicting the hypermutation status, Swin‐T also outperformed the models developed by Kather et al [6] and Bilal et al [4] on the same dataset, and significantly improved the predictive performance. The AUROC based on Swin‐T was 0.85 ± 0.02, compared with 0.81 and 0.71 reported by Bilal et al [4] and Kather et al [6], respectively. Moreover, Swin‐T exhibited similar performance to that of Bilal et al [4] for predicting TP53 mutation status (AUROC = 0.73) but was significantly higher than that obtained by Kather et al [6] (AUROC = 0.64). Furthermore, although our mean cross‐validation AUROC values for predicting CING (versus genomic stability), BRAF mutation status, and high CIMP status were slightly lower than those reported by Bilal et al [4], the difference was only about 1–2%.
Table 1.
Comparison of predictive performance of Swin‐T for key CRC biomarkers with published models using four‐fold intra‐study cross validation on TCGA‐CRC‐DX
| AUROC | AUPRC | ||||
|---|---|---|---|---|---|
| Biomarker | Swin‐T | Kather et al [6] | Bilal et al [4] | Swin‐T | Bilal et al [4] |
| Microsatellite instability versus stability | 0.91 ± 0.02 | 0.74 | 0.86 ± 0.03 | 0.66 ± 0.09 | 0.62 ± 0.10 |
| High versus low mutation density | 0.85 ± 0.03 | 0.71 | 0.81 ± 0.04 | 0.58 ± 0.05 | 0.57 ± 0.09 |
| Chromosomal instability versus genomic stability | 0.82 ± 0.04 | 0.73 | 0.83 ± 0.02 | 0.90 ± 0.03 | 0.92 ± 0.01 |
| CIMP high versus CIMP low | 0.77 ± 0.06 | Not done | 0.79 ± 0.05 | 0.60 ± 0.15 | 0.51 ± 0.05 |
| BRAF | 0.77 ± 0.02 | 0.66 | 0.79 ± 0.01 | 0.35 ± 0.11 | 0.33 ± 0.05 |
| TP53 | 0.73 ± 0.02 | 0.64 | 0.73 ± 0.02 | 0.75 ± 0.02 | 0.78 ± 0.04 |
Numbers in bold represent the highest AUROC/AUPRC value for a biomarker.
Overall, for a fixed sample size of training set (the same TCGA‐CRC‐DX dataset), Swin‐T significantly improved the prediction of MSI and hypermutation status in intra‐study cross‐validation over published models. Moreover, Swin‐T achieved the SOTA performance in predicting TP53 mutations. Furthermore, Swin‐T provided similar or higher AUPRCs for MSI, hypermutation, CIMP, and BRAF mutation status compared with the models reported by Bilal et al [4], suggesting that the Swin‐T models could better predict positive results (MSI‐high, high mutation density, CIMP high, and BRAF mutants) with a lower false positive rate.
Cross‐study external validation using the TCGA‐CRC‐DX dataset
The generalizability of a model is often evaluated through cross‐study external validations. The TCGA‐CRC‐DX dataset has been used for the external validation of multiple AI models for predicting MSI status. In this experiment, we trained the Swin‐T model using the MCO dataset (N = 1,065) and externally validated the model using the TCGA‐CRC‐DX dataset to compare the model performance (Figure 3). The Swin‐T model yielded an excellent external validation AUROC of 0.904 (95% confidence interval [CI]: 0.849–0.952; Table 2). In comparison, Echle et al [12] trained a CNN model using a combined dataset from multiple large international studies (N = 7,917) and achieved a similar external‐validation AUROC of 0.91 (95% CI: 0.87–0.95). The model trained using ShuffleNet and a similar size of training data (N ranging from approximately 1,000 to 2,000) only produced AUROC values from 0.72 to 0.77 (Table 2) [13]. Therefore, Swin‐T achieved similar SOTA generalizability in external validation compared with the most recently published model trained on a large, pooled dataset.
Figure 3.
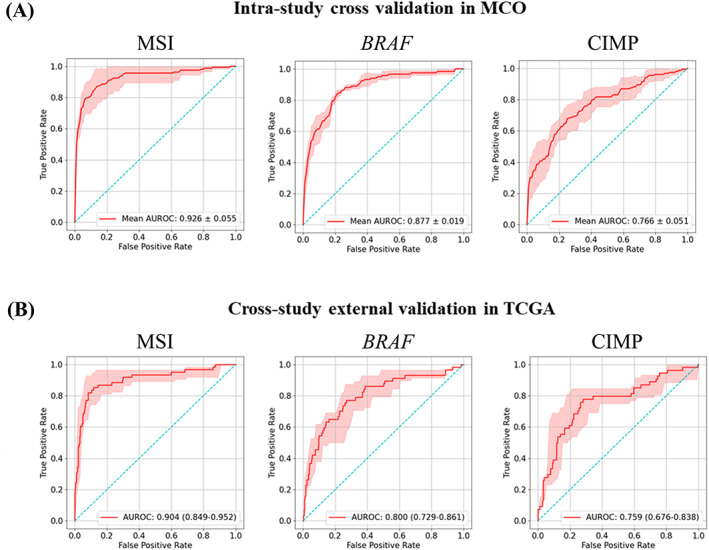
Predictive performance of intra‐cohort four‐fold cross‐validation in the MCO cohort and inter‐cohort external validation in the TCGA‐CRC‐DX cohort: MSI, BRAF mutation status (BRAF), CIMP. (A) AUROC plots for four‐fold cross‐validation in MCO cohort. The red shaded areas represent the SD. The value in the lower right of each plot represents mean AUROC ± SD. (B) AUROC plots for inter‐cohort external validation in TCGA‐CRC‐DX cohort. The red shaded areas represent the 95% confidence interval (CI), calculated by 1,000× bootstrap. The values in the lower right of each plot represent mean AUROC (95% CI).
Table 2.
Comparison of predictive performance of MCO‐trained Swin‐T for MSI status and BRAF mutation with published models using external validation on TCGA‐CRC‐DX
| Network | Training dataset | Number of training samples | AUROC (95% CI) | AUPRC (95% CI) |
|---|---|---|---|---|
| MSI | ||||
| Swin‐T (ours) | MCO | 1,065 | 0.90 (0.85–0.95) | 0.718 (0.605–0.820) |
| ViT [15] (2022) | DACHS | 2,069 | 0.89 (0.83–0.93) | 0.672 (0.558–0.769) |
| ResNet18 [12] (2022) | Pooled international datasets | 7,917 | 0.91 (0.87–0.95) | Not done |
| ShuffleNet [13] (2020) | QUASAR | 1,016 | 0.76 (0.70–0.79) | Not done |
| DACHS | 2,013 | 0.77 (0.73–0.79) | Not done | |
| NLCS | 2,197 | 0.72 (0.71–0.78) | Not done | |
| BRAF | ||||
| Swin‐T (ours) | MCO | 1,026 | 0.80 (0.74–0.87) | 0.392 (0.279–0.541) |
| EfficientNet [15] (2022) | DACHS | 2,069 | 0.81 (0.75–0.86) | 0.360 (0.253–0.487) |
Numbers in bold represent the highest AUROC/AUPRC value for a biomarker.
Swin‐T also displayed similar SOTA performance to previously published methods for predicting BRAF mutation status (AUROC: 0.80 versus 0.81) in external validation using the TCGA‐CRC‐DX dataset. It is worth noting that Swin‐T produced substantially better AUPRC values compared with previous publications for predicting both MSI status (AUROC: 0.66 versus 0.62) and BRAF mutation (AUROC: 0.35 versus 0.33).
Furthermore, the Swin‐T architecture demonstrated a great potential for minimizing overfitting, which is often observed in DL modeling, and produced very similar predictive performance between the training and external validation datasets. In the four‐fold cross‐validation experiment of the MCO dataset for predicting MSI status, Swin‐T achieved a mean AUROC value of 0.926 ± 0.055, compared to 0.904 (95% CI: 0.849–0.952) in the external validation dataset TCGA‐CRC‐DX. A similar pattern was observed for BRAF (AUROC: 0.88 versus 0.80) and CIMP (AUROC: 0.766 versus 0.759) (Figure 3).
Swin‐T models as diagnostic tools
Based on external validation using the TCGA‐CRC‐DX cohort, we also evaluated the feasibility of using Swin‐T models as diagnostic tools for MSI/dMMR status, BRAF mutation, and CIMP status, based on routine digitized H&E‐stained tissue slides of CRC (Figure 4). Computer‐based AI systems are often positioned as pre‐screening tools before the gold standard confirmatory tests [12]. Therefore, the clinical utility of these pre‐screening tools is primarily to minimize false negative predictions but exclude as many true negative samples as possible from the subsequent confirmatory test runs.
Figure 4.
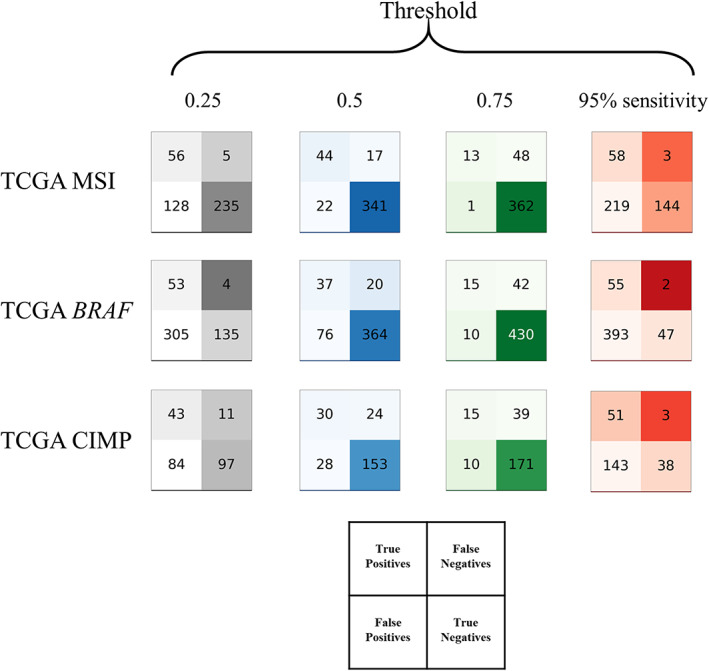
Test statistics for the pre‐screening tool. Test performance of MSI status, BRAF mutation, and CIMP status in the TCGA‐CRC‐DX cohorts displayed as patients classified true/false positive/negative by the Swin‐T model based on 95% sensitivity threshold and fixed thresholds (0.25, 0.5, and 0.75).
Pre‐screening for MSI status
For diagnostic purposes, a cutoff value is required to determine the diagnostic outcome. Table 3 shows that for a cutoff that can provide 95% sensitivity for detecting MSI‐high patients (cutoff = 0.16), the negative predictive value (NPV) was 98% and the false‐negative fraction (FNF) was 0.7%. Meanwhile, the true‐negative fraction (TNF) was 34% with this cutoff, which implied that 34% of patients could be safely excluded from confirmatory tests in clinical settings. Similar results were reported by Echle et al [12] for MSI detection. When a fixed cutoff of 0.25 was used, the sensitivity was reduced slightly to 92%. The NPV remained almost the same at 98%, whereas the FNF increased slightly to 1.2%. However, with a cutoff of 0.25, 55.4% of the patients were excluded from the confirmatory tests. These results confirmed previous reports that AI models can serve as pre‐screening purposes for MSI status [9, 12, 13].
Table 3.
Statistics results using different thresholds of external validation of predictions for MSI, BRAF, and CIMP status in the TCGA‐CRC‐DX cohort
| Biomarker | Threshold | Sensitivity | Specificity | PPV | NPV | TNF | FNF | F1 score |
|---|---|---|---|---|---|---|---|---|
| MSI | 0.160 | 0.95 | 0.402 | 0.209 | 0.980 | 0.340 | 0.007 | 0.343 |
| 0.250 | 0.918 | 0.647 | 0.304 | 0.979 | 0.554 | 0.012 | 0.457 | |
| 0.500 | 0.721 | 0.939 | 0.667 | 0.953 | 0.804 | 0.040 | 0.693 | |
| 0.750 | 0.213 | 0.997 | 0.928 | 0.883 | 0.853 | 0.113 | 0.346 | |
| MSI benchmark [12] | 0.220 | 0.950 | 0.530 | 0.250 | 0.980 | 0.465 | 0.007 | 0.400 |
| BRAF | 0.170 | 0.950 | 0.114 | 0.123 | 0.959 | 0.095 | 0.004 | 0.218 |
| 0.250 | 0.930 | 0.307 | 0.148 | 0.971 | 0.272 | 0.008 | 0.255 | |
| 0.500 | 0.649 | 0.827 | 0.327 | 0.948 | 0.732 | 0.040 | 0.435 | |
| 0.750 | 0.263 | 0.977 | 0.600 | 0.911 | 0.865 | 0.085 | 0.366 | |
| CIMP | 0.100 | 0.950 | 0.201 | 0.263 | 0.927 | 0.162 | 0.013 | 0.411 |
| 0.250 | 0.796 | 0.536 | 0.339 | 0.898 | 0.413 | 0.047 | 0.475 | |
| 0.500 | 0.556 | 0.845 | 0.517 | 0.864 | 0.651 | 0.102 | 0.536 | |
| 0.750 | 0.278 | 0.945 | 0.600 | 0.814 | 0.728 | 0.166 | 0.380 |
Statistics describe the different thresholds when the network is trained on MCO cohorts and tested on TCGA‐CRC‐DX cohort.
FNF, false‐negative fraction; NPV, negative predictive value; PPV, positive predictive value; TNF, true‐negative fraction (rule out).
Pre‐screening for BRAF mutation
For the Swin‐T model for BRAF mutations, the cutoff for 95% sensitivity was 0.17. At such a cutoff, the NPV was 96%, the FNF was 0.4%, and the TNF was 10%, suggesting that 10% of BRAF WT patients would be safely excluded from the gold standard confirmatory testing for BRAF mutation. However, if we used a fixed cutoff of 0.25, 27.2% of patients could be correctly determined as BRAF WT, whereas the false‐negative cases (patients incorrectly determined as BRAF WT) remained low (0.8%). Of the predicted BRAF WT cases, 96% were BRAF WT at a cutoff of 0.25. The Swin‐T model for BRAF mutations exhibited potential as a pre‐screening AI diagnostic tool for BRAF mutations.
Pre‐screening for CIMP status
A cutoff of 0.1 can provide 95% sensitivity for predicting CIMP status. At this cutoff, 1.3% CIMP high would be incorrectly identified as CIMP low, whereas 16.2% true CIMP low can be excluded from subsequent confirmatory molecular testing. However, when the cutoff was increased to 0.25, the false negatives substantially increased to approximately 5%. Therefore, the performance of the current Swin‐T model for the CIMP may not be optimal as a diagnostic tool.
Sensitivity analyses
Our sensitivity analyses (Supplementary results) demonstrated that (1) the Swin‐T models were robust with small training data (e.g. n = 250; supplementary material, Figure S1); (2) including non‐tumor tissues (normal mucosa or stroma) compromised the model prediction for MSI (supplementary material, Figure S2); (3) different aggregation methods produced similar prediction performance (supplementary material, Figure S3); (4) influential individual cases appeared not to have a large impact on the model prediction performance (supplementary material, Figure S4); and (5) more tumor volume may help to improve prediction of true MSI‐H status, but may not be able to reduce false negatives (supplementary material, Figure S5).
Swin‐T models improve interpretability
Coupling Swin‐T with the Grad‐CAM algorithm [25] could improve the interpretability of the model. The class activation mappings (CAMs) can produce heatmaps highlighting the areas that have greater attention weights of the Swin‐T model within a high‐resolution tile. The brighter the color of an area, the higher the attention scores assigned to this area by the model and more contributions to the model output. We implemented CAMs to visualize the results in a reader study.
The pathologist reviewed 20 TP cases with the highest predictive scores for MSI and 20 TN cases (MSS) with the lowest scores to identify signature pathological features for TP and TN samples. As the Swin‐T model highlighted in Figure 5A, the most apparent feature for the TP cases was the presence of mucus, i.e. 60% of the cases showed mucinous histology, such as mucinous adenocarcinoma and a large amount of mucus in the stroma. Second, 50% of the TP cases showed a large number of TILs (Figure 5B). The heatmaps of these cases showed that the Swin‐T model assigned higher attentions (brighter colors) to the lymphocytes in the stroma or tumor tissue (Figure 5B). In addition, 30% of TP cases showed poor differentiation (Figure 5C), and the representative H&E tiles and heatmaps displayed tumor cell growth in a solid pattern without well‐differentiated tumor tissue. Finally, 10% of cases exhibited a large number of signet‐ring tumor cells (Figure 5D), which is a known and special histological feature of MSI samples [26, 27, 28]. The most obvious signature for MSS samples was well‐moderately differentiated adenocarcinoma and orderly glands (i.e. spots with brighter colors identified in the heatmaps and the corresponding H&E tiles; Figure 5E). These findings were consistent with the pathological characteristics of MSI or MSS samples [26, 27, 28, 29], suggesting that CAMs for Swin‐T models could help pathologists to quickly zero‐in on the signature patterns of MSI and MSS samples, potentially improving the turnaround time.
Figure 5.
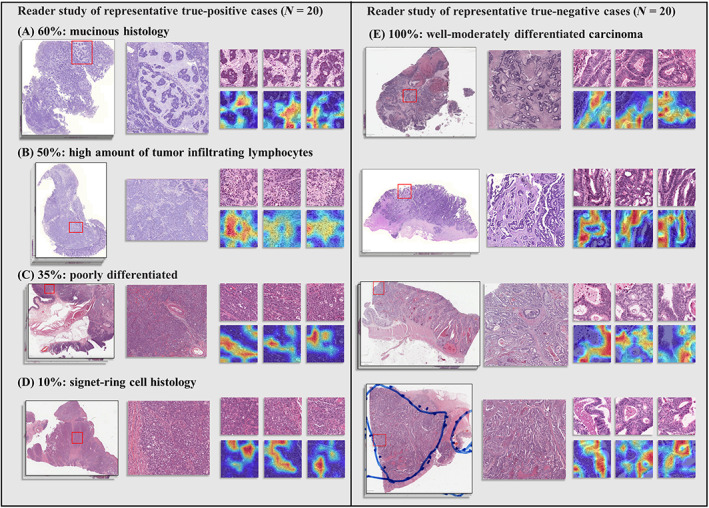
Visualization of the reader study of representative TP (MSI) and TN (MSS) cases. (A–D) Tissue slides for TP cases and signature pathological features identified by the pathologist. (E) Tissue slides for TN cases and signature pathological features identified by the pathologist.
Additionally, the model visualization can also help to analyze the potential reasons for misclassifications. Our pathologist reviewed 15 FP cases with the highest predictive scores for MSI and 15 FN cases with the lowest scores. The most common reason for the FP was abnormal staining (Figure 6A), i.e. 66.7% of the FP cases showed abnormal colors (e.g. purple and vague coloring), which led to false classification/identification of tumor tissue tiles. In addition, 20% of the FP cases showed poor differentiation (Figure 6B) with tumor cells having solid growth pattern highlighted in the heatmaps, compromising the model's performance. Furthermore, 13% of the FP cases showed a large number of TILs (Figure 6C), a signature feature for MSI [26, 27] as shown in our TP cases in Figure 5, and thereby were misclassified as positive cases. For the FN cases, 46.7% were well‐moderately differentiated carcinoma with mucinous histology (Figure 6D) while 20% were well‐moderately differentiated carcinoma without mucinous histology (Figure 6E). As shown in the heatmaps in Figure 6D,E, the model highlighted and assigned greater attention to the well‐moderately differentiated glands (a fingerprint for MSS samples), and therefore misclassified these samples. Misclassification reasons for 33% of FN cases could not be identified (Figure 6F). This might be due to uncommon morphology and/or abnormal staining in these samples. These results suggest that, in real‐world clinical implementation of the current AI models for predicting MSI status, pre‐screening by pathologists for samples with abnormal staining and well‐moderately differentiated mucinous adenocarcinoma may be needed. Future model refinement is warranted to mitigate the risk for FP and FN.
Figure 6.

Visualization of the reader study of representative misclassified cases. (A–C) Tissue slides for FP cases and potential confounding pathological features and misclassification reasons identified by the pathologist. (D–F) Tissue slides for FN cases and potential confounding pathological features and misclassification reasons identified by the pathologist.
Discussion
The Swin‐T backbone represents the most advanced, SOTA ViT network architecture, outperforming many popular de facto standard networks such as ResNet and EfficientNet, as well as early versions of ViT [18, 19]. It was proven that the Swin‐T could replace the classic CNN architecture and become a common backbone in the field of computer vision [19]. However, to our knowledge, despite having achieved great success in common computer vision tasks, our work represents the first attempt to evaluate the performance of Swin‐T in digital pathology and as a backbone network to further improve the predictive performance of MSI and biomarkers for molecular pathways in CRC.
To facilitate comparison with previously published models, the same dataset (TCGA‐CRC‐DX) and training‐to‐test split of the dataset from previous publications were used. In an intra‐study cross‐validation experiment, Swin‐T substantially outperformed models by Bilal et al [4] and Kather et al [13] for the prediction of MSI and hypermutation status. In addition, Swin‐T achieved a similar SOTA performance for predicting TP53 mutation status compared with that reported by Bilal et al [4]. Similar mean cross‐validation AUROC values were also obtained for predicting CING, BRAF mutation status, and high CIMP status compared with the current literature [4]. Swin‐T models also exhibited similar or higher AUPRCs for MSI, hypermutation, CIMP, and BRAF mutation status compared with previously published computational algorithms [4], indicative of greater power for handling imbalanced data, often seen in clinical studies. So far, DL models using H&E images have shown suboptimal prediction performance for KRAS mutation (AUROC = ~0.6), a key biomarker in CRC [4, 6]. Unfortunately, our preliminary modeling using Swin‐T also produced a similar, low, AUROC value for KRAS mutation (data not shown).
It is well known that DL models perform better with more available training data. This phenomenon has been observed in prediction models developed for MSI/dMMR status in CRC [13]. Recently, Echle et al trained a model using pooled dataset from nine patient cohorts of 8,343 patients across different countries and ethnicities, and achieved SOTA external prediction performance with an AUROC of 0.91, using the TCGA‐CRC‐DX cohort as the external validation dataset [12]. However, with smaller training data (QUASAR: N = 1,016; DACHS: N = 2,013; NLCS: N = 2,197), Echle et al (the same research group) obtained an AUROC of 0.72–0.77, with the same unseen external validation cohort [13]. Swin‐T demonstrated excellent generalizability in cross‐study external validation using the same TCGA‐CRC‐DX dataset and delivered a SOTA AUROC of 0.904 using a relatively smaller training dataset (MCO, N = 1,065), similar to what was achieved by Echle et al using ~8,000 samples (ResNet18). Our additional experiment revealed that Swin‐T was extremely efficient when using small training datasets. Using ~250 samples for training, the Swin‐T model still managed to produce better predictive performance than the model by Echle et al using ShuffleNet and training data of 1,000–2,000 samples [13]. These results suggest that our MSI model based on Swin‐T may be 5–10 times more efficient than current SOTA MSI algorithms based on ResNet18 and ShuffleNet.
Biomarker testing plays a critical role in the treatment of CRC patients. Importantly, immunotherapies, such as pembrolizumab and nivolumab, have been approved by health authorities to treat CRC patients with MSI‐high [10, 11]. The current clinical gold standard testing for MSI is based on IHC, which has a sensitivity of 94% and specificity of 88% [30, 31]. The motivation to develop AI‐based models is primarily to replace current lab‐based testing, reduce the turnaround time, and save costs. Unfortunately, thus far, no digital AI models for MSI have consistently achieved this performance threshold, including the most recent model developed by Echle et al [12]. Therefore, it is proposed to implement as a pre‐screening test, which primarily excludes and reduces the samples before the subsequent conventional IHC testing [12].
Recently, an AI‐based diagnostic solution, MSIntuit™ CRC, developed by Owkin (Paris, France), has been approved for use in Europe as pre‐screening for MSI (https://owkin.com/en/publications-and-news/press-releases/two-first-in-class-ai-diagnostic-solutions-for-breast-cancer-and-colorectal-cancer-developed-by-owkin-are-approved-for-use-in-europe). Our Swin‐T models for MSI and BRAF mutation could also serve as pre‐screening diagnostics to rule out MSS and BRAF WT samples. This may help to reduce the samples for time‐ and tissue‐consuming PCR or/and IHC testing [12], allowing for cost saving and more efficient testing. The ubiquitous availability of routine H&E slides makes implementation of the DL models particularly attractive for community hospitals where universal molecular biology tests may not be accessible [13]. In addition, the CAMs based on the Swin‐T models can help pathologists to concentrate their resources on model‐identified hot‐spots and therefore improve their efficiency and turnaround time.
Our approach also has limitations and may be further improved in the future. First, there is a significant association between MSI‐H and high‐grade dysplasia in adenomas [28], i.e. MSI is more likely present in adenomas with high‐grade dysplasia compared to adenomas with low‐grade dysplasia [29]. However, our current tissue classifier cannot identify these two types of tissue. Therefore, development of a tissue classifier that can differentiate high‐ and low‐grade dysplasia may further improve the predictive performance. Second, although we have shown the robustness of the model with small training datasets, it will be interesting to see how well the Swin‐T models can perform with large‐scale datasets such as the datasets used in Echle et al (n > 8,000) [12]. For example, when the sensitivity is fixed at 95%, even though our model for MSI provided the same NPV (98%) and FNF (0.7%) as Echle et al [12], the specificity and TNF (Table 3) appear somewhat lower than those of Echle et al [12]. Training the Swin‐T model on large‐scale datasets may further improve the model performance and its utility as a pre‐screening diagnostic. Finally, IHC is one of the current standard testing methods for MSI. However, so far, limited research has been done to simultaneously analyze consecutive H&E and IHC slides. Future research in this space may further improve the performance of current DL models for MSI status.
Conclusion
In this study, we developed a novel DL framework based on a Swin‐T backbone network to predict MSI status and other key biomarkers for CRC. We have demonstrated that novel Swin‐T‐based backbone networks have great utility in digital pathology and can improve the predictive performance for MSI and other key biomarkers in CRC. Our findings also demonstrate the potential of this Swin‐T‐based AI system as an important component in a cascading diagnostic workflow (pre‐screening + gold standard testing) for MSI and BRAF mutation status, which are important for patient selection in clinical trials and treatment guidance for immune checkpoint inhibitors and combinations of BRAF inhibitors/anti‐epidermal growth factor receptor therapies, respectively.
Author contributions statement
XSX, BG and HZ contributed to design of the research. JJ, XSX, XL and BG contributed to data acquisition. BG, MMY and XSX contributed to data analysis. BG, XSX, and HZ contributed to data interpretation. XSX, BG, JJ, MMY and HZ wrote the manuscript; and all authors critically reviewed the manuscript and approved the final version.
Supporting information
Supplementary materials and methods
Supplementary results
Figure S1. Predictive performance of Swin‐T for prediction of MSI status using different sizes of training data (MCO dataset)
Figure S2. Prediction performance (AUROC) of MSI status in the TCGA‐CRC‐DX cohort based on models using mixed tumor and nontumor tissues
Figure S3. Comparison of AUROC of different aggregation methods for MSI status, BRAF mutation, and CIMP status
Figure S4. Impact of influential samples on prediction performance (AUROC)
Figure S5. Relationships between tumor tile numbers and rates of TP, FP, FN, and FP based on the external validation of MSI status in the TCGA‐CRC‐DX cohort
Table S1. STARD checklist
Acknowledgements
The research of BG, XL, and HZ was partially supported by National Natural Science Foundation of China (No. 12171451 and No. 72091212) and Anhui Center for Applied Mathematics. JJ is funded by the Australian National Health and Medical Research Council (No. GNT1192469). JJ also acknowledges the funding support received through the Research Technology Services at UNSW Sydney, Google Cloud Research (award# GCP19980904) and NVIDIA Academic Hardware grant programs. We also would like to thank the SREDH Consortium's (www.sredhconsortium.org, accessed on 15 November 2022) Translational Cancer Bioinformatics working group for the access to the MCO CRC dataset.
Conflict of interest statement: XSX is an employee of Genmab, Inc. Genmab did not provide any funding for this study.
Contributor Information
Jitendra Jonnagaddala, Email: jitendra.jonnagaddala@unsw.edu.au.
Hong Zhang, Email: zhangh@ustc.edu.cn.
Xu Steven Xu, Email: sxu@genmab.com.
Data availability statement
The source code of this study is available at https://github.com/Boomwwe/SOTA_MSI_prediction.
References
References 32–35 are cited only in the supplementary material.
- 1. Kather JN, Pearson AT, Halama N, et al. Deep learning can predict microsatellite instability directly from histology in gastrointestinal cancer. Nat Med 2019; 25: 1054–1056. [DOI] [PMC free article] [PubMed] [Google Scholar]
- 2. Schmauch B, Romagnoni A, Pronier E, et al. A deep learning model to predict RNA‐Seq expression of tumours from whole slide images. Nat Commun 2020; 11: 1–15. [DOI] [PMC free article] [PubMed] [Google Scholar]
- 3. Yamashita R, Long J, Longacre T, et al. Deep learning model for the prediction of microsatellite instability in colorectal cancer: a diagnostic study. Lancet Oncol 2021; 22: 132–141. [DOI] [PubMed] [Google Scholar]
- 4. Bilal M, Raza SEA, Azam A, et al. Development and validation of a weakly supervised deep learning framework to predict the status of molecular pathways and key mutations in colorectal cancer from routine histology images: a retrospective study. Lancet Digit Health 2021; 3: e763–e772. [DOI] [PMC free article] [PubMed] [Google Scholar]
- 5. Fu Y, Jung AW, Torne RV, et al. Pan‐cancer computational histopathology reveals mutations, tumor composition and prognosis. Nat Cancer 2020; 1: 800–810. [DOI] [PubMed] [Google Scholar]
- 6. Kather JN, Heij LR, Grabsch HI, et al. Pan‐cancer image‐based detection of clinically actionable genetic alterations. Nat Cancer 2020; 1: 789–799. [DOI] [PMC free article] [PubMed] [Google Scholar]
- 7. Liu A, Li X, Wu H, et al. Prognostic significance of tumor‐infiltrating lymphocytes using deep learning on pathology images in colorectal cancers. arXiv preprint arXiv:11518 2022. [Not peer reviewed].
- 8. Sirinukunwattana K, Domingo E, Richman SD, et al. Image‐based consensus molecular subtype (imCMS) classification of colorectal cancer using deep learning. Gut 2021; 70: 544–554. [DOI] [PMC free article] [PubMed] [Google Scholar]
- 9. Echle A, Laleh NG, Schrammen PL, et al. Deep learning for the detection of microsatellite instability from histology images in colorectal cancer: a systematic literature review. ImmunoInformatics 2021; 3‐4: 100008. [Google Scholar]
- 10. Marcus L, Lemery SJ, Keegan P, et al. FDA approval summary: pembrolizumab for the treatment of microsatellite instability‐high solid tumors. Clin Cancer Res 2019; 25: 3753–3758. [DOI] [PubMed] [Google Scholar]
- 11. André T, Shiu K‐K, Kim TW, et al. Pembrolizumab in microsatellite‐instability–high advanced colorectal cancer. N Engl J Med 2020; 383: 2207–2218. [DOI] [PubMed] [Google Scholar]
- 12. Echle A, Laleh NG, Quirke P, et al. Artificial intelligence for detection of microsatellite instability in colorectal cancer – a multicentric analysis of a pre‐screening tool for clinical application. ESMO Open 2022; 7: 100400. [DOI] [PMC free article] [PubMed] [Google Scholar]
- 13. Echle A, Grabsch HI, Quirke P, et al. Clinical‐grade detection of microsatellite instability in colorectal tumors by deep learning. Gastroenterology 2020; 159: 1406–1416.e11. [DOI] [PMC free article] [PubMed] [Google Scholar]
- 14. Lee SH, Song IH, Jang HJ. Feasibility of deep learning‐based fully automated classification of microsatellite instability in tissue slides of colorectal cancer. Int J Cancer 2021; 149: 728–740. [DOI] [PubMed] [Google Scholar]
- 15. Laleh NG, Muti HS, Loeffler CML, et al. Benchmarking weakly‐supervised deep learning pipelines for whole slide classification in computational pathology. Med Image Anal 2022; 79: 102474. [DOI] [PubMed] [Google Scholar]
- 16. Schirris Y, Gavves E, Nederlof I, et al. DeepSMILE: contrastive self‐supervised pre‐training benefits MSI and HRD classification directly from H&E whole‐slide images in colorectal and breast cancer. Med Image Anal 2022; 79: 102464. [DOI] [PubMed] [Google Scholar]
- 17. Cao R, Yang F, Ma S‐C, et al. Development and interpretation of a pathomics‐based model for the prediction of microsatellite instability in colorectal cancer. Theranostics 2020; 10: 11080–11091. [DOI] [PMC free article] [PubMed] [Google Scholar]
- 18. Dosovitskiy A, Beyer L, Kolesnikov A, et al. An image is worth 16 × 16 words: transformers for image recognition at scale. arXiv preprint arXiv:11929 2020. [Not peer reviewed].
- 19. Liu Z, Lin Y, Cao Y, et al. Swin transformer: hierarchical vision transformer using shifted windows. In Proceedings of the IEEE/CVF International Conference on Computer Vision , 2021; 10012–10022.
- 20. Schrammen PL, Ghaffari Laleh N, Echle A, et al. Weakly supervised annotation‐free cancer detection and prediction of genotype in routine histopathology. J Pathol 2022; 256: 50–60. [DOI] [PubMed] [Google Scholar]
- 21. Guo B, Li X, Yang M, et al. A robust and lightweight deep attention multiple instance learning algorithm for predicting genetic alterations. arXiv preprint arXiv:00455 2022. [Not peer reviewed]. [DOI] [PubMed]
- 22. Jonnagaddala J, Croucher JL, Jue TR, et al. Integration and analysis of heterogeneous colorectal cancer data for translational research. Stud Health Technol Inform 2016; 225: 387–391. [PubMed] [Google Scholar]
- 23. Ward RL, Hawkins NJ. Molecular and cellular oncology (MCO) study tumour collection. UNSW Aust 2015. 10.4225/53/5559205bea135. [DOI] [Google Scholar]
- 24. Liu Y, Sethi NS, Hinoue T, et al. Comparative molecular analysis of gastrointestinal adenocarcinomas. Cancer Cell 2018; 33: 721–735.e8. [DOI] [PMC free article] [PubMed] [Google Scholar]
- 25. Selvaraju RR, Cogswell M, Das A, et al. Grad‐CAM: visual explanations from deep networks via gradient‐based localization. In Proceedings of the IEEE International Conference on Computer Vision , 2017; 618–626.
- 26. Greenson JK, Huang S‐C, Herron C, et al. Pathologic predictors of microsatellite instability in colorectal cancer. Am J Surg Pathol 2009; 33: 126–133. [DOI] [PMC free article] [PubMed] [Google Scholar]
- 27. Jenkins MA, Hayashi S, O'shea A‐M, et al. Pathology features in Bethesda guidelines predict colorectal cancer microsatellite instability: a population‐based study. Gastroenterology 2007; 133: 48–56. [DOI] [PMC free article] [PubMed] [Google Scholar]
- 28. Iino H, Simms L, Young J, et al. DNA microsatellite instability and mismatch repair protein loss in adenomas presenting in hereditary non‐polyposis colorectal cancer. Gut 2000; 47: 37–42. [DOI] [PMC free article] [PubMed] [Google Scholar]
- 29. Dabir PD, Bruggeling CE, van der Post RS, et al. Microsatellite instability screening in colorectal adenomas to detect Lynch syndrome patients? A systematic review and meta‐analysis. Eur J Hum Genet 2020; 28: 277–286. [DOI] [PMC free article] [PubMed] [Google Scholar]
- 30. Stjepanovic N, Moreira L, Carneiro F, et al. Hereditary gastrointestinal cancers: ESMO Clinical Practice Guidelines for diagnosis, treatment and follow‐up. Ann Oncol 2019; 30: 1558–1571. [DOI] [PubMed] [Google Scholar]
- 31. Hampel H, Frankel WL, Martin E, et al. Feasibility of screening for Lynch syndrome among patients with colorectal cancer. J Clin Oncol 2008; 26: 5783–5788. [DOI] [PMC free article] [PubMed] [Google Scholar]
- 32. Macenko M, Niethammer M, Marron JS, et al. A method for normalizing histology slides for quantitative analysis. In 2009 IEEE International Symposium on Biomedical Imaging: From Nano to Macro. IEEE, 2009; 1107–1110.
- 33. Kather JN, Krisam J, Charoentong P, et al. Predicting survival from colorectal cancer histology slides using deep learning: a retrospective multicenter study. PLoS Med 2019; 16: e1002730. [DOI] [PMC free article] [PubMed] [Google Scholar]
- 34. Courtiol P, Maussion C, Moarii M, et al. Deep learning‐based classification of mesothelioma improves prediction of patient outcome. Nat Med 2019; 25: 1519–1525. [DOI] [PubMed] [Google Scholar]
- 35. Courtiol P, Tramel EW, Sanselme M, et al. Classification and disease localization in histopathology using only global labels: a weakly‐supervised approach. arXiv preprint arXiv:02212 2018. [Not peer reviewed].
Associated Data
This section collects any data citations, data availability statements, or supplementary materials included in this article.
Supplementary Materials
Supplementary materials and methods
Supplementary results
Figure S1. Predictive performance of Swin‐T for prediction of MSI status using different sizes of training data (MCO dataset)
Figure S2. Prediction performance (AUROC) of MSI status in the TCGA‐CRC‐DX cohort based on models using mixed tumor and nontumor tissues
Figure S3. Comparison of AUROC of different aggregation methods for MSI status, BRAF mutation, and CIMP status
Figure S4. Impact of influential samples on prediction performance (AUROC)
Figure S5. Relationships between tumor tile numbers and rates of TP, FP, FN, and FP based on the external validation of MSI status in the TCGA‐CRC‐DX cohort
Table S1. STARD checklist
Data Availability Statement
The source code of this study is available at https://github.com/Boomwwe/SOTA_MSI_prediction.