

Abstract
Pseudomonas aeruginosa is a Gram‐negative bacterium causing morbidity and mortality in immuno‐compromised humans. It produces a lectin, LecB, that is considered a major virulence factor, however, its impact on the immune system remains incompletely understood. Here we show that LecB binds to endothelial cells in human skin and mice and disrupts the transendothelial passage of leukocytes in vitro. It impairs the migration of dendritic cells into the paracortex of lymph nodes leading to a reduced antigen‐specific T cell response. Under the effect of the lectin, endothelial cells undergo profound cellular changes resulting in endocytosis and degradation of the junctional protein VE‐cadherin, formation of an actin rim, and arrested cell motility. This likely negatively impacts the capacity of endothelial cells to respond to extracellular stimuli and to generate the intercellular gaps for allowing leukocyte diapedesis. A LecB inhibitor can restore dendritic cell migration and T cell activation, underlining the importance of LecB antagonism to reactivate the immune response against P. aeruginosa infection.
Keywords: bacterial lectin, dendritic cells, lymphatics, migration, skin
Subject Categories: Cell Adhesion, Polarity & Cytoskeleton; Immunology; Microbiology, Virology & Host Pathogen Interaction
Pseudomonas aeruginosa lectin B binds to endothelial cells and inflicts junctional and cytoskeletal changes. Lectin B restricts migration of dendritic cells from tissue to lymph nodes and thereby has negative repercussion on adaptive immune responses.

Introduction
Lectins, widespread among animals, plants, bacteria, and viruses, are proteins with carbohydrate binding properties (Meiers et al, 2019). Microbial lectins play a role in pathogenesis, such as the fimbria lectins FimH and FmlH for E. coli infection of the urinary tract (Rosen et al, 2008) or the influenza virus hemagglutinin that binds sialic acids of pulmonary epithelial cells (Lewis et al, 2022). P. aeruginosa is a widespread, Gram‐negative bacterium that causes chronic cutaneous wound and airway infections. It belongs to the ESKAPE pathogens and is listed by the World Health Organization as one of the most critical bacterial pathogens. P. aeruginosa produces two lectins, LecA and LecB (formerly named PA‐IL and PA‐IIL) that form homotetramers and have high affinity for galactose and L‐fucose, respectively (Gilboa‐Garber, 1972). LecB is noncovalently linked to carbohydrate ligands of the outer bacterial cell surface and can be liberated by interference with soluble sugars or glycans (Tielker et al, 2005). It increases bacterial adherence to and infection of epithelial cells of the skin (Landi et al, 2019; Thuenauer et al, 2020) and the lung and contributes to pathogenicity in mouse models of lung infections (Mewe et al, 2005; Chemani et al, 2009). In addition, the lectin also contributes to the formation of biofilms (Tielker et al, 2005; Diggle et al, 2006). Therefore, LecB has been identified as a potential drug target in infections with P. aeruginosa (Wagner et al, 2016).
During an adaptive immune response against microbial infections, the B cell‐driven humoral effector arm generates high‐affinity and long‐lived immunoglobulins for antibody and complement‐mediated cytotoxicity and to block infections of host cells. In parallel, the T cell‐mediated effector arm kills infected host cells. The dendritic cells (DCs) are key in initiating an efficacious immune response against bacterial infections. They are professional antigen‐presenting cells, migrating from infected tissue via the lymphatic vessels to the draining lymph nodes (LNs), where they present pathogen‐derived antigens to activate naïve and memory T cells. Under the influence of environmental cues, DCs direct the polarization of T helper cells supporting the humoral or cell‐cytotoxic effector arms.
Microbial lectins, such as LecB, can modulate the immune response through their potent mitogenic potential on immune cells leading to uncontrolled cell proliferation, exhaustion, and cell death (Avichezer & Gilboa‐Garber, 1987; Singh & Walia, 2014). LecB and BambL, a L‐fucose‐binding lectin from Burkholderia ambifaria, induce B cell activation and subsequent cell death in vitro. Injection of BambL into mice leads to polyclonal activation of B cells (Wilhelm et al, 2019; Frensch et al, 2021), which could thwart an efficient humoral immune response. However, on the whole, the impact of microbial lectins on the immune system has remained poorly studied.
Here, we investigated the effect of P. aeruginosa LecB on the vascular and the immune systems using human skin explants and mouse models. We found that LecB bound to blood and lymphatic endothelial cells in vitro and in vivo and caused profound cell junctional and cytoskeletal changes, impairing transendothelial migration of leukocytes. LecB inhibits the migration of DCs from skin via the lymphatics into the LN leading to a diminished T cell response, which is restored by a synthetic LecB inhibitor. These findings illustrate how a microbial lectin can curtail an immune response by inhibiting immune cell migration across endothelial barriers.
Results and Discussion
LecB disrupts migration of human skin DCs and binds to endothelial cells
To investigate the impact of the P. aeruginosa lectins on the immune system, we exposed human skin explants to recombinant LecA and LecB purified from E. coli (Chemani et al, 2009; Landi et al, 2019) for 3 days in culture medium and assessed the spontaneous migration of leukocytes. The cells accumulating in the medium were identified as HLA‐DR− lymphocytes (mostly memory T cells), epidermal Langerhans cells, dermal CD14+, and CD14− (CD1a+) DCs (Fig 1A). While T cells were not significantly affected by either lectins, there was a significant reduction in dermal CD14+ and CD14− DCs as well as in epidermal Langerhans cells with LecB but not LecA (Fig 1B). Adding the LecB glycomimetic inhibitor DH445 (Sommer et al, 2018) restored cell migration (Fig 1C). In light of the role of integrins (ITGs) in leukocyte migration and the loss of ITGb1 from epithelial cells by LecB (Thuenauer et al, 2020), we assessed the cell surface expression of CD18/ITGb2, CD11c/ITGaX, and CD11b/ITGaM. There was a reduction in the CD18/ITGb2‐CD11c/ITGb2 heterodimer on dermal DCs but not Langerhans cells (Fig EV1). Thus, LecB negatively affects DC migration from human skin by binding to a cellular glycoligand. Given that DCs and Langerhans cells leave tissue via the lymphatic vessels, we next assessed interaction of LecB with the skin lymphatics. To this end, we cultured skin explants for 3 days with LecB conjugated to the fluorochrome AlexaFluor 488. The skin was then sectioned and stained for CD31 and HLA‐DR, expressed by endothelial cells and the dermal DCs/epidermal Langerhans cells, respectively (Fig 1D). There was a noticeable overlap between LecB‐A488 and CD31+ endothelial cells. To confirm the LecB affinity for endothelial cells, the cells were isolated from human skin, expanded and exposed to LecB‐A488 in the absence or presence of graded concentrations of the inhibitor DH445. The cells were stained for CD31, CD146, and glycoprotein 38 (podoplanin) and analyzed by flow cytometry (Fig 1E). Both blood and lymphatic endothelial cells bound LecB and the interaction was antagonized with increasing concentrations of DH445. These findings show that treatment with P. aeruginosa lectin LecB inhibits the emigration of DCs and binds to human lymphatic and blood endothelial cells.
Figure 1. LecB binds to endothelial cells in the skin and obstructs cell emigration.

-
AFlow cytometry gating strategy to identify the leukocytes emigrating from human skin explants into cell culture medium.
-
BHuman skin explants were cultured in complete medium for 3 days in the absence (nontreated, NT) or presence of LecB or LecA, emigrated cells counted and identified by flow cytometry (panel A).
-
CAs for panel (B) with DH445 and/or LecB added to the culture medium, normalized to the untreated condition.
-
DEpifluorescence imaging of human skin cross‐sections after incubation of skin explant in culture with LecB‐A488 and then stained for CD31, HLA‐DR and cell nuclei (DAPI). Arrows point to CD31+ endothelial cells bound by LecB‐A488.
-
EFlow cytometry of LecB‐A488 binding to ex vivo isolated CD31+ CD146+ podoplanin (Pdpn)− blood and CD31+ CD146− Pdpn+ lymphatic endothelial cells in the absence or presence of different concentrations of the LecB inhibitor DH445.
Data information: data are expressed as mean ± SEM of individual skin donors, that are linked in (C). The data in (C) are normalized to the untreated (NT) condition. ns, not significant, *P < 0.05, ***P < 0.001, as assessed by the Kruskall–Wallis test (B) and Friedman test (C). The scale bars represent 100 μm (D).
Figure EV1. Integrin expression of human skin‐emigrated CD14− and CD14+ DCs as well as Langerhans cells. Relative to Fig 1 .

The cells were harvested from untreated (NT) skin or exposed to LecB, and the expression of CD18/ITGb2, CD11c/ITGaX, and CD11b/ITGaM was determined by flow cytometry. Data information: The data are expressed as ± SEM of the mean geometric fluorescence intensity, where each data point represents one skin donor. ns, not significant, *P < 0.05; **P < 0.01; ***P < 0.001 as assessed by the Wilcoxon–Mann–Whitney test.
The lectin inhibits human leukocyte transmigration in vitro and rearranges endothelial cell membrane and cytoskeleton
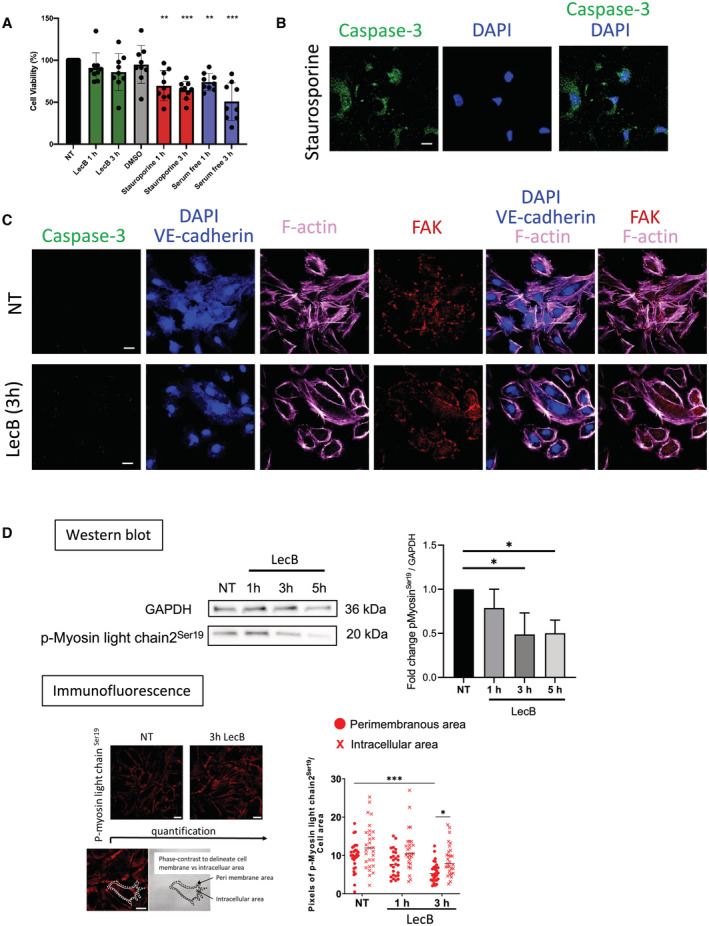
In light of these findings, we next asked whether LecB inhibits transendothelial passage of immune cells. To this end, human CMEC/D3 blood endothelial cells, which form tight cell junctions, were grown as a monolayer on the filter of Transwell plates, and then peripheral blood mononuclear cells (PBMCs), blood‐isolated lymphocytes or monocyte were added to the top chamber. The cells were exposed to LecB and migration of the leukocytes across the endothelial cells into the lower chamber was assessed 24 h later (Fig 2A). We found that in the presence of LecB, significantly fewer cells migrated across the endothelial barrier into the lower chamber (Fig 2B). PBMCs and monocytes were most strongly impaired, although CD14− lymphocyte transmigration was also significantly decreased. Next, we counted the number of cells remaining on the CMEC/D3 cell monolayer, and, inversely to cell passage, there were more adherent leukocytes in the upper chamber in the presence of LecB (Fig 2C). These findings demonstrate that LecB impairs leukocyte passage across an endothelial monolayer. When staining CMEC/D3 cells for the adherens junctional protein VE‐cadherin, we observed that while in untreated conditions, the VE‐cadherin was clearly localized at the cell membranes, surprisingly, LecB disrupted this distribution (Fig 2D). We, therefore, analyzed more closely the changes inflicted by LecB on junctional proteins and the cytoskeleton of endothelial cells. First, we determined the binding of LecB‐A488 to different endothelial cell lines in vitro. The lectin bound to the cell membrane of the human brain microvascular endothelial cell line hCMEC/D3, human umbilical vein endothelial cells (HUVECs), and skin lymphatic cells and was internalized in peri‐nuclear vesicles (Fig EV2A). HUVECs were then left untreated or exposed to LecB for 1 h or 3 h, stained for VE‐cadherin, filamentous (F)‐actin, focal adhesion kinase (FAK), nuclei were colored with DAPI (Fig 2E), and images quantified for subcellular localization (Fig EV2B). In untreated cells, VE‐cadherin was primarily distributed on the cell surface forming adherens junctions, however, in the presence of LecB, location of VE‐cadherin shifted into the cytoplasm and was often found in peri‐nuclear vesicles. We analyzed VE‐cadherin protein levels by western blot and found a time‐dependent decrease (Fig 2F). Visualizing F‐actin with fluorescent phalloidin uncovered that LecB provoked the reduction in cellular stress fibers and the formation of a cortical actin rim. FAK, which plays a central role in initiating and integrating various signaling pathways with effect on cytoskeleton (Quadri, 2012), is frequently displaced from a predominantly perimembranous location to an intracellular position after LecB. The alterations in protein expression and localizations were not due to LecB toxicity as assessed by cell viability by MTT and caspase‐3 staining (Fig EV3A–C). Given the reduction of actin stress fibers that are central to cell mobility, we performed live imaging of HUVECs with Sir‐actin exposed to LecB or left untreated. While untreated cells exhibited actin dynamics concomitant with cell motility, the 3 h LecB treatment left the cells sessile with low levels of polymerized actin (Movies EV1 and EV2). To further explore reduced cell contractility, we determined phosphorylation of the myosin regulatory light chain 2 that stabilizes myosin (Vicente‐Manzanares et al, 2009). Western blot showed diminished myosin light chain2 phosphorylation at Ser19, and quantification of immunofluorescence revealed a loss in the perimembranous area after 3 h of LecB exposure (Fig EV3D). In conclusion, LecB reorganizes the VE‐cadherin+ adherens junction and the associated FAK and F‐actin cytoskeleton with reduced myosin regulatory light chain phosphorylation, which would have a negative impact on cell contractility and, therefore, on leukocyte diapedesis.
Figure 2. LecB restricts leukocyte migration across endothelial cells and inflicts changes to cell membrane and cytoskeleton‐associated proteins.

-
ASchematic illustration of the endothelial transmigration assay and its analysis.
-
BThe graph shows the number of human peripheral blood mononuclear cells (PBMC), blood‐isolated lymphocytes or monocytes transmigrated across the human CMEC/D3 endothelial cell barrier in the presence of LecB, relative to the nontreated (NT) condition.
-
CThe graph shows the number of the indicated leukocytes remaining on the endothelial monolayer.
-
DConfocal images of the CMEC/D3 cells stained for VE‐cadherin for the indicated experimental conditions.
-
EConfocal images of monolayers of HUVECs, nontreated (NT) or exposed to LecB for 1 or 3 h, were fixed and stained for VE‐cadherin, F‐actin, focal adhesion kinase (FAK), and nuclei with DAPI.
-
FLeft: Western blot analysis of VE‐cadherin and α‐tubulin in HUVEC lysates treated with LecB for the indicated times. Right: Densitometric quantification of the western blot of VE‐cadherin relative to α‐tubulin.
Data information: (B, F) Data are expressed as mean ± SEM, n = 3 biological replicates. *P < 0.05, **P < 0.01, ***P < 0.001 as assessed by the Student's t‐test (B) Kruskal–Wallis test (F). (C) Data are expressed as mean ± SEM, n = 2 biological replicates. The scale bars represent 40 μm (D) and 25 μm (E).
Figure EV2. Binding of LecB to endothelial cells and quantification of changes in adherens and cytoskeletal protein expression and subcellular localization. Relative to Fig 2 .

-
AConfocal images of the indicated endothelial cells lines, exposed to LecB‐A488 for the indicated times before fixation and coloring with the nuclear dye Hoechst. Arrows identify cells with internalized LecB.
-
BTop: HUVECs were stained with VE‐cadherin, DAPI, F‐actin and FAK, and the cell's perimembranous and intracellular areas were identified on bright‐field images. Bottom: The pixels of fluorescence of VE‐cadherin, F‐actin, FAK in these subcellular areas were determined for each cell based on phase contrast images using Fiji (ImageJ software) and normalized for cell surface area. For the intracellular VE‐cadherin measures, the DAPI+ nuclear area was subtracted. The graphs depict these measures for each imaged cell.
Data information: The data are expressed as ± SEM with each data point representing one cell. *P < 0.05, **P < 0.01, ***P < 0.001 as assessed by Kruskal–Wallis test. Scale bars represent 25 μm (A) and 20 μm (B).
Figure EV3. LecB does not trigger apoptosis and leads to reduced myosin light chain phosphorylation. Relative to Fig 2 .
-
AHUVECs were left untreated (NT), or incubated with LecB, DMSO, Staurosporine in DMSO and in serum‐free medium for the indicated times, and cell viability assessed using the MTT assay.
-
BHUVECs undergoing apoptosis with Staurosporine were imaged for caspase‐3, and nuclei stained with DAPI.
-
CUntreated (NT) or LecB‐treated HUVECs were stained for the indicated proteins and caspase‐3 to exclude imaging apoptotic cells.
-
DWestern blot analysis of p‐Myosin light chain2Ser19 and GAPDH in HUVEC lysates treated with LecB for the indicated times. Densitometric quantification of the western blot of p‐Myosin light chain2Ser19 relative to GAPDH. Below: Imaging and quantification of p‐Myosin light chain2Ser19 immunofluorescence of HUVECs untreated (NT) or treated for 3 h with LecB. The cell's perimembranous and intracellular areas were identified on the bright field cell images. The pixels in the subcellular areas for each cell image was determined using Fiji (ImageJ software) and normalized for cell surface area.
Data information: The data are expressed as ± SEM. (A) It is normalized to the NT conditions with each data point representing biological replica. (D) Is from three technical replicas. *P < 0.05, **P < 0.01 ***P < 0.001 as determined by the Student's t‐test in comparison with the NT condition (A) or Kruskal–Wallis test (D). Scale bars represent 20 μm.
LecB binds to lymphatic endothelial cells in skin and LN in vivo
We next turned to mouse models to explore the functional consequences for the immune system of LecB interaction with endothelial cells. First, LecB‐A488 was injected into the ear pinnae of Prox1 CreERT2 tdTomato Stop‐flox (iProx‐1tdT) mice that express the red fluorescent tdTomato protein under the Prox1 promoter active in lymphatic endothelial cells (Bazigou et al, 2011). 4 h later, the ears were split and imaged by confocal microscopy (Fig 3A). LecB‐A488 co‐localized with the tdTomato+ lymphatic vessels in addition to binding to other cutaneous structures resembling blood vessels. As lymphatics drain into LNs, we next injected LecB‐A488 into the ear pinnae or into the footpad and 4 h later visualized its localization within the auricular and popliteal LNs that respectively drain these injection sites (Fig 3B). LecB bound not only vascular structures, mostly lymphatics expressing both CD31 and CLCA1 and lining the subcapsular and medullary sinuses, but also CD31+ CLCA1− blood vessels. A higher magnification revealed that LecB‐A488 labeled structures extending from the subcapsular sinus across the cortex to blood endothelial cells, which are likely conduits transporting lymph‐borne material from the lymphatic sinus to high endothelial venules (HEVs) (Gretz et al, 2000). Indeed, in HEVs stained with peripheral node addressins (PNAd), LecB‐A488 labeling was apparent on the subluminal side (Fig EV4A). We next examined LecB binding to different cell populations by flow cytometry (Fig 3C). Lymphatic endothelial cells (LECs), blood endothelial cells (BECs), and fibroblastic reticular cells (FRCs) were identified based on CD31 and gp38 expression, and the HEVs as a PNAd+ BEC subset. The remaining population that comprises pericytes was noted as double negative (DN). LecB‐A488 binding was assessed for each stromal cell population by measuring its mean fluorescence intensity (Fig 3D). We found that LecB primarily targeted LECs, followed by BECs, HEVs, and FRCs. This finding confirms the microscopic assessment of LecB‐target cells and supports the conclusion that LecB travels from the skin via the lymphatics to the LNs where it reaches BECs and HEVs via the FRC‐formed conduits. We also assessed the mean fluorescence intensity of LecB‐A488 in the different hematopoietic cell populations (Fig EV4B–D). The lymphatic sinus‐associated macrophages (subcapsular and medullary sinus macrophages, SSM and MSM) displayed the strongest fluorescence followed by other macrophage subsets, whereas DCs showed a much lower binding to LecB. T and B lymphocytes were hardly targeted by the lectin. These data further support the lymphatic draining of subcutaneously injected LecB into the LN, where it is sampled by the lymphatic sinusoidal macrophages.
Figure 3. Assessment of LecB drainage from the skin to LNs in the mouse.

-
AWhole mount confocal immunofluorescence of ear skin from Prox1‐cre ERT2 tdTomato stop‐flox (iProx1 tdT ) after injection with LecB‐A488 or saline (nontreated, NT). Arrows point to tdTomato+ lymphatic vessels bound by LecB‐A488.
-
BConfocal imaging of LN sections after LecB‐A488 injection and stained for chloride channel calcium‐activated 1 (CLCA1), CD31 and cell nuclei (DAPI). Insets on the right show close‐ups of the subcapsular and the medullary areas.
-
CTop: Flow cytometry gating strategy to identify LN stromal cell subsets among live CD45‐TER‐119 cells. Bottom: Flow cytometry histograms of green fluorescence for the identified stromal subsets after LecB‐A488 (red line) or saline (gray curve) injection.
-
DThe graph depicts the median fluorescence intensity (MFI) of green fluorescence of LecB‐A488 versus saline of the cells analyzed in panel B.
Data information: The data are expressed as ± SEM with each data point represents one biological replicate (two LNs of one mouse). *P < 0.05, **P < 0.01 as determined by the Wilcoxon–Mann–Whitney test. The scale bars represent 50 μm (A), 200 μm (B left) and 50 μm (B right). BEC, blood endothelial cells; DN, double negative cells; FRC, fibroblastic reticular cells; HEV, high endothelial venules; LEC, lymphatic endothelial cells.
Figure EV4. LecB reaches high endothelial venules (HEVs) and is captured by lymphatic sinusoidal macrophages. Relative to Fig 3 .

-
AConfocal imaging of a popliteal LN section 4 h after injection of LecB‐A488, stained for PNAd+ HEVs with cell nuclei colored with DAPI. Scale bars represent 200 μm in whole LN images and 50 μm in close‐ups.
-
BTop: Flow cytometry gating strategy to identify LN marginal lymphatic sinus and subcapsular lymphatic sinus macrophages (MSM and SSM, respectively) as well as other macrophage subsets (F4/80+CD169− and F4/80−CD169−). Bottom: Flow cytometry histograms of green fluorescence for the macrophages subsets after LecB‐A488 (orange line) or saline (gray curve) ear injection.
-
CTop: Flow cytometry gating strategy to identify LN‐resident and skin‐derived dendritic cells (DCs) as well as B and T cells. Bottom: Flow cytometry histograms of green fluorescence after LecB‐A488 ear injection for B cells, T cells (red line) as well as the DC subsets (green line), the gray curve represents the saline control.
-
DThe graph depicts the median fluorescence intensity (MFI) of green fluorescence of LecB‐A488 versus saline of the cells analyzed in panels (A) and (B). The data are expressed as ± SEM with each point representing the data collected from two pooled auricular LNs of one mouse. **P < 0.01 as determined by the Wilcoxon–Mann–Whitney test.
LecB interferes with migration of DCs from peripheral tissues and subsequent T cell activation in vivo
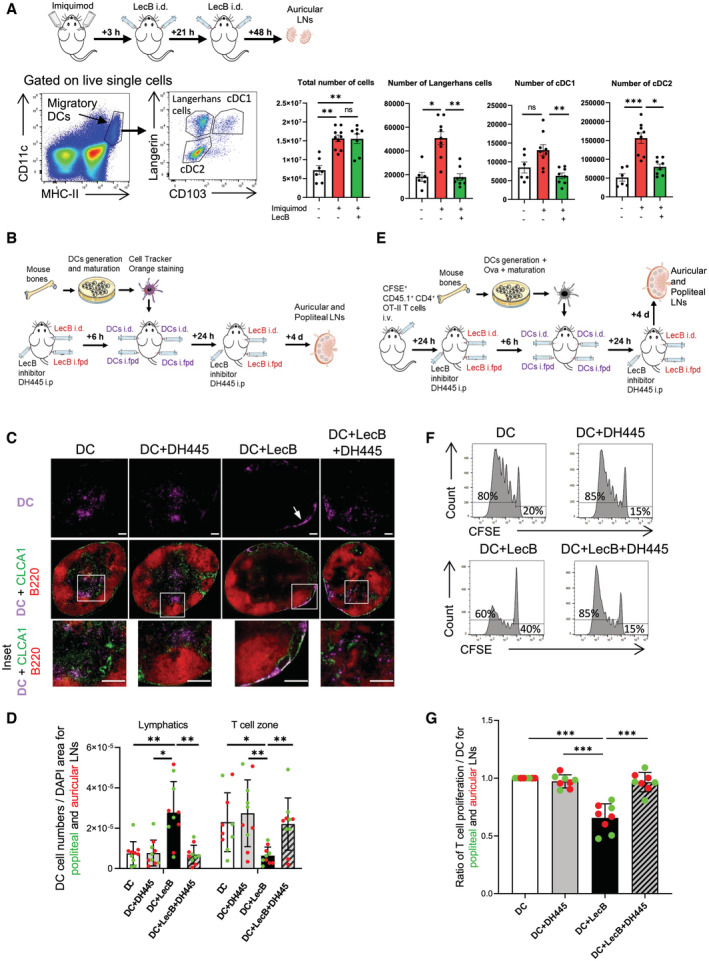
We next assessed the functional consequences of LecB binding to the lymphatics by assessing DC migration from skin to the LN paracortex, where they prime T cells. First, we determined whether DCs were inhibited by LecB in their migration to LNs by exposing mouse ear skin to the TLR‐7 agonist imiquimod (Aldara cream) in the absence or presence of two intradermal injections of LecB. In spite of a strong increase in LN cellularity owing to the inflammatory stimulus, LecB prevented the entry of the migratory skin DC subsets and Langerhans cells into the draining LN (Fig 4A). Similar observations were made when targeting the DEC‐205+ skin DCs (Fig EV5A and B). We then generated DCs from bone marrow precursors (BMDCs), matured by LPS, fluorescently labeled, and injected into ears and footpads of mice treated twice with LecB on one side, while the other side was mock‐injected with saline (Fig 4B). In addition, some mice received an intraperitoneal injection of LecB inhibitor DH445. Four days later, the draining auricular and popliteal LNs were recovered, stained for CLCA1+ lymphatics and B220+ B cells, and the number of BMDCs associated with lymphatics or localized within the central paracortical T cell zone, devoid of the peripheral B220+ B cell follicles, was assessed (Fig 4C and D). In the absence of LecB, the majority of BMDCs was found within the paracortex, which was not influenced by DH445. However, in the presence of LecB, BMDCs failed to enter the T cell zone and were associated with the subcapsular lymphatics. Strikingly, DH445 reversed LecB‐mediated inhibition of BMDC migration into the T cell zone. To determine whether this abnormal migration alters T cell activation, we modified the above experiment by injecting mature BMDCs loaded with ovalbumin into mice having received CFSE‐labeled transgenic CD4+ recognizing an ovalbumin‐derived peptide (from OT‐II x CD45.1+ mice) (Fig 4E). The LNs were recovered and the proliferation of CD45.1+ T cells assessed by dilution of the CFSE label by flow cytometry (Fig 4F). The data, expressed as T cell proliferation, was normalized in each experiment to control mice or mice whose contralateral LN was not exposed to LecB (Fig 4G). We found that LecB significantly reduced T cell proliferation and that this effect was reversed by the LecB inhibitor DH445. Taken together, the data uncovered the ability of LecB to inhibit the generation of an adaptive immune response by restricting DC migration across lymphatics from the periphery to the LN T cell zone.
Figure 4. Inhibition of DC migration and T cell activation.
-
ASchematic illustration of the experiment to assess inhibition of skin DCs migration to draining auricular LNs by intradermal LecB injection after mobilization by imiquimod (Aldara cream). Left: gating strategy to identify Langerhans cells, cDC1 and cDC2 subsets among the migratory DCs. Right: Graphs depict total auricular LN cell numbers, number of LCs, cDC1, and cDC2 without and with imiquimod application in the absence or presence of LecB.
-
BSchematic illustration of the experiment of panels (C, D).
-
CEpifluorescent imaging of LN sections stained for chloride channel calcium‐activated 1 (CLCA1), expressed by the lymphatic endothelial cells, and B220+ B cells residing in the LN cortex. DCs are visualized by their Cell Tracker Orange staining. Arrow points to DCs associated with a subcapsular lymphatic sinus. Insets show close‐ups of DCs in the T cell paracortex (DC, DC+DH445, DC+LecB+DH445) or in the subcapsular lymphatic sinus (DC+LecB).
-
DThe graph shows the DC numbers associated with CLCA1+ lymphatics or the B220‐ T cell zone per LN section normalized for DAPI+ area.
-
ESchematic illustration of the experiment of panels (F, G).
-
FRepresentative flow cytometry profiles of CFSE of donor CD45.1+ CD3+ CD4+ ova‐specific T cells in the different recipient mice. The proportion of proliferating versus CFSE+ undivided T cells is noted.
-
GThe graph depicts the proportion proliferating T cells of the different experimental condition relative to the DC‐only control condition.
Data information: The data are expressed as ± SEM with each data point representing (A) two auricular LNs of one mouse, (D, G) a popliteal or an auricular LN of one mouse. *P < 0.05, **P < 0.01, ***P < 0.001 by (A) Kruskal–Wallis test, (D, G) one‐way ANOVA test. Scale bars represent 200 μm. cDC1/2, conventional dendritic cells subset 1/2; i.d., intradermal; i.fp., intrafootpad; i.p., intraperitoneal; LCs, Langerhans cells.
Figure EV5. Migration of DEC‐205‐targeted skin DCs and Langerhans cells to LNs is negatively affected by LecB. Relative to Fig 4 .

-
ASchematic illustration of the experiment to target DEC‐205+ skin DCs and Langerhans cells and test the effect of LecB on migration to the draining LNs. Flow cytometry gating strategy to identify Langerhans cells (LCs) and cDC1 subsets among the migratory DCs. DEC‐205‐647 targeting was determined among two cell types.
-
BGraphs depict the number of DEC‐205+ cells among the Langerhans cells (LCs) and cDC1 without and with imiquimod application in the absence or presence of LecB. The data are expressed as ± SEM with each data point representing two auricular LNs of one mouse. ns, nonsignificant, **P < 0.01, by Kruskal–Wallis test.
LecB, produced by the opportunistic bacterium P. aeruginosa, is considered a virulence factor, however, its role on the immune system has not been studied. Here, we assessed the consequences of LecB administrated to human skin explants and to mice with respect to immune cell migration and initiation of a T cell immune response. We found that LecB targeted blood and lymphatic endothelial cells in human skin and in mouse skin and LNs. It disrupted the migration of the antigen‐presenting cells from the skin via the lymphatics into the LN T cell zone and thereby inhibited the antigen‐specific activation of T cells. The lectin restricted transendothelial migration of leukocytes in vitro and caused endothelial cell junctional and cytoskeletal changes. These findings support the conclusion that LecB is a potent virulence factor by restraining immune cell trafficking across endothelial barriers and thus preventing the immune system to mount an efficient response.
Immune cell migration is a prerequisite for an efficient immune response by activating T and B cells in the LNs against infections in peripheral tissue. Hereby, DCs play an important role through their capacity to traffic from tissue to LNs linking the innate and the adaptive immune effector arms. After exposing fluorescently tagged LecB intradermally to human skin and the mouse ear, we observed a strong association with blood and lymphatic endothelial cells. Likewise, in the LNs, the lymphatics sinuses were predominantly targeted. Other cells that efficiently bound LecB were the lymphatic sinusoidal macrophages, specialized in sampling and scavenging lymph‐borne antigens, blood vessels, and fibroblastic reticular cells that formed the conduits between the LN lymphatic sinus and the HEVs. A molecular basis for the strong interaction of LecB with endothelial cells may be the glycocalyx, a thick layer of proteoglycans (e.g., syndecans, glypican), glycosaminoglycans, glycoproteins (e.g., selectins, integrins), and glycolipids (Moore et al, 2021).
The association of LecB with lymphatics raised the question of its physiological relevance in the context of a bacterial infection. We addressed this by studying leukocyte migration. In humans, Langerhans cells and dermal DC were restricted in their ability to exit the skin into the culture medium. T cells were less affected, indicative of taking a nonlymphatic route. In mice, our data showed that endogenous DCs or injected BMDCs were restrained in entering the LN, which consequently resulted in a lower T cell response. By providing two doses of LecB, we tried to optimize the experimental conditions to anticipate rapid and late BMDC arrival. Yet, because the half‐life of LecB interaction with endothelial cells is not known, a more frequent regimen may have been required to observe a complete absence of BMDC migration into the T cell zone and subsequent abrogation of T cell proliferation. Alternatively, the high BMDC numbers may have contributed to overcome LecB‐blockage of trans‐endothelial migration. The glycomimetic DH445 proved effective in inhibiting LecB effects in skin explants and in vivo. DH445, which was administrated intraperitoneally, revealed high potency of inhibition, confirming its advantageous pharmacological properties (Sommer et al, 2018). These findings underline DH445 as a promising therapeutic option against P. aeruginosa.
We found that LecB‐imposed restriction of cell migration from human skin or in mice could be reproduced in an in vitro endothelial transmigration assay. The finding that LecB strongly diminished the passage of different types of leukocytes is in line with the notion of general cell alterations rather than modifications of specific receptors or chemotactic signals. By studying HUVECs in more detail, we found that LecB triggered the endocytic degradation of VE‐cadherin, changes in FAK subcellular location and the formation of a cortical F‐actin rim. How do these changes correlate with reduced leukocyte diapedesis? Leukocytes pass through endothelial barriers mainly via the paracellular route, which involves destabilized cell–cell junctions and active actin stress fibers to create intercellular gaps for cell passage. Endothelial cell barrier enhancement agents lead to the disappearance of central stress fibers to generate a cortical F‐actin rim, however, the adherens junctional VE‐cadherin is stabilized at the cell surface (Garcia et al, 2001; Liu et al, 2002; Birukov et al, 2004; Birukova et al, 2007). One possible explanation for diminished leukocyte transmigration is that LecB impairs leukocyte diapedesis by preventing the development of transcellular tension necessary to create the intercellular openings. This model is supported by loss of stress fibers and reduced myosin regulatory chain phosphorylation, which would have a negative impact on cell contractility. However, reduction in integrin cell surface expression by LecB such as CD11c/ITGaX and CD18/ITGb2 may affect migration, although BMDC homing to LNs was not found to be dependent on integrins (Lämmermann et al, 2008). Further work is required to clarify the contribution of dysfunctional endothelial cells and compromised leukocyte–endothelial interaction in LecB‐mediated inhibition of leukocyte migration.
It has been reported that the second P. aeruginosa lectin, LecA, also interacts with endothelial cells (von Bismarck et al, 2001; Kirkeby et al, 2007). Lectins that have protein homology with P. aeruginosa are produced by other bacteria, such as Burkholderia, which causes morbidity and mortality among cystic fibrosis patients (Lameignere et al, 2008). However, we found that LecA did not inhibit human DC skin emigration, indicating that obstructing leukocyte migration is not a general property of bacterial lectins. An important question is the dynamics of LecB production during an infection and whether it remains associated with the bacterium. Of consideration is also the role of LecB in biofilm formation that may—in the light of our results—protect the bacteria from immunological surveillance and attack. It is also reasonable to assume that the lectins might serve the bacterium to cross the blood or lymphatic endothelial barrier to spread systemically, as previously suggested (Plotkowski et al, 1994). In this context, it is interesting to note a case report of Pseudomonas in a mediastinal LN in the absence of bacterial counts in the blood, suggesting entry via the lymphatic drainage (Bansal et al, 2016). Our study employs purified LecB and calls for further studies using live P. aeruginosa expressing or lacking LecB. It also incites further investigation into the immunity‐altering impact of other bacterial lectins. LecB inhibitors, similar to DH445, may find an application to bacterial infections beyond Pseudomonas.
Materials and Methods
Human skin
Fresh abdominal skin was obtained from patients undergoing abdominoplasty with written informed consent and institutional review board approval, in agreement with the Helsinki Declaration and French legislation. 2 cm2 biopsies of ~ 1 mm thickness were placed at air–liquid interface onto 40‐μm cell strainers in 6 ml complete medium (RPMI1640 supplemented with 10 μg/ml gentamycin, 100 units/ml penicillin, 100 μg/ml streptomycin, 10 mM HEPES [all from Lonza], and 10% fetal calf serum [FCS]). Lec B (5 μM) or Lec A (5 μM) was added to the skin explants. In some conditions, LecB was preincubated for 30 min with 100 μM of DH445 (Sommer et al, 2018). Human skin cells that had spontaneously emigrated into the culture medium after 3 days were recovered and stained for HLA‐DR, Langerin/CD207, DC‐SIGN/CD209 and CD14 (all from BD Pharmingen) to identify CD14+ and CD14− dermal DCs as well as Langerhans cells and T cells. Cells were also stained for the integrin subunits CD18, CD11b, and CD11c (BD Pharmingen).
Mice
C57BL/6J, CD45.1 (B6.SJL‐Ptprca Pepcb/BoyJ), OT‐II (B6.Cg‐Tg(TcraTcrb)425Cbn/J) (Charles River Laboratories, France), Prox1‐cre ERT2 (Bazigou et al, 2011), B6;129S6‐Gt(ROSA)26Sortm9(CAG‐tdTomato)Hze (Jackson Laboratories) mice were kept in pathogen‐free conditions. The Prox1 CreERT2 tdTomato Stop‐flox (iProx‐1tdT) mice received 50 mg/kg tamoxifen (Sigma‐Aldrich) in sunflower oil/5% ethanol twice with a 24 h interval by gavage 2 weeks before experimentation. The mice then express the red fluorescent tdTomato protein in lymphatics under the specific Prox1 promoter. All experiments were carried out in conformity with the animal bioethics legislation (APAFIS#16532‐2018082814387618v4).
LecA and LecB preparation
The P. aeruginosa lectins were purified from E. coli (Chemani et al, 2009; Landi et al, 2019) using plasmid pET25pa2l (Mitchell et al, 2005). LecB was fluorescently labeled with Alexa Fluor488 (LecB‐A488) monoreactive NHS ester (Thermo Fisher Scientific) and purified with Zeba Spin desalting columns (Thermo Fisher Scientific) according to manufacturer's instructions.
Chemical synthesis
The LecB inhibitor N‐β‐L‐fucopyranosylmethyl 2‐thiophenesulfonamide (named here DH445) was synthesized as previously described (Sommer et al, 2018).
Identification of LecB target cells by immunofluorescence of skin and LNs
Human skin (2 cm2, 800 μm thick) was cultured in RPPMI medium supplemented with 10% fetal calf serum and antibiotics containing 5 μg/ml of LecB‐A488. After 3 days, the skin was embedded in freezing compound (Cell Path, Newton, Poys, UK) and cross‐sectioned (7 μm thickness). Sections were stained for CD31 and HLA‐DR (BD‐Pharmingen) and nuclei visualized with DAPI (Sigma‐Aldrich). Images were acquired on a Axio Observer.Z1 microscope (Carl Zeiss, Oberkochen, Germany) with a 20× air objective (Plan‐Apochromat, NA 0.8, DIC, Zeiss) and the Metamorph software (Metamorph, Nashville, TN, USA). Images were processed with the open source software ImageJ. For mice, LecB‐A488 (12.5 μg) was injected into mouse ear and into the hind footpads. 4 h later, ear pinnae were dissected and the dermal side fixed in 4% paraformaldehyde (PFA) (Sigma‐Aldrich) and mounted with Fluoromount‐G (Thermo Fisher Scientific). Images were acquired with a confocal microscope (Nikon, Eclipse Ti‐E A1R system) and a 20× air objective (CFI Plan Fluor 20XC MI, 20×/0.75, OFN25 DIC). The auricular and popliteal LNs were harvested, embedded in freezing compound (Cell Path), and cryo‐sectioned (8 μm thickness). Sections were acetone‐fixed and stained for CD169 (BioLegend), chloride channel calcium‐activated 1 (CLCA1, clone 10.1.1, a kind gift from Andy Farr, University of Washington, Seattle, USA), CD31 (eBioscience), and anti‐PNAd (BioLegend). Nuclei were visualized with DAPI (Sigma‐Aldrich).
Identification of LecB target cells by flow cytometry
Human skin cells that had spontaneously emigrated into the culture medium after 3 days were recovered and stained for HLA‐DR, Langerin/CD207, DC‐SIGN/CD209, and CD14 to identify CD14+ and CD14− dermal DCs as well as Langerhans cells and T cells. To isolate blood and lymphatic endothelial cells, human skin was digested with 0.25% trypsin–EDTA (Gibco) to eliminate the epidermis, followed by digestion of the dermis with 1 mg/ml collagenase D (Roche, Switzerland) and 1 mg/ml DNase I (Roche) and for 18 h at 37°C. Endothelial cells were then positively selected using CD31‐coupled magnetic beads (Miltenyi Biotec) and amplified in endothelial growth medium (EGM‐2, PromoCell) on gelatin‐coated flasks (Corning). LecB‐A488 (1 μg/ml) was added to 5 × 10⁴ cells in the absence or presence of the inhibitor DH445 (Sommer et al, 2018) (1–50 μM) for 2 h before staining cells for CD31 (BioLegend), CD146 (Miltenyi), and Podoplanin (BioLegend). LNs recovered from mice 4 h after injections of 12.5 μg LecB‐A488 were minced and digested with 1 mg/ml collagenase D, 1 mg/ml Dispase (Roche) and 0.1 mg/ml DNAse I with frequent pipetting until full digestion. The cells were then filtered, red blood cells lysed in ammonium chloride buffer (BioLegend) and incubated with the different antibody cocktails. For stromal cells: anti‐CD45‐APC/Cy7 (BioLegend), TER‐119‐APC‐eF780 (eBioscience), CD31‐PE (BioLegend), anti‐gp38/Podoplanin‐PE/Cy7 (BioLegend), and anti‐PNAd‐biotin (BioLegend) followed by streptavidin‐APC (eBioscience). DAPI (Sigma‐Aldrich) was used to exclude dead cells. For myeloid cells: FcR were blocked with FcR Blocking Reagent (MACS Miltenyi Biotec) and cells stained with anti‐CD45‐APC/Cy7 (BioLegend), anti‐CD11b‐PerCP Cy5.5 (BioLegend), anti‐Ly6C‐PE (BD Pharmingen), and anti‐Ly6G‐APC (eBioscience). For sinusoidal macrophages: after FcR‐blocking, cells were stained with anti‐CD169‐PE (BioLegend), anti‐CD11c‐PE‐Cy7 (BD Pharmingen), anti‐CD11b‐PerCP‐Cy5.5 (BioLegend), and anti‐F4/80‐APC (BioLegend). For DCs: after FcR blocking, cells were stained with anti‐CD103‐PE (BD Pharmingen), anti‐CD11c‐PE‐Cy7 (BD Pharmingen), and anti‐I‐A/I‐E‐AF700 (BioLegend). Cells were washed with PBS and fixed in BD Cytofix™ Fixation Buffer (BD Biosciences) for 20 min and washed in BD Perm/Wash™ Buffer (BD Biosciences) for intracellular staining with Langerin‐AF647 (Novus Biologicals). The Fixable Viability Dye eFluor 450 (eBioscience) was used as a dead cell marker. Flow cytometry was done on a Gallios (Beckman Coulter) and data analyzed with the FlowJo software (Tree Star, Inc.).
Endogenous DC migration
Mouse ears were treated with Aldara cream, containing 5% imiquimod, and 3 and 21 h later mice received into the ear pinna an injection of 12.5 μg LecB in 15 μl saline water. For DEC‐205 targeting, 1 μg anti‐DEC‐205‐A647 antibody diluted in 15 μl PBS was injected into ears pinna prior to Aldara cream application (Flacher et al, 2012). Auricular LNs were harvested 72 h afterwards. For single cell preparation, LNs were cut into small pieces and digested with 1 mg/ml collagenase D (Roche) and 0.1 mg/ml DNase I (Roche) in RPMI cell culture medium containing 2% FCS for 1 h at 37°C under agitation. For flow cytometry staining the antibodies were: CD11c‐PE‐Cy7, CD103‐PE (BD Pharmingen), MHC‐II‐AF700, CD205‐AF647 (BioLegend), and CD207 (Langerin)‐AF488 (Eurobio).
BMDC generation, migration, and T cell stimulation
Bone marrows were flushed, red blood cells lysed in ammonium chloride buffer (BioLegend), cells filtered and cultured in complete medium containing 25 ng/ml FMS‐like tyrosine kinase 3 ligand (hFlt3L, Peprotech). After 8 days, the BMDCs were activated with 100 ng/ml lipopolysaccharide (LPS) for 16 h, harvested and labeled with 15 μM Cell Tracker Orange (Thermo Fisher Scientific) for 30 min at 4°C. After washing in PBS, 2 × 10⁵ BMDCs were injected subcutaneously into the ear pinna or into the hind footpad of C57BL/6 mice that had received 6 h before on one side 12.5 μg LecB into the ear and 12.5 μg LecB intra‐footpad and contralaterally saline. Some mice concomitantly received a peritoneal injection of 50 mg/kg of LecB inhibitor DH445. After 4 days, the popliteal and auricular LNs were isolated, cryo‐sectioned and stained for CLCA1 and B220. The number of Cell Tracker Orange+ BMDCs trapped within the CLCA1+ lymphatics or migrated into the B220− T cell zone was counted double blindly. For the in vivo T cell simulation assay, BMDCs were generated from C57BL/6 CD45.1+ bone marrow, and 1 μg/ml chicken ovalbumin was added 2 h before addition of LPS. After 18 h, BMDCs were harvested and 2 × 10⁵ cells injected into ears and footpads of CD45.2 mice, prepared as described above that had received an intravenous injection of 10 × 106 CD4+ T cells from CD45.1xOT‐II F1 mice. The T cells were isolated from spleens and LNs using negative magnetic bead selection (Miltenyi Biotec) and labeled with 500 nM carboxyfluorescein succinimidyl ester (CFSE, Thermo Fisher Scientific) for 15 min at RT. After 4 days, T cell proliferation in the draining LNs was determined by determining the proportion of the CFSE label, successively diluted with each cell division, among the live, CD3+ CD45.1+ T cells. Flow cytometry was done on a Gallios (Beckman Coulter) and data analyzed on FlowJo (Tree Star, Inc.).
Transmigration
Human CMEC/D3 cells (ATCC cell line collection) were grown in 24‐well hanging cell culture inserts (PET, 5‐μm pore, Millipore) at a density of 50,000 cells/cm2. Cells were cultured for 7 days prior to transmigration to allow the establishment of a tight monolayer of cells. The tightness of the cell monolayer was verified by transendothelial electrical resistance. PBMCs were isolated from human healthy blood (local blood bank), and monocytes and lymphocytes selected as CD14‐microbead‐positive (Miltenyi Biotec) and ‐negative populations, respectively. After Cell Trace Yellow staining (Thermo Fisher Scientific), 250,000 cells were added into the top chamber of the hCMEC/D3 cell‐containing inserts in RPMI GlutaMAX (Gibco), supplemented with 2% fetal bovine serum with or without 5 μg/ml LecB. The media of the bottom chamber was supplemented with 10% fetal bovine serum. Transwells were kept at 37°C and 5% CO2 for 17 h and the cells from the bottom chamber were harvested and lysed with CellTiter‐Glo Luminescent Cell Viability Assay (Promega). Luminescence was read in 96‐well flat bottom white plates (Corning) using the Spark plate reader (Tecan). Cells in the top chamber were fixed with 4% PFA, permeabilized with 0.1% Triton X‐100 and 0.5% BSA, and labeled with goat anti human VE‐Cadherin (R&D Systems) and a secondary anti‐goat antibody coupled with Alexa Fluor 488. Membranes were then detached from the inserts and mounted onto glass slides using Mowiol. Image acquisition was on an Axio Observer Z1 inverted microscope (Zeiss) equipped with a CSU‐X1 spinning disk head (Yokogawa), a back‐illuminated Electron‐multiplying charge‐coupled device (EMCCD) camera (Evolve, Photometrics), and 20× (0.75 numerical aperture) air objectives (Zeiss). Images were processed using FiJi (ImageJ software) with the plugin PureDenoise (École polytechnique fédérale de Lausanne, EPFL).
Endothelial cell–LecB interaction
Human CMEC/D3 cells were grown in EndoGRO‐MV Complete Culture Media Kit (Millipore, Burlington, MA, USA), human umbilical vein endothelial cells (HUVECs), and human skin LECs (PromoCell GmbH, Heidelberg, Germany) in endothelial cell growth medium 2 (PromoCell GmbH, Heidelberg, Germany) at 37°C in a humidified incubator containing 5% CO2 on gelatin‐coated plates. Cells at passages 3–6 were used for the experiments. For immunofluorescence, HUVECs were grown on 12‐mm glass cover slips in a 4‐well Nunc plate (Thermo Fisher Scientific) to 70–100% confluence. Cells were treated with LecB or LecB‐A488 (5 μg/ml) for 1 and 3 h. Then, cells were fixed with 4% (wt/vol) PFA for 10 min at RT, quenched with 50 mM ammonium chloride and incubated with 0.2% (vol/vol) saponin in PBS. After that, the cells were blocked with 3% BSA (vol/vol) in PBS and subsequently stained with anti‐CD144/VE‐cadherin (eBioscience) and anti‐FAK (D Biosciences), followed by donkey anti‐rabbit Alexa488 (Invitrogen) and goat anti‐mouse Alexa647 (Invitrogen), respectively. Nuclei and F‐actin were stained with DAPI (Sigma‐Aldrich) and Phalloidin Alexa565 (Sigma‐Aldrich), respectively. Samples were mounted on cover slips using Mowiol medium (Sigma‐Aldrich), and images acquired with a Nikon microscopy (Eclipse Ti‐E A1R system) with a 60× oil immersion objective. Images were processed using FiJi (ImageJ software). Subcellular protein distribution was measured as pixels using Fiji (ImageJ software), drawing the cell's perimembranous and the intracellular areas based on phase contrast images. For the quantification of VE‐cadherin, the intercellular pixels/area were subtracted by DAPI pixels/area. For cell viability test, cells were treated with LecB or 1 μM Staurosporine (Sigma‐Aldrich) for 1 h, followed by 8 μM CellEvent Caspase‐3/7 Green Detection Reagent (Invitrogen). MTT (3‐(4,5‐dimethylthiazol‐2‐yl)‐2,5‐diphenyltetrazolium bromide) tetrazolium reduction assay kit (Roth, 11465007001) was additionally used.
Live imaging of HUVECs
HUVECs were seeded on 35‐mm imaging dishes with a glass bottom (Ibidi) to 100% confluence. Cells were scratched and treated with or without LecB (5 μg/ml) for 3 h at 37°C. Then, cells were washed with PBS twice and incubated with 1 nM SiR‐actin (CY‐SC001, Spirochrome) for 1 h at 37°C, a fluorogenic, cell permeable dye with high specificity for F‐actin. Live images were recorded with a Nikon microscopy (Eclipse Ti‐E A1R system) with a 60x oil immersion objective for 30 min. Images were processed using FiJi (ImageJ software).
Western blot
To determine protein expression by western blot, HUVECs were washed, lysed in RIPA buffer containing phosphatase and protease inhibitors (200 μM pefablock 0.8 μM aprotinin, 11 μM leupeptin, 1% [v/v] phosphatase inhibitor cocktail 3 [Sigma‐Aldrich]) for 45 min on ice, and centrifuged to remove cell debris. The protein concentration of the cell lysates was determined using the Pierce BCA Protein Assay Kit (Thermo Scientific) according to the manufacturer's protocol. 25 μg of protein of each sample was separated on 8% SDS–polyacrylamide gels and transferred on nitrocellulose membranes by semi‐dry blotting. The membranes were blocked in 3% BSA for 1 h at RT and incubated with VE‐cadherin (eBioscience), anti‐phospho‐myosin light chain2 (Ser19) (Cell Signaling Technology), anti‐α‐tubulin (Cell Signaling), or anti‐GAPDH (Sigma‐Aldrich) overnight at 4°C. Membranes were then incubated with anti‐rabbit IgG‐HRP (Cell Signaling) or anti‐mouse IgG‐HRP (Cell Signaling) for 1 h at RT. The Clarity western ECL Blotting Substrate (BIO RAD) was used according to the manufacturer's protocol for signal development and chemiluminescence was detected using the Fusion FX chemiluminescence imager (Vilber Lourmat, Marne‐la‐Vallée, France). Densitometric quantification of blots was performed using ImageJ and protein levels were normalized to α‐tubulin or GAPDH.
Statistical analysis
Statistical analysis was performed using GraphPad Prism (version 9.0.2) software and the indicated statistical analysis software.
Author contributions
Janina Sponsel: Data curation; formal analysis; investigation; methodology; project administration. Yubing Guo: Data curation; formal analysis; investigation; methodology. Lutfir Hamzam: Investigation; methodology. Alice C Lavanant: Data curation; formal analysis; investigation; visualization; methodology. Annia Pérez‐Riverón: Data curation; formal analysis; investigation; methodology. Emma Partiot: Data curation; investigation; methodology. Quentin Muller: Data curation; investigation; methodology. Julien Rottura: Investigation; methodology. Raphael Gaudin: Conceptualization; resources; supervision; funding acquisition; project administration. Dirk Hauck: Resources. Alexander Titz: Resources; methodology. Vincent Flacher: Conceptualization; data curation; formal analysis; investigation; methodology. Winfried Römer: Conceptualization; resources; supervision; funding acquisition; validation; investigation; methodology. Christopher G Mueller: Conceptualization; resources; data curation; formal analysis; supervision; funding acquisition; validation; investigation; visualization; methodology; writing – original draft; project administration; writing – review and editing.
Disclosure and competing interests statement
The authors declare that they have no conflict of interest.
Supporting information
Expanded View Figures PDF
Movie EV1
Movie EV2
PDF+
Acknowledgements
This project was supported by the Deutsche Forschungsgemeinschaft (DFG, German Research Foundation) under Germany's Excellence Strategy (EXC‐294), by the Deutscher Akademischer Austauschdienst (DAAD, PPP Frankreich 2019 Phase I—project ID: 57445444), by the Ministry for Science, Research and Arts of the State of Baden‐Württemberg (Az: 33‐7532.20), by the Freiburg Institute for Advanced Studies (FRIAS), the Campus France‐Germany Procope programme (42523VF). This work was supported by the Agence Nationale de la Recherche (ANR‐20‐CE15‐0019‐01) to RG. JS was supported by an international PhD fellowship from the French Ministry of National Higher Education and Research and a co‐doctoral financial aid (No. CT‐17‐18) from the German‐French University. YG acknowledges the China Scholarship Council and a co‐doctoral financial aid (No. CT‐07‐20) from the German‐French University. We would like to express our gratitude to the Life Imaging Center (LIC) of the University of Freiburg for support, Jean‐Daniel Fauny for help in image data analysis, Delphine Lamon, and Fabien Lhericel for mouse handling and members of the teams for discussions. The funders had no role in study design, data collection and analysis, decision to publish, or preparation of the manuscript. Open Access funding enabled and organized by Projekt DEAL.
EMBO reports (2023) 24: e55971
Contributor Information
Winfried Römer, Email: winfried.roemer@bioss.uni-freiburg.de.
Christopher G Mueller, Email: c.mueller@unistra.fr.
Data availability
No large primary datasets have been generated and deposited.
References
- Avichezer D, Gilboa‐Garber N (1987) PA‐II, the L‐fucose and D‐mannose binding lectin of Pseudomonas aeruginosa stimulates human peripheral lymphocytes and murine splenocytes. FEBS Lett 216: 62–66 [DOI] [PubMed] [Google Scholar]
- Bansal A, Chand T, Kumar R (2016) Pseudomonas species as an uncommon culprit in transbronchial needle aspiration of mediastinal lymph node. J Assoc Chest Physicians 4: 91–93 [Google Scholar]
- Bazigou E, Lyons OT, Smith A, Venn GE, Cope C, Brown NA, Makinen T (2011) Genes regulating lymphangiogenesis control venous valve formation and maintenance in mice. J Clin Invest 121: 2984–2992 [DOI] [PMC free article] [PubMed] [Google Scholar]
- Birukov KG, Bochkov VN, Birukova AA, Kawkitinarong K, Rios A, Leitner A, Verin AD, Bokoch GM, Leitinger N, Garcia JG (2004) Epoxycyclopentenone‐containing oxidized phospholipids restore endothelial barrier function via Cdc42 and Rac. Circ Res 95: 892–901 [DOI] [PubMed] [Google Scholar]
- Birukova AA, Zagranichnaya T, Fu P, Alekseeva E, Chen W, Jacobson JR, Birukov KG (2007) Prostaglandins PGE(2) and PGI(2) promote endothelial barrier enhancement via PKA‐ and Epac1/Rap1‐dependent Rac activation. Exp Cell Res 313: 2504–2520 [DOI] [PMC free article] [PubMed] [Google Scholar]
- von Bismarck P, Schneppenheim R, Schumacher U (2001) Successful treatment of Pseudomonas aeruginosa respiratory tract infection with a sugar solution – a case report on a lectin based therapeutic principle. Klin Padiatr 213: 285–287 [DOI] [PubMed] [Google Scholar]
- Chemani C, Imberty A, de Bentzmann S, Pierre M, Wimmerová M, Guery BP, Faure K (2009) Role of LecA and LecB lectins in Pseudomonas aeruginosa‐induced lung injury and effect of carbohydrate ligands. Infect Immun 77: 2065–2075 [DOI] [PMC free article] [PubMed] [Google Scholar]
- Diggle SP, Stacey RE, Dodd C, Cámara M, Williams P, Winzer K (2006) The galactophilic lectin, LecA, contributes to biofilm development in Pseudomonas aeruginosa . Environ Microbiol 8: 1095–1104 [DOI] [PubMed] [Google Scholar]
- Flacher V, Tripp CH, Haid B, Kissenpfennig A, Malissen B, Stoitzner P, Idoyaga J, Romani N (2012) Skin langerin+ dendritic cells transport intradermally injected anti‐DEC‐205 antibodies but are not essential for subsequent cytotoxic CD8+ T cell responses. J Immunol 188: 2146–2155 [DOI] [PMC free article] [PubMed] [Google Scholar]
- Frensch M, Jäger C, Müller PF, Tadić A, Wilhelm I, Wehrum S, Diedrich B, Fischer B, Meléndez AV, Dengjel J et al (2021) Bacterial lectin BambL acts as a B cell superantigen. Cell Mol Life Sci 78: 8165–8186 [DOI] [PMC free article] [PubMed] [Google Scholar]
- Garcia JG, Liu F, Verin AD, Birukova A, Dechert MA, Gerthoffer WT, Bamberg JR, English D (2001) Sphingosine 1‐phosphate promotes endothelial cell barrier integrity by Edg‐dependent cytoskeletal rearrangement. J Clin Invest 108: 689–701 [DOI] [PMC free article] [PubMed] [Google Scholar]
- Gilboa‐Garber N (1972) Inhibition of broad spectrum hemagglutinin from Pseudomonas aeruginosa by D‐galactose and its derivatives. FEBS Lett 20: 242–244 [DOI] [PubMed] [Google Scholar]
- Gretz JE, Norbury CC, Anderson AO, Proudfoot AE, Shaw S (2000) Lymph‐borne chemokines and other low molecular weight molecules reach high endothelial venules via specialized conduits while a functional barrier limits access to the lymphocyte microenvironments in lymph node cortex. J Exp Med 192: 1425–1440 [DOI] [PMC free article] [PubMed] [Google Scholar]
- Kirkeby S, Wimmerová M, Moe D, Hansen AK (2007) The mink as an animal model for Pseudomonas aeruginosa adhesion: binding of the bacterial lectins (PA‐IL and PA‐IIL) to neoglycoproteins and to sections of pancreas and lung tissues from healthy mink. Microbes Infect 9: 566–573 [DOI] [PubMed] [Google Scholar]
- Lameignere E, Malinovská L, Sláviková M, Duchaud E, Mitchell EP, Varrot A, Sedo O, Imberty A, Wimmerová M (2008) Structural basis for mannose recognition by a lectin from opportunistic bacteria Burkholderia cenocepacia. Biochem J 411: 307–318 [DOI] [PubMed] [Google Scholar]
- Lämmermann T, Bader BL, Monkley SJ, Worbs T, Wedlich‐Söldner R, Hirsch K, Keller M, Förster R, Critchley DR, Fässler R et al (2008) Rapid leukocyte migration by integrin‐independent flowing and squeezing. Nature 453: 51–55 [DOI] [PubMed] [Google Scholar]
- Landi A, Mari M, Kleiser S, Wolf T, Gretzmeier C, Wilhelm I, Kiritsi D, Thünauer R, Geiger R, Nyström A et al (2019) Pseudomonas aeruginosa lectin LecB impairs keratinocyte fitness by abrogating growth factor signalling. Life Sci Alliance 2: e201900422 [DOI] [PMC free article] [PubMed] [Google Scholar]
- Lewis AL, Kohler JJ, Aebi M (2022) Microbial lectins: hemagglutinins, Adhesins, and toxins. In Essentials of Glycobiology, Varki A, Cummings RD, Esko JD, Stanley P, Hart GW, Aebi M, Mohnen D, Kinoshita T, Packer NH, Prestegard JH et al (eds), pp 505–516. Cold Spring Harbor, NY: Cold Spring Harbor Laboratory Press; [PubMed] [Google Scholar]
- Liu F, Schaphorst KL, Verin AD, Jacobs K, Birukova A, Day RM, Bogatcheva N, Bottaro DP, Garcia JG (2002) Hepatocyte growth factor enhances endothelial cell barrier function and cortical cytoskeletal rearrangement: potential role of glycogen synthase kinase‐3beta. FASEB J 16: 950–962 [DOI] [PubMed] [Google Scholar]
- Meiers J, Siebs E, Zahorska E, Titz A (2019) Lectin antagonists in infection, immunity, and inflammation. Curr Opin Chem Biol 53: 51–67 [DOI] [PubMed] [Google Scholar]
- Mewe M, Tielker D, Schönberg R, Schachner M, Jaeger KE, Schumacher U (2005) Pseudomonas aeruginosa lectins I and II and their interaction with human airway cilia. J Laryngol Otol 119: 595–599 [DOI] [PubMed] [Google Scholar]
- Mitchell EP, Sabin C, Snajdrová L, Pokorná M, Perret S, Gautier C, Hofr C, Gilboa‐Garber N, Koca J, Wimmerová M et al (2005) High affinity fucose binding of Pseudomonas aeruginosa lectin PA‐IIL: 1.0 a resolution crystal structure of the complex combined with thermodynamics and computational chemistry approaches. Proteins 58: 735–746 [DOI] [PubMed] [Google Scholar]
- Moore KH, Murphy HA, George EM (2021) The glycocalyx: a central regulator of vascular function. Am J Physiol Regul Integr Comp Physiol 320: R508–r518 [DOI] [PMC free article] [PubMed] [Google Scholar]
- Plotkowski MC, Saliba AM, Pereira SH, Cervante MP, Bajolet‐Laudinat O (1994) Pseudomonas aeruginosa selective adherence to and entry into human endothelial cells. Infect Immun 62: 5456–5463 [DOI] [PMC free article] [PubMed] [Google Scholar]
- Quadri SK (2012) Cross talk between focal adhesion kinase and cadherins: role in regulating endothelial barrier function. Microvasc Res 83: 3–11 [DOI] [PMC free article] [PubMed] [Google Scholar]
- Rosen DA, Pinkner JS, Walker JN, Elam JS, Jones JM, Hultgren SJ (2008) Molecular variations in Klebsiella pneumoniae and Escherichia coli FimH affect function and pathogenesis in the urinary tract. Infect Immun 76: 3346–3356 [DOI] [PMC free article] [PubMed] [Google Scholar]
- Singh RS, Walia AK (2014) Microbial lectins and their prospective mitogenic potential. Crit Rev Microbiol 40: 329–347 [DOI] [PubMed] [Google Scholar]
- Sommer R, Wagner S, Rox K, Varrot A, Hauck D, Wamhoff E‐C, Schreiber J, Ryckmans T, Brunner T, Rademacher C et al (2018) Glycomimetic, orally bioavailable LecB inhibitors block biofilm formation of Pseudomonas aeruginosa . J Am Chem Soc 140: 2537–2545 [DOI] [PubMed] [Google Scholar]
- Thuenauer R, Landi A, Trefzer A, Altmann S, Wehrum S, Eierhoff T, Diedrich B, Dengjel J, Nyström A, Imberty A et al (2020) The Pseudomonas aeruginosa lectin LecB causes integrin internalization and inhibits epithelial wound healing. mBio 11: e03260‐19 [DOI] [PMC free article] [PubMed] [Google Scholar]
- Tielker D, Hacker S, Loris R, Strathmann M, Wingender J, Wilhelm S, Rosenau F, Jaeger KE (2005) Pseudomonas aeruginosa lectin LecB is located in the outer membrane and is involved in biofilm formation. Microbiology 151: 1313–1323 [DOI] [PubMed] [Google Scholar]
- Vicente‐Manzanares M, Ma X, Adelstein RS, Horwitz AR (2009) Non‐muscle myosin II takes Centre stage in cell adhesion and migration. Nat Rev Mol Cell Biol 10: 778–790 [DOI] [PMC free article] [PubMed] [Google Scholar]
- Wagner S, Sommer R, Hinsberger S, Lu C, Hartmann RW, Empting M, Titz A (2016) Novel strategies for the treatment of Pseudomonas aeruginosa infections. J Med Chem 59: 5929–5969 [DOI] [PubMed] [Google Scholar]
- Wilhelm I, Levit‐Zerdoun E, Jakob J, Villringer S, Frensch M, Übelhart R, Landi A, Müller P, Imberty A, Thuenauer R et al (2019) Carbohydrate‐dependent B cell activation by fucose‐binding bacterial lectins. Sci Signal 12: eaao7194 [DOI] [PubMed] [Google Scholar]