

Abstract
ACE2 is a major receptor for cellular entry of SARS‐CoV‐2. Despite advances in targeting ACE2 to inhibit SARS‐CoV‐2 binding, strategies to flexibly and sufficiently reduce ACE2 levels for the prevention of SARS‐CoV‐2 infection have not been explored. Here, we reveal vitamin C (VitC) administration as a potent strategy to prevent SARS‐CoV‐2 infection. VitC reduces ACE2 protein levels in a dose‐dependent manner, while even a partial reduction in ACE2 levels can greatly inhibit SARS‐CoV‐2 infection. Further studies reveal that USP50 is a crucial regulator of ACE2 levels. VitC blocks the USP50‐ACE2 interaction, thus promoting K48‐linked polyubiquitination of ACE2 at Lys788 and subsequent degradation of ACE2 without affecting its transcriptional expression. Importantly, VitC administration reduces host ACE2 levels and greatly blocks SARS‐CoV‐2 infection in mice. This study reveals that ACE2 protein levels are down‐regulated by an essential nutrient, VitC, thereby enhancing protection against infection of SARS‐CoV‐2 and its variants.
Keywords: ACE2, prevention, SARS‐CoV‐2, USP50, vitamin C
Subject Categories: Microbiology, Virology & Host Pathogen Interaction; Pharmacology & Drug Discovery; Post-translational Modifications & Proteolysis
The deubiquitinase USP50 regulates the ubiquitination and stability of the ACE2 protein. Vitamin C blocks the USP50‐ACE2 interaction and thereby promotes ACE2 degradation and restricts SARS‐CoV‐2 entry.

Introduction
Angiotensin‐converting enzyme 2 (ACE2) is a regulator of the renin–angiotensin–aldosterone system (RAAS), which maintains blood pressure homeostasis as well as fluid and salt balance (Krege et al, 1995; Donoghue et al, 2000; Kuba et al, 2006). Recent studies have revealed that ACE2, a transmembrane glycoprotein, is the major entry receptor for some coronaviruses, including severe acute respiratory syndrome coronavirus 2 (SARS‐CoV‐2) and SARS‐CoV (Hoffmann et al, 2020). In comparison, the Spike (S) protein of SARS‐CoV‐2 has a higher affinity for human ACE2 than does that of SARS‐CoV (Wrapp et al, 2020), which could suggest an explanation for the severity of SARS‐CoV‐2‐induced coronavirus disease 2019 (COVID‐19). In addition, the infectivity of the recently prevalent SARS‐CoV‐2 variant Omicron is much greater, because the Omicron (BA.2) Spike trimer has an 11‐fold higher potency in binding to human ACE2 than does the wild‐type (WT) SARS‐CoV‐2 Spike trimer (Xu et al, 2022). Thus, ACE2 is the key target to control the infection of SARS‐CoV‐2 and its variants.
Inhibition of SARS‐CoV‐2‐Spike binding to host ACE2 is useful to block SARS‐CoV‐2 infection. Thus, current studies have focused on inhibition of the binding between ACE2 and Spike proteins through two major strategies: targeting either host ACE2 or the Spike protein of SARS‐CoV‐2. For example, the small molecule telmisartan targets ACE2 and therefore blocks SARS‐CoV‐2 binding (Rothlin et al, 2020). Likewise, many small molecules that target the Spike protein can inhibit ACE2‐Spike binding (Wang et al, 2022). In addition, monoclonal antibodies have been studied for their ability to target different proteins for inhibition of ACE2‐Spike binding (Chavda et al, 2022). However, no small compounds or antibodies have been used in daily prevention of SARS‐CoV‐2 infection thus far. In addition, ACE2 levels can be increased in elderly individuals by commonly used drugs (Ferrario et al, 2005; Winkelmayer et al, 2005; Verdecchia et al, 2010; Messerli et al, 2018) and can be strongly elevated by SARS‐CoV‐2 infection (Garvin et al, 2020; Ziegler et al, 2020), which makes it difficult to target all expressed ACE2.
Based on the consideration of daily protection from SARS‐CoV‐2 infection, we explored the possibility of partially reducing ACE2 levels as a new strategy for the prevention of SARS‐CoV‐2 infection. Attractively, we found that a 50% reduction in ACE2 protein levels strongly blocks SARS‐CoV‐2 infection. Intriguingly, by screening, we found that vitamin C (VitC, L‐ascorbic acid, ascorbate) decreased ACE2 protein levels in a dose‐dependent manner. VitC is an essential nutrient in vivo and a natural water‐soluble antioxidant that can safely be administered in very large amounts (such as 10 g daily; Chen et al, 2005). Thus, our study further explored the mechanisms by which VitC reduces ACE2 protein levels to prevent SARS‐CoV‐2 infection.
Results
VitC reduces ACE2 protein levels and inhibits cellular infection with SARS‐CoV‐2 in a dose‐dependent manner
ACE2 is expressed in a wide variety of human tissues. For example, ACE2 shows the highest levels in the kidney, small intestine, and adipose tissues; medium levels in the lung, colon, and liver; and the lowest levels in the brain, bone marrow, and blood (Li et al, 2020b). Thus, we measured ACE2 protein levels in several cell lines derived from different tissues, including HEK293T (kidney), A549 (lung), and Caco‐2 (colon) cells, as well as a human fibroblast cell line (2fTGH) due to the reported expression of ACE2 in lung fibroblasts (Mohamed et al, 2021), since these cell lines have been reported to be functional for SARS‐CoV‐2 infection. We found that all these cell lines expressed the ACE2 protein to varying degrees (Fig 1A). Given that ACE2 is essential for cellular entry of SARS‐CoV‐2, we first investigated how important the reduction in ACE2 levels is for protecting cells against SARS‐CoV‐2 infection. The results showed that reducing ACE2 levels by only 50% is enough to significantly lower the ability of SARS‐CoV‐2 to enter cells (Fig 1B), suggesting that even a partial reduction in ACE2 levels could provide great benefits for the prevention of SARS‐CoV‐2 infection.
Figure 1. VitC dose‐dependently reduces ACE2 proteins and restricts cellular infection with SARS‐CoV‐2.

- Western blot analysis of endogenous ACE2 in various types of cell lines, including 2fTGH, Caco‐2 and A549 cells, as well as HEK293T cells transfected with either control shRNAs (shCtrl) or shRNAs against ACE2 (shACE2). Data are representative of three biological replicates.
- HEK293T cells were transfected with shCtrl or increasing amounts of shACE2. Then cells were subjected to RT–qPCR analysis of Ace2 mRNA levels (right), or were infected with SARS‐CoV‐2 GFP/ΔN (MOI = 0.1) for 2 h. RT–qPCR was used to analyze SARS‐CoV‐2 RNA levels (left). Data are shown as mean and s.d. of three biological replicates (n = 3). *P < 0.05, **P < 0.01, ***P < 0.001 (two‐tailed unpaired Student's t‐test).
- Western blot analysis of ACE2 in Caco‐2 cells treated with vitamin (Vit) compounds (VitB1, 500 μM; VitB6, 500 μM; VitB12, 50 nM; VitC, 5 mM; VitD3, 25 μM; VitK1, 0.5 μM) for 24 h. Data are representative of three biological replicates.
- Western blot analysis of ACE2 in HEK293T, 2fTGH, Caco‐2 and A549 cells treated with VitC at indicated concentrations for 24 h. Data are representative of three biological replicates.
- Western blot analysis of ACE2 in HEK293T cells treated with 5 mM or 0.2 mM of VitC for different durations. Data are representative of three biological replicates.
- Immunofluorescence analysis of ACE2 proteins in HeLa cells treated with VitC (5 mM) for 24 h. Data are representative of three biological replicates. DAPI was used for the nucleus. Scale bars, 1 μm.
- Western blot analysis of ACE2, IRF3, and STAT1 in A549 cells treated with VitC at indicated concentrations for 24 h. Data are representative of three biological replicates.
- Fluorescence microscopy of the SARS‐CoV‐2 GFP/ΔN or VSV‐GFP viruses in Caco‐2‐N cells pretreated with VitC (5 mM and 10 mM) for 24 h, and then infected with SARS‐CoV‐2 GFP/ΔN (MOI = 0.1) or VSV‐GFP (MOI = 0.1) viruses for 24 h. Data are representative of three biological replicates. Scale bar: 100 μm.
- RT–qPCR analysis of SARS‐CoV‐2 GFP/ΔN or VSV RNA levels in Caco‐2 cells pretreated with VitC as (H), and then infected with SARS‐CoV‐2 GFP/ΔN (MOI = 0.1) or VSV (MOI = 0.1) for 2 h. Data are shown as mean and s.d. of three biological replicates (n = 3). N.S, not significant, ***P < 0.001 (two‐tailed unpaired Student's t‐test).
- Plaque assay for analysis of SARS‐CoV‐2 virus titer in Caco‐2‐N cells pretreated with VitC (10 mM, 24 h) and then infected with SARS‐CoV‐2 GFP/ΔN (MOI = 0.1) for 24 h. Data are shown as mean and s.d. of three biological replicates (n = 3). **P < 0.01 (two‐tailed unpaired Student's t‐test).
Source data are available online for this figure.
Given that new unknown compounds and even known clinical drugs are generally not feasible for timely application to prevent viral infection, we considered whether some conventional supplements, such as metal elements (Fig EV1A) or vitamins (Fig 1C), could effectively downregulate ACE2 and prevent SARS‐CoV‐2 infection. Interestingly, we found that vitamin C (VitC) at a concentration of 5 mM substantially decreased ACE2 protein levels (Fig 1C). It has been reported that normal cells are unaffected by 20 mM VitC and that even a concentration of 49 mM is still well tolerated (Stephenson et al, 2013). Consistent with this report, our data showed that treatment with VitC at even 5 mM for 24 h did not result in strong cytotoxic effects (Fig EV1B). Although the concentration of VitC in human plasma is approximately 50–70 μM under physiological conditions (Lykkesfeldt & Tveden‐Nyborg, 2019), the concentrations of VitC in various tissues are dozens‐fold higher than those in plasma, in the range of 0.5–10 mM (Lindblad et al, 2013; Lykkesfeldt & Tveden‐Nyborg, 2019). When additional VitC is supplemented orally, the plasma concentrations of VitC can increase to 220 μM (Levine et al, 1996; Lindblad et al, 2013); thus, the concentrations of VitC in different tissues could increase to much higher than 0.5–10 mM after oral VitC administration. Interestingly, we found that approximately 10 mM VitC strongly reduced ACE2 protein levels in all tested cells, particularly in HEK293T human kidney cells and 2fTGH human fibroblasts (Fig 1D). Therefore, we mainly employed these two cell lines in the following studies. In fact, VitC, even at lower concentrations (0.2 mM), obviously reduced ACE2 levels in a time‐dependent manner (Fig 1E). In addition, by immunofluorescence analysis, we further confirmed the reduction in the ACE2 protein level induced by VitC (Fig 1F). Importantly, not all cellular proteins were downregulated by VitC at these concentrations. For example, the protein levels of two commonly studied immune‐related transcription factors, IRF3 and STAT1, remained unchanged under 1–25 mM VitC treatment (Fig 1G).
Figure EV1. VitC restricts cellular infection with viruses carrying the SARS‐CoV‐2‐S gene.

- Western blot analysis of ACE2 in Caco‐2 cells treated with 20 μM of individual compounds (MgSO4, CaCl2, SnCl2, KCl, NaHCO3, FeSO4, NaI, and NuBu) for 24 h. Data are representative of three biological replicates.
- Cell counting kit 8 (CCK8) assay for analyzing the proliferation of Caco‐2 cells treated with VitC for 24 h at different concentrations as indicated. Data are shown as mean and s.d. of three biological replicates (n = 3). N.S, not significant (two‐tailed unpaired Student's t‐test).
- Western blot analysis of VSV‐G proteins in Caco‐2 cells treated with VitC (5 mM) for 24 h and then infected with VSV‐GFP (MOI = 0.1) for 24 h. Data are representative of three biological replicates.
- Caco‐2‐N cells were infected with SARS‐CoV‐2 GFP/ΔN (MOI = 0.1) for 2 h. After washing, cells were treated with VitC (2.5 mM) for 6, 12, and 24 h. RT–qPCR was used to analyze SARS‐CoV‐2 RNA levels. Data are shown as mean and s.d. of three biological replicates (n = 3). N.S, not significant (two‐tailed unpaired Student's t‐test).
- Fluorescence microscopy analysis of the VSV viruses with a SARS‐CoV‐2‐S and a GFP gene (VSV‐Spike) in HEK293T cells pretreated with VitC (2.5 mM and 5 mM) or vitamin B1 (VitB1, 250 μM and 500 μM) or vitamin D3 (VitD3, 12.5 μM and 25 μM) for 12 h, followed by infection with the VSV‐Spike viruses (MOI = 0.1) for 24 h. Data are representative of three biological replicates. Scale bars: 100 μm.
- RT–qPCR analysis of the VSV viruses with a NL63‐Spike gene in Caco‐2‐N cells pretreated with VitC (5 mM) for 12 h and then infected with the virus with a NL63‐Spike gene (MOI = 0.1) for 2 h or 24 h. Data are shown as mean and s.d. of three biological replicates (n = 3). **P < 0.01, ***P < 0.001 (two‐tailed unpaired Student's t‐test).
Source data are available online for this figure.
Next, we employed the SARS‐CoV‐2 GFP/ΔN viral strain, in which a GFP reporter gene is used to replace the viral nucleocapsid (N) gene in the complete SARS‐CoV‐2 viral genome (Ju et al, 2021), to observe the effect of VitC on SARS‐CoV‐2 infection. To this end, Caco‐2‐N cells that stably express the N protein of SARS‐CoV‐2 were pretreated with VitC and then infected with the virus for 24 h. VitC markedly inhibited SARS‐CoV‐2 infection but not vesicular stomatitis virus (VSV)‐GFP virus infection (Figs 1H and EV1C). However, when the cells were first infected with SARS‐CoV‐2 and then treated with VitC, SARS‐CoV‐2 replication in Caco‐2‐N cells was not significantly affected (Fig EV1D). Furthermore, Caco‐2 cells were infected with the SARS‐CoV‐2 GFP/ΔN virus for only 2 h to observe viral entry. Similarly, we found that VitC treatment strongly blocked cellular entry of SARS‐CoV‐2 but not VSV (Fig 1I), and lowered SARS‐CoV‐2 GFP/ΔN virus titers in Caco‐2‐N cells (Fig 1J). In addition, we also used a replication‐competent VSV encoding a SARS‐CoV‐2‐Spike gene (VSV‐Spike), to study virus entry into cells via the SARS‐CoV‐2‐S protein. The results showed that VitC but neither VitB1 nor VitD3 dramatically blocked SARS‐CoV‐2‐S‐mediated infection by the virus (Fig EV1E). In line with the observation with the VSV‐Spike virus, VitC also inhibited infection by the virus with a coronavirus NL63‐S gene, because the NL63‐S protein also targets ACE2 for viral entry (Fig EV1F). Taken together, these findings suggested that VitC can greatly block cellular infection with SARS‐CoV‐2.
VitC regulates K48‐linked polyubiquitination and protein stability of ACE2
We next studied how VitC reduces ACE2 protein levels. Our data showed that VitC did not significantly affect ACE2 mRNA levels (Fig 2A). Thus, we further investigated whether VitC regulates ACE2 at the protein level. The cycloheximide (CHX) pulse chase assay demonstrated that VitC treatment promoted ACE2 protein degradation (Fig 2B), suggesting that VitC lowers ACE2 protein stability. Consistent with the above findings, the level of exogenously expressed Myc‐ACE2 protein was also reduced by VitC (Fig 2C). Furthermore, we identified the pathway of ACE2 protein degradation. To this end, a proteasome inhibitor (MG132) and the lysosome inhibitor methylamine (MA) were utilized. The results showed that MA blocked the VitC‐mediated decrease in the ACE2 protein level (Fig 2D), suggesting that VitC promotes ACE2 protein degradation through the lysosome pathway.
Figure 2. VitC regulates K48‐linked polyubiquitination and protein stability of ACE2.

- RT–qPCR analysis of Ace2 mRNA in 2fTGH cells treated with VitC (5 mM) as indicated. Data are shown as mean and s.d. of three biological replicates (n = 3). N.S, not significant (two‐tailed unpaired Student's t‐test).
- Western blot analysis of ACE2 in 2fTGH cells pretreated with ddH2O (Ctrl) or VitC (5 mM) for 12 h and then treated with CHX (50 μM) for 6 and 12 h. Data are representative of three biological replicates.
- Western blot analysis of Myc‐ACE2 levels in HEK293T cells transfected with Myc‐ACE2 and then treated with VitC at indicated concentrations for 12 h. Data are representative of three biological replicates.
- Western blot analysis of ACE2 in HEK293T cells pretreated with MG132 (10 μM) or MA (10 μM) for 2 h, followed by VitC treatment (5 mM) for 6 h. Data are representative of three biological replicates.
- Immunoprecipitation (IP)‐immunoblotting (IB) analysis of ubiquitination (Ub) of endogenous ACE2 in 2fTGH cells treated with VitC at indicated concentrations for 12 h. Data are representative of three biological replicates.
- IP‐IB analysis of ubiquitination types of Myc‐ACE2 in HEK293T cells cotransfected with Myc‐ACE2 and different types of HA‐Ub, and then treated with VitC (5 mM) for 12 h. The red dashed contour represents the group of K48‐linked ubiquitination we focused on studying here. Data are representative of three biological replicates.
- IP‐IB analysis of K48‐linked polyubiquitination (K48‐Ub) of Myc‐ACE2 in HEK293T cells transfected with Myc‐ACE2 and then treated with VitC (2.5 and 5 mM) for 12 h, using a specific anti‐K48‐Ub antibody. Data are representative of three biological replicates.
- IP‐IB analysis of K48‐Ub of endogenous ACE2 in 2fTGH cells treated with VitC (2.5 and 5 mM) for 12 h. Data are representative of three biological replicates.
Source data are available online for this figure.
Given that VitC promotes ACE2 protein degradation, we next investigated whether VitC regulates ACE2 ubiquitination. The results showed that VitC treatment markedly increased the ubiquitination levels of both exogenously expressed ACE2 (Fig EV2A) and endogenous ACE2 (Figs 2E and EV2B). Furthermore, analysis of ACE2 ubiquitination types revealed that in comparison to other types of polyubiquitination linkages, VitC largely promoted K48‐linked polyubiquitination of ACE2 (Fig 2F), which was in line with the increased degradation of ACE2 proteins, since K48‐linked polyubiquitination has been demonstrated to mainly induce protein degradation. Moreover, using a specific anti‐K48‐linked ubiquitin antibody, we confirmed that VitC markedly promoted K48‐linked polyubiquitination of exogenously expressed ACE2 (Fig 2G) and endogenous ACE2 in multiple types of cells, including HEK293T (Fig 2H), A549 and Caco‐2 (Fig EV2C and D) cells. Collectively, these findings revealed that VitC reduces ACE2 protein levels by inducing K48‐linked polyubiquitination and lysosome‐dependent degradation of ACE2 proteins.
Figure EV2. VitC treatment upregulates K48‐linked polyubiquitination of ACE2.

-
AImmunoprecipitation (IP)‐immunoblotting (IB) analysis of total ubiquitination of Flag‐ACE2 in HEK293T cells transfected with Flag‐ACE2 and then treated with VitC as indicated for 12 h. Data are representative of three biological replicates.
-
BIP‐IB analysis of total ubiquitination of endogenous ACE2 in Caco‐2 cells treated with VitC (2.5 and 5 mM) for 12 h. Data are representative of three biological replicates.
-
C, DIP‐IB analysis of K48‐linked polyubiquitination of endogenous ACE2 in A549 (C) and Caco‐2 (D) cells treated with VitC (2.5 and 5 mM) for 12 h. Data are representative of three biological replicates.
Source data are available online for this figure.
VitC‐mediated reduction in ACE2 protein levels depends on the deubiquitinase USP50
To identify the key molecule that mediates ACE2 ubiquitination induced by VitC, we first utilized a pan‐deubiquitinase inhibitor, PR619 (Ritorto et al, 2014). The results showed that inhibition of deubiquitinases substantially decreased the ACE2 protein level and blocked VitC‐mediated downregulation of ACE2 (Fig 3A), suggesting that VitC can regulate certain deubiquitinases to reduce the ACE2 protein level. Thus, a deubiquitinase expression library was used to identify the potential deubiquitinase. We found that despite the potential involvement of multiple deubiquitinases in the regulation of ACE2 protein levels, the deubiquitinase USP50 showed the strongest effect on ACE2 upregulation (Fig 3B). Further analysis demonstrated that USP50 was able to interact with exogenously expressed ACE2 (Fig 3C), and there was a constitutive interaction between endogenous USP50 and ACE2 in cells (Figs 3D and EV3A). Moreover, USP50 overexpression increased ACE2 protein levels in a dose‐dependent manner (Fig 3E), while knockdown of USP50 by two specific shRNAs dramatically reduced the ACE2 level (Fig 3F). Consistent with the above findings, USP50 overexpression increased ACE2 protein stability (Fig 3G). The results in USP50‐knockout cells confirmed that USP50 deficiency reduced ACE2 protein levels (Fig 3H). Importantly, VitC lost the ability to efficiently decrease ACE2 levels in USP50‐deficient cells (Fig 3I), suggesting that USP50 is critical for VitC‐induced ACE2 reduction.
Figure 3. VitC‐induced reduction of ACE2 levels largely depends on the deubiquitinase USP50.

- Western blot analysis of ACE2 in HEK293T cells pretreated with PR619 (50 μM, 2 h) and then treated with VitC (5 mM) for 12 h. Data are representative of three biological replicates.
- HEK293T cells were individually transfected with the plasmids from the human DUBs expression library. Western blot was used to identify the key deubiquitinase that significantly increases ACE2 levels. Data were from two biological replicates and were shown as the fold change (the intensity of ACE2/Tubulin bands measured by the Image J) normalized to the empty vector group (CON).
- IP‐IB analysis of the interaction between Flag‐USP50 and Myc‐ACE2 in HEK293T cells cotransfected with these two constructs. Data are representative of three biological replicates.
- Immunoprecipitation analysis of the interaction between endogenous USP50 and ACE2 in 2fTGH cells. Data are representative of three biological replicates.
- Western blot analysis of ACE2 in HEK293T cells transfected with increasing amounts of Flag‐USP50. Data are representative of three biological replicates.
- Western blot analysis of ACE2 in HEK293T cells transfected with shCtrl or shUSP50 (#1 or #2). Data are representative of three biological replicates.
- Western blot analysis of ACE2 in HEK293T cells transfected with Flag‐USP50 and then treated with CHX (50 μM) as indicated. Data are representative of three biological replicates.
- Western blot analysis of ACE2 in Usp50 +/+ and Usp50 −/− HEK293T cells. Data are representative of three biological replicates.
- Western blot analysis of ACE2 in Usp50 +/+ and Usp50 −/− HEK293T cells treated with VitC (5 mM) for 12 h. Data are representative of three biological replicates.
- RT–qPCR analysis of SARS‐CoV‐2 GFP/ΔN RNA levels in HEK293T cells transfected with Flag‐USP50 and then infected with the SARS‐CoV‐2 GFP/ΔN virus (MOI = 0.1) for 2 h. Data are shown as mean and s.d. of three biological replicates (n = 3). *P < 0.05 (two‐tailed unpaired Student's t‐test).
- Fluorescence microscopy of the VSV virus with a SARS‐CoV‐2‐S gene and a GFP gene (VSV‐Spike) in Usp50 +/+ and Usp50 −/− HEK293T cells pretreated with or without VitC (5 mM) for 12 h, followed by infection with the VSV‐Spike virus (MOI = 0.1) for 24 h. Scale bar: 100 μm. The average intensity each unit area was shown as mean and s.d. of three‐unit areas (n = 3). N.S, not significant, ***P < 0.001 (two‐tailed unpaired Student's t‐test).
Source data are available online for this figure.
Figure EV3. USP50 interacts with ACE2 and regulates ACE2 protein levels via its deubiquitinase activity.

- IP‐IB analysis of the interaction between endogenous USP50 and ACE2 in HEK293T cells. Data are representative of three biological replicates.
- RT–qPCR analysis of SARS‐CoV‐2 GFP/ΔN RNA levels in 2fTGH cells transfected with control shRNAs (shCtrl) or shRNAs against USP50 (shUSP50) and then infected with SARS‐CoV‐2 GFP/ΔN (MOI = 0.1) for 2 h. Data are shown as mean and s.d. of three biological replicates (n = 3). **P < 0.01 (two‐tailed unpaired Student's t‐test).
- Western blot analysis of ACE2 in HEK293T cells transfected with Flag‐HA‐tagged USP50 (FH‐USP50) wild‐type (WT) or its deubiquitinase inactive mutant (C53S). Data are representative of three biological replicates.
- IP‐IB analysis of ubiquitination of Myc‐ACE2 in HEK293T cells cotransfected with Myc‐ACE2 and increasing amounts of Flag‐USP50. Data are representative of three biological replicates.
Source data are available online for this figure.
Considering the importance of USP50 in the regulation of ACE2 levels by VitC, we further observed the role of USP50 in SARS‐CoV‐2 infection. Consistent with the USP50‐mediated ACE2 upregulation, overexpression of USP50 significantly promoted cellular infection with SARS‐CoV‐2 (Fig 3J). Conversely, knockdown of USP50 inhibited SARS‐CoV‐2 infection (Fig EV3B). Importantly, USP50 knockout largely suppressed the effect of VitC on the inhibition of SARS‐CoV‐2 infection (Fig 3K), suggesting that USP50 is crucial for the inhibition of SARS‐CoV‐2 infection by VitC. Taken together, these findings demonstrated that VitC regulates ACE2 levels and SARS‐CoV‐2 infection in a USP50‐dependent manner.
VitC and USP50 regulate K48‐linked polyubiquitination of ACE2 at Lys788
Next, we sought to determine the detailed mechanisms by which the deubiquitinase USP50 regulates ACE2. We first found that a deubiquitinase‐inactive mutant of USP50 (USP50‐C53S) lost the ability to increase ACE2 protein levels (Fig EV3C), suggesting that USP50 regulates ACE2 levels in a manner dependent on its deubiquitinase activity. In line with this finding, USP50‐wild type (WT) but not the USP50‐C53S mutant reduced the ubiquitination level of ACE2 in cells (Figs 4A and EV3D). Furthermore, the in vitro deubiquitination assay confirmed that USP50‐WT, but not USP50‐C53S, was able to deubiquitinate ACE2 proteins (Fig 4B). Consistent with the above findings, USP50 knockdown increased ACE2 ubiquitination (Fig 4C). Next, analysis of ACE2 ubiquitination types revealed that USP50 mainly reduced K48‐linked polyubiquitination of ACE2 compared to other types of ubiquitination linkage (Fig 4D), in accord with the USP50‐mediated increase in ACE2 protein levels. Furthermore, using an anti‐K48‐linked ubiquitin antibody, we confirmed that USP50 regulates K48‐linked polyubiquitination of ACE2 (Fig 4E).
Figure 4. USP50 regulates K48‐linked polyubiquitination of ACE2.

- IP‐IB analysis of ubiquitination of Myc‐ACE2 in HEK293T cells transfected with Myc‐ACE2, together with Flag‐USP50 (WT) or its deubiquitinase inactive mutant (C53S). Data are representative of three biological replicates.
- Flag‐USP50 (WT or C53S) and Myc‐ACE2 proteins were individually immunoprecipitated from HEK293T cells transfected with the corresponding constructs, and subjected to extensive high‐salt (500 mM NaCl) washing. Flag‐USP50 (WT or C53S) proteins were eluted by Flag peptides and then mixed with Myc‐ACE2 proteins bound to the Myc beads. In vitro deubiquitination assay was performed at 4°C for 6 h. Data are representative of three biological replicates.
- IP‐IB analysis of ubiquitination of endogenous ACE2 in HEK293T cells transfected with either shCtrl (−) or shUSP50 (#1, #2). Data are representative of three biological replicates.
- IP‐IB analysis of ubiquitination types of Myc‐ACE2 in HEK293T cells cotransfected with Myc‐ACE2, Flag‐USP50 and different types of HA‐Ub. The red dashed contour represents the group of K48‐linked ubiquitination we focused on studying here. Data are representative of three biological replicates.
- IP‐IB analysis of K48‐Ub of endogenous ACE2 in HEK293T cells transfected with shCtrl (−) or shUSP50 (#1, #2). Data are representative of three biological replicates.
Source data are available online for this figure.
We further explored the key lysine (Lys) residue of ACE2 regulated by USP50. In the PhosphoSitePlus database, we found that there are three ubiquitinated lysine residues of ACE2: Lys 625, 676, and 788 (Hornbeck et al, 2015a; Data ref: Hornbeck et al, 2015b). Thus, we mutated each lysine (K) residue to arginine (R). We found that mutation of the Lys788 residue greatly lowered the K48‐linked polyubiquitination level of ACE2 (Figs 5A and EV4A). Furthermore, when the Lys788 residue of ACE2 was mutated, USP50 knockdown no longer regulated either the K48‐linked polyubiquitination (Fig 5B) or the protein level (Fig EV4B) of ACE2, suggesting that USP50 regulates K48‐linked polyubiquitination of ACE2 at the Lys788 residue. In addition, mutation of the Lys788 residue increased the protein stability of ACE2 (Fig 5C). Importantly, VitC‐induced upregulation of ACE2 K48‐linked polyubiquitination was abolished by mutating the Lys788 residue of ACE2 (Fig 5D), and VitC did not reduce the protein levels of ACE2‐K788R (Fig 5E). We then generated an ACE2‐knockout (KO) cell line using CRISPR‐Cas9 (Fig EV4C). By expressing ACE2‐WT or ACE2‐K788R in ACE2‐KO cells, we found that VitC reduced ACE2‐WT but not ACE2‐K788R protein levels (Fig 5F). Consistent with the above findings, VitC inhibited SARS‐CoV‐2 infection of cells with ACE2‐WT but not those with ACE2‐K788R (Fig 5G). Taken together, these findings demonstrated that VitC and USP50 regulate K48‐linked polyubiquitination of ACE2 at Lys788.
Figure 5. USP50 regulates ACE2 K48‐linked ubiquitination at Lys788.

- Putative ubiquitination sites of ACE2 in the PhosphoSitePlus database (Upper). Myc‐ACE2 K48‐linked ubiquitination was analyzed by IP‐IB in HEK293T cells cotransfected with Myc‐ACE2 (WT or its mutants) and HA‐K48‐Ub (Lower). Data are representative of three biological replicates.
- IP‐IB analysis of Myc‐ACE2 K48‐linked ubiquitination in HEK293T cells cotransfected with Myc‐ACE2 (WT or K788R) and HA‐K48, together with shCtrl or shUSP50. Data are representative of three biological replicates.
- Western blot analysis of Myc‐ACE2 in HEK293T cells transfected with Myc‐ACE2 (WT or K788R) and then treated with CHX (50 μM) as indicated. Data are representative of three biological replicates.
- IP‐IB analysis of K48‐Ub of Myc‐ACE2 in HEK293T cells transfected with Myc‐ACE2 (WT or K788R) and then treated with VitC (5 mM) for 12 h, by a specific anti‐K48‐Ub antibody. Data are representative of three biological replicates.
- Western blot analysis of Myc‐ACE2 in HEK293T cells transfected with Myc‐ACE2 (WT or K788R) and then treated with VitC (5 mM) as indicated. Data are representative of three biological replicates.
- Western blot analysis of ACE2 levels in ACE2‐KO Caco‐2 cells transfected with ACE2‐WT or ACE2‐K788R and then treated with VitC (5 mM) for 12 h. Data are representative of three biological replicates.
- ACE2‐KO Caco‐2 cells transfected with ACE2 (WT or K788R) were treated with VitC (5 mM) for 12 h, and then were infected with SARS‐CoV‐2 GFP/ΔN (MOI = 0.1) for 2 h. RT–qPCR was used to analyze SARS‐CoV‐2 RNA levels. Data are shown as mean and s.d. of three biological replicates (n = 3). N.S, not significant, ***P < 0.001 (two‐tailed unpaired Student's t‐test).
Source data are available online for this figure.
Figure EV4. The regulation of ACE2 levels by USP50 depends on the Lys788 residue of ACE2.

- IP‐IB analysis of K48‐linked polyubiquitination of Myc‐ACE2 in HEK293T cells transfected with Myc‐ACE2 (WT or its mutants). Data are representative of three biological replicates.
- Western blot analysis of Myc‐ACE2 in HEK293T cells transfected with Myc‐ACE2 (WT or K788R), together with shCtrl (−) or shUSP50 (+). Data are representative of three biological replicates.
- CRISPR‐Cas9 was used to generate ACE2‐knockout (KO) cells in Caco‐2. Western blot was used to analyze ACE2 protein levels in ACE2‐WT or ACE2‐KO cells. Data are representative of three biological replicates.
- Western blot analysis of FH‐USP50 levels in HEK293T cells transfected with FH‐USP50 and then treated with VitC as indicated for 12 h. Data are representative of three biological replicates.
Source data are available online for this figure.
VitC blocks the interaction between USP50 and ACE2
Given that VitC has a similar effect as USP50 knockdown on the regulation of ACE2 ubiquitination, we hypothesized that VitC could inhibit USP50‐mediated regulation of ACE2. Thus, we employed an in vitro binding assay to investigate the role of VitC in affecting the interaction between USP50 and ACE2. The results showed that VitC inhibited the interaction between Flag‐USP50 and Myc‐ACE2 in cells in a dose‐dependent manner (Fig 6A). In fact, VitC did not affect USP50 protein levels (Fig EV4D). Similarly, VitC also blocked the interaction between endogenous USP50 and ACE2 (Fig 6B). The in vitro binding assay demonstrated that VitC competitively inhibited the interaction between Flag‐USP50 and Myc‐ACE2 (Fig 6C). Moreover, using recombinant human ACE2 proteins, we confirmed that VitC blocked the interaction between USP50 and ACE2 in a dose‐dependent manner (Fig 6D). Collectively, these findings suggested that VitC competitively inhibits the USP50‐ACE2 interaction.
Figure 6. VitC blocks the interaction between USP50 and ACE2.

- IP‐IB analysis of the interaction between Flag‐USP50 and Myc‐ACE2 in HEK293T cells transfected with these two constructs and then treated with VitC (2.5 mM and 5 mM) for 12 h. Data are representative of three biological replicates.
- IP‐IB analysis of the in vivo interaction between endogenous USP50 and ACE2 in 2fTGH cells treated with VitC (5 mM) for 12 h. Data are representative of three biological replicates.
- Myc‐ACE2 and Flag‐USP50 proteins were immunoprecipitated from HEK293T cells transfected with either Myc‐ACE2 or Flag‐USP50. Flag‐USP50 proteins were eluted by the Flag peptides. After washing by high‐salt buffer, Flag‐USP50 proteins were mixed with the Myc beads with Myc‐ACE2, together with or without VitC (5 mM) for 2 h. After centrifuging, Flag‐USP50 proteins interacting with Myc‐ACE2 were analyzed by immunoblotting. Data are representative of three biological replicates.
- Flag‐USP50 proteins were obtained as (C). Flag‐USP50 and r‐hACE2 proteins were mixed, together with increasing amounts of VitC or with VitC‐Na+ (20 mM). HCl is a pH control (pH = 4). After 2 h incubation, ACE2 proteins were analyzed by immunoblotting by a specific anti‐ACE2 antibody. Data are representative of three biological replicates.
Source data are available online for this figure.
VitC administration reduces ACE2 levels and restricts SARS‐CoV‐2 infection in vivo
To observe how VitC administration promotes the prevention of SARS‐CoV‐2 infection in vivo, we employed a humanized ACE2 (hACE2) mouse model, since the Spike protein of SARS‐CoV‐2 cannot target mouse ACE2. We found that USP50 indeed interacted with ACE2 constitutively in all observed tissues, including the lung, liver, and kidney (Figs 7A and EV5A). It has been reported that intraperitoneal (i.p.) administration of VitC (1 g/kg body weight) in mice can result in a maximum plasma concentration of 7 mM (Vilcheze et al, 2018). Thus, based on the concentrations of VitC (1–5 mM) tested in cell lines in our study, we evaluated the in vivo effects of VitC administration (0.3 g/kg body weight) on the ubiquitination and protein levels of ACE2 as well as on SARS‐CoV‐2‐S‐mediated viral infection. The results showed that VitC strongly blocked the interaction between USP50 and ACE2 in the lung tissues of mice (Fig 7B). Consistent with this finding, the K48‐linked polyubiquitination levels of endogenous ACE2 in mouse tissues were markedly increased by VitC administration (Fig 7C). As a consequence, VitC administration largely reduced ACE2 protein levels in various tissues of mice (Figs 7D and E, and EV5B).
Figure 7. VitC administration reduces ACE2 and restricts SARS‐CoV‐2 infection in vivo .

- IP‐IB analysis of the interaction between endogenous hACE2 and USP50 in the lung and liver tissues of a hACE2 mouse. Data are representative of three biological replicates.
- The hACE2 mice were intraperitoneally administrated with VitC (300 mg/day/kg body weight) for 2 days. The interaction between USP50 and hACE2 in mouse lung tissues was analyzed by IP‐IB. Data are representative of three biological replicates.
- IP‐IB analysis of K48‐Ub of hACE2 in mouse lung tissues from (B). Data are representative of three biological replicates.
- Western blot analysis of hACE2 levels in lung tissues of hACE2 mice (n = 6) administrated with VitC as (B). Data are representative of three biological replicates.
- Immunohistochemical staining of hACE2 protein in the lung, kidney, and liver tissues from (B). Data are representative of three biological replicates. Scale bar: 50 μm.
- The hACE2 mice were administrated with VitC as (B). Mice were then given intraperitoneal injections of the VSV‐Spike viruses (1 × 10⁶ PFU per gram body). After 24 h, immunohistochemical staining was performed to analyze the SARS‐CoV‐2‐Spike proteins in mouse lung and kidney tissues. Data are representative of three biological replicates. Scale bar: 100 μm.
- RT–qPCR analysis of the SARS‐CoV‐2‐Spike mRNA levels in lung, kidney, liver, and spleen tissues of hACE2 mice treated with VitC and the VSV‐Spike viruses as (F). All graphs show the mean ± SEM for five individual mice (n = 5). ***P < 0.001 (two‐tailed unpaired Student's t‐test).
Source data are available online for this figure.
Figure EV5. USP50 interacts with hACE2 in vivo .

- IP‐IB analysis of the interaction between endogenous hACE2 and USP50 in kidney tissues of hACE2 mice. Data are representative of three biological replicates.
- The hACE2 mice were intraperitoneally administrated with VitC (300 mg/day/kg body weight) for 2 days. Western blot was used to analyze hACE2 levels in spleen tissues of hACE2 mice. N = 6. Data are representative of three biological replicates.
Source data are available online for this figure.
Given that VitC administration substantially lowers ACE2 levels, we further utilized the VSV‐Spike virus to study SARS‐CoV‐2‐Spike‐mediated viral infection of hACE2 mice. To this end, mice were first administered VitC (0.3 g/day/kg body weight) for 2 days and then infected with the VSV‐Spike virus for 24 h. By immunostaining for the Spike protein of SARS‐CoV‐2, we found that VitC markedly lowered the levels of SARS‐CoV‐2 Spike proteins in various mouse tissues (Fig 7F), suggesting that VitC inhibits SARS‐CoV‐2‐S‐mediated viral infection in vivo. Moreover, the analysis of SARS‐CoV‐2‐S RNA levels confirmed that VitC administration significantly inhibited SARS‐CoV‐2‐S‐mediated viral infection (Fig 7G). Here, it should be noted that the systemic infection observed in the hACE2 mouse model is not necessarily reflective of the infection status in humans. Taken together, these findings demonstrated that VitC administration blocks SARS‐CoV‐2‐S‐mediated viral infection by reducing ACE2 levels in vivo.
Discussion
VitC administration is a flexible and easy treatment based on actual daily requirements. Our study revealed that VitC, a natural compound obtained from a wide range of sources, can reduce ACE2 protein levels in a dose‐dependent manner; this ability provides great benefits to the prevention of cellular SARS‐CoV‐2 infection (Fig 8). However, it is worth noting that very long‐term use of high‐dose VitC could cause harmful side effects. Thus, it is suggested that a high dose of VitC can be used for prevention only in environments with a risk of SARS‐CoV‐2 infection.
Figure 8. A model for VitC‐mediated inhibition of SARS‐CoV‐2 entry into cells.
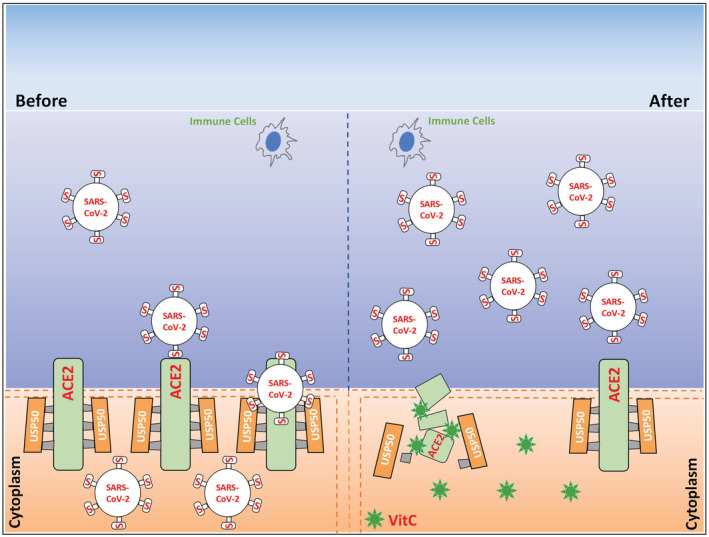
The deubiquitinase USP50 controls ACE2 protein stability and levels, while vitamin C blocks the USP50‐ACE2 interaction and therefore results in ACE2 degradation. This effect of vitamin C blocks SARS‐CoV‐2 entry into the cells, which could facilitate the subsequent clearance of the viruses detaining outside the cells by the immune cells of the body. This offers an easy and flexible approach to protection of the host from SARS‐CoV‐2 infection.
In addition to a role in mediating SARS‐CoV‐2 cellular entry, ACE2 also has some important physiological functions. ACE2 plays a crucial role in the cardiovascular system by regulating the RAAS (Donoghue et al, 2000; Crackower et al, 2002). Activation of the ACE2‐Ang I (1–7) axis regulates inflammatory responses and protects against organ injury in many diseases and pathological conditions, such as cardiovascular diseases, chronic kidney diseases, obesity, and liver and lung injury (Rodrigues Prestes et al, 2017). In addition to respiratory symptoms, COVID‐19 also results in some extrapulmonary pathologies, including vascular and myocardial complications, kidney injury, and hepatic injury, because ACE2 is widely expressed in many tissues (Gupta et al, 2020). These results suggest that ACE2 is important for protection from tissue injury during severe COVID‐19. Given that VitC dramatically reduced ACE2 levels, our study provided evidence that VitC could be harmful if used for the treatment of severe COVID‐19. In fact, some clinical therapeutic studies showed that high‐dose VitC may lower the mortality of patients with COVID‐19 or reduce their length of ICU stay (Gao et al, 2021). However, a meta‐analysis showed that VitC did not reduce mortality, hospitalization duration, or length of ICU stay (Rawat et al, 2021). Our study suggested that VitC administration is an easy strategy for daily prevention of SARS‐CoV‐2 infection and possibly for the treatment of early SARS‐CoV‐2 infection. Together, our findings could provide insight into the use of VitC for COVID‐19 at different stages.
VitC has a highly differential distribution in the body. Under physiological conditions, the concentration of VitC in the plasma of healthy individuals is 50–80 μM (Lykkesfeldt & Tveden‐Nyborg, 2019). However, VitC concentrations in various tissues are much higher than those in plasma, ranging from 0.2–10 mM under physiological conditions: 2–10 mM in the brain and adrenal glands, approximately 1 mM in the lung and liver, and 0.3–0.5 mM in the kidney (Lindblad et al, 2013; Lykkesfeldt & Tveden‐Nyborg, 2019). VitC administration could result in large increases in VitC concentrations in both plasma and tissues. VitC can be tolerated at very high doses in vivo. It has been predicted that a tolerated oral dose of 3 g every 4 h and an intravenous dose of 50 g result in peak plasma VitC concentrations of 220 μM and 13,400 μM, respectively (Padayatty et al, 2004). A dose of VitC of 2 g 3 times/day was found to result in a steady‐state plasma concentration of approximately 250 μM (Nielsen et al, 2015; Lykkesfeldt & Tveden‐Nyborg, 2019). Our study demonstrated that in cell models and a mouse model in vivo, VitC at concentrations of 1–10 mM, which are close to the physiological concentrations of VitC in tissues and at least can be easily achieved by oral administration of VitC, lowered ACE2 protein levels in a dose‐dependent manner. Thus, we believe that a daily diet containing sufficient VitC is necessary for maintaining sufficient VitC concentrations in tissues to inhibit SARS‐CoV‐2 infection, while additional oral administration of VitC can provide greater benefits to protection against SARS‐CoV‐2 infection. Importantly, our study demonstrated that VitC does not affect physiological transcriptional expression of ACE2, suggesting that ACE2 expression is not irreversibly disrupted in cells and will be restored through transcription when VitC administration is ceased or restricted.
Elderly individuals experience the most serious risk from COVID‐19. SARS‐CoV‐2 is highly infective with a considerable fatality rate in elderly individuals (Uhler & Shivashankar, 2020). In fact, ACE2 levels are often significantly increased in elderly individuals. For elderly patients with various diseases, such as refractory hypertension, coronary artery disease, and heart failure, angiotensin‐converting enzyme inhibitors (ACEIs) and angiotensin II receptor blockers (ARBs) are highly recommended for the management of cardiovascular diseases (Verdecchia et al, 2010; Messerli et al, 2018), as well as diabetes and renal insufficiency (Winkelmayer et al, 2005). However, ACEIs and ARBs can increase the number of ACE2 receptors in the cardiopulmonary circulation (Ferrario et al, 2005). In addition, during RAAS overactivation, ACE2 levels can be increased, which could promote SARS‐CoV‐2 cellular entry (Edenfield & Easley, 2022). It has been reported that patients with COVID‐19 infection and most likely treated with ACEIs or ARBs had more severe disease outcomes (Guan et al, 2020). Interestingly, ACE2 is an interferon (IFN)‐stimulated gene (ISG; Ziegler et al, 2020). Thus, elevation of IFN expression during SARS‐CoV‐2 infection increases ACE2 expression in cells. ACE2 levels have been reported to be increased 199‐fold in cells in bronchoalveolar lavage fluid (BALF) from COVID‐19 patients (Garvin et al, 2020). Thus, reducing these excessive levels of ACE2 is necessary to both lower the risk of SARS‐CoV‐2 infection and alleviate the severity of COVID‐19, particularly for elderly individuals.
Despite the importance of ACE2 in regulating the RAAS and SARS‐CoV‐2 cellular entry, the regulation of ACE2 ubiquitination and protein stability remains largely unexplored. E3 ubiquitin ligases, including MDM2 (Shen et al, 2020) and Skp2 (Wang et al, 2021), have been recently reported to induce ACE2 ubiquitination. However, how deubiquitinases control ACE2 ubiquitination and protein levels is unknown. Our study, for the first time, identified the deubiquitinase USP50 as a crucial regulator of ACE2 protein levels in cells. Recent studies have shown that USP50 is involved in fatty acid oxidation (Li et al, 2022) and erythropoiesis (Cai et al, 2018). Our findings suggested the importance of USP50 in controlling both SARS‐CoV‐2 infection and regulating the RAAS, possibly suggesting a new target for the treatment of certain viral infections and cardiovascular diseases. In addition, we reported a new mechanism of VitC‐regulated protein ubiquitination. VitC was reported to lower glutamate transporter 1 (GLT‐1) ubiquitination in astrocytes by inhibiting the expression of the ubiquitin E3 ligase HECTD1 (Zeng et al, 2022). VitC can promote cancer cell death by inducing ubiquitination of the p34SEI‐1 oncoprotein mediated by the ubiquitin E3 ligase SIAH1 (Lee et al, 2015). In contrast to regulation of a ubiquitin E3 ligase, our study revealed VitC‐mediated regulation of the action of a deubiquitinase. In summary, this study establishes a link between the essential nutrient VitC and cellular USP50‐ACE2 regulation and could provide an easy strategy for protection against infection with SARS‐CoV‐2 and even its variants during viral epidemics.
Materials and Methods
Mice
Mice with human Ace2 gene in C57BL/6 background (hACE2 mice) were generated by the Cyagen Biosciences Inc. (Guangzhou). Wild‐type (WT) C57BL/6 mice were purchased from the Shanghai SLAC Laboratory Animals. All mice were maintained under specific‐pathogen‐free (SPF) conditions in the animal facility of Soochow University. We used 6–8 weeks old female mice in all experiments. Animal care and use protocol adhered to the National Regulations for the Administration of Affairs Concerning Experimental Animals. All animal experiments have received ethical approval by the Ethics Committee of the Soochow University and were carried out in accordance with the Laboratory Animal Management Regulations with approval of the Scientific Investigation Board of Soochow University, Suzhou.
Biosafety
SARS‐CoV‐2 GFP/ΔN viruses were gifts from Dr. Qiang Ding (Tsinghua University). Due to a lack of the viral nucleocapsid gene (N) that is required for SARS‐CoV‐2 viral genome packaging and virion assembly, the SARS‐CoV‐2 GFP/ΔN virus is replication‐incompetent in normal cells and cannot produce SARS‐CoV‐2 virus particles in normal cells, and therefore can be used in a biosafety level‐2 (BSL‐2) lab (Ju et al, 2021). Thus, the SARS‐CoV‐2 GFP/ΔN system was used in the BSL‐2 lab of the Institutes of Biology and Medical Sciences of Soochow University. The SARS‐CoV‐2 GFP/ΔN viruses obtained from Tsinghua university were used to infect the cell lines for only 2 or 24 h in the BSL‐2 lab. Then, GFP fluorescence were directly observed, and viral RNA levels were analyzed by RT–qPCR. The Institutional Biosafety Committee (IBC) of Soochow University has approved the SARS‐CoV‐2 GFP/ΔN cell culture system use in the Caco‐2‐N cells in the BSL‐2 lab of the Institutes of Biology and Medical Sciences of Soochow University, Suzhou.
Cell culture and reagents
HEK293T, Caco‐2, and A549 cells were obtained from ATCC. 2fTGH cells were gifts from Dr. Serge Y. Fuchs (University of Pennsylvania). Caco‐2‐N cells that stably express a SARS‐CoV‐2 nucleocapsid (N) gene were gifts from Dr. Qiang Ding (Tsinghua University). All cells were authenticated by STR profiling and were mycoplasma negative. Cells were cultured at 37°C under 5% CO2 in DMEM (HyClone) supplemented with 10% FBS (GIBCO, Life Technologies), 100 unit/ml penicillin, and 100 μg/ml streptomycin. vitamin B1, B6, B12, C, D3 and K1 were from Sigma. VitC‐Na+ was made by Dr. Yibo Zuo (Soochow University). Flag peptides (F3290), puromycin and other chemicals were purchased from Sigma.
Plasmids and transfection
Flag‐ACE2 plasmid was purchased from the Beyotime Biotechnology (D2949). Myc‐ACE2 and its deletion mutants were generated using PCR amplified from Flag‐ACE2 or Myc‐ACE2. Flag‐HA (FH)‐tagged human DUBs, including FH‐USP50, were gifts from Dr. J. Wade Harper (Harvard Medical School, Addgene plasmids). HA‐Ub (K6, K11, K27, K29, K33, K48, and K63) were gifts from Dr. Lingqiang Zhang (State Key Laboratory of Proteomics, China). All plasmids were confirmed by sequencing. The shACE2 and shUSP50 was constructed into the shX vector that is a gift from Dr. Jianfeng Dai (Soochow University) with following sequences:
shACE2 (#1): GGACAAGTTTAACCACGAAGC;
shACE2 (#2): GCAAACGGTTGAACACAATTC;
shUSP50 (#1): CCCGGAGAAGATCATATGA;
shUSP50 (#2): GTTTGAAGAGCAGCTCAAT.
All mutations were generated by the QuickChange Lightning site‐Directed Mutagenesis Kit (TIANGEN, KM101). Transient transfections for different cell lines were carried out using the LongTrans (Ucallm, TF/07) or GenePORTER2 (Genlantis, T202015).
Liver, lung, and kidney histology
Liver, lung, and kidney tissues from mice administrated with or without VitC (300 mg/kg of body weight) were fixed in 4% formaldehyde solution, and then embedded into paraffin. Briefly, the paraffin sections were stained with anti‐human ACE2 antibodies and then observed by light microscopy for histological changes. In addition, mice were administrated with VitC (300 mg/day/kg of body weight) for 2 days and then infected with the VSV virus with a SARS‐CoV‐2‐S gene (1 × 10⁶ PFU per gram body) for 24 h. Mouse lung and kidney tissues were stained using antibodies against SARS‐CoV‐2‐Spike (Genetex, GTX632604). DAPI was used for nuclei staining. Representative images are shown at 100× magnification.
In vitro protein–protein binding assay
HEK293T cells were transfected with either Flag‐USP50 or Myc‐ACE2. Flag‐USP50 proteins were immunoprecipitated by Flag (M2) beads and then eluted with the Flag peptides. Myc‐ACE2 was pulled down by the Myc antibody from HEK293T cells transfected with Myc‐ACE2. Next, Flag‐USP50 eluates and the immunoprecipitation beads with Myc‐ACE2 proteins were mixed with or without VitC, and then vibrated for 2 h at 4°C. After washing and centrifuging, SDS–PAGE and immunoblotting were used to analyze Flag‐USP50 and Myc‐ACE2 protein levels using anti‐Flag or anti‐Myc antibodies.
In vitro deubiquitination assay
Flag‐USP50 (WT or C53S) and Myc‐ACE2 proteins were individually immunoprecipitated using Flag beads or Myc beads from HEK293T cells transfected with either Flag‐USP50 (WT or C53S) or Myc‐ACE2. The immunoprecipitates were then subjected to extensive high‐salt (500 mM NaCl) washing. Next, the Flag‐USP50 (WT or C53S) proteins were eluted by Flag peptides, and then were mixed with Myc‐ACE2 proteins bound to Myc beads. The complex was incubated at 4°C for 6 h. After centrifugation, the ubiquitination levels of Myc‐ACE2 were analyzed by immunoblotting.
CRISPR‐Cas9 genome editing
The lenti‐CRISPRv2 vector was a nice gift from Dr. Fangfang Zhou (Soochow University, China). For gene knockout, small guide RNAs were firstly cloned into the lenti‐CRISPRv2 vector, and then transfected into HEK293T cells. Forty‐eight hours after transfection, the cells were cultured under puromycin (1.5 μg/ml) selection for 3 days, and then cells were identified by immunoblotting analysis. After that, cells were transferred to 96‐well plates and cultured for further experiments. The guide RNA sequences are as following: human Usp50: 5′‐CCCCATTTTCAGGGTGTCAC‐3′; human ACE2: 5′‐TGCTGCTCAGTCCACCATTG‐3′;
Immunoblotting (IB) and immunoprecipitation (IP)
Cells were harvested using the lysis buffer containing 1% Nonidet P‐40 (NP‐40), 150 mM NaCl, Tris–HCl (20 mM, pH 7.4), 0.5 mM EDTA, PMSF (50 μg/ml) and protease inhibitor mixtures (Sigma). Proteins from whole cell lysates were firstly subjected to SDS–PAGE, and then transferred to PVDF membranes (Millipore). After blocking with 5% nonfat milk for 1 h, the membranes were incubated with the corresponding primary antibodies overnight, followed by incubation with the secondary antibodies (Bioworld or Abbkine). All immunoreactive bands were visualized with the NcmECL Ultra (MCM Biotech, P10300).
Immunoprecipitation was firstly carried out using specific antibodies at 4°C. Protein G agarose beads (Millipore, #16–266) were then added and incubated for 2 h on a rotor at 4°C. After washing five times with the lysis buffer, the immunoprecipitates were eluted by heating at 95°C with the loading buffer containing β‐mercaptoethanol for 10 min and then analyzed by SDS–PAGE gels and subsequent immunoblotting.
The antibodies with the indicated dilutions were as follows: anti‐human ACE2 (Cell Signaling Technology, #74512, 1:1,000), anti‐ACE2 (Affinity, AF5165, 1:1,000), anti‐USP50 (Affinity, AF9225, 1:1,000), anti‐USP50 (Proteintech, 20,374‐1‐AP, 1:1,000), anti‐Flag (Sigma, F7425, 1:5,000), anti‐HA (Abcam, ab9110, 1:3,000), anti‐Myc (Abmart, M20002H, 1:3,000), anti‐IRF3 (Santa Cruz, sc‐33,641, 1:1,000), anti‐STAT1 (Cell Signaling Technology, 9172, 1:1,000), anti‐Ubiquitin (Ub; Santa Cruz, 12987‐1‐AP, 1:1,000), anti‐K48 Ub (Cell Signaling Technology, 4289S, 1:1,000), anti‐VSV‐G (Santa Cruz, sc‐66180, 1:2,000) and anti‐Tubulin (Proteintech, 66031‐1‐Ig, 1:3,000).
RNA isolation and quantitative real‐time PCR
Total RNAs were isolated from different cells or mouse tissues using a TRIzol reagent (Invitrogen). The detailed procedures for RNA isolation and quantitative real‐time PCR (RT–qPCR) were as described previously (Zuo et al, 2020, 2022). Briefly, the cDNA was synthesized using 5× All‐In‐One RT MasterMix (abm, #G490, Beijing). RT–qPCR was performed using a StepOne Plus real‐time PCR system (Applied Bioscience). The results from three independent experiments were shown as the average mean ± standard deviation (s.d.). The primer sequences are as following:
Human Ace2:
Forward: 5′‐ACCACGAAGCCGAAGACCTGTT‐3′
Reverse: 5′‐TGGGCAAGTGTGGACTGTTCCT‐3′;
SARS‐CoV‐2 GFP/ΔN:
Forward: 5′‐GCTTTGCTGGAAATGCCGTT‐3′
Reverse: 5′‐GGACTTGTTGTGCCATCACC‐3′;
SARS‐CoV‐2‐S:
Forward: 5′‐ATGTCCTTCCCTCAGTCAGCAC‐3′
Reverse: 5′‐TGACAAATGGCAGGAGCAGTTG‐3′;
VSV:
Forward: 5′‐ACGGCGTACTTCCAGATGG‐3′
Reverse: 5′‐CTCGGTTCAAGATCCAGGT‐3′;
β‐actin:
Forward: 5′‐ACCAACTGGGACGACATGGAGAAA‐3′
Reverse: 5′‐ATAGCACAGCCTGGATAGCAACG‐3′.
Virus and viral infection in vitro
The VSV viruses with a SARS‐CoV‐2‐Spike gene (VSV‐Spike) were nice gifts from Dr. Aihua Zheng (Chinese Academy of Sciences) and Dr. Jianfeng Dai (Soochow University, China). The VSV‐Spike virus was made using a rVSV‐eGFP backbone, in which the VSV glycoprotein coding sequence (3845–5380) was replaced by the SARS‐CoV‐2‐Spike gene (Li et al, 2020a). For production of the VSV‐Spike viruses, Vero cells were infected by the VSV‐Spike virus. After 48 h, the culture supernatant containing the viruses was harvested and was centrifuged (89,000 g) for 2 h at 4°C. Then the viruses were collected and diluted with 1× PBS. The aliquoted viruses were store at −80°C for further use. The NL63‐S construct was a nice gift from Dr. Jincun Zhao (Guangzhou Medical University in China). Similarly, the VSV virus with a NL63‐S gene was generated using the rVSV‐eGFP backbone, and the viruses were produced in Vero cells as above. Vesicular stomatitis virus (VSV) was a gift from Dr. Chen Wang (China Pharmaceutical University). VSV‐GFP viruses were gifts from Dr. Chunsheng Dong (Soochow University, China). Cells were treated with VitC (5 mM) overnight. After washing twice, cells were infected by either SARS‐CoV‐2, or VSV, or VSV‐GFP at a multiplicity of infection (MOI) of 0.1 for 24 h. Then cells were analyzed by immunofluorescence, RT–qPCR or Western blot.
Viral infection in vivo
For in vivo viral infection studies, 8‐week‐old hACE2 mice were intraperitoneally administrated with vitamin C (300 mg/kg body weight, once a day) for 2 days. Then mice were given intraperitoneal injections (i.p.) of the VSV‐Spike virus (1 × 10⁶ PFU per gram body mouse). Twenty‐four hours after infection, mouse lung, liver, kidney, and spleen tissues were harvested. RT–qPCR was performed for the analysis of SARS‐CoV‐2‐S viral RNA levels.
Cell counting kit 8 assay
HEK293T cells were seeded in 96‐well plate at a density of 3 × 10³ cells per well. Then, the cells were treated with or without VitC at different concentrations for 24 h. To measure cell viability, cells in each well were firstly washed with PBS. Then, the fresh complete (10% FBS) medium containing 10 μl of cell counting kit 8 reagent was added. The plate was further incubated for 2 h at 37°C. The number of living cells was evaluated at the absorbance of 450 nm.
Immunofluorescence microscopy
HeLa cells were firstly washed by 1× PBS and fixed in 4% paraformaldehyde on ice. Then cells were permeabilized with Triton X‐100 (0.5%) and blocked with BSA (5%). Next, cells were incubated with two different anti‐ACE2 antibodies overnight in 0.5% BSA. After washing three times with 1× PBS, cells were stained with either 488 goat anti‐mouse IgG (Alexa Fluor, A11001) or 594 goat anti‐rabbit IgG (Alexa Fluor, A11012). Nucleus was stained with DAPI. The fluorescent images were captured with the Nikon A1 confocal microscope.
Statistical analysis
Two‐tailed unpaired Student's t‐test was employed to compare the significance between different groups. All differences were considered statistically significant when P < 0.05. P‐values are indicated by asterisks in the figures as follows: *P < 0.05, **P < 0.01 and ***P < 0.001.
Author contributions
Hui Zheng: Conceptualization; resources; data curation; supervision; funding acquisition; investigation; project administration; writing – review and editing. Yibo Zuo: Data curation; formal analysis; validation; investigation; visualization; methodology; writing – original draft; writing – review and editing. Zhijin Zheng: Data curation; formal analysis; investigation; visualization; methodology. Yingkang Huang: Visualization; methodology. Jiuyi He: Validation; investigation. Lichao Zang: Investigation; methodology. Tengfei Ren: Investigation; methodology. Xinhua Cao: Investigation; methodology. Ying Miao: Resources; validation; investigation. Yukang Yuan: Validation; investigation. Yanli Liu: Validation; methodology. Feng Ma: Validation; methodology. Jianfeng Dai: Validation; methodology. Sheng Tian: Software; methodology. Qiang Ding: Resources; methodology.
Disclosure and competing interests statement
The authors declare that they have no conflict of interest.
Supporting information
Expanded View Figures PDF
Source Data for Expanded View
PDF+
Source Data for Figure 1
Source Data for Figure 2
Source Data for Figure 3
Source Data for Figure 4
Source Data for Figure 5
Source Data for Figure 6
Source Data for Figure 7
Acknowledgements
We thank Dr. Serge Y. Fuchs (University of Pennsylvania), Dr. J. Wade Harper (Harvard Medical School), Dr. Jincun Zhao (Guangzhou Medical University, China), Dr. Lingqiang Zhang (National Center of Protein Sciences, China), Dr. Chen Wang (China Pharmaceutical University), Dr. Chunsheng Dong (Soochow University, China) and Dr. Aihua Zheng (Chinese Academy of Sciences) for important reagents. This work is supported by the National Natural Science Foundation of China (32100568, 31970846), the National Key R&D Program of China (2018YFC1705500, 2018YFC1705505), the Postdoctoral Science Foundation of China (2021M692351), the Project of Science and Technology of Suzhou (SKY2022108), the Project of Natural Science Research in Colleges and Universities of Jiangsu Province (20KJB310008), the Foundation for Young Scholars of Jiangsu Province (BK20200864), and the Priority Academic Program Development of Jiangsu Higher Education Institutions (PAPD). This study is dedicated to the memory of Mr. Hougui Zheng.
EMBO reports (2023) 24: e56374
See also: D Cantoni & J Grove (April 2023)
Data availability
No large primary datasets have been generated and deposited in external repositories.
References
- Cai J, Wei J, Schrott V, Zhao J, Bullock G, Zhao Y (2018) Induction of deubiquitinating enzyme USP50 during erythropoiesis and its potential role in the regulation of Ku70 stability. J Investig Med 66: 1–6 [DOI] [PMC free article] [PubMed] [Google Scholar]
- Chavda VP, Prajapati R, Lathigara D, Nagar B, Kukadiya J, Redwan EM, Uversky VN, Kher MN, Patel R (2022) Therapeutic monoclonal antibodies for COVID‐19 management: an update. Expert Opin Biol Ther 22: 763–780 [DOI] [PubMed] [Google Scholar]
- Chen Q, Espey MG, Krishna MC, Mitchell JB, Corpe CP, Buettner GR, Shacter E, Levine M (2005) Pharmacologic ascorbic acid concentrations selectively kill cancer cells: action as a pro‐drug to deliver hydrogen peroxide to tissues. Proc Natl Acad Sci USA 102: 13604–13609 [DOI] [PMC free article] [PubMed] [Google Scholar]
- Crackower MA, Sarao R, Oudit GY, Yagil C, Kozieradzki I, Scanga SE, Oliveira‐dos‐Santos AJ, da Costa J, Zhang L, Pei Y et al (2002) Angiotensin‐converting enzyme 2 is an essential regulator of heart function. Nature 417: 822–828 [DOI] [PubMed] [Google Scholar]
- Donoghue M, Hsieh F, Baronas E, Godbout K, Gosselin M, Stagliano N, Donovan M, Woolf B, Robison K, Jeyaseelan R et al (2000) A novel angiotensin‐converting enzyme‐related carboxypeptidase (ACE2) converts angiotensin I to angiotensin 1‐9. Circ Res 87: E1‐9 [DOI] [PubMed] [Google Scholar]
- Edenfield RC, Easley C 4th (2022) Implications of testicular ACE2 and the renin‐angiotensin system for SARS‐CoV‐2 on testis function. Nat Rev Urol 19: 116–127 [DOI] [PMC free article] [PubMed] [Google Scholar]
- Ferrario CM, Jessup J, Chappell MC, Averill DB, Brosnihan KB, Tallant EA, Diz DI, Gallagher PE (2005) Effect of angiotensin‐converting enzyme inhibition and angiotensin II receptor blockers on cardiac angiotensin‐converting enzyme 2. Circulation 111: 2605–2610 [DOI] [PubMed] [Google Scholar]
- Gao D, Xu M, Wang G, Lv J, Ma X, Guo Y, Zhang D, Yang H, Jiang W, Deng F et al (2021) The efficiency and safety of high‐dose vitamin C in patients with COVID‐19: a retrospective cohort study. Aging 13: 7020–7034 [DOI] [PMC free article] [PubMed] [Google Scholar]
- Garvin MR, Alvarez C, Miller JI, Prates ET, Walker AM, Amos BK, Mast AE, Justice A, Aronow B, Jacobson D (2020) A mechanistic model and therapeutic interventions for COVID‐19 involving a RAS‐mediated bradykinin storm. eLife 9: e59177 [DOI] [PMC free article] [PubMed] [Google Scholar]
- Guan WJ, Ni ZY, Hu Y, Liang WH, Ou CQ, He JX, Liu L, Shan H, Lei CL, Hui DSC et al (2020) Clinical characteristics of coronavirus disease 2019 in China. N Engl J Med 382: 1708–1720 [DOI] [PMC free article] [PubMed] [Google Scholar]
- Gupta A, Madhavan MV, Sehgal K, Nair N, Mahajan S, Sehrawat TS, Bikdeli B, Ahluwalia N, Ausiello JC, Wan EY et al (2020) Extrapulmonary manifestations of COVID‐19. Nat Med 26: 1017–1032 [DOI] [PMC free article] [PubMed] [Google Scholar]
- Hoffmann M, Kleine‐Weber H, Schroeder S, Kruger N, Herrler T, Erichsen S, Schiergens TS, Herrler G, Wu NH, Nitsche A et al (2020) SARS‐CoV‐2 cell entry depends on ACE2 and TMPRSS2 and is blocked by a clinically proven protease inhibitor. Cell 181: 271–280.e8 [DOI] [PMC free article] [PubMed] [Google Scholar]
- Hornbeck PV, Zhang B, Murray B, Kornhauser JM, Latham V, Skrzypek E (2015a) PhosphoSitePlus, 2014: mutations, PTMs and recalibrations. Nucleic Acids Res 43: D512–D520 [DOI] [PMC free article] [PubMed] [Google Scholar]
- Hornbeck PV, Zhang B, Murray B, Kornhauser JM, Latham V, Skrzypek E (2015b) PhosphoSitePlus ACE2 human (https://www.phosphosite.org/proteinAction.action?id=14935&showAllSites=true). [DATASET] [DOI] [PMC free article] [PubMed]
- Ju X, Zhu Y, Wang Y, Li J, Zhang J, Gong M, Ren W, Li S, Zhong J, Zhang L et al (2021) A novel cell culture system modeling the SARS‐CoV‐2 life cycle. PLoS Pathog 17: e1009439 [DOI] [PMC free article] [PubMed] [Google Scholar]
- Krege JH, John SW, Langenbach LL, Hodgin JB, Hagaman JR, Bachman ES, Jennette JC, O'Brien DA, Smithies O (1995) Male‐female differences in fertility and blood pressure in ACE‐deficient mice. Nature 375: 146–148 [DOI] [PubMed] [Google Scholar]
- Kuba K, Imai Y, Penninger JM (2006) Angiotensin‐converting enzyme 2 in lung diseases. Curr Opin Pharmacol 6: 271–276 [DOI] [PMC free article] [PubMed] [Google Scholar]
- Lee S, Kim J, Jung S, Li C, Yang Y, Kim KI, Lim JS, Kim Y, Cheon CI, Lee MS (2015) SIAH1‐induced p34SEI‐1 polyubiquitination/degradation mediates p53 preferential vitamin C cytotoxicity. Int J Oncol 46: 1377–1384 [DOI] [PubMed] [Google Scholar]
- Levine M, Conry‐Cantilena C, Wang Y, Welch RW, Washko PW, Dhariwal KR, Park JB, Lazarev A, Graumlich JF, King J et al (1996) Vitamin C pharmacokinetics in healthy volunteers: evidence for a recommended dietary allowance. Proc Natl Acad Sci USA 93: 3704–3709 [DOI] [PMC free article] [PubMed] [Google Scholar]
- Li H, Zhao C, Zhang Y, Yuan F, Zhang Q, Shi X, Zhang L, Qin C, Zheng A (2020a) Establishment of replication‐competent vesicular stomatitis virus‐based recombinant viruses suitable for SARS‐CoV‐2 entry and neutralization assays. Emerg Microbes Infect 9: 2269–2277 [DOI] [PMC free article] [PubMed] [Google Scholar]
- Li MY, Li L, Zhang Y, Wang XS (2020b) Expression of the SARS‐CoV‐2 cell receptor gene ACE2 in a wide variety of human tissues. Infect Dis Poverty 9: 45 [DOI] [PMC free article] [PubMed] [Google Scholar]
- Li R, Li X, Zhao J, Meng F, Yao C, Bao E, Sun N, Chen X, Cheng W, Hua H et al (2022) Mitochondrial STAT3 exacerbates LPS‐induced sepsis by driving CPT1a‐mediated fatty acid oxidation. Theranostics 12: 976–998 [DOI] [PMC free article] [PubMed] [Google Scholar]
- Lindblad M, Tveden‐Nyborg P, Lykkesfeldt J (2013) Regulation of vitamin C homeostasis during deficiency. Nutrients 5: 2860–2879 [DOI] [PMC free article] [PubMed] [Google Scholar]
- Lykkesfeldt J, Tveden‐Nyborg P (2019) The pharmacokinetics of vitamin C. Nutrients 11: 2412 [DOI] [PMC free article] [PubMed] [Google Scholar]
- Messerli FH, Bangalore S, Bavishi C, Rimoldi SF (2018) Angiotensin‐converting enzyme inhibitors in hypertension: to use or not to use? J Am Coll Cardiol 71: 1474–1482 [DOI] [PubMed] [Google Scholar]
- Mohamed T, Abdul‐Hafez A, Uhal BD (2021) Regulation of ACE‐2 enzyme by hyperoxia in lung epithelial cells by post‐translational modification. J Lung Pulm Respir Res 8: 47–52 [PMC free article] [PubMed] [Google Scholar]
- Nielsen TK, Hojgaard M, Andersen JT, Poulsen HE, Lykkesfeldt J, Mikines KJ (2015) Elimination of ascorbic acid after high‐dose infusion in prostate cancer patients: a pharmacokinetic evaluation. Basic Clin Pharmacol Toxicol 116: 343–348 [DOI] [PubMed] [Google Scholar]
- Padayatty SJ, Sun H, Wang Y, Riordan HD, Hewitt SM, Katz A, Wesley RA, Levine M (2004) Vitamin C pharmacokinetics: implications for oral and intravenous use. Ann Intern Med 140: 533–537 [DOI] [PubMed] [Google Scholar]
- Rawat D, Roy A, Maitra S, Gulati A, Khanna P, Baidya DK (2021) Vitamin C and COVID‐19 treatment: a systematic review and meta‐analysis of randomized controlled trials. Diabetes Metab Syndr 15: 102324 [DOI] [PMC free article] [PubMed] [Google Scholar]
- Ritorto MS, Ewan R, Perez‐Oliva AB, Knebel A, Buhrlage SJ, Wightman M, Kelly SM, Wood NT, Virdee S, Gray NS et al (2014) Screening of DUB activity and specificity by MALDI‐TOF mass spectrometry. Nat Commun 5: 4763 [DOI] [PMC free article] [PubMed] [Google Scholar]
- Rodrigues Prestes TR, Rocha NP, Miranda AS, Teixeira AL, Simoes ESAC (2017) The anti‐inflammatory potential of ACE2/Angiotensin‐(1‐7)/Mas receptor axis: evidence from basic and clinical research. Curr Drug Targets 18: 1301–1313 [DOI] [PubMed] [Google Scholar]
- Rothlin RP, Vetulli HM, Duarte M, Pelorosso FG (2020) Telmisartan as tentative angiotensin receptor blocker therapeutic for COVID‐19. Drug Dev Res 81: 768–770 [DOI] [PMC free article] [PubMed] [Google Scholar]
- Shen H, Zhang J, Wang C, Jain PP, Xiong M, Shi X, Lei Y, Chen S, Yin Q, Thistlethwaite PA et al (2020) MDM2‐mediated ubiquitination of angiotensin‐converting enzyme 2 contributes to the development of pulmonary arterial hypertension. Circulation 142: 1190–1204 [DOI] [PMC free article] [PubMed] [Google Scholar]
- Stephenson CM, Levin RD, Spector T, Lis CG (2013) Phase I clinical trial to evaluate the safety, tolerability, and pharmacokinetics of high‐dose intravenous ascorbic acid in patients with advanced cancer. Cancer Chemother Pharmacol 72: 139–146 [DOI] [PMC free article] [PubMed] [Google Scholar]
- Uhler C, Shivashankar GV (2020) Mechano‐genomic regulation of coronaviruses and its interplay with ageing. Nat Rev Mol Cell Biol 21: 247–248 [DOI] [PMC free article] [PubMed] [Google Scholar]
- Verdecchia P, Angeli F, Mazzotta G, Ambrosio G, Reboldi G (2010) Angiotensin converting enzyme inhibitors and angiotensin receptor blockers in the treatment of hypertension: should they be used together? Curr Vasc Pharmacol 8: 742–746 [DOI] [PubMed] [Google Scholar]
- Vilcheze C, Kim J, Jacobs WR Jr (2018) Vitamin C potentiates the killing of mycobacterium tuberculosis by the first‐line tuberculosis drugs isoniazid and rifampin in mice. Antimicrob Agents Chemother 62: e02165‐17 [DOI] [PMC free article] [PubMed] [Google Scholar]
- Wang G, Zhao Q, Zhang H, Liang F, Zhang C, Wang J, Chen Z, Wu R, Yu H, Sun B et al (2021) Degradation of SARS‐CoV‐2 receptor ACE2 by the E3 ubiquitin ligase Skp2 in lung epithelial cells. Front Med 15: 252–263 [DOI] [PMC free article] [PubMed] [Google Scholar]
- Wang L, Wu Y, Yao S, Ge H, Zhu Y, Chen K, Chen WZ, Zhang Y, Zhu W, Wang HY et al (2022) Discovery of potential small molecular SARS‐CoV‐2 entry blockers targeting the spike protein. Acta Pharmacol Sin 43: 788–796 [DOI] [PMC free article] [PubMed] [Google Scholar]
- Winkelmayer WC, Fischer MA, Schneeweiss S, Wang PS, Levin R, Avorn J (2005) Underuse of ACE inhibitors and angiotensin II receptor blockers in elderly patients with diabetes. Am J Kidney Dis 46: 1080–1087 [DOI] [PubMed] [Google Scholar]
- Wrapp D, Wang N, Corbett KS, Goldsmith JA, Hsieh CL, Abiona O, Graham BS, McLellan JS (2020) Cryo‐EM structure of the 2019‐nCoV spike in the prefusion conformation. Science 367: 1260–1263 [DOI] [PMC free article] [PubMed] [Google Scholar]
- Xu Y, Wu C, Cao X, Gu C, Liu H, Jiang M, Wang X, Yuan Q, Wu K, Liu J et al (2022) Structural and biochemical mechanism for increased infectivity and immune evasion of omicron BA.2 variant compared to BA.1 and their possible mouse origins. Cell Res 32: 609–620 [DOI] [PMC free article] [PubMed] [Google Scholar]
- Zeng X, Dong X, Xiao Q, Yao J (2022) Vitamin C inhibits ubiquitination of glutamate transporter 1 (GLT‐1) in astrocytes by downregulating HECTD1. ACS Chem Nerosci 13: 676–687 [DOI] [PubMed] [Google Scholar]
- Ziegler CGK, Allon SJ, Nyquist SK, Mbano IM, Miao VN, Tzouanas CN, Cao Y, Yousif AS, Bals J, Hauser BM et al (2020) SARS‐CoV‐2 receptor ACE2 is an interferon‐stimulated Gene in human airway epithelial cells and is detected in specific cell subsets across tissues. Cell 181: 1016–1035.e19 [DOI] [PMC free article] [PubMed] [Google Scholar]
- Zuo Y, Feng Q, Jin L, Huang F, Miao Y, Liu J, Xu Y, Chen X, Zhang H, Guo T et al (2020) Regulation of the linear ubiquitination of STAT1 controls antiviral interferon signaling. Nat Commun 11: 1146 [DOI] [PMC free article] [PubMed] [Google Scholar]
- Zuo Y, He J, Liu S, Xu Y, Liu J, Qiao C, Zang L, Sun W, Yuan Y, Zhang H et al (2022) LATS1 is a central signal transmitter for achieving full type‐I interferon activity. Sci Adv 8: eabj3887 [DOI] [PMC free article] [PubMed] [Google Scholar]