Abstract
Immunotherapy is an attractive treatment strategy for cancer, while its efficiency and safety need to be improved. A dual‐cascade activatable nanopotentiator for sonodynamic therapy (SDT) and chemodynamic therapy (CDT)‐cooperated immunotherapy of deep tumors via reshaping adenosine metabolism is herein reported. This nanopotentiator (NPMCA) is constructed through crosslinking adenosine deaminase (ADA) with chlorin e6 (Ce6)‐conjugated manganese dioxide (MnO2) nanoparticles via a reactive oxygen species (ROS)‐cleavable linker. In the tumor microenvironment with ultrasound (US) irradiation, NPMCA mediates CDT and SDT concurrently in deep tumors covered with 2‐cm tissues to produce abundant ROS, which results in dual‐cascade scissoring of ROS‐cleavable linkers to activate ADA within NCMCA to block adenosine metabolism. Moreover, immunogenic cell death (ICD) of dying tumor cells and upregulation of the stimulator of interferon genes (STING) is triggered by the generated ROS and Mn2+ from NPMCA, respectively, leading to activation of antitumor immune response. The potency of immune response is further reinforced by reducing the accumulation of adenosine in tumor microenvironment by the activated ADA. As a result, NPMCA enables CDT and SDT‐cooperated immunotherapy, showing an obviously improved therapeutic efficacy to inhibit the growths of bilateral tumors, in which the primary tumors are covered with 2‐cm tissues.
Keywords: adenosine metabolism, cancer therapy, deep tumors, immunotherapy, nanopotentiators
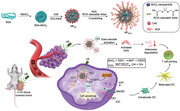
An ultrasound and tumor microenvironment dual‐cascade activatable nanopotentiator is constructed for sono‐chemodynamic‐immunotherapy of deep tumors. The nanopotentiator produces abundant reactive oxygen species for inducing immunogenic cell death and activating adenosine deaminase to reshape the adenosine metabolism. Thus, the antitumor immune response is obviously amplified by sono‐chemodynamic‐cooperated immunotherapy to effectively treat deep 4T1 tumors covered with 2‐cm tissues.
1. Introduction
Immunotherapy has been widely used for cancer treatment because of its advantages including strong specificity, wide applicability, and the capacity to remove residual cancer cells and prevent tumor recurrence.[ 1 ] However, its therapeutic efficacy is often low as the tumors create immunosuppressive microenvironment.[ 2 ] Particularly, adenosine is one of the important negative feedbacks in immunosuppressive tumor microenvironment that can weaken the immune responses.[ 3 ] Adenosine is converted from adenosine triphosphate (ATP) by ectonucleotidases.[ 4 ] In view of high levels of ATP during immunogenic cell death (ICD) of dying cancer cells after various treatments, adenosine will accumulate in tumor microenvironment.[ 5 ] The produced adenosine can regulate the functions and proliferation of T cells, leading to the formation of regulatory T (Treg) cells. Therefore, inhibition of adenosine signals is highly desired to reverse the immunosuppressive tumor microenvironment for effective immunotherapy.
Different strategies have been adopted to modulate the immunosuppressive effect of adenosine, such as inhibiting ectonucleotidases activity to reduce the conversion of ATP into adenosine, blocking the binding of adenosine with T cell receptor, and degrading intracellular adenosine using adenosine deaminase (ADA).[ 6 ] However, these strategies have the limitations of poor selectivity and low safety because the antagonists and enzymes show unsatisfactory accumulation in targeting tumor sites. To address the concern of uncontrolled release of immunotherapeutic agents, activatable immunotherapeutic nanoparticles that can specifically unleash cargo upon response to different stimuli have been widely developed.[ 7 ] For example, a second near‐infrared (NIR‐II) photoactivatable organic polymer nanoparticle with conjugation of an A2AR antagonist has been reported to improve the efficacy and safety of photothermal‐immunotherapy.[ 8 ] Nevertheless, the applications of photoactivatable nanosystems are more suitable for superficial tumors as the tissue penetration depths are limited.[ 9 ]
In contrast to light, ultrasound (US) can overcome the penetration obstacle as it can penetrate deeply into biological tissues, and thus has been used for sonodynamic therapy (SDT) of deep‐seated tumors.[ 10 ] Moreover, US shows the advantages of good selectivity and efficient controllability, US‐responsive nanosystems have been developed for the precise delivery of immunotherapeutic agents to targeting regions for immunotherapy.[ 11 ] Alternatively, tumor microenvironment‐responsive nanoplatforms that enable controlled releases of cargos upon responses to endogenous hallmarks in the tumors also do not have penetration limitations.[ 12 ] However, the therapeutic efficacies are still low for these US‐ and tumor microenvironment‐responsive nanosystems due to the insufficient activation of therapeutics.[ 13 ] To improve the activation efficacy, dual‐responsive nanosystems that integrate the sensitivity to both exogenous and endogenous stimuli have been reported.[ 14 ] Light and tumor microenvironment dual‐responsive nanomedicines have been widely developed for cancer therapy,[ 15 ] while the uses of US and tumor microenvironment dual‐responsive nanoparticles to achieve effective immunotherapy have not been explored.
We herein report a US and tumor microenvironment dual‐cascade activatable nanopotentiator for reshaping adenosine metabolism and combinational immunotherapy of cancer. Such a nanopotentiator (NPMCA) contains chlorin e6 (Ce6)‐conjugated manganese dioxide (MnO2) nanoparticles and ADA, which are crosslinked by a reactive oxygen species (ROS)‐cleavable linker (Figure 1a). Ce6 was chemically conjugated onto MnO2 nanoparticles to avoid the unwanted release in blood circulation. Ce6 acts as a sonosensitizer to produce singlet oxygen (1O2) and mediate SDT under US irradiation. MnO2 nanoparticles react with endogenous glutathione (GSH) in tumor microenvironment to produce Mn2+, and Mn2+ can mediate the conversion of hydrogen peroxide (H2O2) into hydroxyl radical (·OH) for chemodynamic therapy (CDT). The abundant ROS produced by the combinational action of SDT and CDT not only induces ICD of dying cancer cells, but also scissors ROS‐cleavable linkers for dual‐cascade activation of ADA (Figure 1b). Moreover, the released Mn2+ from NPMCA can further upregulate the activity of the stimulator of interferon genes (STING).[ 16 ] In view of the ICD effect, STING activation, and adenosine consumption by the activated ADA, the antitumor immune response is obviously amplified. Therefore, NPMCA‐mediated CDT and SDT‐cooperated immunotherapy can obviously suppress the growths of deep 4T1 tumors covered with 2‐cm tissues.
Figure 1.
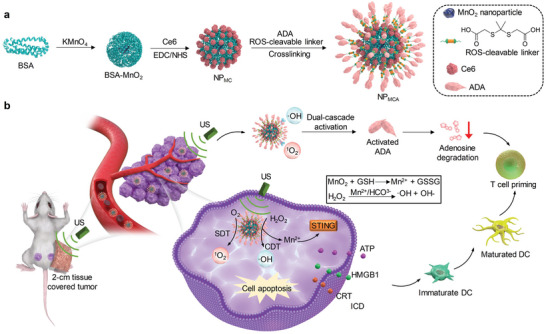
US and tumor microenvironment dual‐cascade activatable nanopotentiator (NPMCA) for CDT and SDT‐cooperated immunotherapy. a) Schematic illustration of the fabrication of NPMCA. b) Schematic illustration of the activation mechanism, ICD induction, and immune response activation mediated by NPMCA for CDT and SDT‐cooperated immunotherapy.
2. Results and Discussion
2.1. Screening of Sonosensitizers
To synthesize nanopotentiators with good SDT effect, sonodynamic 1O2 generation property of different small‐molecule sonosensitizers was investigated using electron spin resonance (ESR). The common small‐molecule sonosensitizers include acridine orange (AO), curcumin (CUR), methylene blue (MB), Ce6, indocyanine green (ICG), silicon 2,3‐naphthalocyanine bis(trihexylsilyloxide) (NIR775) and protoporphyrin IX (PpIX) (Figure 2a). ESR results showed that all the sonosensitizers could produce 1O2 under US treatment, and the ESR intensity for Ce6 was much higher than those for other sonosensitizers (Figure 2b), suggesting the highest sonodynamic 1O2 generation efficacy of Ce6. The 1O2 generation efficacy of Ce6 was 1.6‐fold higher than that of MB, and at least 6.6‐fold higher relative to those of the other sonosensitizers (Figure 2c). UV–vis spectrum showed that Ce6 had obvious optical absorbance in the range of 300–700 nm (Figure 2d), which should contribute to its excellent 1O2 generation under US treatment. Therefore, Ce6 was selected as the optimized sonosensitizer to synthesize nanopotentiators.
Figure 2.
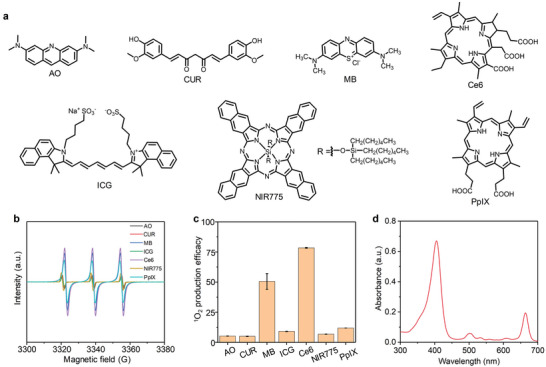
Screening of sonosensitizers. a) Chemical structures of different sonosensitizers including AO, CUR, MB, Ce6, ICG, NIR775, and PpIX. b) ESR measurements of 1O2 generation for different sonosensitizers at the same concentration under US treatment. c) The 1O2 production efficacy of the small‐molecule sonosensitizers under US treatment (n = 3). d) UV–vis spectrum of Ce6. The data are presented as the means ± SDs.
2.2. Fabrication and Characterization of Nanoparticles
NPMC was synthesized by conjugating sonosensitizer Ce6 onto bovine serum albumin (BSA)‐MnO2 nanoparticles. The characteristic peak of Ce6 at 664 nm could be detected in the absorbance spectrum of NPMC (Figure 3a), which however was not observed in that of BSA‐MnO2 nanoparticles (Figure S1a, Supporting Information), confirming the successful synthesis of NPMC. The hydrodynamic size and zeta potential of BSA‐MnO2 nanoparticles were measured to be 10.0 nm and −13.8 mV, respectively (Figure S1b,c, Supporting Information). Via crosslinking of NPMC with ADA using ROS‐cleavable linkers, NPMCA were fabricated. The loading ratio of ADA within NPMCA was calculated to be 13.4%. As shown in the absorbance spectrum of NPMC, the characteristic peak of Ce6 at 664 nm was similarly observed. Due to the presence of Ce6, NPMC and NPMCA similarly displayed distinct fluorescence signals ranging from 650–750 nm (Figure 3b), while BSA‐MnO2 nanoparticles did not have any fluorescence properties (Figure S1d, Supporting Information). These results verified that the crosslinking of ADA did not affect the absorbance and fluorescence properties of nanoparticles. Transmission electron microscope (TEM) images showed that both NPMC and NPMCA had a spherical morphology, and they were well dispersed without obvious aggregation (Figure 3c), but the dimension of NPMCA was larger than that of NPMC. The hydrodynamic size was measured to be 15.7 nm for NPMC and 18.2 nm for NPMCA (Figure 3d). Both NPMC and NPMCA showed good stability when they were dispersed in water, phosphate‐buffered saline (PBS), and cell culture medium (Figure S2, Supporting Information). The zeta potential of NPMCA (−13.6 mV) was similar to that of NPMC (−14.9 mV) due to their coincident surface components (Figure 3e). Hemolysis assay showed that the hemolysis ratios of blood red cells were less than 5.0% after incubation with NPMC and NPMCA at the Ce6 concentration of 3.2–50 µg mL−1 (Figure S3, Supporting Information), indicating the negligible hemolysis effect of both nanoparticles.
Figure 3.
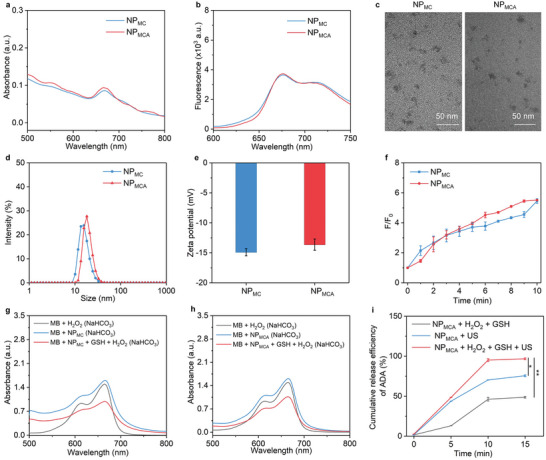
Fabrication and characterization of nanoparticles. a) UV–vis absorbance spectra of NPMC and NPMCA. b) Fluorescence spectra of NPMC and NPMCA. c) TEM images of NPMC and NPMCA. d) Profiles of hydrodynamic size of NPMC and NPMCA. e) Measurement of zeta potential of NPMC and NPMCA (n = 3). f) Fluorescence enhancement (F/F0) for SOSG solutions containing NPMC and NPMCA under US treatment for different times (n = 3). g) Absorbance spectra of MB solutions containing NPMC and/or H2O2. h) Absorbance spectra of methylene blue (MB)MB solutions containing NPMCA and/or H2O2. i) Cumulative release curves of ADA for NPMCA solutions without or with the addition of H2O2 under US treatment (n = 3). The data are presented as the means ± SDs. The p values are calculated using two‐tailed unpaired t test, *p < 0.05, **p < 0.01.
The sonodynamic and chemodynamic properties of nanoparticles were then evaluated. Sonodynamic 1O2 generation was confirmed by measuring the fluorescence intensity of 1O2 probe (SOSG). The fluorescence intensity of SOSG was gradually increased under US treatment for both NPMC and NPMCA solutions (Figure S4, Supporting Information). The fluorescence enhancement (F/F0) similarly reached 5.8 for NPMC and NPMCA after US treatment for 10 min (Figure 3f). These results confirmed the effective generation of 1O2 for NPMC and NPMCA, and their sonodynamic 1O2 generating efficacies were almost consistent. By using MB as ·OH indicator, the absorbance of MB solution containing NPMC and H2O2 (100 µm) was reduced compared to that of MB + H2O2 and MB + NPMC group (Figure 3g). Weaker absorbance could also be observed for MB when it was mixed with NPMCA and H2O2 (100 µm) than that in MB + NPMCA group (Figure 3h). These results verified the production of ·OH by NPMC and NPMCA in the presence of H2O2.
The dual‐cascade activation of NPMCA was then evaluated by measuring the release amount of fluorescein isothiocyanate (FITC)‐conjugated ADA from nanoparticles. For NPMCA without the addition of H2O2 and US treatment, the release of ADA was negligible (Figure 3i). The release of ADA could be observed after incubation of NPMCA with H2O2, and higher release efficacy of ADA was observed after US treatment of NPMCA. In contrast, ADA release efficacy after US treatment and H2O2 incubation was higher than that in NPMCA + H2O2 and NPMCA + US groups. These results verified that US and H2O2 could synergistically promote the ADA release from NPMCA. This should be attributed to the cleavage of ROS‐cleavable linkers by the generated 1O2 and ·OH for dual‐cascade activation of NPMCA.
2.3. In Vitro Therapeutic Efficacy and ICD Evaluation
In view of the fluorescence property of Ce6, the cellular uptake of NPMC and NPMCA by cancer cells was first evaluated using flow cytometry. After incubation of cancer cells with NPMC or NPMCA, the fluorescence intensity of cancer cells remarkably increased compared to that of PBS control cells (Figure S5, Supporting Information), verifying the cellular endocytosis effect. The cytotoxicity of NPMC and NPMCA was investigated to confirm their biocompatibility for biomedical applications. The cell viability was nearly 100% after incubation with NPMC and NPMCA at the studied Ce6 concentration range for 24 h (Figure 4a), suggesting the negligible cytotoxicity of NPMC and NPMCA. Without US treatment, the cell viability did not have an obvious decrease after incubation with NPMC and NPMCA (Figure 4b). In contrast, the cell viability was significantly reduced for NPMC‐ and NPMCA‐treated cells with US treatment, verifying the cell‐killing effect via the combinational action of SDT and CDT.
Figure 4.
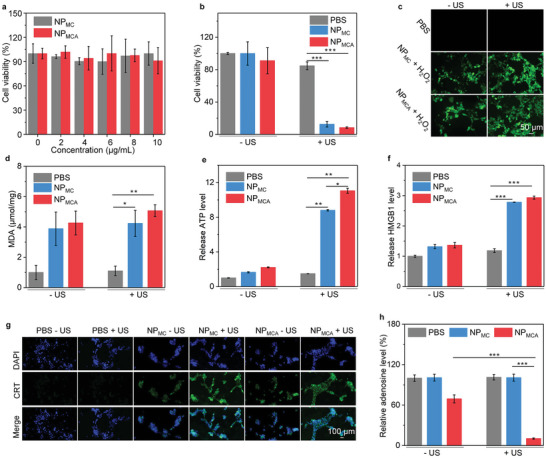
In vitro therapeutic efficacy and ICD analysis. a) Cell viability analysis of NPMC‐ and NPMCA‐treated cells at different Ce6 concentrations for 24 h (n = 5). b) Cell viability analysis of 4T1 cells in PBS‐, NPMC‐ and NPMCA‐treated groups without or with US treatment (n = 5). c) Fluorescence images of 4T1 cells in PBS‐, NPMC‐ and NPMCA‐treated groups without or with US treatment in the presence of ROS probes. d) MDA levels for 4T1 cells in PBS‐, NPMC‐ and NPMCA‐treated groups without or with US treatment (n = 5). e) Released ATP levels for 4T1 cells in various treatment groups (n = 5). f) Extracellular HMGB1 levels for 4T1 cells in PBS‐, NPMC‐ and NPMCA‐treated groups without or with US treatment (n = 5). g) Immunofluorescence CRT staining images of 4T1 cells after different treatments. h) Intracellular adenosine levels for 4T1 cells after different treatments (n = 5). The data are presented as the means ± SDs. The p values are calculated using two‐tailed unpaired t test, *p < 0.05, **p < 0.01, and ***p < 0.001.
Fluorescence imaging of cells was conducted to confirm intracellular ROS generation using the ROS probe (H2DCFDA). No green fluorescence signals could be observed for PBS control cells, while green fluorescence signals were found in NPMC + H2O2 and NPMCA + H2O2 cells, which should be due to the generation of ·OH via chemodynamic effect (Figure 4c). In NPMC + H2O2 + US and NPMCA + H2O2 + US cells, the green fluorescence signals were much stronger than those in NPMC + H2O2 and NPMCA + H2O2 cells. The enhanced ROS generation should be attributed to the total 1O2 and ·OH generation through sonodynamic and chemodynamic effect, respectively. The lipid peroxidation of 4T1 cells was then evaluated using malondialdehyde (MDA) assay. Regardless of US treatment, the MDA levels in NPMC‐ and NPMCA‐treated cells were much higher than those in PBS control group (Figure 4d). These results confirmed the cellular lipid peroxidation because of the chemodynamic effect of MnO2 nanoparticles.
Extracellular ATP levels were found to increase by 8.8‐ and 11.1‐fold in NPMC + US and NPMCA + US groups compared to that in PBS control group, respectively (Figure 4e). Furthermore, the extracellular high‐mobility group box 1 (HMGB1) levels were investigated using ELISA kit. After treatment of NPMC and NPMCA with US treatment, the extracellular HMGB1 levels were increased by around 2.9‐fold compared to that in control group (Figure 4f), which were slightly increased for NPMC and NPMCA treatments in the presence of H2O2. Immunofluorescence calreticulin (CRT) staining images showed that the green fluorescence signals in NPMC + H2O2 + US and NPMCA + H2O2 + US groups were obviously observed, which however were hardly detected in NPMC + H2O2 and NPMCA + H2O2 groups (Figure 4g). These results suggested that the CRT levels in these two groups were remarkably upregulated. Overall, both NPMC and NPMCA with US treatment could effectively induce ICD via upregulating the levels of ATP, CRT, and HMGB1.
To verify the role of activated ADA, the intracullular adenosine levels for cancer cells after treatments were evaluated using high‐performance liquid chromatography (HPLC). Only with H2O2 activation, the adenosine level in NPMCA – US group was 1.4‐fold lower than that in PBS control group, while in NPMCA + US group obviously reduced by around 9.7‐fold compared to those in the other groups (Figure 4h). These results suggested that NPMCA could be activated to release ADA for the effective consumption of adenosine.
2.4. Tumor Growth Inhibition Evaluation
Bilateral 4T1 tumor‐bearing mouse models were used to investigate the deep‐tissue therapeutic efficacy. At 24 h after intravenous injection of NPMC and NPMCA, the primary tumors were covered with 2‐cm chicken breast tissues and then treated with US for 10 min (Figure 5a). To optimize timepoints of US treatment for cancer therapy, the accumulation of nanoparticles in tumor tissues was investigated. As shown in the fluorescence images of mice, the tumors showed fluorescence signals after injection of NPMC and NPMCA, and the signals gradually increased until 24 h, and then declined (Figure 5b). In addition, the fluorescence intensity for tumors of NPMC‐ and NPMCA‐injected mice were almost consistent at the same post‐injection timepoints. The highest fluorescence intensity of tumors for NPMC‐ and NPMCA‐injected mice was observed at 24 h post‐injection timepoint (Figure 5c). These results suggested that both NPMC and NPMCA could effectively accumulate into tumor sites, and they showed the highest accumulation at 24 h. Such a high tumor accumulation efficacy of NPMC and NPMCA should be attributed to their small sizes and excellent stability. Bio‐distribution analysis showed that both NPMC and NPMCA had a high accumulation in tumor, kidney, and liver, while limited accumulation in lung, heart, and spleen (Figure S6, Supporting Information). Quantitative analysis of Mn element in different tissues also showed that MnO2 nanoparticles had a similar accumulation in tumor, kidney, and liver (Figure S7, Supporting Information).
Figure 5.
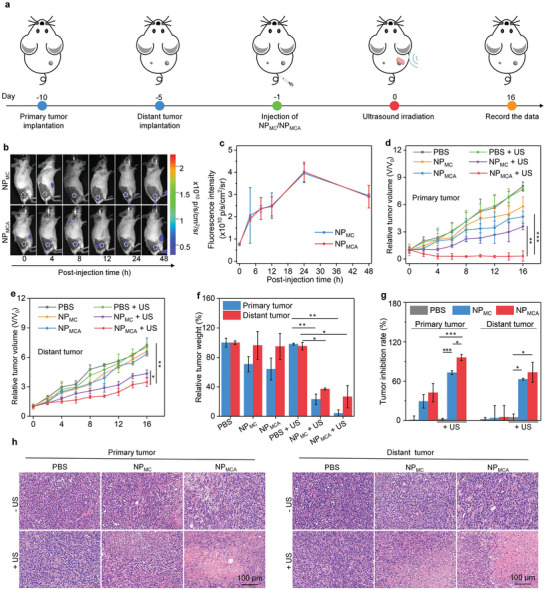
Tumor growth inhibition evaluation. a) Schematic of the establishment of bilateral tumor model, nanoparticle injection, and chicken breast tissue coverage and US treatment of primary tumors. b) Fluorescence images of mice in NPMC‐ and NPMCA‐injected groups (the tumor regions were indicated by white dotted circles). c) Fluorescence intensity of tumor sites in NPMC‐ and NPMCA‐injected mice at different times (n = 3). d) Relative tumor volume of chicken breast tissue‐covered 4T1 primary tumors in PBS‐, NPMC‐ and NPMCA‐treated mice without or with US treatment (n = 5). e) Relative tumor volume of 4T1 distant tumors in PBS‐, NPMC‐ and NPMCA‐treated mice without or with US treatment (n = 5). f) Total weight of primary and distant tumors in PBS‐, NPMC‐ and NPMCA‐treated mice without or with US treatment (n = 5). g) Tumor inhibition efficacy analysis (n = 5). h) Images of H&E stained primary and distant tumors in PBS‐, NPMC‐ and NPMCA‐treated mice without or with US treatment. The data are presented as the means ± SDs. The p values are calculated using two‐tailed unpaired t test, *p < 0.05, **p < 0.01, and ***p < 0.001.
For primary tumors, the growth in NPMC‐ and NPMCA‐injected mice without US treatment was slightly inhibited compared to that in PBS control group (Figure 5d), which should be due to the therapeutic efficacy of CDT. In contrast, the tumor growths in NPMC‐ and NPMCA‐injected and US‐treated mice were remarkably inhibited. The treatment of NPMC and NPMCA without US treatment did not remarkably inhibit the distant tumor growths in mice, and the tumor growths were similar to that for PBS control (Figure 5e). However, the growth of distant tumors was obviously inhibited in NPMC + US and NPMCA + US groups. The tumor weight in each group was then measured, which in NPMC + US and NPMCA + US groups was much lower than those in the other groups (Figure 5f). Moreover, the total weight in NPMCA + US group (0.05 g) was 5.8‐fold lower than that in NPMC + US group (0.29 g). The tumor inhibitory efficacy for primary tumors in NPMCA + US group was 95.8%, which was 1.3‐fold higher relative to that in NPMC + US group (72.9%) (Figure 5g). The tumor inhibitory efficacy for distant tumors was 73.3% for NPMC + US and 62.8% for NPMCA + US group, respectively. These results suggested that both NPMC and NPMCA with US treatment showed an obvious tumor growth inhibitory effect and the antitumor ability of NPMCA was higher than that of NPMC.
Histological staining of tumor tissues was conducted to further evaluate the therapeutic efficacy. Cell damage was observed for the primary tumors in NPMC – US, NPMCA –US, NPMC + US, and NPMCA + US groups, while it was only detected for the distant tumors in NPMC + US, and NPMCA + US groups (Figure 5h). The severest cell damage in primary and distant tumors was observed in NPMCA + US group. These results further verified that NPMCA with US treatment showed the best tumor cell‐killing efficacy.
2.5. Intratumoral Lipid Peroxidation and ICD Evaluation
The ROS generation in chicken breast tissue‐covered tumor tissues and lipid peroxidation was then evaluated. Compared to PBS control group in which nearly no green fluorescence signals were detected in primary tumors, weak fluorescence signals could be detected in the tumors for NPMC‐ and NPMCA‐treated mice without US treatment (Figure 6a). The ROS generation in these two groups was attributed to the formation of ·OH via chemodynamic reaction. The green fluorescence signals in NPMC + US and NPMCA + US groups were similar, and they were much stronger than those in the other groups, which should be due to the generation of ·OH and 1O2 via chemodynamic and sonodynamic effects concurrently. The fluorescence intensities of green signals in NPMC + H2O2 + US and NPMCA + H2O2 + US groups were around 25‐fold higher than those in NPMC + H2O2 and NPMCA + H2O2 groups (Figure 6b). The lipid peroxidation levels of tumors after treatments were also investigated. After treatment with NPMC and NPMCA regardless of US treatment, the lipid peroxidation levels in tumor tissues were significantly increased (Figure 6c). This verified the CDT effect of NPMC and NPMCA for tumor ablation.
Figure 6.
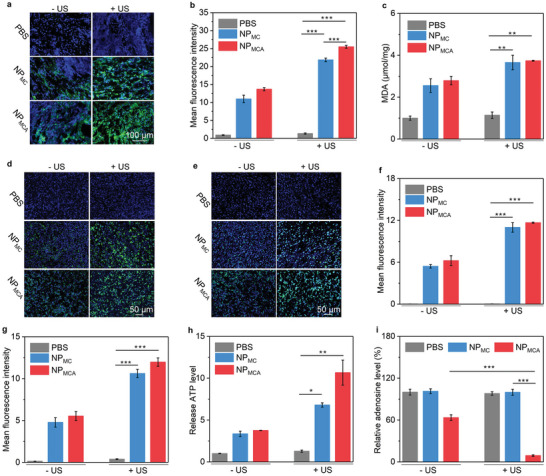
Intratumoral lipid peroxidation and ICD evaluation. a) Fluorescence images of produced ROS in chicken breast tissue‐covered primary tumors in PBS‐, NPMC‐ and NPMCA‐treated mice without or with US treatment. b) Mean fluorescence intensity of the produced ROS in chicken breast tissue‐covered primary tumors (n = 5). c) Lipid peroxidation assay of chicken breast tissue‐covered primary tumors in these treatment groups (n = 5). d) Immunofluorescence CRT staining images of chicken breast tissue‐covered primary tumors. e) Immunofluorescence HMGB1 staining images of chicken breast tissue‐covered primary tumors. f) Relative fluorescence intensity of CRT in tumors after different treatments (n = 5). g) Relative fluorescence intensity of HMGB1 in tumors after different treatments (n = 5). h) Relative ATP levels in chicken breast tissue‐covered primary tumors in these treatment groups (n = 5). i) Relative adenosine levels in chicken breast tissue‐covered primary tumors (n = 5). The data are presented as the means ± SDs. The p values are calculated using two‐tailed unpaired t test, *p < 0.05, **p < 0.01, and ***p < 0.001.
To evaluate the ICD effect, the ATP release and CRT and HMGB1 expression levels in primary tumors covered with 2‐cm chicken breast tissues were studied. Immunofluorescence CRT staining signals were detected in NPMC and NPMCA injection groups regardless of US treatment, but not in PBS control group (Figure 6d). The fluorescence staining signals in NPMC + US and NPMCA + US groups were stronger than those in NPMC – US and NPMCA – US groups. The treatments of NPMC and NPMCA also upregulated HMGB1 levels, and the HMGB1 staining signals in NPMC + US and NPMCA + US groups were further enhanced as compared to those in NPMC – US and NPMCA – US groups (Figure 6e). The quantitative data suggested that the fluorescence intensity of CRT in NPMC + US and NPMCA + US groups increased by 10.9‐ and 11.6‐fold compared with PBS group, respectively (Figure 6f). The fluorescence intensity of HMGB1 in NPMC + US and NPMCA + US groups increased by 10.6‐ and 11.9‐fold (Figure 6g). NPMC and NPMCA injection without US treatment increased the intratumoral ATP level by 3.3‐ and 3.7‐fold, respectively, but the NPMC and NPMCA injection with US treatment significantly increased the ATP level by 6.8‐ and 10.6‐fold (Figure 6h). The ATP level in tumors for NPMCA + US group was higher than that for NPMC + US group, which may be because the interference of adenosine metabolism affected the intratumoral accumulation of ATP. These results suggested that NPMC and NPMCA injection with US treatment could effectively induce ICD effect in deep tumors. The adenosine level in tumor tissues was slightly reduced by 1.6‐fold in NPMCA – US group compared to that in PBS control group, while it was reduced by 11.0‐fold in NPMCA + US group (Figure 6i). These results confirmed the activation of ADA in tumor tissues for adenosine consumption.
Although the solid tumors showed hypoxic microenvironment, the existing oxygen could be utilized to produce ROS via SDT effect and thus effectively activated ADA with the synergistic action of CDT. The combination of SDT and CDT could overcome the issue of tumor hypoxia, thus showing improved efficacy in activating ADA and inducing ICD. As immunotherapy played the dominant role in treating tumors, NPMCA showed a much higher antitumor efficacy than NPMC.
2.6. Evaluation of DC and T Cell Activation
The dendritic cells (DCs) in tumor‐draining lymph nodes were evaluated. Compared to the numbers of matured DCs in PBS control groups, which overall increased after the treatment of NPMC and NPMCA regardless of US treatment (Figure 7a). The number of matured DCs in NPMC + US (36.9%) and NPMCA + US (39.5%) groups was higher than that in NPMC – US (29.4%) and NPMCA – US (32.4%) groups (Figure 7b). These results suggested that treatment of NPMC and NPMCA with US treatment could greatly promote the maturation of DCs, which should be attributed to the combinational action of STING activation by Mn2+ and the ICD effect caused by CDT and SDT.
Figure 7.
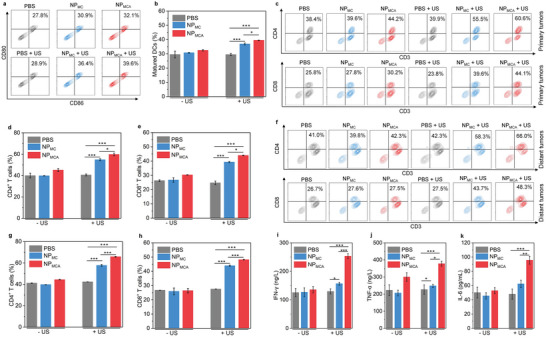
In vivo immune response evaluation. a) Flow cytometry analysis of DCs in lymphatic nodules of mice after different treatments. b) Number of matured DCs in tumor‐draining lymph nodes in PBS‐, NPMC‐ and NPMCA‐treated mice without or with US treatment (n = 5). c) Flow cytometry analysis of CD4+ and CD8+ T cells in primary tumors of mice after different treatments. d) Number of CD4+ T cells in chicken breast tissue‐covered primary tumors in PBS‐, NPMC‐ and NPMCA‐treated mice without or with US treatment (n = 5). e) Number of CD8+ T cells in chicken breast tissue‐covered primary tumors (n = 5). f) Flow cytometry analysis of CD4+ and CD8+ T cells in distant tumors of mice after different treatments. g) Number of CD4+ T cells in distant tumors in PBS‐, NPMC‐ and NPMCA‐treated mice without or with US treatment (n = 5). h) Number of CD8+ T cells in distant primary tumors (n = 5). Serum levels of i) IFN‐γ, j) TNF‐α, and k) IL‐6 in PBS‐, NPMC‐, and NPMCA‐treated mice without or with US treatment (n = 5). The data are presented as the means ± SDs. The p values are calculated using two‐tailed unpaired t test, *p < 0.05, **p < 0.01, and ***p < 0.001.
To confirm the activation of antitumor immune response, effector T cells in tumors were then analyzed. In chicken breast tissues‐covered primary tumors, increased populations of CD4+ T cells could be detected in NPMC‐ and NPMCA‐injected mice with US treatment compared to that in the other groups (Figure 7c). The number of CD4+ T cells in NPMC + US and NPMCA + US groups was 54.8% and 59.7%, respectively, which was at least 1.5‐fold higher than that for PBS control and the other treatments (Figure 7d). In distant tumors, the highest number for CD4+ T cells was also observed in NPMCA + US group (65.8%), 1.1‐fold higher than that in NPMC + US group (57.7%), and at least 1.6‐fold higher than that in the other groups (Figure 7f,g). The number of CD8+ T cells in chicken breast tissues‐covered primary tumors was measured to be 26.2% for PBS control, 26.7% for NPMC – US, 30.3% for NPMCA – US, 39.3% for NPMC + US, and 43.9% for NPMCA + US group, respectively (Figure 7e). As for CD8+ T cells in distant tumors, the number increased to 48.1% after NPMCA injection with US treatment compared to 26.7% in PBS control group (Figure 7h), which was also higher than that in NPMC – US (25.9%), NPMCA – US (26.4%), and NPMC + US (43.9%) group. These results verified that NPMCA with US treatment showed the highest efficacy in promoting the activation of immune T cells. The amplified immunological effect of NPMCA over NPMC should be due to the role of ADA activation.
Some immune‐related cytokines can promote DC maturation, antigen presentation, and T cell proliferation, thus playing key roles in antitumor immune response.[ 17 ] The serum levels of cytokines were evaluated to further confirm the activation of immune response. The highest levels of interferon‐γ (IFN‐γ) were observed in NPMCA + US group, which was 1.6‐ and 2.0‐fold higher than that in NPMC + US and control group, respectively (Figure 7i). The serum level of tumor necrosis factor‐α (TNF‐α) in NPMCA + US group was increased by 1.7‐fold, while in NPMC + US group was only increased by 1.3‐fold (Figure 7j). The NPMCA with US treatment also increased the level of interleukin‐6 (IL‐6) in serum by 1.9‐fold, which was much obvious than the other treatments (Figure 7k). Therefore, the treatment of NPMCA with US treatment could effectively promote the secretion of cytokines for effective immunotherapy.
2.7. Biosafety Evaluation
All mice after different treatments showed unchanged body weights during monitoring period (Figure S8, Supporting Information). The histological morphologies of kidney, spleen, and heart for mice after NPMCA injection and US treatment did not have any changes and were similar to those in PBS control group (Figure S9, Supporting Information). These results confirmed the good biosafety of NPMCA for cancer treatment.
3. Conclusion
We have reported a nanopotentiator (NPMCA) that can be activated by tumor microenvironment and US to mediate SDT, CDT, and inhibition of adenosine metabolism for enhanced immunotherapy of deep tumors. NPMCA could specifically release ADA via scissoring ROS‐cleavable linkers by the generated ·OH and 1O2 through CDT and SDT effect upon US treatment in the presence of H2O2 in tumor microenvironment, which leads to interference of adenosine metabolism. Due to the excellent tissue penetrating capability of US, NPMCA was able to mediate the ROS generation in deep tumors covered with 2‐cm chicken breast tissues. In addition to direct killing of tumor cells, these generated ROS also induced ICD of dying tumor cells, which played an important role in triggering the maturation of DCs and priming of T cells. Thus, the populations of DCs and CD4+ and CD8+ T cells in NPMCA injected and US‐treated group were increased. Through combining CDT, SDT, and immunotherapy, NPMCA achieved effective inhibition of growths of deep tumors. This study presents the first tumor microenvironment and US dual‐cascade activatable nanoplatform for effective treatment of deep tumors. Because of the excellent tissue penetration depth of this therapeutic strategy, its possible to be used for the treatment of orthotopic tumor models (such as hepatic carcinoma and pancreatic cancer) in deep tissues will be explored.
4. Experimental Section
Synthesis of BSA‐Stabilized MnO2 (BSA‐MnO2) Nanoparticles
KMnO4 (32 mg) and BSA (250 mg) were dissolved in 10 mL water, and the obtained solution was reacted under stirring for 3 h. The solution was then dialyzed using dialysis membranes at 25 °C for 12 times. After further ultrafiltration, BSA‐MnO2 nanoparticles were obtained.
Synthesis of Ce6‐Conjugated BSA‐MnO2 Nanoparticles (NPMC)
Ce6 (1 mg) dissolved in 5 mL dimethyl sulfoxide (DMSO) was reacted with hydrochloride crystalline (EDC, 2 mg) and N‐hydroxysuccin‐imide (NHS, 2 mg) at 25 °C under the dark for 3 h to activate the carboxyl groups. The activated Ce6 was then mixed with BSA‐MnO2 nanoparticles, and the reaction was continued at 25 °C under the dark for 72 h. The solution was dialyzed at 25 °C for 12 times to remove the raw materials. After ultrafiltration, the products (NPMC) were obtained.
Synthesis of ROS‐Cleavable Linker
ROS‐cleavable linker with terminal carboxyl groups on each side was synthesized according to previous work.[ 7c ]
Synthesis of NPMCA
ROS‐cleavable linker (10 mg), EDC (40 mg), and NHS (22 mg) were co‐dissolved in 0.1 mL DMSO and the reaction was continued at 25 °C for 3 h to activate the carboxyl groups. The activated ROS‐cleavable linkers were then mixed with ADA and NPMC in 2 mL PBS. The reaction was continued at 4 °C under the dark for 24 h, and the obtained solution was purified via ultrafiltration (molecular weight cut‐off = 30 kDa) at 4 °C to obtain NPMCA.
Evaluation of Sonodynamic 1O2 Generation Efficacy
PBS solution of NPMC or NPMCA (1 mL) was mixed with SOSG solution (1 µL), and the formed solutions were treated with US (1.0 W cm−2, 50% duty cycle). The fluorescence intensities of SOSG for solutions without or with US treatments were measured using fluorescence spectrophotometer to calculate sonodynamic 1O2 generation.
Evaluation of ·OH Generation Efficacy
PBS solution of NPMC or NPMCA (0.3 mL) was mixed with MB (3 mL), and H2O2 was added into the solutions. The solutions were incubated at 25 °C for 30 min. The absorbance of TMB for solutions was measured to evaluate the ·OH generation.
Evaluation of Activatable ADA Release
To evaluate activatable ADA release, FITC‐conjugated ADA was used to fabricate FITC‐NPMCA. PBS solutions of FITC‐NPMCA without or with the addition of H2O2 (100 µm) were treated with US (1.0 W cm−2, 50% duty cycle) for 10 min. The solutions were then ultrafiltrated (molecular weight cut‐off = 50 kDa) to collect lower solutions. The concentrations of FITC‐conjugated ADA in the lower solutions were measured using fluorescence spectrometer to calculate release percentages.
Hemolysis Assay
Mouse blood red cells were incubated with PBS solutions of NPMC or NPMCA at different Ce6 concentrations at 25 °C for 2 h. Hemolysis assay was then conducted by measuring the absorbance of supernatants after centrifugation to precipitate the blood red cells.
Cytocompatibility Assay
4T1 cells were incubated with NPMC or NPMCA at different Ce6 concentrations for 24 h. The cells were then cultured in cell culture medium containing cell counting kit‐8 (CCK‐8) for 2 h, and then the cell viability was evaluated using CCK‐8 assay.
In Vitro Therapeutic Efficacy Evaluation
4T1 cells were incubated with NPMC or NPMCA at different Ce6 concentrations and H2O2 at the final concentration of 100 µm for 24 h. The cells were then treated with US (1.0 W cm−2, 50% duty cycle) for 3 min. After further culture in cell culture medium containing CCK‐8 for 2 h, CCK‐8 assay was used to evaluate the cell viability.
Intracellular ROS Level Evaluation
4T1 cells were incubated with H2DCFDA (10 µm), NPMC, or NPMCA at different Ce6 concentrations and H2O2 at the final concentration of 100 µm. The cells were then treated with US (1.0 W cm−2, 50% duty cycle) for 3 min. After that, the fluorescence images were captured to analyze intracellular ROS levels.
Cellular Lipid Peroxidation Evaluation
4T1 cells were incubated with PBS, NPMC or NPMCA, and H2O2 (100 µm). The cells were treated with US (1.0 W cm−2, 50% duty cycle) for 3 min. The treated cells were collected for lipid peroxidation assay using MDA kit according to the standard procedures.
In Vitro ICD Induction
4T1 cells incubated in cell culture medium containing NPMC or NPMCA at different Ce6 concentrations and H2O2 were treated by US (1.0 W cm−2, 50% duty cycle, 3 min). The cells were used for the analysis of HMGB1 levels, ATP contents, and CRT expression levels.
Tumor Model Establishment
Animal experiments were conducted according to the procedures permitted by the Institutional Anima Care and Treatment Committee of Jinan University. Bilateral mouse 4T1 tumor models were established by subcutaneously implanting 4T1 cells into the two flanks of mice (BALB/c, female, 5–7 weeks).
Tumor Accumulation and Bio‐Distribution Analysis
A fluorescence imaging system was adopted to investigate the tumor accumulation and bio‐distribution after intravenous injection of nanoparticles.
Intratumoral ROS Level Evaluation
At 24 h post‐injection of PBS, NPMC, or NPMCA at the Ce6 concentration of 50 µg mL−1 (0.2 mL for each mouse), the primary tumors were directly injected with H2DCFDA and then covered with chicken breast tissues at the thickness of 2 cm. After 0.5 h, the primary tumors were treated with US (1.0 W cm−2, 50% duty cycle). The mice were then euthanized to extract tumors, and sections of tumor tissues were prepared for fluorescence imaging.
Intratumoral Lipid Peroxidation Evaluation
After treatments, the primary tumors were extracted from mice for lipid peroxidation assay using MDA kit.
Tumor Inhibitory Efficacy Evaluation
At 24 h post‐injection timepoint, the primary tumors were covered with chicken breast tissues at the thickness of 2 cm. Then the primary tumors were treated with US (1.0 W cm−2, 50% duty cycle) for 3 min. The tumor lengths and widths were measured to calculate the tumor volumes. Histological analysis was performed by staining tumor sections and capturing stained images using a fluorescence microscope.
In Vivo ICD Induction
The evaluations of ATP, CRT, and HMGB1 levels in tumor tissues were conducted according to previous work.[ 7d ]
Adenosine Level Measurement
After the treatments of 4T1 cells and primary tumors, the samples were collected for the measurement of adenosine levels by HPLC.
Evaluation of Antitumor Immune Response
The primary tumors were covered with 2‐cm chicken breast tissues and then treated with US for 10 min. After 10 days of treatments, the mice were euthanized to extract primary and distant tumors and tumor‐draining lymph nodes. These tissues were used to prepare single cell suspensions by grinding and filtering. The collected single cells were stained with antibodies, and then analyzed using a CytoFLEX flow cytometer. The tumor tissues were homogenized in PBS solution and the formed suspensions were filtered via cell strainers to obtain the single cell suspensions. The cells were stained with antibodies and then analyzed using a CytoFLEX flow cytometer.
Cytokine Level Evaluation
After 7 days of treatment as described above, blood was collected from the mice and serum was obtained by centrifuging the blood. The serum levels of TNF‐α, IFN‐γ, and IL‐6 were measured.
In Vivo Biosafety Evaluation
Body weights of 4T1 tumor‐bearing mice were recorded. Histological analysis of heart, spleen, and kidney was conducted by staining these tissue sections with H&E solution.
Statistical Analysis
The experiments were repeated at least three times. Mean ± standard deviation (SD) was shown in the data of some figures and the sample size (n) for each statistical analysis was shown in the figure caption. A two‐tailed unpaired t test was used to determine the statistical significance. GraphPad Prism 8 Software was used for the statistical analysis. For all tests, the statistical significance was indicated as *p < 0.05, **p < 0.01, and ***p < 0.001. The p < 0.05 was considered statistically significant.
Conflict of Interest
The authors declare no conflict of interest.
Supporting information
Supporting Information
Acknowledgements
M Z., F.W., and Y.L. contributed equally to this work. This study was supported by the National Natural Science Foundation of China (82230067, 81903165, 82001934, 82272103), the Guangdong Provincial Key Laboratory of Tumor Interventional Diagnosis and Treatment (2021B1212040004), the Natural Science Foundation of Guangdong Province of China (2022B1515020010), and the Foundation of Department of Science and Technology of Sichuan Province (2020YFQ0004).
Zhan M., Wang F., Liu Y., Zhou J., Zhao W., Lu L., Li J., He X., Dual‐Cascade Activatable Nanopotentiators Reshaping Adenosine Metabolism for Sono‐Chemodynamic‐Immunotherapy of Deep Tumors. Adv. Sci. 2023, 10, 2207200. 10.1002/advs.202207200
Contributor Information
Meixiao Zhan, Email: zhanmeixiao1987@126.com.
Jingchao Li, Email: jcli@dhu.edu.cn.
Xu He, Email: hexu220@163.com.
Data Availability Statement
The data that support the findings of this study are available from the corresponding author upon reasonable request.
References
- 1.a) Gong N., Sheppard N. C., Billingsley M. M., June C. H., Mitchell M. J., Nat. Nanotechnol. 2021, 16, 25; [DOI] [PubMed] [Google Scholar]; b) Li J., Luo Y., Pu K., Angew. Chem., Int. Ed. 2021, 60, 12682; [DOI] [PubMed] [Google Scholar]; c) Nam J., Son S., Park K. S., Zou W., Shea L. D., Moon J. J., Nat. Rev. Mater. 2019, 4, 398. [Google Scholar]
- 2.a) Phuengkham H., Ren L., Shin I. W., Lim Y. T., Adv. Mater. 2019, 31, 1803322; [DOI] [PubMed] [Google Scholar]; b) Wang Y., Yu J., Luo Z., Shi Q., Liu G., Wu F., Wang Z., Huang Y., Zhou D., Adv. Mater. 2021, 33, 2103497; [DOI] [PubMed] [Google Scholar]; c) Gong C., Yu X., Zhang W., Han L., Wang R., Wang Y., Gao S., Yuan Y., J. Nanobiotechnol. 2021, 19, 58; [DOI] [PMC free article] [PubMed] [Google Scholar]; d) Li L., Zhen M., Wang H., Sun Z., Jia W., Zhao Z., Zhou C., Liu S., Wang C., Bai C., Nano Lett. 2020, 20, 4487. [DOI] [PubMed] [Google Scholar]
- 3.a) Leone R. D., Emens L. A., J. Immunother. Cancer 2018, 6, 57; [DOI] [PMC free article] [PubMed] [Google Scholar]; b) Liang L., Yang L. L., Wang W., Ji C., Zhang L., Jia Y., Chen Y., Wang X., Tan J., Sun Z. J., Adv. Mater. 2021, 33, 2102271; [DOI] [PubMed] [Google Scholar]; c) Helms R. S., Powell J. D., Curr. Opin. Pharmacol. 2020, 53, 77; [DOI] [PubMed] [Google Scholar]; d) Wang J., Matosevic S., J. Mol. Med. 2018, 96, 903. [DOI] [PubMed] [Google Scholar]
- 4.a) Krysko D. V., Garg A. D., Kaczmarek A., Krysko O., Agostinis P., Vandenabeele P., Nat. Rev. Cancer 2012, 12, 860; [DOI] [PubMed] [Google Scholar]; b) Moesta A. K., Li X.‐Y., Smyth M. J., Nat. Rev. Immunol. 2020, 20, 739; [DOI] [PubMed] [Google Scholar]; c) Ferretti E., Horenstein A., Canzonetta C., Costa F., Morandi F., Immunol. Lett. 2019, 205, 25. [DOI] [PubMed] [Google Scholar]
- 5.a) Zhou L., Zhang P., Wang H., Wang D., Li Y., Acc. Chem. Res. 2020, 53, 1761; [DOI] [PubMed] [Google Scholar]; b) Tan J., Ding B., Zheng P., Chen H., Ma P. a., Lin J., Small 2022, 18, 2202462; [DOI] [PubMed] [Google Scholar]; c) Xiong X., Zhao J., Su R., Liu C., Guo X., Zhou S., Nano Today 2021, 39, 101225. [Google Scholar]
- 6.a) Qi J., Jin F., You Y., Du Y., Liu D., Xu X., Wang J., Zhu L., Chen M., Shu G., Nat. Commun. 2021, 12, 4755; [DOI] [PMC free article] [PubMed] [Google Scholar]; b) Zhao Z., Li Q., Qin X., Zhang M., Du Q., Luan Y., Adv. Funct. Mater. 2022, 32, 2200801; [Google Scholar]; c) Xiong H., Ma X., Wang X., Su W., Wu L., Zhang T., Xu Z., Sun Z. J., Adv. Funct. Mater. 2021, 31, 2100007. [Google Scholar]
- 7.a) Zhang J., Lin Y., Lin Z., Wei Q., Qian J., Ruan R., Jiang X., Hou L., Song J., Ding J., Adv. Sci. 2022, 9, 2103444; [DOI] [PMC free article] [PubMed] [Google Scholar]; b) Peng S., Xiao F., Chen M., Gao H., Adv. Sci. 2022, 9, 2103836; [DOI] [PMC free article] [PubMed] [Google Scholar]; c) Li J., Cui D., Huang J., He S., Yang Z., Zhang Y., Luo Y., Pu K., Angew. Chem., Int. Ed. 2019, 58, 12680; [DOI] [PubMed] [Google Scholar]; d) Yu N., Ding M., Wang F., Zhou J., Shi X., Cai R., Li J., Nano Today 2022, 46, 101600. [Google Scholar]
- 8. Xu C., Jiang Y., Huang J., Huang J., Pu K., Adv. Mater. 2021, 33, 2101410. [DOI] [PubMed] [Google Scholar]
- 9.a) Qian X., Zheng Y., Chen Y., Adv. Mater. 2016, 28, 8097; [DOI] [PubMed] [Google Scholar]; b) Sun S., Wu M., Smart Mater. Med. 2021, 2, 145; [Google Scholar]; c) Ma A., Chen H., Cui Y., Luo Z., Liang R., Wu Z., Chen Z., Yin T., Ni J., Zheng M., Small 2019, 15, 1804028. [DOI] [PubMed] [Google Scholar]
- 10.a) Zhang L., Yi H., Song J., Huang J., Yang K., Tan B., Wang D., Yang N., Wang Z., Li X., ACS Appl. Mater. Interfaces 2019, 11, 9355; [DOI] [PubMed] [Google Scholar]; b) Ouyang J., Tang Z., Farokhzad N., Kong N., Kim N. Y., Feng C., Blake S., Xiao Y., Liu C., Xie T., Nano Today 2020, 35, 100949; [Google Scholar]; c) You D. G., Yoon H. Y., Jeon S., Um W., Son S., Park J. H., Kwon I. C., Kim K., Nano Convergence 2017, 4, 30. [DOI] [PMC free article] [PubMed] [Google Scholar]
- 11.a) Zhang C., Huang J., Zeng Z., He S., Cheng P., Li J., Pu K., Nat. Commun. 2022, 13, 3468; [DOI] [PMC free article] [PubMed] [Google Scholar]; b) Li J., Luo Y., Zeng Z., Cui D., Huang J., Xu C., Li L., Pu K., Zhang R., Nat. Commun. 2022, 13, 4032; [DOI] [PMC free article] [PubMed] [Google Scholar]; c) Zeng Z., Zhang C., He S., Li J., Pu K., Adv. Mater. 2022, 34, 2203246. [DOI] [PubMed] [Google Scholar]
- 12. Gong F., Yang N., Wang X., Zhao Q., Chen Q., Liu Z., Cheng L., Nano Today 2020, 32, 100851. [Google Scholar]
- 13. Yin W., Ke W., Chen W., Xi L., Zhou Q., Mukerabigwi J. F., Ge Z., Biomaterials 2019, 195, 63. [DOI] [PubMed] [Google Scholar]
- 14.a) Li J., Huang J., Lyu Y., Huang J., Jiang Y., Xie C., Pu K., J. Am. Chem. Soc. 2019, 141, 4073; [DOI] [PubMed] [Google Scholar]; b) Chen S., Wang X., Lin M., Hou Y., Ding M., Kong D., Sun H., Zhang Q., Li J., Zhou Q., Appl. Mater. Today 2021, 25, 101258; [Google Scholar]; c) Ding M., Fan Y., Lv Y., Liu J., Yu N., Kong D., Sun H., Li J., Acta Biomater. 2022, 149, 334. [DOI] [PubMed] [Google Scholar]
- 15.a) Wang Z., Ju Y., Ali Z., Yin H., Sheng F., Lin J., Wang B., Hou Y., Nat. Commun. 2019, 10, 4418; [DOI] [PMC free article] [PubMed] [Google Scholar]; b) Du P., Yan J., Long S., Xiong H., Wen N., Cai S., Wang Y., Peng D., Liu Z., Liu Y., J. Mater. Chem. B 2020, 8, 4046; [DOI] [PubMed] [Google Scholar]; c) Hao Y., Dong Z., Chen M., Chao Y., Liu Z., Feng L., Hao Y., Dong Z., Chen M., Chao Y., Biomaterials 2020, 228, 119568; [DOI] [PubMed] [Google Scholar]; d) Shao Y., Shi C., Xu G., Guo D., Luo J., ACS Appl. Mater. Interfaces 2014, 6, 10381. [DOI] [PMC free article] [PubMed] [Google Scholar]
- 16.a) Hou L., Tian C., Yan Y., Zhang L., Zhang H., Zhang Z., ACS Nano 2020, 14, 3927; [DOI] [PubMed] [Google Scholar]; b) Zhao X., Zhang K., Wang Y., Jiang W., Cheng H., Wang Q., Xiang T., Zhang Z., Liu J., Shi J., Adv. Funct. Mater. 2022, 32, 2108883; [Google Scholar]; c) Yan J., Wang G., Xie L., Tian H., Li J., Li B., Sang W., Li W., Zhang Z., Dai Y., Adv. Mater. 2022, 34, 2105783. [DOI] [PubMed] [Google Scholar]
- 17. Mocellin S., Wang E., Marincola F. M., J. Immunother. 2001, 24, 392. [PubMed] [Google Scholar]
Associated Data
This section collects any data citations, data availability statements, or supplementary materials included in this article.
Supplementary Materials
Supporting Information
Data Availability Statement
The data that support the findings of this study are available from the corresponding author upon reasonable request.


