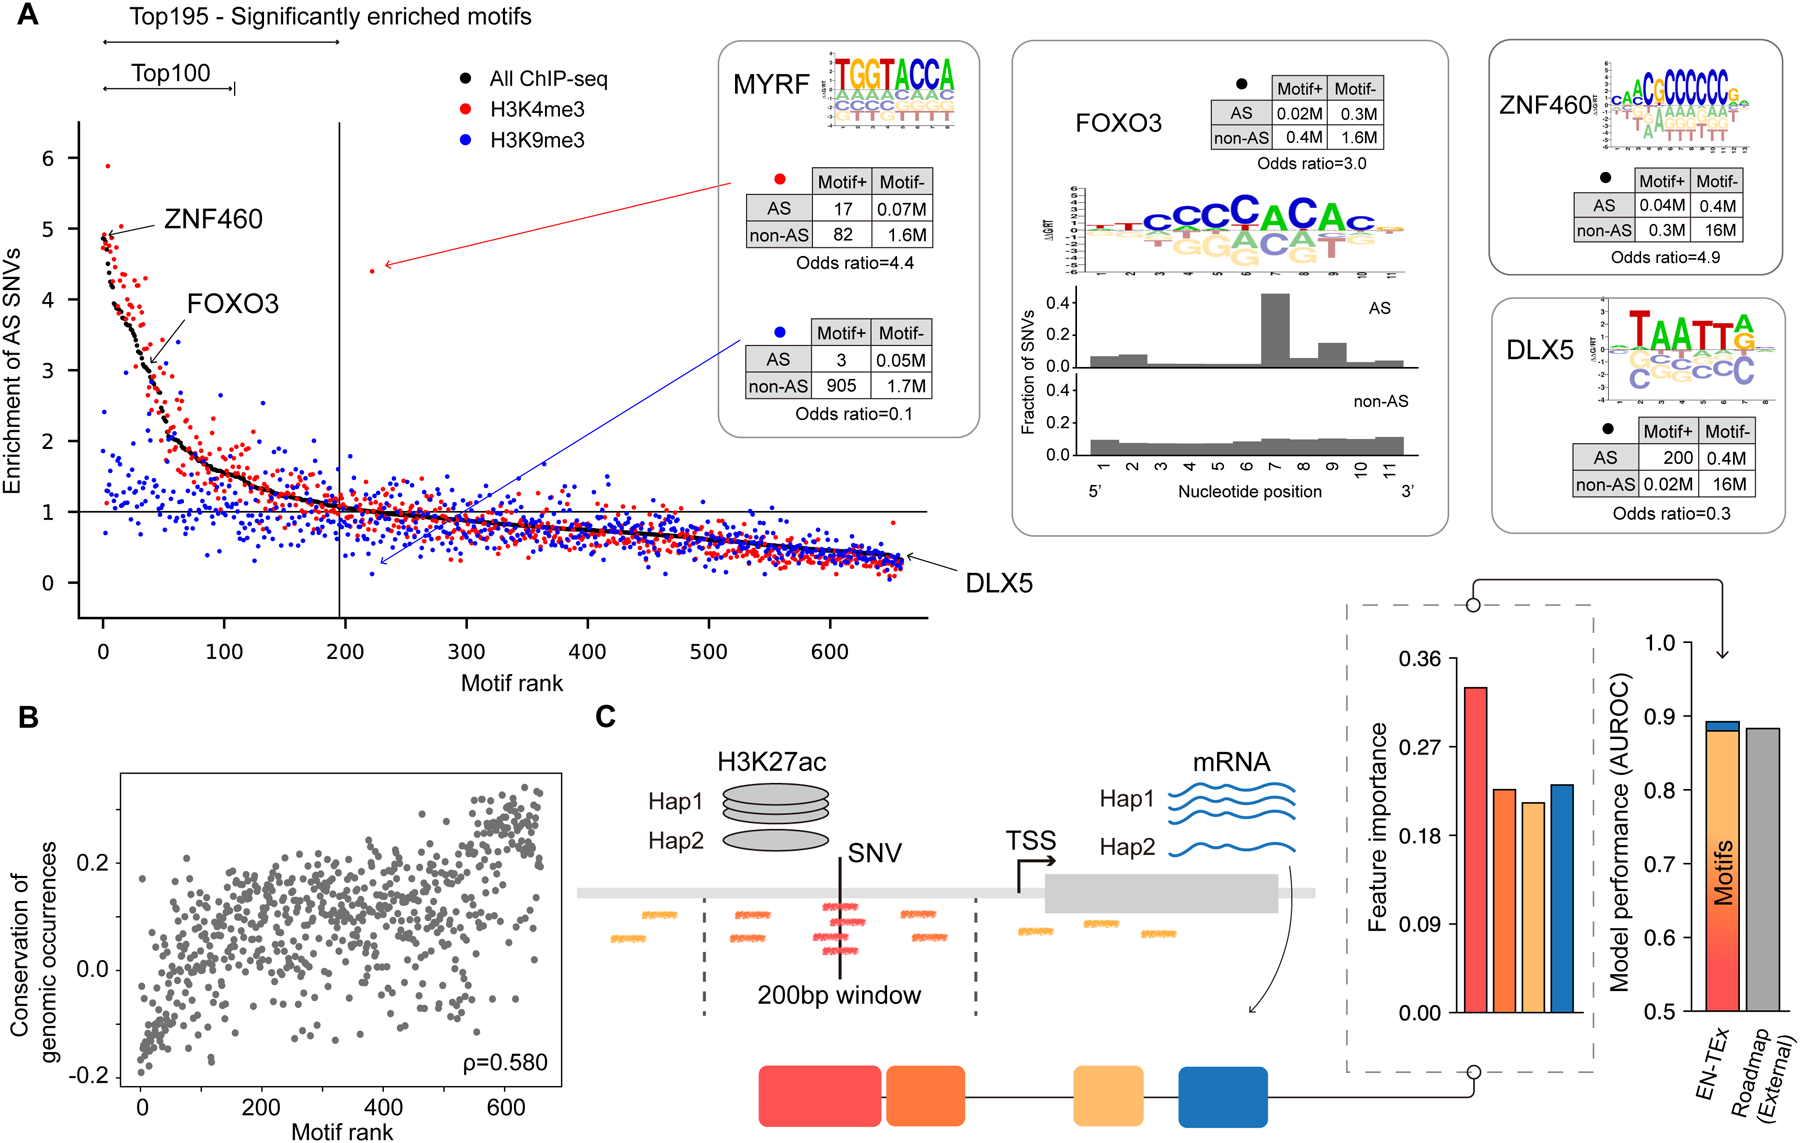
Figure 6. Aspects of Application 3: Highlighting “Sensitive” TF Motifs.

(A) TF Motifs ranked by enrichment of AS SNVs. We calculated the enrichment of AS SNVs for each TF using 2-by-2 contingency tables, with representative ones shown in the figure. For the representative TFs we also show a motif logo (and, for FOXO3, the location of the overlapping AS or non-AS SNVs). In the scatter plot, the dots correspond to TF motifs, which are ranked by AS enrichment. Colors indicate different histone modifications. (Details in Data S30 and STAR Methods “Sensitive Motifs” Section.)
(B) TF motif ranking is correlated with conservation of the motif regions. (Details in STAR Methods “Sensitive Motifs” Section.)
(C) Schematic of a statistical model predicting AS promoter activity. The model predicts whether a promoter exhibits AS H3K27ac activity. Motifs of ranked TFs (colored short lines) were used as features of the model in addition to AS expression ratio. Right-hand-side bar charts show feature weights and the overall performance of the model, in comparison to Roadmap. Model performance is dominated by the motifs, with only marginal improvement from adding AS expression imbalance. (Details in the STAR Methods “AS Promoter” Section.)
