

Abstract
Background
Immune-mediated necrotizing myopathy (IMNM), a subgroup of idiopathic inflammatory myopathies (IIMs), is characterized by severe proximal muscle weakness and prominent necrotic fibers but no infiltration of inflammatory cells. IMNM pathogenesis is unclear. This study investigated key biomarkers and potential pathways for IMNM using high-throughput sequencing and bioinformatics technology.
Methods
RNA sequencing was conducted in 18 IMNM patients and 10 controls. A combination of weighted gene coexpression network analysis (WGCNA) and differentially expressed gene (DEG) analysis was conducted to identify IMNM-related DEGs. Feature genes were screened out by employing the protein—protein interaction (PPI) network, support vector machine-recursive feature elimination (SVM-RFE), and least absolute shrinkage selection operator (LASSO). Quantitative real-time polymerase chain reaction (qRT—PCR) was performed to verify their differential expression, and the receiver operating characteristic curve (ROC) was used to evaluate their diagnostic efficiency. Functional enrichment analysis was applied to reveal the hidden functions of feature genes. Furthermore, 28 immune cell abundance patterns in IMNM samples were measured.
Results
We identified 193 IMNM-related DEGs that were aberrantly upregulated in the IMNM population and were closely associated with immune-inflammatory responses, regulation of skeletal and cardiac muscle contraction, and lipoprotein metabolism. With the help of the PPI network and the LASSO and SVM-RFE algorithms, three feature genes, LTK, MYBPH, and MYL4, were identified and further confirmed by qRT—PCR. ROC curves among IMNM, dermatomyositis (DM), inclusion body myositis (IBM), and polymyositis (PM) samples validated the LTK and MYL4 genes as IMNM-specific feature markers. In addition, all three genes had a notable association with the autophagy—lysosome pathway and immune-inflammatory responses. Ultimately, IMNM displayed a marked immune-cell infiltrative microenvironment. The most significant correlation was found between CD4 T cells, CD8 T cells, macrophages, natural killer (NK) cells, and dendritic cells (DCs).
Conclusions
LTK, MYBPH, and MYL4 were identified as potential key molecules for IMNM and are believed to play a role in the autophagy—lysosome pathway and muscle inflammation.
Keywords: IMNM, RNA sequencing, Biomarkers, Immune cell infiltration, Autophay-lysosome pathway
Graphical Abstract
1. Introduction
Immune-mediated necrotizing myopathy (IMNM) is an idiopathic inflammatory myopathy (IIM) that was first distinguished from previously recognized types of IIMs in 2004 [1]. IMNM is typically characterized by proximal muscle weakness in the limbs and trunk, together with markedly elevated serum creatine kinase (CK) levels, but relatively few extramuscular signs and symptoms [2]. IMNM incidence has increased in recent years, accounting for 10 % of inflammatory myopathies in some geographic regions [3]. Clinically, most severe muscle-related morbidities are commonly associated with IMNM; for example, muscle atrophy, fat replacement and disability may occur. Currently, without standard treatment for IMNM, a combination medication of corticosteroids, immunosuppressants, and intravenous immunoglobulin acts as the most common option [4], [5], [6]. However, IMNM patients rarely fully recover their muscle strength and are at high risk of relapse, even when they receive high doses of corticosteroids and/or immunosuppressants [2]. Long-term recurrence and lack of effective treatment indicate a poor understanding of the disease’s mechanisms [2]. To discover new therapeutic approaches for IMNM, the underlying pathological mechanism in the occurrence and progression of the disease needs to be investigated.
In addition, muscle biopsies of IMNM demonstrate prominent muscle cell necrosis and regeneration but little lymphocytic infiltration, showing clear distinction from dermatomyositis and polymyositis [2]. Immunohistochemical staining of samples from IMNM patients revealed high accumulation of the autophagy markers LC3 and p62 but no signs of myxovirus resistance protein A (MxA, a positive result indicates type I interferon pathway activation, as featured in dermatomyositis) [7], [8]. Another pathological feature of IMNM is the deposition of the membrane attack complex (MAC) at the surface of myofibers [2]. Two myositis-specific autoantibodies are associated with IMNM, namely, anti-signal recognition particle (anti-SRP) and anti-3-hydroxy-3-methylglutaryl-CoA reductase (anti-HMGCR). These antibodies are thought to bind to antigens and activate complement [9]. These unique pathological features illustrate a distinctive pathological mechanism in the progression of IMNM. Therefore, novel biomarkers and pathways may be required to understand the pathogenesis of IMNM and to identify potential therapeutic targets.
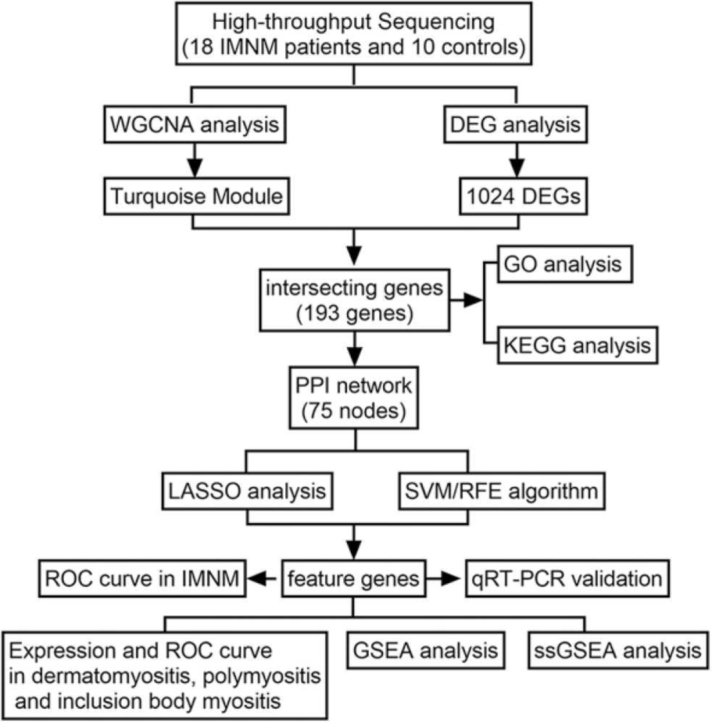
Advances in both high-throughput sequencing technologies and bioinformatics have broadened the views on disease pathogenesis, helping to identify biomarkers and develop therapeutic strategies [10]. A combination of WGCNA (weighted gene coexpression network analysis) and DEGs (differentially expressed genes) has been widely applied in bioinformatics [10]. WGCNA analyzes the relationships between genes by building a coexpression network, while DEG analysis mainly focuses on the difference in expression levels between samples. Integrating both approaches can provide a more comprehensive view of the data [10]. Furthermore, two different machine learning algorithms, that is, least absolute shrinkage and selection operator (LASSO) and support vector machine recursive feature elimination (SVM-RFE), are commonly used for identifying biomarkers. LASSO is a regression method that simultaneously performs variable selection and regularization to improve the accuracy and interpretability of the model [11]. SVM-RFE is a hybrid algorithm that combines the strengths of SVM and RFE to identify the most relevant genes by iteratively ranking and eliminating features according to their importance [12]. Taking advantage of the strengths of each algorithm, researchers can produce a more robust set of key genes [13]. In this study, 28 high-throughput sequencing muscle samples were analyzed with the above algorithms to uncover possible biomarkers and molecular mechanisms of IMNM. The research flowchart is illustrated in Fig. 1.
Fig. 1.

The research flowchart depicting the process of identifying IMNM-related feature genes. A combination of WGCNA and DEG analysis was used to identify IMNM-related DEGs. Shared feature genes were then screened out using LASSO and SVM algorithms and validated in vivo.
2. Material and methods
2.1. Study population
The muscle tissue samples obtained from 18 patients with IMNM and 10 samples from normal controls were analyzed retrospectively. IMNM is diagnosed as per the criteria given by the Idiopathic Inflammatory Myopathies Workshop of the European Neuromuscular Centre (ENMC) [1], [6]. Inclusion criteria included proximal weakness of the muscles, high serum CK levels, necrosis and regeneration of myofibers, and minimal inflammatory cell infiltration. Among them, 33.3 % (6/18) were positive for anti-HMGCR antibodies, 33.3 % (6/18) were positive for anti-SRP antibodies, and the rest were seronegative. As controls, muscle samples were obtained from 10 subjects with no muscle disease as determined by clinical, electromyography, muscle MRI and histological criteria. The mean age was 48.3 ± 18.1 years in IMNM patients and 42.7 ± 16.8 in controls. The male/female ratio was 4:14 in IMNM patients and 5:5 in controls. IMNM patients and controls did not differ significantly with respect to sex or age. The detailed clinical information is given in Supplementary Table 1. All subjects gave written informed consent. The research was in compliance with the Declaration of Helsinki and approved by the Sichuan Provincial People’s Hospital Ethics Committee (approval number: 2021-292). All biopsy samples were cryopreserved at − 80 °C for subsequent tests.
2.2. RNA extraction and high-throughput sequencing
All 28 muscle samples were extracted and purified with TRIzol reagent (Invitrogen, Carlsbad, USA) based on the manufacturer’s instructions. High-throughput sequencing was performed by Lianchuan Bio (Hangzhou, Jiangsu Province, China), with the main steps including RNA integrity assessment, fragmentation, reverse transcription, double-stranded conversion, purification, amplification and sequencing, as described in Supplementary Method 1. The sequencing data were quality-controlled, filtered, compared, quantified, and normalized by FastQC (version 0.11.9), Trimmomatic (version 0.39), HISAT2 (version 2.2.1), FeatureCount (version 2.0.0), and DESeq2 (version 1.26.0) software, respectively.
2.3. WGCNA
The WGCNA package in R [14] was implemented in the local IMNM cohort to identify IMNM-related modules. In brief, all genes with a variance value greater than 25 % were extracted to build the coexpression network. The goodSamplesGenes function was applied to exclude any samples with outlier characteristics, and no outlier samples were identified. To construct the scale-free network, the power β = 3 (scale free R^2 = 0.85) was selected as a soft-thresholding index. Afterward, a gene clustering tree was obtained per the calculated adjacency between genes, and then genes were grouped into different modules with at least 30 similar genes per module. To obtain the ultimate module, we consolidated analogous modules with MEDissThres (the module eigengene dissimilarity threshold) set to 0.2. Pearson correlation analysis was conducted to reveal the association between modules and the phenotype of interest. The module with the highest correlation to the IMNM was selected as the IMNM-related module, and then the genes within the module were further analyzed. Finally, Pearson correlation coefficients (cor) were calculated in the IMNM-related module to measure the correlation between gene module membership and gene significance [15]. Genes that had |module membership (MM)| > 0.8 and |gene significance (GS)| > 0.2 were categorized as IMNM-related module genes.
2.4. Differential expression analysis and screening of IMNM-related DEGs
Differential gene expression analysis was implemented in R software using the edgeR [16] package. The saliency thresholds were as follows: |log2-fold change| > 0.5 and P < 0.05. By using the Jvenn online tool [17], intersecting genes between DEGs and IMNM-related modular genes were identified and categorized as IMNM-related DEGs.
2.5. Functional enrichment analysis
Relying on the DAVID website [18], enrichment analyses, including Gene Ontology (GO) and Kyoto Encyclopedia of Genes and Genomes (KEGG) analyses, were conducted to evaluate the potential roles of IMNM-related DEGs. Enrichment of a term/pathway with P < 0.05 and count ≥ 2 was considered to be statistically significant enrichment.
2.6. Construction of the PPI networks and identification of feature genes
Protein—protein interaction (PPI) networks were built using the STRING (Search Tool for Retrieval of Interacting Genes) database (URL: http://string-db.org). The corresponding parameters were set as follows: Organism, Homosapiens; meaning of network edges, confidence; active interaction sources, Textmining, Experiments, Databases, Coexpression, Neighborhood, GeneFusion, and Co‑occurrence; and interaction score, medium confidence (0.4). After visualizing the PPI network using Cytoscape, 75 nodes were identified. Subsequently, two algorithms, LASSO (R package glmnet) and SVM-RFE (R package e1071) [12], were employed to screen out the feature genes. In the LASSO regression analysis, the parameters were set as follows: family = binomial, type.measure = class, nfold = 10. Furthermore, based on the average misjudgment rates of their 5-fold cross-validations, an SVM-RFE model was constructed using an SVM package. Finally, three overlapping feature genes were derived from the two algorithms. Subsequently, the Wilcox test was used to assess the expression levels of three feature genes in dermatomyositis (DM), inclusion body myositis (IBM) and polymyositis (PM). With the "pROC" package in R, receiver operating characteristic (ROC) curves of the feature genes were analyzed to evaluate their diagnostic ability among various subtypes of IIMs.
2.7. Quantitative real-time polymerase chain reaction (qRT—PCR)
After the RNA was extracted from muscle samples as described above, cDNA was synthesized using the SureScript-First-strand-cDNA-synthesis-kit (Servicebio, Guangzhou, China). For qRT—PCR, the reverse transcription product (3 µl) was mixed with 2 × Universal Blue SYBR Green qPCR Master Mix (5 µl) (Genecopoeia, Guangzhou, China) and forward and reverse primers (1 µl). The PCR was carried out as follows: denaturation at 95 °C for 1 min, followed by 40 cycles of 20 s at 95 °C, 20 s at 55 °C and 30 s at 72 °C. For MYBPH, the forward primer was “TCCATCCTCTTCATTCGCTCG”, and the reverse primer was “TGCCCTGTCTTTTTGTCTGCC”. For LTK, “CCTCCTTATGGTGTGTGGGGT” was the forward primer, and “CTGATGGCGAAACTTGCTGAT” was the reverse primer. For MYL4, the forward primer was “ACGTTCTTGCCCATCCTGC”, while the reverse primer was “TGACCGTGCCATTGCTCTC”. For GAPDH, “ACAACTTTGGTATCGTGGAAGG” was the forward primer, while the reverse primer was “GCCATCACGCCACAGTTTC”. All of these primers were synthesized by Tsingke (Beijing, China). With GAPDH as an internal control, the relative expression of the three feature mRNAs was measured with the 2-ΔΔCt method. For the statistical analysis, GraphPad Prism V6 (GraphPad Software, La Jolla, USA) was used. Student’s unpaired t tests with P < 0.05 were applied to compare the two groups.
2.8. Gene set enrichment analysis (GSEA)
To uncover the hidden functions of the feature genes, GSEA software (version 4.4.3) was used. Analyzes were conducted on two subsets of the Molecular Signatures Database (MSigDB), c5.go.bp.v7.4.symbols.gmt for GO and c2.cp.kegg.v7.4.symbols.gmt for KEGG. The MSigDB is available at https://www.gsea-msigdb.org/gsea/msigdb/index.jsp. The Pearson correlation of each feature gene and each gene from the subsets was calculated, and the coefficient was acquired. Subsequently, all genes were sorted in descending order by coefficients (without taking absolute values). The above genes from the subsets were used as background genes for enrichment analysis. Worthy terms/pathways were ascertained by |Normalized Enrichment Score| ≥ 1 and P < 0.05.
2.9. Evaluation of immune cell abundance in IMNM
The abundance of 28 immune cell types in IMNM patients and controls was appraised by single-sample gene set enrichment analysis (ssGSEA) [19] using the R package GSVA. The differences in immune cell abundances between normal and IMNM populations were compared by the Wilcoxon rank-sum test (P < 0.05). Pearson correlation was applied to evaluate the relationships among the 28 immune cells and feature genes.
3. Results
3.1. Identification of IMNM-related module genes
To establish a scale-free coexpression network and detect candidate IMNM-related module genes, the R package WGCNA was performed on the local cohort. A soft threshold of β = 3 aligned the network infinitely with the scale-free distribution criterion (R2 = 0.85; Fig. 2A). A hybrid dynamic cutting tree algorithm yielded 14 gene modules, and after module amalgamation, seven gene modules were identified (Fig. 2B). Next, the association between each module and the disease was estimated by mapping a Pearson correlation heatmap. The turquoise module showed the strongest association with IMNM (cor = 0.76, P = 2e-06) (Fig. 2C) and was therefore considered to be an IMNM-related module. Furthermore, 1079 genes in the turquoise module were considered IMNM-related module genes as per |MM = greater than 0.8 and |GS = greater than 0.2 (Fig. 2D).
Fig. 2.

Weighted coexpression network analysis. (A) Soft-thresholding power calculation. The red line shows a correlation coefficient of 0.85 and a soft-thresholding power of three. The horizontal axes represent the power values of the weight parameters. The vertical axis of the left panel represents Scale Free Topology Model Fit (left), namely, the signed R^2; the higher the square of the coefficients, the more closely the network approximates a scale-free distribution. The vertical axis of the right panel represents the mean of all gene adjacency functions in the corresponding gene module. (B) The cluster dendrogram of the genes based on module eigengenes. Each branch represents one gene, and each color at the bottom represents one coexpression module. (C) Clinical phenotype and module gene correlation analysis. The vertical axis represents the different modules, and the horizontal axis represents the clinical phenotypes. The turquoise module was significantly correlated with IMNM. (D) Scatter plot showing the correlation between turquoise module genes and clinical phenotypes. A total of 1079 genes were associated with IMNM.
3.2. Identification and functional analysis of IMNM-related DEGs
To confirm DEGs between IMNM muscles and healthy controls, differential expression analysis was carried out, and 1024 DEGs, including 674 upregulated genes and 350 downregulated genes, were identified in IMNM (Fig. 3A). In Fig. 3B, a total of 193 upregulated genes fall in the overlap between the IMNM-related module genes and the 1024 DEGs, defined as IMNM-related DEGs. The biological pathways associated with IMNM-related DEGs were investigated using GO and KEGG enrichment analyses. The GO results showed that these genes were mainly involved in immune-inflammatory responses (e.g., inflammatory response, neutrophil degranulation, chemotaxis, complement binding and regulation of the TGF-β (transforming growth factor beta receptor) signaling pathway), lipoprotein metabolism (e.g., high-density lipoprotein particle remodeling and assembly), and regulation of muscle contraction (e.g., muscle filament sliding, actin filament binding, microfilament motor activity, and myosin phosphatase activity). The KEGG results suggested that these genes were mainly engaged in the regulation of muscle contraction and the IL-17 signaling pathway (Fig. 3C).
Fig. 3.

IMNM-related DEG screening and functional enrichment analysis. (A) A volcano plot showing DEGs between IMNM muscles and healthy controls. The red spots indicate upregulated genes, whereas the blue spots indicate downregulated genes. (B) Venn diagram showing the intersecting genes between the turquoise module and DEGs, which are defined as crucial IMNM-related DEGs. (C) GO terms and KEGG functional enrichment analysis of crucial IMNM-related DEGs.
3.3. Identification of IMNM-related feature genes via machine learning
The STRING online tool was further applied to construct a PPI network among the 193 IMNM-related DEGs. By removing discrete proteins, Cytoscape software visualized a network of 96 pairs of protein interactions with 75 nodes (Fig. 4). To identify biomarkers that differentiated IMNM samples from controls, two computer-learning algorithms, namely, LASSO and SVM-RFE, were used. Under tenfold cross-validation, LASSO regression analysis narrowed down four candidate feature genes to LTK, MYBPH, MYL4, and MYMK (Fig. 5A–B). Moreover, in the SVM-RFE model, 5-fold cross-validation revealed that LTK, MYBPH, and MYL4 had high accuracy (accuracy = 0.973) and a low error rate (error rate = 0.027) (Fig. 5C–D). Three common feature genes (LTK, MYBPH, and MYL4) were identified from the intersection of the LASSO and SVM/RFE models (Fig. 5E). Furthermore, to evaluate the diagnostic value of the three feature genes, ROC curve analysis was applied. All genes were able to accurately distinguish between normal and IMNM samples with an area under the curve (AUC) = 1.00 (Fig. 5F–H). In addition, the expression levels and diagnostic values of the three feature genes in other IIMs, including dermatomyositis (DM), inclusion body myositis (IBM) and polymyositis (PM), were also evaluated using the GSE128470 dataset (Fig. 6). A statistically significant difference was observed only in MYBPH expression among DM, PM, and IBM samples, whereas LTK and MYL4 expression was not different between the groups (Fig. 6A). Furthermore, MYBPH was the only diagnostically significant gene with an AUC > 0.85 in DM, PM, and IBM (Fig. 6B).
Fig. 4.

PPI network of 193 IMNM-related DEGs.
Fig. 5.

Screening of feature genes. (A-B) Four candidate feature genes screened by LASSO regression analysis in 10-fold cross validations. (C-D) Three candidate feature genes screened by the SVM-RFE algorithm with maximal accuracy = 0.973 and minimal error = 0.027. (E) Three feature genes obtained from the LASSO and SVM-RFE algorithms. (F–H) ROC curve analysis of LTK (F), MYBPH (G) and MYL4 (H) to evaluate their diagnostic efficiency in IMNM.
Fig. 6.

Evaluation of the expression and diagnostic value of feature genes in DM, IBM and PM. (A) The expression of three feature genes among DM, IBM and PM in the GSE128470 dataset. (B) ROC analysis of the three feature genes individually and the gene-based diagnostic model in DM, IBM, and PM. **p < 0.01; ****p < 0.0001; NS, nonsignificance. DM, dermatomyositis; IBM, inclusion body myositis; PM, polymyositis; NL, normal.
3.4. Verification of feature gene expression levels through qRT—PCR
To confirm the authenticity of the feature genes, 18 muscle samples from IMNM patients and 10 muscle samples from normal subjects were selected for qRT—PCR. Consistent with the sequencing analysis, LTK, MYBPH, and MYL4 were significantly upregulated in IMNM patients compared with controls (P < 0.0001) (Fig. 7A). The patients with IMNM were then divided into three subgroups based on the type of autoantibodies they had. As expected, LTK, MYBPH, and MYL4 were all significantly upregulated in different subgroups compared to controls (Fig. 7B).
Fig. 7.

The expression of feature genes in IMNM and its subgroups. (A) The expression of LTK, MYBPH and MYL4 in IMNM patients (n = 18) compared to controls (n = 10) by qRT—PCR. (B) The expression of LTK, MYBPH and MYL4 in different subgroups of IMNM patients. *p < 0.05; **p < 0.01; ***p < 0.001; ****p < 0.0001.
3.5. Identifying signaling pathways associated with feature genes through GSEA
To exploit the latent biological functions of the feature genes in IMNM progression, a predefined gene set enrichment analysis was applied based on GSEA software. Fig. 8 shows that the GO-BP and KEGG pathways were most strongly positively and negatively correlated with LTK, MYBPH, and MYL4, respectively. In the GO-BP system, the three feature genes were positively connected with the B-cell apoptosis process but negatively interrelated with the regulation of cellular transduction (Fig. 8A–C). In the KEGG gene set, all three genes were associated with the autophagy—lysosome pathway (Fig. 8D–F).
Fig. 8.

Enrichment plots from GSEA. (A–C) GO-BP entries most positively and negatively linked to LTK (A), MYBPH (B) and MYL4 (C). (D–E) KEGG entries most positively and negatively linked to LTK (D), MYBPH (E) and MYL4 (F). The green line represents the running enrichment scores for the feature gene, the middle part shows where the feature gene appears in the ranked list, and the bottom part shows the ranking metric value as it moves down the list.
3.6. Linkage of feature genes to the immune landscape in IMNM
According to our functional enrichment analysis of IMNM-related DEGs, they were closely related to immune cell physiological processes (Fig. 3C). Therefore, we examined the abundance of 28 immune cells by ssGSEA. Significant differences in abundance were observed in 25 out of the 28 immune cells in IMNMs and controls, such as CD4 T cells, CD8 T cells, macrophages, natural killer cells, T helper cells, Th17 cells, and dendritic cells (Fig. 9A). A visibly higher immune-cell infiltrative microenvironment was observed in the IMNM population. Based on Pearson correlation analysis, the three feature genes were positively correlated with the 25 differentially abundant immune cells (Fig. 9B–D).
Fig. 9.

Immune landscape analysis associated with IMNM. (A) Twenty-eight types of immune cells compared between IMNM patients and healthy controls in the local cohort. (B-D) Pearson correlation analysis of the infiltration levels of immune cells and the three feature genes. LTK (B), MYBPH (C), and MYL4 (D). *p < 0.05; **p < 0.01; ***p < 0.001.
4. Discussion
IMNM is a subgroup of IIMs with immunological abnormalities and positive autoantibodies. Muscle weakness is frequently rapidly progressive and severe, with high levels of serum CK [2]. Failure to treat IMNMs effectively can cause severe muscle impairment and even death [2]. However, the exact pathogenesis of IMNM is unclear, and conventional treatments are limited in efficacy. In this study, through high-throughput sequencing and bioinformatics analysis of muscle biopsy samples, we identified key genes and pathways implicated in IMNM and revealed the immune infiltration landscape of IMNM.
The GO and KEGG analyses in this study indicate that IMNM-related DEGs mainly regulate inflammation and immune pathways, including the inflammatory response, chemotaxis, complement binding, regulation of TGF-β and the IL-17 signaling pathway. Other terms, such as lipoprotein metabolism and regulation of skeletal and cardiac muscle contraction, were also associated with IMNM. These terms contribute to the understanding of IMNM molecular mechanisms and suggest potential treatment targets. In IMNM patients, the complement pathway is crucial. Increased deposition of MAC and C1q is observed in muscle from IMNM patients, and the deposition positively correlates with myofiber necrosis [9]. It is believed that anti-HMGCR and anti-SRP autoantibodies on/in myofibers activate the classical complement cascade, resulting in MAC formation and fiber necrosis in IMNM patients [20], [21]. Interleukin 17 (IL-17), a family of proinflammatory cytokines, has been implicated in several autoimmune diseases, including inflammatory myopathies [22]. Patients with inflammatory myopathies have elevated serum IL-17 levels, which are significantly correlated with disease activity [22], [23]. Moreover, IL-17 mRNA is overexpressed, as shown in muscle biopsies from IIM patients [22]. Many cytokines are induced by IL-17, such as IL-6, IL-1β, tumor necrosis factor (TNF), granulocyte-macrophage colony-stimulating factor (GM-CSF), and several chemokines [22], [24], [25]. IL-17 enhances the expression of HLA class I and NF-κB and amplifies the effects of IL-1β and IL-6, causing inflammation of muscle [26]. Moreover, the activation of IL-17 inhibits urokinase type plasminogen inhibitor (uPA), thus interfering with myoblast migration and differentiation [27], [28]. In summary, IL-17 promotes muscle inflammation by upregulating cytokines and impairs muscle regeneration by inhibiting the differentiation and migration of myoblasts. Another important signaling pathway involved in muscle repair and regeneration is the TGF-β pathway, which is upregulated in cases of skeletal muscle injury. TGF-β inhibits myoblast differentiation by inhibiting satellite cell activity and induces fibrosis by controlling extracellular matrix synthesis, remodeling, and degradation [29]. Many inherited and acquired myopathies are associated with a dysfunctional TGF-β pathway [30]. Knockdown of TGF-β causes significant improvement in muscle regeneration and reduces fibrosis development [31], [32]. Taken together, these findings suggest that complement cascades, the IL-17 pathway and the TGF-β pathway may all contribute to IMNM development, thus offering potential treatment targets.
With the aid of LASSO and SVM algorithms, combined with qRT—PCR experiments, we finally identified three feature genes: MYBPH, LTK and MYL4. They were highly expressed in IMNM samples and were enriched in the GO pathways immune-inflammatory pathway and regulation of cellular transduction. KEGG functions were mostly enriched in the autophagy—lysosome pathway. Myosin binding protein H (MYBPH), an important member of the MyBP family, is expressed in fast skeletal and cardiac myocytes. MYBPH is very similar to cardiac myosin binding protein C (cMyBPC) in structure and function [33]. By interacting with myosin, MYBPH and cMyBPC drive cardiac contraction. Concurrent knockdown of both MYBPH and cMyBPC impairs heart contraction under stress induced by β-adrenergic receptors [34]. The expression of MYBPH in fast skeletal muscles suggests that it may also influence skeletal muscle contractility. Indeed, MYBPH proteins were largely highly expressed in animal models of critical myopathy and amyotrophic lateral sclerosis patients [35], [36]. Interestingly, it has been shown that the autophagosomal membrane protein LC3 colocalizes with MYBPH and cMyBPC proteins [34]. Inhibition of cMyBPC impairs autophagy [37], suggesting that these proteins are crucial to the autophagy process. IMNM patients have been reported to have an activated autophagy-related pathway, which accumulates LC3 and p62 in regenerating and degenerating myofibers [8]. Upregulation of MYBPH in IMNM may be related to autophagy activation. Myosin light chain 4 (MYL4), which is highly expressed in embryonic muscle, is downregulated with development and re-expressed during muscle regeneration [38]. Despite its unclear function, this protein participates in muscle development. High expression of MYL4 in IMNM patients may indicate a high rate of muscle regeneration after muscle damage. Interestingly, MYBPH and MYL4 are both critical to cardiac fiber contraction, with MYBPH being implicated in hypertrophic cardiomyopathy and MYL4 expression being altered in various heart disease, such as congestive heart failure [39], [40], [41]. Large amount of evidence shows that cardiac involvement is often seen in IMNM, manifested in the form of arrhythmia, congestive heart failure, or other symptoms [42], [43]. Endomyocardial biopsies in IMNM patients also revealed myocardial fiber necrosis and infiltration of CD68 positive macrophages [43]. Thus, the abnormal expression of MYL4 and MYBPH may contribute to cardiac involvement in IMNM patients. Further studies in this area may provide a better understanding of IMNM with cardiac involvement. Leukocyte tyrosine kinase (LTK) is a receptor-type enzyme of the insulin receptor family [44]. It localizes to the endoplasmic reticulum (ER) and regulates ER-to-Golgi export. Attenuating the expression of LTK pharmacologically resulted in a marked reduction of ER-to-Golgi transport and an increase in the ER stress response, suggesting that LTK may regulate ER proteostasis [45]. Furthermore, ER stress-induced autophagy pathway was activated among IMNM patients and correlated with disease activity [46]. In addition, a report has shown that LTK is expressed in B lymphocyte precursor cells [47]. Gain-of-function polymorphism of LTK has been associated with systemic lupus erythematosus (SLE) pathogenesis by upregulation of phosphoinositide 3-kinase (PI3K) pathway and activation of self-reactive B cells [47]. The upregulation of LTK expression in IMNM may exacerbate the disease by disrupting ER transport and activating self-reactive B cells. In addition, we evaluated the expression levels and diagnostic values of the three feature genes in DM, IBM and PM. The diagnostic efficiency of MYBPH in DM, PM and IBM was inferior to that of IMNM numerically, suggesting that MYBPH might play a similar role in other inflammatory myopathies, but may be more specifically in IMNM, which requires more datasets and in vivo studies for further evaluation. The diagnostic efficacy of LTK and MYL4 in these diseases was poor, indicating that both are highly specific biomarkers and play unique roles in IMNM. In spite of the fact that there are only a few studies investigating the role of these key genes in IMNM, our GSEA functional enrichment analyses revealed that they were all enriched in the autophagy—lysosome pathway. In support of our findings, the autophagy biomarkers p62 and LC3 were significantly expressed in the muscle tissue of IMNM patients, and autophagy- and ER stress-related genes were also more highly expressed in IMNM [7], [8]. Therefore, these key genes are likely to be involved in IMNM progression by modulating the autophagy—lysosome pathway. These findings suggest potential therapeutic targets for IMNM. Developing inhibitors against these new targets could be a new treatment avenue for IMNM.
The research above showed a close relationship between IMNM-related DEGs and immune-inflammatory pathways. ssGSEA was applied for the first time to examine the infiltration of 28 types of immune cells in patients with IMNM. IMNM tissues had significantly higher levels of CD4 T cells, CD8 T cells, macrophages, natural killer cells, Th17 cells, T helper cells and dendritic cells. CD4 T cells can differentiate into Th1, Th2 and Th17 cells [48]. Previous studies have demonstrated that a significant number of CD4 and CD8 T cells accumulate in the endomysium and perimysium of IMNM muscles, and several types of macrophages accumulate in the endomysium [49], [50]. In addition, IMNM patients exhibit strong activation of the Th1-macrophage pathway [50]. Activation of macrophages in IMNM muscles promotes angiogenesis and myogenesis, which are vital for IMNM progression [51]. Furthermore, abnormal activation of Th17 cells, which produce high levels of IL-17, plays an essential role in IIM [22]. It appears that disrupted T-cell immunity is crucial for IMNM progression, and these results suggest potential new treatments. In addition, the three feature genes were positively correlated with increased immune infiltration. However, we speculate this correlation does not imply a direct induction of immune cell infiltration by these genes. It is possible that these genes indirectly indicate the enhancement of immune infiltration. MYBPH and MYL4 encode proteins that are components of the skeletal muscle sarcomeric filament [36], [38]. Since prominent fiber necrosis and regeneration are the pathological features of IMNM [2], we speculate that upregulation of MYBPH and MYL4 expression may indicate enhanced regenerative responses in muscle homeostasis. Simultaneously, significant muscle fiber necrosis can trigger the activation of cytokines and immune cells and the infiltration of inflammatory cells [52]. Therefore, muscle fiber necrosis can both lead to compensatory muscle fiber regeneration and induce inflammatory cell infiltration, showing a positive correlation between these genes and inflammatory cell infiltration.
However, this study has some limitations. First, the bioinformatics analysis results were simply verified in experimental studies using qRT—PCR, and a more comprehensive study of these hub genes is needed to confirm our estimates. Second, this study only compared IMNM to normal controls, and a future study comparing IMNM to other subtypes of IIM would help identify genes/pathways uniquely associated with IMNM and facilitate therapeutic targeting in the future.
5. Conclusions
Collectively, our high-throughput sequencing and bioinformatics analysis results suggest that three feature genes (LTK, MYBPH, and MYL4) are closely related to IMNM, and they are suspected to be involved in the autophagy—lysosome pathway and activation of muscular inflammation. This study is the first to demonstrate the molecular mechanisms involved in the pathogenesis of IMNM and to investigate the immune infiltration landscape in IMNM using bioinformatics methods.
Ethics Approval and Informed Consent
The study was approved by the Ethics Committee of Sichuan Provincial People’s Hospital (approval no.: 2021-292). Written informed consents to participate in this study were signed by all the subjects.
Funding
Funding for this work was provided by the National Natural Science Foundation of China under Grant no. 81801270, Sichuan Province Science and Technology Support Program 2020JDJQ0067, and by the Sichuan Provincial People's Hospital under Grant no. 2017QN12.
Author statement
This is to state that all authors have read and approved the changes made to the manuscript.
Declaration of Competing Interest
The authors declare the following financial interests/personal relationships which may be considered as potential competing interests: Li Zeng reports article publishing charges was provided by National Natural Science Foundation of China. Qiao Zhou reports writing assistance was provided by Sichuan Science and Technology Bureau. Li Zeng reports a relationship with Chengdu Digidite Group Company that includes: non-financial support.
Acknowledgments
The authors are grateful to Chang Liu, Chengdu Digidite Group Company, for his technical support in R.
Data Sharing Statement
The study's original contributions are publicly available. Data can be found here: National Center for Biotechnology (NCBI) Gene Expression Omnibus (GEO), https://www.ncbi.nlm.nih.gov/geo/query/acc.cgi?acc=GSE213055 (GSE213055). The GSE128470 dataset were also analyzed in this study.
Disclosure
The author reports no conflicts of interest in this work.
Footnotes
Supplementary data associated with this article can be found in the online version at doi:10.1016/j.csbj.2023.03.019.
Contributor Information
Qiao Zhou, Email: 22922934@qq.com.
Li Zeng, Email: zengli@med.uestc.edu.cn.
Appendix A. Supplementary material
Supplementary material
Supplementary material
References
- 1.Hoogendijk J.E., Amato A.A., Lecky B.R., Choy E.H., Lundberg I.E., Rose M.R., et al. 119th Enmc international workshop: trial design in adult idiopathic inflammatory myopathies, with the exception of inclusion body myositis, 10–12 october 2003, Naarden, the Netherlands. Neuromuscul Disord. 2004;14(5):337–345. doi: 10.1016/j.nmd.2004.02.006. [Epub 2004/04/22] [DOI] [PubMed] [Google Scholar]
- 2.Allenbach Y., Benveniste O., Stenzel W., Boyer O. Immune-mediated necrotizing myopathy: clinical features and pathogenesis. Nat Rev Rheumatol. 2020;16(12):689–701. doi: 10.1038/s41584-020-00515-9. [Epub 2020/10/24] [DOI] [PubMed] [Google Scholar]
- 3.Klein M., Mann H., Plestilova L., Zamecnik J., Betteridge Z., McHugh N., et al. Increasing incidence of immune-mediated necrotizing myopathy: single-centre experience. Rheumatology. 2015;54(11):2010–2014. doi: 10.1093/rheumatology/kev229. [Epub 2015/06/26] [DOI] [PubMed] [Google Scholar]
- 4.Kassardjian C.D., Lennon V.A., Alfugham N.B., Mahler M., Milone M. Clinical features and treatment outcomes of necrotizing autoimmune myopathy. JAMA Neurol. 2015;72(9):996–1003. doi: 10.1001/jamaneurol.2015.1207. [Epub 2015/07/21] [DOI] [PubMed] [Google Scholar]
- 5.Lim J., Rietveld A., De Bleecker J.L., Badrising U.A., Saris C.G.J., van der Kooi A.J., et al. Seronegative patients form a distinctive subgroup of immune-mediated necrotizing myopathy. Neurol Neuroimmunol Neuroinflamm. 2019;6(1) doi: 10.1212/NXI.0000000000000513. [Epub 2018/10/23] [DOI] [PMC free article] [PubMed] [Google Scholar]
- 6.Allenbach Y., Mammen A.L., Benveniste O., Stenzel W., Immune-Mediated Necrotizing Myopathies Working G. 224th Enmc international workshop:: clinico-sero-pathological classification of immune-mediated necrotizing myopathies Zandvoort, the Netherlands, 14–16 October 2016. Neuromuscul Disord. 2018;28(1):87–99. doi: 10.1016/j.nmd.2017.09.016. [Epub 2017/12/10] [DOI] [PubMed] [Google Scholar]
- 7.Fischer N., Preusse C., Radke J., Pehl D., Allenbach Y., Schneider U., et al. Sequestosome-1 (P62) expression reveals chaperone-assisted selective autophagy in immune-mediated necrotizing myopathies. Brain Pathol. 2020;30(2):261–271. doi: 10.1111/bpa.12772. [Epub 2019/08/04] [DOI] [PMC free article] [PubMed] [Google Scholar]
- 8.Girolamo F., Lia A., Annese T., Giannini M., Amati A., D'Abbicco D., et al. Autophagy markers Lc3 and P62 accumulate in immune-mediated necrotizing myopathy. Muscle Nerve. 2019;60(3):315–327. doi: 10.1002/mus.26608. [Epub 2019/06/07] [DOI] [PubMed] [Google Scholar]
- 9.Allenbach Y., Arouche-Delaperche L., Preusse C., Radbruch H., Butler-Browne G., Champtiaux N., et al. Necrosis in anti-Srp(+) and anti-Hmgcr(+)myopathies: role of autoantibodies and complement. Neurology. 2018;90(6):e507–e517. doi: 10.1212/WNL.0000000000004923. [Epub 2018/01/14] [DOI] [PubMed] [Google Scholar]
- 10.Xia M.D., Yu R.R., Chen D.M. Identification of hub biomarkers and immune-related pathways participating in the progression of antineutrophil cytoplasmic antibody-associated glomerulonephritis. Front Immunol. 2021;12 doi: 10.3389/fimmu.2021.809325. [Epub 2022/01/25] [DOI] [PMC free article] [PubMed] [Google Scholar]
- 11.Xie Y., Li Y.H., Chen K., Zhu C.Y., Bai J.Y., Xiao F., et al. Key biomarkers and latent pathways of dysferlinopathy: bioinformatics analysis and in vivo validation. Front Neurol. 2022;13 doi: 10.3389/fneur.2022.998251. [Epub 2022/10/08] [DOI] [PMC free article] [PubMed] [Google Scholar]
- 12.Huang M.L., Hung Y.H., Lee W.M., Li R.K., Jiang B.R. Svm-Rfe based feature selection and Taguchi parameters optimization for multiclass svm classifier. ScientificWorldJournal. 2014;2014 doi: 10.1155/2014/795624. [Epub 2014/10/09] [DOI] [PMC free article] [PubMed] [Google Scholar]
- 13.Zhang Y., Xia R., Lv M., Li Z., Jin L., Chen X., et al. Machine-learning algorithm-based prediction of diagnostic gene biomarkers related to immune infiltration in patients with chronic obstructive pulmonary disease. Front Immunol. 2022;13 doi: 10.3389/fimmu.2022.740513. [Epub 2022/03/31] [DOI] [PMC free article] [PubMed] [Google Scholar]
- 14.Langfelder P., Horvath S. Wgcna: an R package for weighted correlation network analysis. BMC Bioinform. 2008;9:559. doi: 10.1186/1471-2105-9-559. [Epub 2008/12/31] [DOI] [PMC free article] [PubMed] [Google Scholar]
- 15.Yuan L., Zeng G., Chen L., Wang G., Wang X., Cao X., et al. Identification of key genes and pathways in human clear cell renal cell carcinoma (Ccrcc) by co-expression analysis. Int J Biol Sci. 2018;14(3):266–279. doi: 10.7150/ijbs.23574. [Epub 2018/03/22] [DOI] [PMC free article] [PubMed] [Google Scholar]
- 16.Robinson M.D., McCarthy D.J., Smyth G.K. Edger: a bioconductor package for differential expression analysis of digital gene expression data. Bioinformatics. 2010;26(1):139–140. doi: 10.1093/bioinformatics/btp616. [Epub 2009/11/17] [DOI] [PMC free article] [PubMed] [Google Scholar]
- 17.Bardou P., Mariette J., Escudie F., Djemiel C., Klopp C. Jvenn: an interactive venn diagram viewer. BMC Bioinform. 2014;15:293. doi: 10.1186/1471-2105-15-293. [Epub 2014/09/02] [DOI] [PMC free article] [PubMed] [Google Scholar]
- 18.Dennis G., Jr., Sherman B.T., Hosack D.A., Yang J., Gao W., Lane H.C., et al. David: database for annotation, visualization, and integrated discovery. Genome Biol. 2003;4(5):P3. [Epub 2003/05/08] [PubMed] [Google Scholar]
- 19.Bindea G., Mlecnik B., Tosolini M., Kirilovsky A., Waldner M., Obenauf A.C., et al. Spatiotemporal dynamics of intratumoral immune cells reveal the immune landscape in human cancer. Immunity. 2013;39(4):782–795. doi: 10.1016/j.immuni.2013.10.003. [Epub 2013/10/22] [DOI] [PubMed] [Google Scholar]
- 20.Benveniste O., Drouot L., Jouen F., Charuel J.L., Bloch-Queyrat C., Behin A., et al. Correlation of anti-signal recognition particle autoantibody levels with creatine kinase activity in patients with necrotizing myopathy. Arthritis Rheumatol. 2011;63(7):1961–1971. doi: 10.1002/art.30344. [Epub 2011/03/15] [DOI] [PubMed] [Google Scholar]
- 21.Drouot L., Allenbach Y., Jouen F., Charuel J.L., Martinet J., Meyer A., et al. Exploring necrotizing autoimmune myopathies with a novel immunoassay for anti-3-hydroxy-3-methyl-glutaryl-Coa reductase autoantibodies. Arthritis Res Ther. 2014;16(1):R39. doi: 10.1186/ar4468. [Epub 2014/02/04] [DOI] [PMC free article] [PubMed] [Google Scholar]
- 22.Moran E.M., Mastaglia F.L. The role of interleukin-17 in immune-mediated inflammatory myopathies and possible therapeutic implications. Neuromuscul Disord. 2014;24(11):943–952. doi: 10.1016/j.nmd.2014.06.432. [Epub 2014/07/24] [DOI] [PubMed] [Google Scholar]
- 23.Szodoray P., Alex P., Knowlton N., Centola M., Dozmorov I., Csipo I., et al. Idiopathic inflammatory myopathies, signified by distinctive peripheral cytokines, chemokines and the Tnf family members B-cell activating factor and a proliferation inducing ligand. Rheumatology. 2010;49(10):1867–1877. doi: 10.1093/rheumatology/keq151. [Epub 2010/07/02] [DOI] [PMC free article] [PubMed] [Google Scholar]
- 24.Liang S.C., Tan X.Y., Luxenberg D.P., Karim R., Dunussi-Joannopoulos K., Collins M., et al. Interleukin (Il)-22 and Il-17 are coexpressed by Th17 cells and cooperatively enhance expression of antimicrobial peptides. J Exp Med. 2006;203(10):2271–2279. doi: 10.1084/jem.20061308. [Epub 2006/09/20] [DOI] [PMC free article] [PubMed] [Google Scholar]
- 25.Ouyang W., Kolls J.K., Zheng Y. The biological functions of T helper 17 cell effector cytokines in inflammation. Immunity. 2008;28(4):454–467. doi: 10.1016/j.immuni.2008.03.004. [Epub 2008/04/11] [DOI] [PMC free article] [PubMed] [Google Scholar]
- 26.Chevrel G., Page G., Granet C., Streichenberger N., Varennes A., Miossec P. Interleukin-17 increases the effects of Il-1 beta on muscle cells: arguments for the role of T cells in the pathogenesis of myositis. J Neuroimmunol. 2003;137(1–2):125–133. doi: 10.1016/s0165-5728(03)00032-8. [Epub 2003/04/02] [DOI] [PubMed] [Google Scholar]
- 27.Kocic J., Santibanez J.F., Krstic A., Mojsilovic S., Dordevic I.O., Trivanovic D., et al. Interleukin 17 inhibits myogenic and promotes osteogenic differentiation of C2c12 myoblasts by activating Erk1,2. Biochim Biophys Acta. 2012;1823(4):838–849. doi: 10.1016/j.bbamcr.2012.01.001. [Epub 2012/01/31] [DOI] [PubMed] [Google Scholar]
- 28.Kocic J., Santibanez J.F., Krstic A., Mojsilovic S., Ilic V., Bugarski D. Interleukin-17 modulates myoblast cell migration by inhibiting urokinase type plasminogen activator expression through P38 mitogen-activated protein kinase. Int J Biochem Cell Biol. 2013;45(2):464–475. doi: 10.1016/j.biocel.2012.11.010. [Epub 2012/11/28] [DOI] [PubMed] [Google Scholar]
- 29.Delaney K., Kasprzycka P., Ciemerych M.A., Zimowska M. The role of Tgf-Beta1 during skeletal muscle regeneration. Cell Biol Int. 2017;41(7):706–715. doi: 10.1002/cbin.10725. [Epub 2016/12/31] [DOI] [PubMed] [Google Scholar]
- 30.Burks T.N., Cohn R.D. Role of Tgf-beta signaling in inherited and acquired myopathies. Skelet Muscle. 2011;1(1):19. doi: 10.1186/2044-5040-1-19. [Epub 2011/07/30] [DOI] [PMC free article] [PubMed] [Google Scholar]
- 31.Zimowska M., Duchesnay A., Dragun P., Oberbek A., Moraczewski J., Martelly I. Immunoneutralization of Tgfbeta1 improves skeletal muscle regeneration: effects on myoblast differentiation and glycosaminoglycan content. Int J Cell Biol. 2009;2009 doi: 10.1155/2009/659372. [Epub 2010/01/30] [DOI] [PMC free article] [PubMed] [Google Scholar]
- 32.Yousef H., Conboy M.J., Morgenthaler A., Schlesinger C., Bugaj L., Paliwal P., et al. Systemic attenuation of the Tgf-Beta pathway by a single drug simultaneously rejuvenates hippocampal neurogenesis and myogenesis in the same old mammal. Oncotarget. 2015;6(14):11959–11978. doi: 10.18632/oncotarget.3851. [Epub 2015/05/25] [DOI] [PMC free article] [PubMed] [Google Scholar]
- 33.Vaughan K.T., Weber F.E., Einheber S., Fischman D.A. Molecular cloning of chicken myosin-binding protein (Mybp) H (86-Kda protein) reveals extensive homology with Mybp-C (C-Protein) with conserved immunoglobulin C2 and fibronectin type iii motifs. J Biol Chem. 1993;268(5):3670–3676. [Epub 1993/02/15] [PubMed] [Google Scholar]
- 34.Mouton J., Loos B., Moolman-Smook J.C., Kinnear C.J. Ascribing novel functions to the sarcomeric protein, myosin binding protein H (MYBPH) in cardiac sarcomere contraction. Exp Cell Res. 2015;331(2):338–351. doi: 10.1016/j.yexcr.2014.11.006. [Epub 2014/12/03] [DOI] [PubMed] [Google Scholar]
- 35.Norman H., Nordquist J., Andersson P., Ansved T., Tang X., Dworkin B., et al. Impact of post-synaptic block of neuromuscular transmission, muscle unloading and mechanical ventilation on skeletal muscle protein and Mrna expression. Pflug Arch. 2006;453(1):53–66. doi: 10.1007/s00424-006-0110-5. [Epub 2006/07/27] [DOI] [PubMed] [Google Scholar]
- 36.Conti A., Riva N., Pesca M., Iannaccone S., Cannistraci C.V., Corbo M., et al. Increased expression of myosin binding protein H in the skeletal muscle of amyotrophic lateral sclerosis patients. Biochim Biophys Acta. 2014;1842(1):99–106. doi: 10.1016/j.bbadis.2013.10.013. [Epub 2013/11/05] [DOI] [PubMed] [Google Scholar]
- 37.Schlossarek S., Englmann D.R., Sultan K.R., Sauer M., Eschenhagen T., Carrier L. Defective proteolytic systems in Mybpc3-targeted mice with cardiac hypertrophy. Basic Res Cardiol. 2012;107(1):235. doi: 10.1007/s00395-011-0235-3. [Epub 2011/12/23] [DOI] [PubMed] [Google Scholar]
- 38.Hu Z., Cao J., Ge L., Zhang J., Zhang H., Liu X. Characterization and comparative transcriptomic analysis of skeletal muscle in pekin duck at different growth stages using Rna-Seq. Animals. 2021;11(3) doi: 10.3390/ani11030834. [Epub 2021/04/04] [DOI] [PMC free article] [PubMed] [Google Scholar]
- 39.Mouton J.M., van der Merwe L., Goosen A., Revera M., Brink P.A., Moolman-Smook J.C., et al. MYBPH acts as modifier of cardiac hypertrophy in hypertrophic cardiomyopathy (Hcm) patients. Hum Genet. 2016;135(5):477–483. doi: 10.1007/s00439-016-1649-7. [Epub 2016/03/13] [DOI] [PubMed] [Google Scholar]
- 40.Peng W., Li M., Li H., Tang K., Zhuang J., Zhang J., et al. Dysfunction of myosin light-chain 4 (Myl4) leads to heritable atrial cardiomyopathy with electrical, contractile, and structural components: evidence from genetically-engineered rats. J Am Heart Assoc. 2017;6(11) doi: 10.1161/JAHA.117.007030. [Epub 2017/10/31] [DOI] [PMC free article] [PubMed] [Google Scholar]
- 41.Zhu L., Wang W., Ren C., Wang Y., Zhang G., Liu J., et al. Cellular phenotypic transformation in heart failure caused by coronary heart disease and dilated cardiomyopathy: delineating at single-cell level. Biomedicines. 2022;10(2) doi: 10.3390/biomedicines10020402. [Epub 2022/02/26] [DOI] [PMC free article] [PubMed] [Google Scholar]
- 42.Ghannam M., Manousakis G. Case report: immune mediated necrotizing myopathy with igg antibodies to 3-hydroxy-3-methylglutaryl-coenzyme a reductase (Hmgcr) may present with acute systolic heart failure. Front Neurol. 2020;11 doi: 10.3389/fneur.2020.571716. [Epub 2020/12/17] [DOI] [PMC free article] [PubMed] [Google Scholar]
- 43.Polte C.L., Bergh N., Oldfors A., Hanna B., Bollano E. Cardiac involvement in immune-mediated necrotizing myopathy: insights from cmr and somatostatin receptor Pet/Ct. Eur Heart J Cardiovasc Imaging. 2022;23(5) doi: 10.1093/ehjci/jeab262. [Epub 2021/12/18] [DOI] [PubMed] [Google Scholar]
- 44.Farhan H. Tyrosine kinase signaling in and on the endoplasmic reticulum. Biochem Soc Trans. 2020;48(1):199–205. doi: 10.1042/BST20190543. [Epub 2020/02/18] [DOI] [PubMed] [Google Scholar]
- 45.Centonze F.G., Reiterer V., Nalbach K., Saito K., Pawlowski K., Behrends C., et al. Ltk is an Er-resident receptor tyrosine kinase that regulates secretion. J Cell Biol. 2019;218(8):2470–2480. doi: 10.1083/jcb.201903068. [Epub 2019/06/23] [DOI] [PMC free article] [PubMed] [Google Scholar]
- 46.Ma X., Gao H.J., Zhang Q., Yang M.G., Bi Z.J., Ji S.Q., et al. Endoplasmic reticulum stress is involved in muscular pathogenesis in idiopathic inflammatory myopathies. Front Cell Dev Biol. 2022;10 doi: 10.3389/fcell.2022.791986. [Epub 2022/03/04] [DOI] [PMC free article] [PubMed] [Google Scholar]
- 47.Li N., Nakamura K., Jiang Y., Tsurui H., Matsuoka S., Abe M., et al. Gain-of-function polymorphism in mouse and human Ltk: implications for the pathogenesis of systemic lupus erythematosus. Hum Mol Genet. 2004;13(2):171–179. doi: 10.1093/hmg/ddh020. [Epub 2003/12/26] [DOI] [PubMed] [Google Scholar]
- 48.Park H., Li Z., Yang X.O., Chang S.H., Nurieva R., Wang Y.H., et al. A distinct lineage of Cd4 T Cells regulates tissue inflammation by producing interleukin 17. Nat Immunol. 2005;6(11):1133–1141. doi: 10.1038/ni1261. [Epub 2005/10/04] [DOI] [PMC free article] [PubMed] [Google Scholar]
- 49.Wang Q., Li Y., Ji S., Feng F., Bu B. Immunopathological characterization of muscle biopsy samples from immune-mediated necrotizing myopathy patients. Med Sci Monit. 2018;24:2189–2196. doi: 10.12659/msm.907380. [Epub 2018/04/13] [DOI] [PMC free article] [PubMed] [Google Scholar]
- 50.Preusse C., Goebel H.H., Held J., Wengert O., Scheibe F., Irlbacher K., et al. Immune-mediated necrotizing myopathy is characterized by a specific Th1-M1 polarized immune profile. Am J Pathol. 2012;181(6):2161–2171. doi: 10.1016/j.ajpath.2012.08.033. [Epub 2012/10/13] [DOI] [PubMed] [Google Scholar]
- 51.Lia A., Annese T., Fornaro M., Giannini M., D'Abbicco D., Errede M., et al. Perivascular and endomysial macrophages expressing Vegf and Cxcl12 promote angiogenesis in anti-Hmgcr immune-mediated necrotizing myopathy. Rheumatology. 2021 doi: 10.1093/rheumatology/keab900. [Epub 2021/12/06] [DOI] [PubMed] [Google Scholar]
- 52.Tidball J.G. Inflammatory processes in muscle injury and repair. Am J Physiol Regul Integr Comp Physiol. 2005;288(2):R345–R353. doi: 10.1152/ajpregu.00454.2004. [Epub 2005/01/08] [DOI] [PubMed] [Google Scholar]
Associated Data
This section collects any data citations, data availability statements, or supplementary materials included in this article.
Supplementary Materials
Supplementary material
Supplementary material