

Abstract
Data-driven research led by computational systems biology methods, encompassing bioinformatics of multi-omics datasets and mathematical modeling, are critical for discovery. Herein, we describe a multi-omics (metabolomics-fluxomics) approach as applied to heart function in diabetes. The methodology presented has general applicability and enables the quantification of the fluxome or set of metabolic fluxes from cytoplasmic and mitochondrial compartments in central catabolic pathways of glucose and fatty acids. Additionally, we present, for the first time, a general method to reduce the dimension of detailed kinetic, and in general stoichiometric models of metabolic networks at the steady state, to facilitate their optimization and avoid numerical problems. Representative results illustrate the powerful mechanistic insights that can be gained from this integrative and quantitative methodology.
Keywords: Metabolomics, fluxomics, glucose and fatty acids catabolism, heart, diabetes, kinetic modeling
1. Introduction
Central catabolism constitutes the universal biochemical backbone from unicellular to multicellular organisms, prokaryotes to eukaryotes, supplying energy, redox intermediates, and key carbon precursor metabolites that, ultimately, lead to the synthesis of new cells, the maintenance of cellular structures, and the resistance to stressful conditions, among other functions. Systems biology computational methods, encompassing bioinformatic analysis and mathematical models, are critical for interpreting the mechanisms underlying the integrated, metabolic dynamics associated with organs function, within and between them [1,2]. At the organ level, heart function is a particularly challenging case because of its constantly changing dynamics. To analyze heart performance from a metabolic standpoint, herein we combine experimental and computational approaches comprising metabolomics data, bioinformatics and kinetic modeling. Using this methodological approach, we determine the fluxome or set of metabolic fluxes giving rise to the heart’s metabolome from central catabolic pathways of glucose and fatty acids degradation [2].
Specifically, the methodology presented herein represents an experimental-computational approach to integrate multi-omics data (metabolomics-fluxomics) with bioinformatic analysis and computational modeling of central catabolism. A primary goal of our procedure is to enable the translation of high throughput metabolites profile (metabolome) into the set of metabolic fluxes (fluxome) from which the metabolome emerged, as quantitatively described by a computational kinetic model [3]. Results presented here illustrate the powerful mechanistic insights that can be gained from this quantitative and integrative process.
Our approach combines an analytical platform comprising several integrated quantitative methodologies with a detailed computational kinetic model. Overall, the main advantage of our methodology of fluxomic determination over other metabolic flux balance approaches [4,5] relies on the integration with the computational model that encompasses regulatory information (e.g., effectors, feedbacks), which is crucial for nonlinear dynamic systems. Since this analytical procedure, spanning from metabolome to fluxome, is widely applicable, virtually to any kind of kinetic model, we also present a general method for reducing the dimension of detailed kinetic models of metabolic networks at the steady state, to facilitate their optimization. Heart function is an ideal prototypic system to test the usefulness of the approach proposed herein. Since the heart is constantly changing in response to energy demand, the choice of kinetic modeling is justified because it accounts for time-dependent behavior.
2. Materials
Herein, we focus on new methodological developments while briefly recapitulating some of the methods that have been described in previous volumes of this series [6,7].
2.1. Metabolite profiling and bioinformatic analyses
Biological material. Its collection for metabolomics analysis should come from a physiological steady state or pseudo steady state. Steady state refers to a condition characterized by constancy in the levels of intermediary metabolites and in the fluxes occurring through the metabolic network. It is an idealized condition for a system that, like the heart, is undergoing permanent changes in activity and organs that are known to be entrained by circadian rhythms. However, a pseudo steady state is feasible if we know that the average behavior is sustained (see Note 1).
Experimental data. Model parameters in each of the kinetic expressions, usually correspond to in vitro conditions, which can be obtained from the specialized literature and databases, such as BRENDA (https://www.brenda-enzymes.org). Metabolomics data, targeted or untargeted, represent the first step in our work-flow diagram leading to the fluxome determination (Fig. 1). Targeted metabolite profiling can inform actual metabolite concentrations and it would be the ideal data source for the analysis described here. However, untargeted metabolomics, which informs relative changes in metabolite levels, could be used for the purpose of this fluxomics method if the mass spectrometry (MS) signal can be calibrated. Sample analysis for metabolomics data can be outsourced. Empirically, a minimal size of at least 6 samples of the biological material per treatment, genotype, or physiological condition, is recommended. In Cortassa et al. [3], the authors used internal standards for calibration with enzymatic determinations (available Sigma kits) and those values used for calibration of the area under the MS peaks. Quantification according to this procedure assumes that the area under the peak is proportional to the mass of the molecular ion impacting the MS detector [7].
Experimental values of reference. The present method utilizes experimentally determined metabolite concentration as input for the model equations. However, and given the biological variability of flux values under different physiological conditions, we need “reference fluxes” that apply to the actual experimental conditions utilized, to be able to calculate with a certain degree of accuracy the internal fluxes within cells or tissues, e.g., exchange of substrates or products [2,8]. Importantly, “reference fluxes” are also necessary to diminish the size of the space of solutions of the computational model (see below).
Bioinformatics. These methods enable an initial unbiased analysis of metabolomics datasets. Untargeted metabolomics informs relative changes in metabolite levels, and these are used for bioinformatic analysis. Targeted metabolite profiling can inform actual metabolite concentrations. Alternatively, from samples utilized for untargeted metabolites profiling, the concentration of a few representative metabolites (as internal standards) can be determined and utilized to quantitate the whole dataset (see [7]).
Figure 1.

Scheme of the workflow leading from metabolite profiling to the fluxome and its control and regulation.
Reproduced from Cortassa, Caceres, Bell, O’Rourke, Paolocci, and Aon (2015) Biophys. J. 108, 163–172.
The integrated web-based platform for comprehensive analysis of metabolomics data MetaboAnalyst, versions 3.0 [9] and 4.0 [10] can be used. Individual, univariate, metabolites analysis with Prism 8.0 (GraphPad Software, San Diego, CA, USA) can be also utilized as complementary information for specific applications.
2.2. Computational tools
To build up and work with the mathematical model, Matlab®, Wolfram’s Mathematica, or any piece of software designed to solve systems of ordinary differential equations by numerical integration, is required. Some useful computational modeling packages have been developed for software such as Matlab. Among them the graphical package MatCont that enables simulation of time-dependent behavior, calculation of dynamic stability [11–13], and parameter sensitivity of the model [14].
Elementary flux modes (EFM) analysis that requires the software Metatool (e.g., version 5.1 for Matlab [15], is freely available for academic use (http://pinguin.biologie.uni-jena.de/bioinformatik/networks/metatool/metatool5.1/metatool5.1.html). Metatool enables the computation of structural properties of biochemical reaction networks while informing about the system’s capacity, as designed, to achieve a steady state or if there are missing components.
3. Methods
3.1. Metabolomics Analysis.
The relative level of metabolites and their sense of variation (i.e., up- or down-modulation) can be determined using univariate (ANOVA), and multivariate (principal component [PCA] and partial least square discriminant [PLSD] analyses, volcano plots, heat maps, clustering, correlation matrix, pattern search) statistical techniques. A main goal is to assess the set of metabolites responsible for the separation between experimental groups (e.g., genotype, disease, treatment) as can be judged by PCA or PLSDA (Fig. 2).
Figure 2. Partial least square discriminant (PLSD) analysis of WT and diabetic heart metabolomes.

PLSD analysis is a cross-validated multivariate supervised clustering/classification method from MetaboAnalyst that we used to determine the extent of separation afforded by a subset of 43 metabolites that exhibited significant changes in response to different treatments (G, GI, GIP) within each group (WT, db/db).
Reproduced from Cortassa, Caceres, Tocchetti, Bernier, de Cabo, Paolocci, Sollott, and Aon (2020) J. Physiol. 598.7, 1393–1415.
Comprehensive metabolomics analysis was performed with MetaboAnalyst versions 3.0 [9] and 4.0 [10]. Metabolites were normalized using the autoscaling function of MetaboAnalyst preceded by detection and removal of outliers, which were excluded from the statistics when above or below 1.5 times the interquartile range comprised between the 75 and 25% percentiles, respectively [16]. Combining PLSD and two-way ANOVA analyses, we determined the metabolites responsible for the separation between groups as indicated in the main text. Metabolic pathways were considered significantly enriched at log p ≥ 1.3 (p ≤ 0.05), and accordingly ranked.
Heat maps of the set of significantly changed metabolites by either treatment, genotype or their interaction, allows the visualization of patterns of relative abundance or depletion of metabolites (Fig. 3), and serve as a guide for their mapping into the corresponding pathways (Fig. 4). Figure 4 also shows a profound advantage of untargeted vs. targeted metabolomics, i.e., the discovery of new pathways related, in this case, to redox modulation of cardiac contractility in diabetes, specifically, methionine cycle and transsulfuration routes leading to major redox couples buffering systems such as glutathione, cysteine, taurine. The correlation matrix captures the existence of clusters of positively and negatively correlated metabolites, offering an overview of interrelations between pathways and novel insights into their functional interactions (Fig. 5).
Figure 3. Heat map of significantly changed metabolites in the heart metabolomes from WT and diabetic mice.
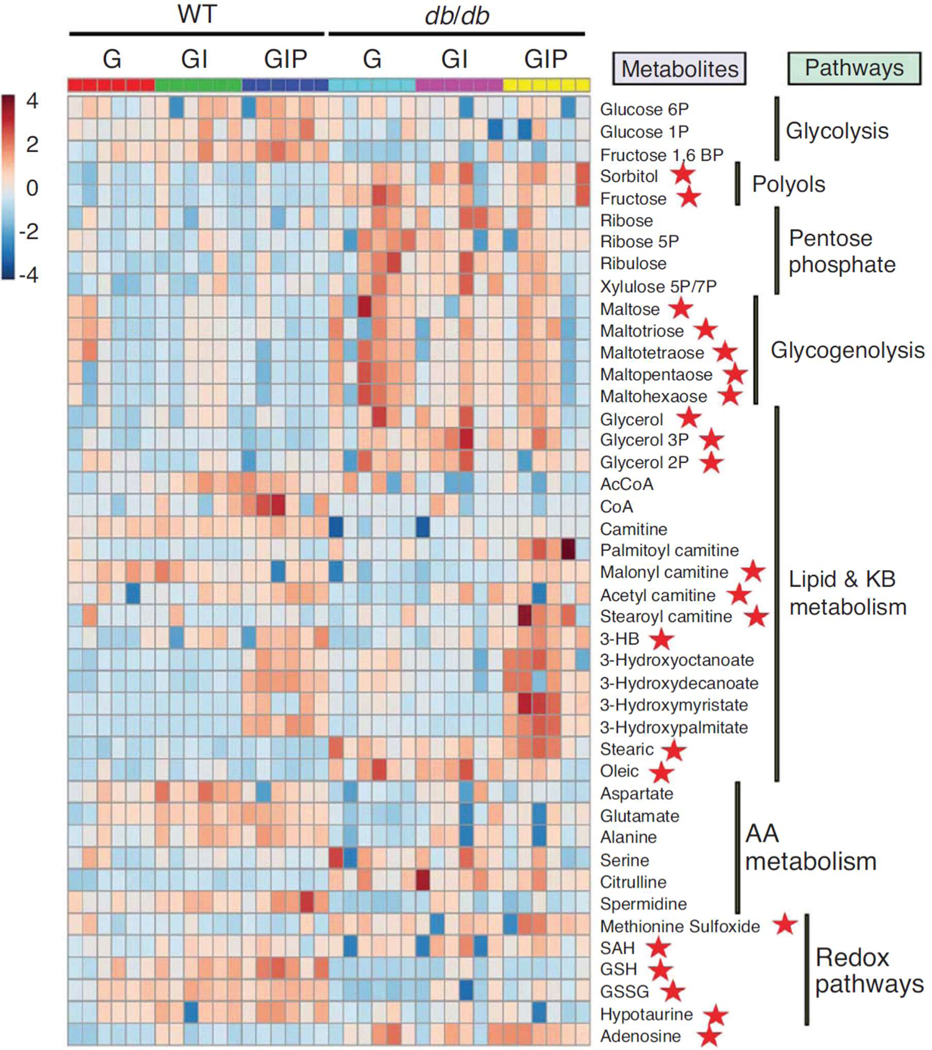
The relative abundance of intermediates from different pathways in WT and db/db hearts is displayed under the different experimental conditions assayed, as described in the text. Depicted is the heat map of the normalized levels of 43 metabolites mainly responsible for the separation between groups (WT, db/db) and treatments (G, GI,GIP) (see Fig. 2) from central glucose and FA degradation pathways, along with redox-related pathways such as methionine cycle and transsulfuration routes. The heat map was constructed using the web-based resource MetaboAnalyst 3.0. Graded pseudo-colours brown and blue correspond to metabolites accumulation or depletion, respectively, according to the scale placed at the left of the plot. AA, amino acid; GSH, reduced glutathione; GSSG, oxidized glutathione; 3-HB, 3-hydroxybutyrate; KB, ketone body; SAH, S-adenosylhomocysteine.
Reproduced from Cortassa, Caceres, Tocchetti, Bernier, de Cabo, Paolocci, Sollott, and Aon (2020) J. Physiol. 598.7, 1393–1415.
Figure 4.

Metabolites mapping in central metabolism and redox-related pathways in the heart. Depicted is a schematic view of the levels of organization involved, whole heart, cardiomyocyte, and major subcellular pathways from central metabolism, in cytoplasmic (glycolysis, pentose phosphate, glycogenolysis, glucose-fatty acid cycle) and mitochondrial (TCA cycle, β-oxidation, oxidative phosphorylation) compartments. Additionally, displayed are the folate and methionine cycles, their links to mitochondrial metabolism and transsulfuration pathways leading to glutathione (GSH) and, in turn, to ROS scavenging systems, both in the cytoplasm and mitochondrial matrix (i.e., mitochondria only import but not generate GSH). Red and green rectangles correspond to significantly (p<0.05) abundant or depleted metabolites, respectively, in the heart of diabetic over WT mice. Key to symbols: THF, tetrahydrofolate; DHAP, dihydroxyacetone phosphate; G3P, glyceraldehyde 3 phosphate; 3PG, 3 phospho-glyceraldehyde; Gly, glycine; Thr, threonine; SAM, S-adenosyl methionine; SAH, S-adenosyl homocysteine. Created at BioRender.com.
Figure 5.

Correlation matrix of significantly changed metabolites in the heart from diabetic mice. Correlation matrix of the 43 metabolites responsible for treatment separations under G, GI, and GIP conditions in hearts from diabetic mice was obtained using MetaboAnalyst 3.0. The type (positive or negative) and strength (color intensity) of correlation are coded red and green, respectively, according to the bar on the right, and normalized between 1 and −1. Red arrows on the left denote strong positively correlated metabolites. Red on the diagonal correspond to correlation 1 for each metabolite with respect to itself. GSH, reduced glutathione; GSSG, oxidized glutathione; 3-HB, 3-hydroxybutyrate; SAH, S-adenosylhomocysteine
Reproduced (partially, only bottom panel) from Cortassa, Caceres, Tocchetti, Bernier, de Cabo, Paolocci, Sollott, and Aon (2020) J. Physiol. 598.7, 1393–1415.
3.2. Computing the fluxome through central metabolism
The subset of significantly changed metabolites mapping onto central catabolism (Fig. 4) is subjected to further quantification. To introduce realistic experimental constraints, metabolite concentrations (in molar units) are needed to parameterize the computational model. More specifically, metabolite concentrations are required to calculate the fluxes through the metabolic network as inputs of the rate expressions from the kinetic model (see [3]).
-
1
Linear optimization of values. optimization is performed from metabolomics data to accurately represent model behavior under the specific conditions of the experimental design. The method involves inserting metabolites concentration into the rate expressions from the kinetic model [7] to solve and optimize the model’s values at the steady state for all metabolic steps taken into account. The solution involves finding a minimum (or maximum) of the objective function z corresponding to the following box problem, i.e., an optimization problem with bounded solutions:
| (1) |
With representing the stoichiometry matrix, i.e., the matrix of all corresponding stoichiometric coefficients to the chemical reactions of the metabolic network, organized as m rows (metabolites) and n columns (reactions); is the matrix of the derivatives of the rate expressions with respect to the of each reaction in the network; is the vector of maximal rates of each reaction step, and are fluxes of demand of intermediates and exchange with the environment, such as the transport of a carbon substrate or the efflux of a metabolic product. A description of the maximal error associated with the [17] and metabolites determinations are included (see Notes 2 and 3, respectively). For a more general treatment of the fluxomics calculation procedure see Note 4.
Equation 1 is constrained by with and being the vectors of minimal and maximal possible values of , respectively, and satisfies the objective function, , with being the vector of costs. Usually, the components of the vector are zeros.
-
2
The vector is the set of parameters to be optimized because values are most sensitive to changes in gene expression, activity modulation by signaling, and posttranslational modifications [18,3]. Since all rate expressions depend linearly on , linear algebraic methods can be used (see Note 5). Optimization is performed with an algorithm, e.g., implemented in the linprog optimization method in Matlab. Different objective functions may be used as optimization criteria, such as maximization of ATP synthesis fluxes or minimization of redox intermediates production or consumption [7,17]. Computer model simulations as a function of time can be run with Matlab (The MathWorks, Natick, MA, USA) to corroborate the metabolites’ steady state level, i.e., when the derivative of the state variables of the model is less than 1 × 10⁻¹⁰.
-
3
Linear optimization of the algebraic system is performed with the “Simplex” algorithm (implemented in MatLab). Maximization of ATP synthesis fluxes or minimization of redox consumption were used as constraints for the optimization procedure. Firstly, the function “linprog” from Matlab (The Mathworks, Inc.) was utilized with the “Simplex” algorithm for optimization of values. Secondly, within the volume of possible solutions, the highest value of for the first step (glucose transport) was chosen and computer model simulations were run with MatCont (Fig. 6).
-
4
Instead of calculating a unique solution for the system, we obtain a “volume” of possible solutions. This implies that a “range” of fluxes will be compatible with the given set of metabolites concentrations and the reference fluxes determined.
-
5
The optimized vector , when multiplied by the matrix , renders the vector of the fluxes occurring in the metabolic network under study, i.e., the rates at which each metabolite is converted or transported across compartments. The set of rates or fluxes thus obtained, expressed in molar per unit time units, corresponds to the fluxome (Fig. 7).
-
6
However, when large matrices are optimized numeric problems appear, such as ill conditioning or degeneration. To overcome this drawback, we describe a procedure to decrease the dimensions of the system to improve our chances to get an accurate and stable solution. In our specific example of central metabolism, a biologically representative and broadly expressed biochemical backbone among prokaryote and eukaryotes, there are processes that occur at high speed (large rate constants) while others occur at much slower pace (small rate constants), the latter being rate-controlling under certain conditions.
Figure 6.

Solutions space in a hypothetical branched metabolic network with three unknown fluxes. The network displayed on the left comprises three fluxes (unknowns) and a single metabolite M thus underdetermined, meaning that its solution is not unique but presents a solutions space in 2D, i.e., a surface of solutions (purple plane). The optimization renders a solution space represented by the volume of the blue “box”. According to the procedure proposed to find the values, the solutions space chosen (identified by dark arrows) fulfil two conditions: (i) for all enzymes in the network; and (ii) belongs to the solution space of the network (bright blue pentagon contained between the absolute values of which boundaries are given by the yellow, green, and teal surfaces corresponding to , and , respectively).
Figure 7.

Fluxome of central metabolism from glucose and fatty acids in the mouse heart.
Depicted are the fluxes next to their respective steps of central catabolism of glucose and fatty acids from WT and diabetic mice hearts. The fluxes are expressed in μM s−1 (equivalent to nmol s−1 ml−1 intracellular water). The fluxome was calculated from the experimental data obtained after metabolite profiling of mice hearts perfused as described elsewhere [2], following the workflow diagram shown in Figure 1, and the integrated analytical procedures described in this chapter. The fluxes displayed correspond to those producing the metabolite concentrations that reproduce the experimentally obtained by metabolomics analysis. Boxed are the flux values corresponding to WT and diabetic hearts (left and right, underlined, number columns, respectively) next to their respective steps in the network. Within each box, the treatment given - glucose, glucose + isoproterenol or glucose + isoproterenol + palmitate - is denoted by a distinct color (red, black, blue, respectively).
Reproduced from Cortassa, Caceres, Tocchetti, Bernier, de Cabo, Paolocci, Sollott, and Aon (2020) J. Physiol. 598.7, 1393–1415.
3.3. Reduction in the dimension of the algebraic problem for optimizing vmax
A more general formulation of the dimension reduction is presented in Note 4, in which Table 1 displays the equivalence in terms of central metabolism, the significant biological network that we are using to illustrate this procedure.
- We consider a metabolic network with n number of processes comprising m metabolites, where . In our illustration of the method’s implementation, m corresponds to 33 variables, and n to 37 rates. We will redefine the product of the times from Eq. 1 as
- The dimension of the problem is reduced as follows:
- We consider the input required for the optimization procedure to be given by , the boundaries of the vector and the costs vector, c. The outputs are the optimized maximal rates vector and the optimized objective function
- This output will be achieved by finding the matrix F and vector , introduced in Note 4, where the general method is developed more stepwise, by applying QR decomposition.
- and extracting and
- Being Q1 a matrix with m (33) columns, columns and r a triangular matrix of dimension m (33) (see the general treatment in Note 4).
(2) - Now the dimension of the optimization problem is and is represented by the following expression
(3) - From where we can find the solution
(4)
Table 1.
Equivalence between symbols used in the general treatment and fluxome calculation.
| Notation in the general treatment | Specific notation for fluxome calculation |
|---|---|
| A | |
| b | |
| y | |
3.4. Representative results
In the present work, we describe a methodology as applied to the determination of the heart fluxome considering glucose catabolism in addition to mitochondrial metabolism to render central metabolism (Fig. 7). We use integrated high throughput -omics data-driven research, metabolomics-fluxomics, that has enabled systems biology approaches to address human health and disease, including metabolic disorders (obesity, diabetes), cancer, aging, health- and lifespan [19,3,2,8].
Langendorf-perfused hearts from wild type (WT) mice under euglycemic conditions, exhibit a palmitate-elicited declining trend in cardiac performance as measured by decreased ISO-evoked enhancement of LV function [2]. Hearts of diabetic and WT (control) mice were subjected to perfusion in the presence of glucose alone (G), glucose + isoproterenol (GI) and Glc + isoproterenol + palmitate (GIP).
Snap-frozen Langendorff-perfused hearts were subjected to metabolite profiling at Metabolon, Inc. (Research Park Triangle, NC) (see Note 1) PLSD analysis of the heart’s metabolome revealed that 43 metabolites (out of 261) are significantly involved in the separation of the metabolite profiles from G-, GI- and GIP-treated hearts (Figs. 2, 3).
When the model can simulate the experimental input of metabolites profile at steady state (Table 2), we can also use it to determine the rate or flux (in μM sec−1) through each individual step of the metabolic network. The set of metabolic fluxes determined in this way corresponds to the fluxome (Fig. 7) [2].
The fluxome underpinning of central catabolism metabolites’ profile (Fig. 4) depicted in Figure 7, and the corroboration of the computational model’s ability to simulate the experimentally determined metabolite’s concentration (Table 2) has been reported [2].
Quantitatively speaking, the fluxome reflects the flux distribution in, e.g., cytoplasmic and mitochondrial compartments of glucose and lipids degradation through central metabolism. Hearts of diabetic and WT (control) mice subjected to 3 treatments G, GI, and GIP (see 3.4 #2 above).
Table 2.
Comparison of experimental and model-simulated metabolite concentrations obtained from hearts of diabetic (db/db) mice
| db/db – G | db/db – GI | db/db – GIP | ||||
|---|---|---|---|---|---|---|
|
|
||||||
| Metabolite | Exptl.# | Model | Exptl. | Model | Exptl. | Model |
|
| ||||||
| Glucose(ex) | 30 | 30 | 30 | |||
| Glucose(in) | 5.5 | 5.37 | 5.42 | 4.94 | 0.32 | 0.337 |
| G1P | 0.135 ± 0.015 | 0.195 | 0.153 ± 0.008 | 0.149 | 0.146 ± 0.016 | 0.180 |
| F6P + G6P | 3.71 ± 0.48 | 3.23 | 3.75 ± 0.26 | 2.48 | 3.55 ± 0.31 | 2.98 |
| F1,6bP | 0.049 ± 0.012 | 0.060 | 0.015 ± 0.004 | 0.035 | 0.011 ± 0.002 | 0.012 |
| G3P | < 0.01 | 4.9×10⁻³ | < 0.01 | 6.8×10⁻³ | < 0.01 | 3.4×10⁻³ |
| 1,3 DPG | < 0.01 | 1.7×10⁻⁴ | < 0.01 | 2.6×10⁻⁴ | < 0.01 | 1.2×10⁻⁴ |
| 3-PG | 0.504 ± 0.022 | 0.146 | 0.64 ± 0.07 | 0.356 | 0.62 ± 0.05 | 0.087 |
| PEP | < 0.01 | 1.8×10⁻³ | < 0.01 | 7.4×10⁻⁴ | < 0.01 | 9.2×10⁻⁴ |
| Pyruvate | < 0.01 | 4.8×10⁻³ | < 0.01 | 4.96×10⁻³ | < 0.01 | 3.9×10⁻³ |
| Ru5P + X5P | 4.2 ± 0.5 | 2.06 | 4.4 ± 0.4 | 2.20 | 3.7 ± 0.4 | 2.41 |
| R5P | 0.48 ± 0.04 | 0.87 | 0.38 ± 0.03 | 0.93 | 0.35 ± 0.04 | 1.02 |
| Xylitol | 0.9 ± 0.12 | 0.429 | 0.81 ± 0.07 | 0.473 | 0.804 ± 0.06 | 0.550 |
| Sorbitol | 1.2 ±0.1 | 1.51 | 1.1 ±0.3 | 1.36 | 1.5 ± 0.2 | 1.26 |
| Fructose | 4.0 ± 0.4 | 2.57 | 2.5 ± 0.5 | 2.24 | 3.2 ± 0.5 | 2.28 |
| AcCoA * | 1.94 ± 0.74 | 1.42 | 1.74± 0.79 | 1.40 | 1.56± 0.88 | 1.41 |
| Succ | 0.12 ± 0.02 | 0.102 | 0.11 ± 0.05 | 0.09 | 0.102 ± 0.023 | 0.10 |
| FUM | 1.86 ± 1.01 | 1.59 | 1.69 ± 0.53 | 1.52 | 1.55 ± 0.55 | 1.57 |
| ISO | < 0.01 | 0.014 | < 0.01 | 0.014 | < 0.01 | 0.014 |
| αKG | < 0.01 | 0.004 | < 0.01 | 0.0037 | < 0.01 | 0.0039 |
Experimental and model-simulated concentrations are expressed in mmol/liter, and experimental values are displayed as mean±SEM (n=6)
AcCoA concentration is given in μM units. Key to symbols: G, 30mM glucose; GI, G + 10nM ISO; GIP, G + I + 0.4mM Palm.
Figure 7 illustrates the results of optimizing the fluxes through the glucose and fatty acids central catabolic network (33 metabolites and 37 reaction steps). The solution shown corresponds to one of the vertices of the “volume of solutions” of the optimization problem (solution dimension =4) (Fig. 6). To reduce the solution space, more reference fluxes should be determined, e.g., the release of xylitol to the extracellular medium. The metabolomics profiles from hearts of diabetic and WT mice subjected to Langendorf perfusion and the 3 treatments showed important differential properties of the catabolic networks that reflected more the disease phenotype than the condition in which the hearts were perfused (Fig. 7). The computational model of the hearts from control and diabetic mice were adjusted with their own metabolomics data. A more extended version of the catabolic network displayed in Figure 7 has been recently published [1].
4. Notes
-
1
Previously, we emphasized the need to perform the analysis of metabolites under defined and controlled experimental conditions, accompanied by hypothesis-driven experimental design and appropriate challenge (e.g., adrenergic stimulation as it happens during exercise). These are crucial for the success of the present procedure. The rapid sampling can be achieved by methods that assure a very fast stop of all metabolic reactions such as snap freezing in liquid nitrogen. In early work treatment with concentrated perchloric acid or an equivalent intervention was considered accepted practice. However, later on it was demonstrated that, in yeast, the concentration of ATP could drop to a small fraction of its initial concentration in a few seconds before perchloric acid has been able to fully stop metabolic fluxes [20]. Consequently, all interventions requiring a waiting period before metabolic fluxes have completely ceased are, in principle, not appropriate for fluxomics analysis, because the concentration of intermediary metabolites will not reflect the actual concentration in the tissue due to artifacts related to improper sample collection. Also, and as a caveat, the accuracy of the latter procedure may also be affected by the stability of certain metabolites (e.g., NAD+, during sample processing for MS or LC-MS/MS analysis [21].
-
2
Estimation of the maximal error associated with the calculation of the values. There are several sources of error associated with the estimation of the fluxes through this method. Errors associated with the variability in experimental determinations of metabolites that will affect the matrix that contains the derivatives of rate expressions with respect to the .
The matrix in Eq.1 can be made square by appending it with a matrix, size where is and contains 1’s and 0’s. Obtaining a non-singular square matrix is required in order to be able to invert it. , the vector of transport and demand processes, e.g., biosynthesis also appended with a vector containing p elements that correspond to the measured flux rates. is the diagonal matrix of the derivatives of the rate expressions with respect to the of each rate.
In addition to variability in the experimental values of the transport or demand processes taken into account in vector bt, sources of variability in the determination of metabolites or in parameter values in each rate expression, such as the affinities of enzymes for their respective substrates, or effectors, are reflected in the variability of .(5) Inspired by the treatment of Savinell and Palsson [17], the matrix norm can be obtained:
which, when applied to Eq. 5, can be rearranged as(6) (7) Which lead to an expression for the maximum relative error in the determination of as:(8) -
3
Estimation of the error associated with the calculation of the values due to variability in metabolites. In the particular case that is being considered in this manuscript, we have estimated the error arising from the variability in metabolites by computing the values of that would be obtained if all the metabolites values were or , where is the experimentally determined mean concentration value and ΔM is the standard error of the mean.
-
4
General formal development of the dimension reduction of the optimization problem. For the sake of a general treatment, we will use more unspecific names for the variables but will redefine them to the equivalent in our problem in Table 1
The problem of finding the set of that satisfies the levels of intermediates determined by targeted metabolomics and the fluxes used as reference to perform the calculation, boils down to finding the vector x which has a lower dimension than n,
With which in our case . Thus, an optimization in a space of dimension 4 is less likely to show ill conditioning and other sources of instability than one in a 37 (n) dimensional space. Then the new objective function is defined as with the constraint
The objective function describes the condition, e.g., “minimizing the rate of substrate consumption” or “maximizing the energy (ATP) output”, of the metabolic network. The cost function is a weighted stoichiometric vector containing positive or negative values depending upon the process’s role in the objective function (e.g., producing, or consuming ATP in the “maximizing the energy output” objective).
The solution of the optimization performed with the linear programing function
is given by:
Due to the introduction of function f(x), we can write the inequality
as follows:
which may be rearranged,
and, in turn, rewritten as the following inequality
Thus, we can identify now A′ and b′
The objective function z(v) becomes,
which can be rewritten as follows:
Finally, the objective function can be expressed as:
For calculating F and yref the QR decomposition of the transpose of matrix A can be performed as follows :
where Q1 is a 37×33 matrix, Q2 is a 37×4 matrix, and r is a triangular matrix of range 33 With
It can be demonstrated that
-
5
Linearity of rate expressions with respect to . The optimization procedure used in these calculations requires linearity with respect to the variable that is ‘unknown’, in our case this is the , i.e., the rate equations are in all cases linear with respect to . Nevertheless, the rate equations in our kinetic models exhibit non-linear relationships with respect to the metabolites (substrates, products, effectors) in each rate expression participating in the network.
Conclusion
This chapter contributes an integrated methodological approach that combines experimental measurements, computational modeling, and bioinformatic tools that, as a showcase, is applied to heart function in diabetes. This approach is widely applicable, as it has been shown in liver function to investigate health and lifespan [8].
Quantitation of the fluxome from central metabolism established the causal relationship, and its mechanistic underpinnings, between myocardial redox improvement and enhanced cardiac contractility in type 2 diabetes [22,2,23]. Moreover, key new insights emerged from applying this methodology such as, among others, the discovery of the potential, hitherto unknown, involvement of the methionine cycle and transsulfuration pathways in redox regulation of diabetic heart function (Fig. 4) [2].
Finally, the present methodology allows the optimization and parameterization of the computational model, which can be used to calculate the main rate-controlling and regulatory steps, and as a predictive tool of genetic and pharmacological interventions potentially leading to the development of new therapeutic strategies.
ACKNOWLEDGMENTS
This work was supported by the Intramural Research Program of the National Institute on Aging, National Institutes of Health.
Footnotes
DECLARATION OF INTERESTS
No authors have a conflict of interest to declare.
References
- 1.Cortassa S, Aon MA, Sollott SJ (2019) Control and Regulation of Substrate Selection in Cytoplasmic and Mitochondrial Catabolic Networks. A Systems Biology Analysis. Front Physiol 10:201. doi: 10.3389/fphys.2019.00201 [DOI] [PMC free article] [PubMed] [Google Scholar]
- 2.Cortassa S, Caceres V, Tocchetti CG, Bernier M, de Cabo R, Paolocci N, Sollott SJ, Aon MA (2020) Metabolic remodelling of glucose, fatty acid and redox pathways in the heart of type 2 diabetic mice. J Physiol 598 (7):1393–1415. doi: 10.1113/JP276824 [DOI] [PMC free article] [PubMed] [Google Scholar]
- 3.Cortassa S, Caceres V, Bell LN, O’Rourke B, Paolocci N, Aon MA (2015) From metabolomics to fluxomics: a computational procedure to translate metabolite profiles into metabolic fluxes. Biophys J 108 (1):163–172. doi: 10.1016/j.bpj.2014.11.1857 [DOI] [PMC free article] [PubMed] [Google Scholar]
- 4.Edwards JS, Ibarra RU, Palsson BO (2001) In silico predictions of Escherichia coli metabolic capabilities are consistent with experimental data. Nat Biotechnol 19 (2):125–130. doi: 10.1038/84379 [DOI] [PubMed] [Google Scholar]
- 5.Winter G, Kromer JO (2013) Fluxomics - connecting ‘omics analysis and phenotypes. Environ Microbiol 15 (7):1901–1916. doi: 10.1111/1462-2920.12064 [DOI] [PubMed] [Google Scholar]
- 6.Cortassa S, Aon MA (2012) Computational modeling of mitochondrial function. Methods Mol Biol 810:311–326. doi: 10.1007/978-1-61779-382-0_19 [DOI] [PMC free article] [PubMed] [Google Scholar]
- 7.Cortassa S, Sollott SJ, Aon MA (2018) Computational Modeling of Mitochondrial Function from a Systems Biology Perspective. Methods Mol Biol 1782:249–265. doi: 10.1007/978-1-4939-7831-1_14 [DOI] [PubMed] [Google Scholar]
- 8.Mitchell SJ, Bernier M, Aon MA, Cortassa S, Kim EY, Fang EF, Palacios HH, Ali A, Navas-Enamorado I, Di Francesco A, Kaiser TA, Waltz TB, Zhang N, Ellis JL, Elliott PJ, Frederick DW, Bohr VA, Schmidt MS, Brenner C, Sinclair DA, Sauve AA, Baur JA, de Cabo R (2018) Nicotinamide Improves Aspects of Healthspan, but Not Lifespan, in Mice. Cell Metab 27 (3):667–676 e664. doi: 10.1016/j.cmet.2018.02.001 [DOI] [PMC free article] [PubMed] [Google Scholar]
- 9.Xia J, Wishart DS (2016) Using MetaboAnalyst 3.0 for Comprehensive Metabolomics Data Analysis. Curr Protoc Bioinformatics 55:14 10 11–14 10 91. doi: 10.1002/cpbi.11 [DOI] [PubMed] [Google Scholar]
- 10.Chong J, Soufan O, Li C, Caraus I, Li S, Bourque G, Wishart DS, Xia J (2018) MetaboAnalyst 4.0: towards more transparent and integrative metabolomics analysis. Nucleic Acids Res 46 (W1):W486–W494. doi: 10.1093/nar/gky310 [DOI] [PMC free article] [PubMed] [Google Scholar]
- 11.Aon MA, Cortassa S (1997) Dynamic biological organization : fundamentals as applied to cellular systems. 1st edn. Chapman & Hall, London ; New York [Google Scholar]
- 12.Kembro JM, Cortassa S, Lloyd D, Sollott SJ, Aon MA (2018) Mitochondrial chaotic dynamics: Redox-energetic behavior at the edge of stability. Sci Rep 8 (1):15422. doi: 10.1038/s41598-018-33582-w [DOI] [PMC free article] [PubMed] [Google Scholar]
- 13.Kurz FT, Kembro JM, Flesia AG, Armoundas AA, Cortassa S, Aon MA, Lloyd D (2017) Network dynamics: quantitative analysis of complex behavior in metabolism, organelles, and cells, from experiments to models and back. Wiley Interdiscip Rev Syst Biol Med 9 (1). doi: 10.1002/wsbm.1352 [DOI] [PubMed] [Google Scholar]
- 14.Dhooge A, Govaerts W, Kuznetsov YA, Meijer HGE, Sautois B (2008) New features of the software MatCont for bifurcation analysis of dynamical systems. Mathematical and Computer Modelling of Dynamical Systems 14 (2):147–175 [Google Scholar]
- 15.Schuster S, von Kamp A, Pachkov M (2007) Understanding the roadmap of metabolism by pathway analysis. Methods Mol Biol 358:199–226. doi: 10.1007/978-1-59745-244-1_12 [DOI] [PubMed] [Google Scholar]
- 16.Aitken M, Broadhurst B, Hladky S (2009) Mathematics for Biological Scientists. CRC Press, [Google Scholar]
- 17.Savinell JM, Palsson BO (1992) Optimal selection of metabolic fluxes for in vivo measurement. I. Development of mathematical methods. J Theor Biol 155 (2):201–214. doi: 10.1016/s0022-5193(05)80595-8 [DOI] [PubMed] [Google Scholar]
- 18.Cortassa S, Aon MA, Iglesias AA, Aon JC, Lloyd D (2012) An Introduction to Metabolic and Cellular Engineering, . 2nd Edition edn. World Scientific Publishers, Singapore [Google Scholar]
- 19.Aon MA, Bernier M, Mitchell SJ, Di Germanio C, Mattison JA, Ehrlich MR, Colman RJ, Anderson RM, de Cabo R (2020) Untangling Determinants of Enhanced Health and Lifespan through a Multi-omics Approach in Mice. Cell Metab 32 (1):100–116 e104. doi: 10.1016/j.cmet.2020.04.018 [DOI] [PMC free article] [PubMed] [Google Scholar]
- 20.de Koning W, van Dam K (1992) A method for the determination of changes of glycolytic metabolites in yeast on a subsecond time scale using extraction at neutral pH. Anal Biochem 204 (1):118–123. doi: 10.1016/0003-2697(92)90149-2 [DOI] [PubMed] [Google Scholar]
- 21.Demarest TG, Truong GTD, Lovett J, Mohanty JG, Mattison JA, Mattson MP, Ferrucci L, Bohr VA, Moaddel R (2019) Assessment of NAD(+)metabolism in human cell cultures, erythrocytes, cerebrospinal fluid and primate skeletal muscle. Anal Biochem 572:1–8. doi: 10.1016/j.ab.2019.02.019 [DOI] [PMC free article] [PubMed] [Google Scholar]
- 22.Bhatt NM, Aon MA, Tocchetti CG, Shen X, Dey S, Ramirez-Correa G, O’Rourke B, Gao WD, Cortassa S (2015) Restoring redox balance enhances contractility in heart trabeculae from type 2 diabetic rats exposed to high glucose. Am J Physiol Heart Circ Physiol 308 (4):H291–302. doi: 10.1152/ajpheart.00378.2014 [DOI] [PMC free article] [PubMed] [Google Scholar]
- 23.Tocchetti CG, Caceres V, Stanley BA, Xie C, Shi S, Watson WH, O’Rourke B, Spadari-Bratfisch RC, Cortassa S, Akar FG, Paolocci N, Aon MA (2012) GSH or palmitate preserves mitochondrial energetic/redox balance, preventing mechanical dysfunction in metabolically challenged myocytes/hearts from type 2 diabetic mice. Diabetes 61 (12):3094–3105. doi: 10.2337/db12-0072 [DOI] [PMC free article] [PubMed] [Google Scholar]