Abstract
The DNA repair endonuclease APE1 is responsible for the cleavage of abasic sites (AP) in DNA as well as binding AP in promoter G-quadruplex (G4) folds in some genes to regulate transcription. The present studies focused on the topological properties of AP-bearing G4 folds and how they impact APE1 interaction. The human telomere sequence with a tetrahydrofuran model (F) of an AP was folded in K+- or Na+-containing buffers to adopt hybrid- or basket-folds, respectively. Endonuclease and binding assays were performed with APE1 and the G4 substrates, and the data were compared to prior work with parallel-stranded VEGF and NEIL3 promoter G4s to identify topological differences. The APE1-catalyzed endonuclease assays led to the conclusion that telomere G4 folds were slightly better substrates than the promoter G4s, but the yields were all low compared to duplex DNA. In the binding assays, G4 topological differences were observed in which APE1 bound telomere G4s with dissociation constants similar to single-stranded DNA, and promoter G4s were bound with nearly ten-fold lower values similar to duplex DNA. An in-cellulo assay with the telomere G4 in a model promoter bearing a lesion failed to regulate transcription. These data support a hypothesis that G4 topology in gene promoters is a critical feature that APE1 recognizes for gene regulation.
APE1 complexed with an abasic site in G-quadruplex (G4) topologies displays differences in binding constants, enzyme cleavage yields, and gene regulation. APE1 tightly binds parallel G4s to regulate transcription that is not found with hybrid G4s.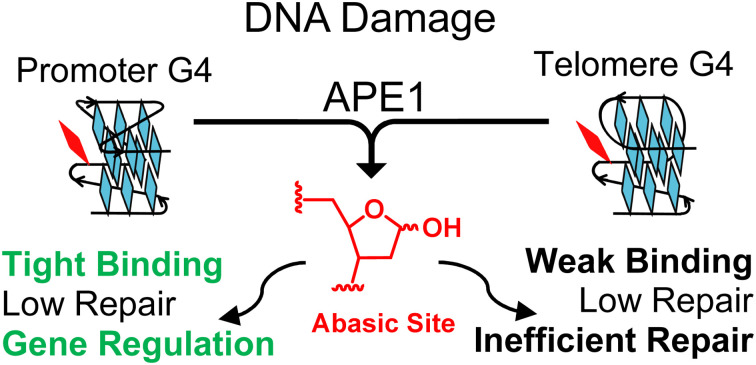
Introduction
Genomes are the dynamic blueprint of life providing instructions for cellular differentiation, maintenance, and responses to unexpected stressors. Regulation at the genomic level occurs via DNA-protein interactions with specificity to the DNA sequence, structure, and/or location and the extent of chemical modification to the nucleotides. Regarding chemical modifications of DNA, methylation of cytosine to yield 5-methylcytosine (5mC) in CpG contexts is the primary epigenetic regulatory modification responsible for global transcriptional regulation.1 This modification is enzymatically written into DNA with a well-established set of reader and eraser proteins.1 The guanine base is oxidation prone to yield 8-oxo-7,8-dihydroguanine (OG; Fig. 1A) that is epigenetic-like to cue a cellular stress response.2–6 Studies continue to further define all the proteins involved in regulation via OG. Interestingly, both 5mC and OG are moderately mutagenic as a result of 5mC displaying accelerated rates of deamination to thymidine causing C → T transitions and OG being Janus-faced, pairing with both cytidine and adenosine nucleotides during polymerase bypass to yield G → T transversions.7 Cells maintain the regulatory function of these modifications while avoiding their deleterious features via elaborate and modification-specific DNA repair pathways.8 Focusing on OG, many open questions exist regarding when and where OG is epigenetic-like versus a product of oxidation that can be mutagenic.
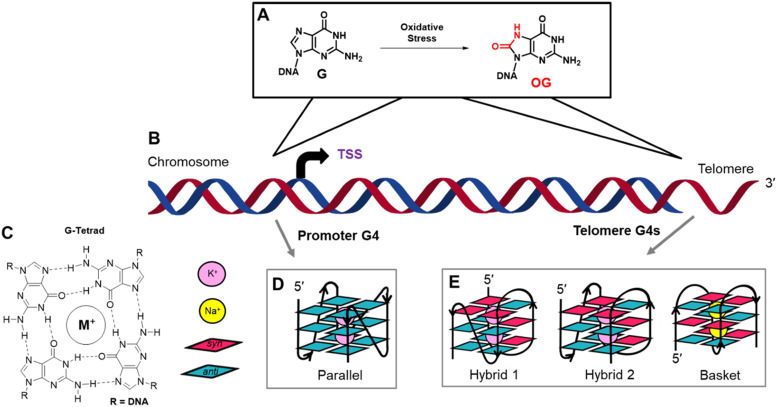
Fig. 1. The oxidation of G to OG occurs in genomes at a greater frequency in gene promoters and telomeres that both possess potential G-quadruplex forming sequences. (A) Scheme for G oxidation. (B) Cartoon model of a chromosome to illustrate favorable sites of G oxidation to OG previously found. (C) Structure of a G-tetrad and symbol guide for a (D) parallel-stranded G4 fold typically found in a promoter, or (E) hybrid and basket G4s that the hTelo sequence adopts. As a note, intracellular G4s fold around K+ ions (purple), and the basket fold in the hTelo sequence induced by Na+ ions was studied for its unique structure, not for a known biological relevance.
In eukaryotic genomes, sequencing for OG has identified this modification is non-randomly formed; however, the details are subject to debate, and differences in the sequencing method employed, the cell lines studied, and how the data were analyzed likely lead to the inconsistencies between laboratories.9–14 Two locations where OG is generally enriched include gene promoters, where it can impact transcription, and telomeres where OG would clearly not regulate mRNA synthesis (Fig. 1B). Because both promoters and telomeres harbor G-rich potential G-quadruplex sequences, we asked which features differentiate the behavior of OG processing in these elements of the genome leading to gene regulation vs. avoidance of mutagenesis.
In promoters, OG can function as a regulatory DNA modification via many different proposed pathways.2–5,15 Herein, the discussion will focus on the initial proposal from our laboratory that found OG activates transcription when formed in potential G-quadruplex forming sequences (PQS).6 First, an endogenous oxidant such as carbonate radical anion oxidizes double-stranded DNA (dsDNA) to yield an electron hole that migrates to a low-energy site to be terminated in a chemical reaction.16,17 In dsDNA, G-rich PQSs are excellent sites for termination of the reaction to yield OG, particularly at any G immediately 5′ to another G.18,19 The OG formed in dsDNA (e.g., in a PQS) is a substrate for the glycosylase OGG1 to catalyze the hydrolysis of the glycosidic bond yielding an abasic site (AP). Next, via the action of apurinic/apyrimidinic endonuclease 1 (APE1), the AP-bearing PQS is remodeled to a G-quadruplex (G4) fold by the protein; APE1 binds this non-canonical structure with a high affinity similar to dsDNA but poorly cleaves the baseless site in contrast to dsDNA substrates.20 The APE1-G4 binary complex is a hub for the recruitment of activating transcription factors (e.g., AP1 or HIF1α) to induce mRNA synthesis.6,21 Our proposal was derived from studying chemically-defined reporter plasmids in mammalian cell culture;6 noteworthy to readers, the order of events we proposed has been misquoted in the recent literature.11 Lastly, our mechanism involving G oxidation to OG in a promoter PQS to regulate gene expression via APE1 bound to a promoter G4 fold was confirmed on the genome-wide scale in mammalian cell culture.22
G-Quadruplex folds are best observed when four or more closely spaced runs of three or more G nucleotides are in proximity.23,24 One G from each of the four runs bonds via Hoogsteen base pairs to form a G-tetrad (Fig. 1C), and because there are at least three G nucleotides per run, three G-tetrads are formed in DNA. Stacking of the G-tetrads is enabled by the coordination of the lone pairs of electrons at O6 of each G nucleotide in the G-tetrads to K+ ions that are appropriately sized and of the highest intracellular concentration. Sodium ions can also coordinate with the O6 lone electron pair found in stacked G-tetrads forming G4 folds. The nucleotides between each G run are the loop sequences that hold the structure together. G-Quadruplex folds in gene promoters are typically parallel-stranded and studied in buffers with K+ ions (Fig. 1D);25 in contrast, the human telomere sequence (5′-(TTAGGG)n-3′; hTelo) adopts two hybrid folds in K+ ion buffers, hybrid-1 and hybrid-2, and a basket fold in buffers with Na+ ions (Fig. 1E).26–28 A final feature of native PQSs is the high incidence of sequences with five or more G runs in promoters, and the hTelo sequence is a string of G runs.29,30 When a modification incompatible with G-tetrad formation such as an AP is present in the sequence, the additional G run can replace the modified track to maintain the fold, functioning like a spare tire.29,30 This information guided the experiments described herein.
G-Quadruplexes can occur in many genomic regions such as promoters and telomeres, both of which are sites of DNA oxidation where BER is active.9,31,32 Prior work found that AP-containing four-track telomere G4 folds are substrates for APE1 to cleave the baseless site;33–35 in contrast, promoter four- or five-track G4s with an embedded AP are poorly cleaved by APE1.20,36–39 The binding of APE1 to G4 folds has been interrogated for four-track hTelo G4 folds and four- and five-track promoter G4 folds.20,33,37 The highest affinity interaction between APE1 to G4 folds requires the intrinsically disordered N-terminal domain of the protein and Mg2+.20,33 In the present work, analysis of APE1 endonuclease activity and binding constants with G4 folds was explored to understand the DNA topological impact on the protein interactions. Further, four- vs. five-track G4 folds were analyzed and compared in K+- and Na+-containing buffers. The hTelo basket fold present in Na+ ion buffer is likely not relevant to biology but was included in the study to aid in understanding the role of G4 topology on APE1 interaction with these structures. The new data regarding APE1 binding hTelo G4 folds with hybrid- or basket-like topologies were then compared to our prior studies on G4 folds found in the promoters of the VEGF and NEIL3 genes, which adopt parallel-stranded topologies.20,39 These comparative data identify that G4 topology impacts protein recognition, which will guide future structural studies to address how G4 structures are differentially bound by proteins to achieve different cellular goals such as transcriptional regulation and DNA repair.
Results and discussion
The oligonucleotide sequences studied are shown in Table 1, in which the AP analog tetrahydrofuran (F) was studied because it is chemically stable, unlike an authentic AP, while being an equally good substrate for APE1.40 The F-containing sequences include the four-track hTelo sequence (hTelo-4F), and two five-track hTelo sequences that had an additional run of G nucleotides added to either the 5′ (hTelo-5F 5′-ext) or 3′ (hTelo-5F 3′-ext) end of the hTelo-4F sequence (Table 1). These sequences were compared to our prior work focused on the promoter G4s found in the VEGF and NEIL3 genes, both of which natively have five G runs (Table 1).20,39 Comparisons were also made to dsDNA and single-stranded DNA (ssDNA). The dsDNA sequence is the VEGF PQS bearing an F site mixed with its complementary C-rich strand, and the ssDNA is the same F-containing VEGF sequence in a buffered salt solution comprised of Li+ ions. Prior work showed Li+ is not compatible with stable G4 folds at the analysis temperature,41 which we previously confirmed for this sequence.20
Sequences studied that can adopt different G4 topologies.
| Full description | Abbreviation | Sequence |
|---|---|---|
| VEGF 4-Track Fa | VEGF-4F | 5′-C G̲G̲G̲G̲ C G̲G̲G̲ CC G̲G̲F̲G̲G̲ C G̲G̲G̲G̲ T |
| VEGF 5-Track Fa | VEGF-5F | 5′-C G̲G̲G̲G̲ C G̲G̲G̲ CC G̲G̲F̲G̲G̲ C G̲G̲G̲G̲ TCCGGC G̲G̲G̲G̲ C |
| NEIL34-Track Fb | NEIL3-4F | 5′-TT G̲G̲G̲ C G̲G̲G̲G̲ CCT F̲G̲G̲ C G̲G̲G̲G̲ CC |
| NEIL3 5-Track Fb | NEIL3-5F | 5′-TA G̲G̲G̲ TGCTGT TT G̲G̲G̲ C G̲G̲G̲G̲ CCT F̲G̲G̲ C G̲G̲G̲G̲ CC |
| hTelo 4-track 9F | hTelo-4F | 5′-TA G̲G̲G̲ TTA F̲G̲G̲ TTA G̲G̲G̲ TTA G̲G̲G̲ TT |
| hTelo 4-track 9F 5′ extension | hTelo-5F 5′-ext | 5′-TA G̲G̲G̲ TTA G̲G̲G̲ TTA F̲G̲G̲ TTA G̲G̲G̲ TTA G̲G̲G̲ TT |
| hTelo 4-track 9F 3′ extension | hTelo-5F 3′-ext | 5′-TA G̲G̲G̲ TTA F̲G̲G̲ TTA G̲G̲G̲ TTA G̲G̲G̲ TTA G̲G̲G̲ TT |
| dsDNAa | dsDNA | 5′-C GGGG C GGG CC GGFGG C GGGG T |
| G CCCC G CCC GG CCCCC G CCCC A | ||
| ssDNAc | ssDNA | 5′-C GGGG C GGG CC GGFGG C GGGG |
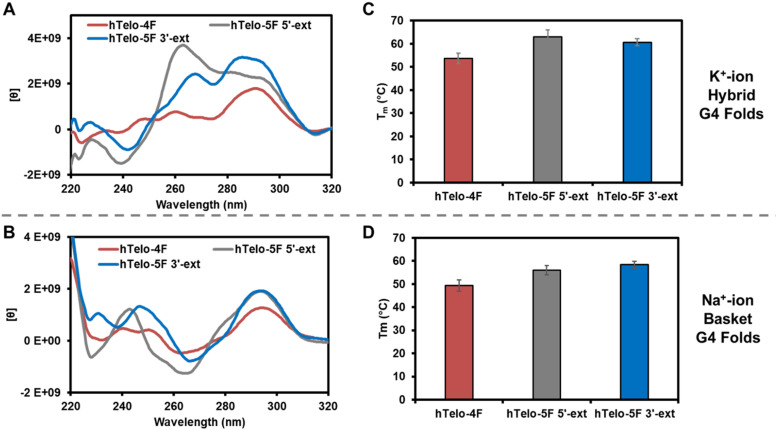
Before studying the interaction of APE1 with the hTelo G4s, the sequences were allowed to fold in either K+- or Na+-containing buffer systems and studied by circular dichroism (CD) spectroscopy and thermal melting (Tm) analysis. The different G4 folds yield characteristic CD spectra to demonstrate the different topologies that exist in the solutions in which they are prepared.42 The analysis buffer solution was comprised of 20 mM Tris (pH 7.4 at 37 °C), 50 mM MOAc (M = K or Na), 10 mM Mg(OAc)2, and 1 mM DTT. The hTelo-4F sequence in K+ ion buffers yielded a CD spectrum diagnostic of a mixture of hybrid G4 folds (λmax = 290 and 260 nm, λmin = 245 nm; Fig. 2A). The two five-track hTelo sequences (hTelo-5F 5′-ext and hTelo-5F 3′-ext), when allowed to fold in K+-containing buffers, produced spectra that differed slightly from the four-track sequence but maintained similar λmax and λmin values. These two extended sequences still maintain folds that are more similar to hybrid folds than any other known G4 fold based on CD spectroscopic analysis. In Na+-containing buffers, the hTelo-4F sequence produced a CD spectrum consistent with a basket-like fold (λmax = 290 and 240 nm, λmin = 260 nm; Fig. 2B), and inclusion of the fifth G-track on either end of the sequence did not change the spectra suggesting the basket-like fold was maintained. Prior CD spectroscopic analysis of the VEGF and NEIL3 G4 folds for both four- and five-track sequences demonstrated parallel-stranded topologies under identical K+-containing buffer systems as studied in the present work.20,39 Lastly, the Tm values for all hTelo sequences studied in the two different buffers were >50 °C supporting them as stable under the conditions of the analysis (Fig. 2C and D). The promoter G4s were previously shown to adopt folds with Tm values >50 °C.3,6
Fig. 2. Inspection of the hTelo sequences studied by CD spectroscopy and Tm analysis. Circular dichroism of the sequences in (A) K+-containing buffers and (B) Na+-containing buffers. Thermal melting analysis of the sequences in (C) K+-containing buffers and (D) Na+-containing buffers. The buffer composition was 20 mM Tris (pH 7.4 at 37 °C), 50 mM MOAc (M = K or Na), and 10 mM Mg(OAc)2.
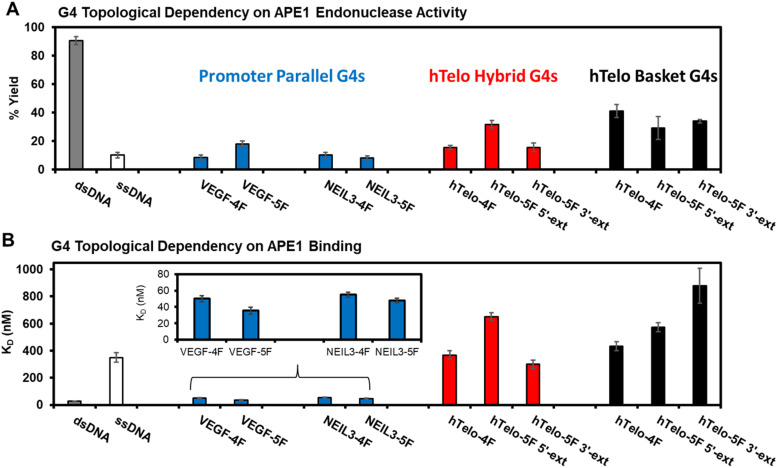
The APE1 endonuclease activities toward the F site to yield a break in the G4 sequences were quantified after a 60 min incubation with the enzyme. The reactions were monitored via a denaturing polyacrylamide gel electrophoresis (PAGE) experiment that was visualized by autoradiography of the 5′-32P labeled DNA strands (Fig. S1, ESI†). The dsDNA substrate produced the highest strand scission yield (>90%) as expected based on prior work from us and others (Fig. 3A).20,33,39,43,44 The ssDNA substrate was cleaved by APE1 with ∼10% yield, which is consistent with literature reports (Fig. 3A).20,44 The G4 folds produced slight topological differences. First, the NEIL3 and VEGF parallel-stranded G4 folds in K+ salts were cleaved by APE1 with yields ranging from 10–20% that depended on the sequence and whether the fifth G-track was present (Fig. 3A). The hTelo sequences folded in K+-containing buffers were cleaved by APE1 with yields between 15–30% (Fig. 3A); the highest yield was found with the presence of the fifth G-track on the 5′ side of the sequence. Last, the hTelo sequences studied in buffer with Na+ cations found the APE1 cleavage yields were similar within error with a yield of ∼35% (Fig. 3A); the fifth G-track had minimal impact on the enzyme cleavage yields of the F site.
Fig. 3. The topology of G4 folds with an F site impact APE1 endonuclease activity and DNA binding. (A) The reaction yield for APE1 cleavage of an F site in the G4 folds. (B) The dissociation constants measured for the binary complex formed between APE1 and the G4 folds inspected in this study. The buffer composition was 20 mM Tris (pH 7.4 at 37 °C), 50 mM MOAc (M = K or Na), 10 mM Mg(OAc)2, and 1 mM DTT. The endonuclease and binding values for the VEGF and NEIL3 promoter G4 folds were previously reported by our laboratory.20,39.
The F-containing G4 topologies studied were cleaved by the endonuclease with considerably lower yields compared to the dsDNA context (dsDNA ∼90% vs. G4 yields in a range from 10–40%; Fig. 3A). These data confirm that the dsDNA context with an F is the best APE1 substrate. In comparison to ssDNA contexts, the parallel-stranded G4s were cleaved with similar yields (ssDNA ∼10% vs. 10–20%; Fig. 3A) and the hTelo sequences with an F site were slightly better substrates (ssDNA ∼10% vs. hTelo in K+ = 15–30% and hTelo in Na+ buffer = 30–40%; Fig. 3A). The key new finding was that the G4 topological difference in APE1 cleavage yield favored hTelo substrates by ∼twofold higher removal of the F site compared to the promoter G4 substrates. The present comparison between hTelo and promoter G4 folds does not include impacts that occur with the F at different positions in these folds; however, our prior studies inspected more than one position in the promoter G4 folds to find a small overall positional dependency.20,38,39 Lastly, the hTelo hybrid 1 and 2 folds can be induced by sequence changes that minimize the plasticity of the structures to equilibrate in solution;26,28 however, these structures have not been solved with an abasic site present (F), in which the CD spectra recorded suggest slightly different folds with the lesion present compared to the native sequence (Fig. 2A and B). In light of the unknown structures for the hTelo G4s with F, studies were not pursued to address these dynamics with locked hybrid 1 or 2 structures in the hTelo G4s to impact APE1 cleavage of the baseless site. Nonetheless, the present topological differences observed led us to wonder whether other differences exist for the APE1 interaction with G4 folds.
Prior reports found that G4 folds bearing AP (F) sites are poorly cleaved by APE1, but they are bound by the protein with a high affinity represented by low dissociation constants (KD).20,33 Accordingly, the KD values for the APE1-G4 binary complexes with the hTelo G4 topologies were measured using fluorescence anisotropy identically to the approach we previously reported (Fig. S2, ESI†).20,39 The binding constants were measured with 10 mM Mg(OAc)2 present. The endonuclease APE1 requires Mg2+ cations for substrate binding and product release,43 and therefore, binding studies in the presence of this metal will lead to strand scission with the wild-type enzyme. To enable substrate binding to be measured without complication by F cleavage, the catalytically incompetent mutant D210A-APE1 was used in the studies following prior studies as a guideline for this approach.20,37
The measured KD values for the hTelo folds were compared to the reported parallel-stranded G4s bearing AP in either the VEGF or NEIL3 promoter G4 folds.20,39 The dsDNA was bound by APE1 with a KD value of 30 nM and ssDNA was bound with a >10-fold KD value (350 nM; Fig. 3B). The parallel-stranded G4 folds were bound by APE1 with KD values of ∼45 nM, similar to dsDNA (Fig. 3B). The hybrid hTelo G4 folds in K+-containing buffers were bound by APE1 with KD values >300 nM (Fig. 3B). The presence of the fifth G-track in the hTelo-5F 3′-ext sequence led to a slightly lower KD value while the hTelo-5F-5′-ext sequence had a slightly greater KD value when compared to the hTelo-4F sequence (Fig. 3B). The basket hTelo G4 folds in Na+-containing buffers were bound by APE1 with KD values >400 nM (Fig. 3B). The presence of a fifth G-track resulted in slightly greater KD values compared to the four-track sequence. The KD values measured for APE1 binding the hTelo G4 folds were all on the same order of magnitude as ssDNA; in contrast, the KD values measured between APE1 and the parallel-stranded G4 folds from the VEGF and NEIL3 promoters were lower in value and similar to dsDNA (Fig. 3B). These differences in the measured dissociation constants support a G4 topological dependency in APE1 binding that may be important for the function of APE1 in gene regulation vs. DNA repair.
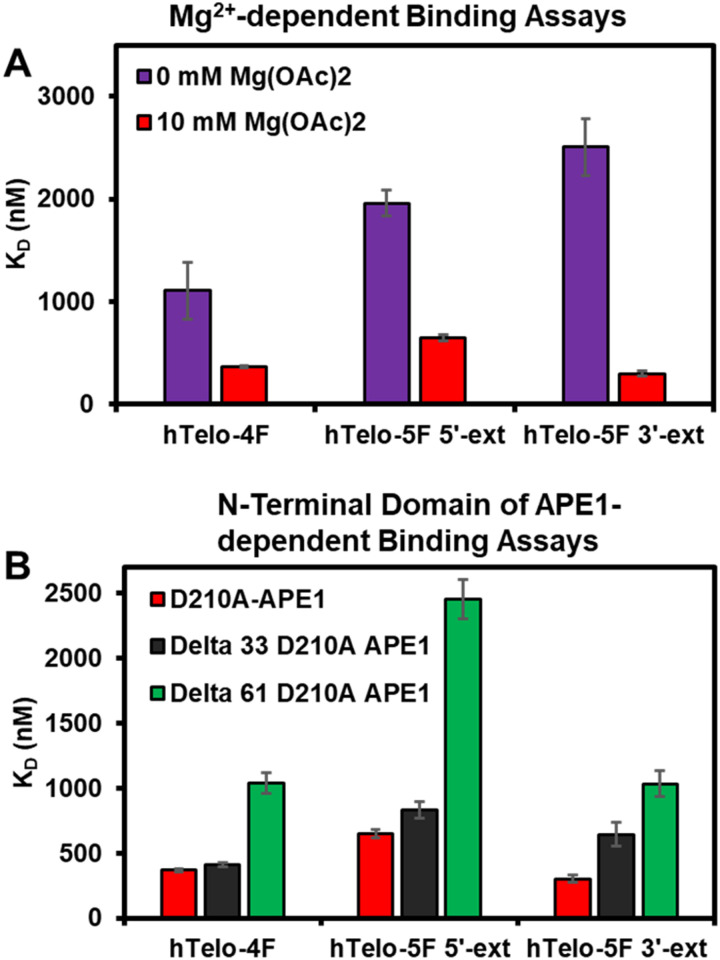
In the prior studies with APE1 binding the VEGF promoter G4 folds bearing F sites, the KD values were negatively correlated with the Mg2+ concentration demonstrating the divalent metal gave stronger binding affinity.20 The hTelo G4 folds in K+-containing buffers with no Mg(OAc)2 added were studied with D210A-APE1 binding. Without Mg(OAc)2 present, the KD values increased suggesting this divalent metal facilitates APE1 binding to these G4 folds found in the telomere sequence (Fig. 4A). The endonuclease activity was also diminished without Mg(OAc)2 present (Fig. S3, ESI†). Another observation regarding APE1 interaction with G4 folds is that the intrinsically disordered N-terminal domain is essential for the lowest KD values measured (i.e., highest affinity).20,33 The N-terminal domain of D210A-APE1 was truncated by 33 or 61 amino acids and then studied for binding with the hTelo G4s in K+-containing buffers, identical to our previous report.20 The studies to inspect the dependency in G4 binding upon truncation of the N-terminal domain of APE1 found an increase in the KD values measured with shorter N-termini, which is consistent with the literature (Fig. 4B).20,33 The activity assays with the N-terminal domain truncated in the catalytically active APE1 did not significantly change (Fig. S4, ESI†). Prior studies of binding to dsDNA with the N-terminal domain truncated from APE1 found loss of this region had minimal impact on the KD value measured.20 These results provide further evidence that the intrinsically disordered N-terminal domain of APE1 binds G4 folds with a preference for parallel-stranded G4s.
Fig. 4. Binding of APE1 to the hTelo G4 in K+-containing buffers is dependent on the presence of (A) Mg2+ and (B) the N-terminal domain of the protein. The buffer composition was 20 mM Tris (pH 7.4 at 37 °C), 50 mM KOAc, 0 or 10 mM Mg(OAc)2, and 1 mM DTT for the Mg(OAc)2-dependent studies, and all components were identical for the N-terminal domain of APE1-dependent studies except the Mg(OAc)2 concentration was 10 mM.
Regarding the hTelo G4 sequences, APE1 endonuclease and binding assays were performed in Li+-containing buffers that are not compatible with G4 folding. These structural controls found the unfolded hTelo G4 sequences with an F site are cleaved by APE1 with a yield similar to ssDNA and have KD values for the DNA-protein complexes similar to ssDNA, as expected for an unfolded structure (Fig. 2A and Fig. S5, ESI†). This structural study suggests that the G4 topology is a key feature of APE1 binding.
The G4-structure dependency found in APE1 cleaving and binding promoter vs. hTelo G4s provides data for a hypothesis regarding which G4 topologies are suitable for gene regulation and those that are simply substrates for DNA repair. For gene regulation observed so far in cell culture, APE1 binds parallel-folded G4 topologies bearing an AP (F) site with high affinity and poor endonuclease activity. The G4 topology was identified via in vitro studies based on CD spectroscopic analysis; although we are not confident that the topology holds in cellulo in genomic or plasmid DNA, recent work in extended model systems shows that the inclusion of flanking duplex regions and a strand opposite did not significantly alter the c-MYC promoter G4 topology.45 Back to the point, the G4 topology allows the G4-APE1 complex to stall and function as a hub for transcription factor recruitment, a feature described for other regulatory proteins that bind G4s.46 Alternatively, hTelo G4s with an antiparallel orientation of the strands when containing an AP(F) are bound by APE1 with lower affinity and likely for a shorter timeframe that avoids inappropriate transcription factor recruitment.
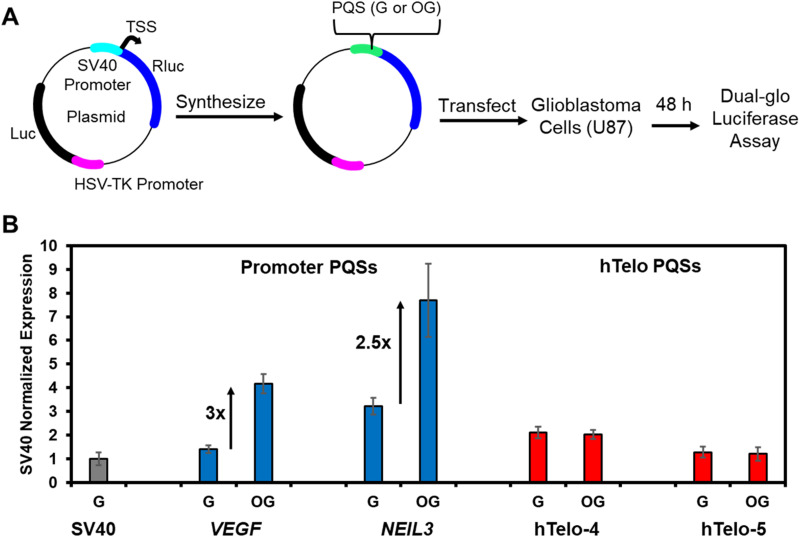
To test this idea, a plasmid-based system was designed and synthesized to monitor gene regulation when the hTelo sequence with and without OG was in the promoter of a reporter gene. This same plasmid construct was used to demonstrate that the VEGF and NEIL3 promoter PQSs were regulatory via G oxidation to OG to localize DNA repair and APE1 binding.20,36 Support of our hypothesis would be found if no gene induction occurred when the hTelo sequence with OG is located in the promoter of the reporter plasmid. Specifically based on our prior work, gene induction occurs best when the PQS and OG reside in the non-template (coding) strand upstream of the transcription start site (TSS) in the SV40 promoter regulating the Renilla luciferase (Rluc) gene;47 consequently, the two different lengths of hTelo sequences were introduced at the same site in the non-template strand of the Rluc gene to be studied as the native sequence with all G nucleotides or with OG incorporated at a single site similar to the sequences interrogated herein. The mammalian cells studied maintain normal levels of OGG1 to access the AP in the PQSs tested to determine whether the hTelo sequence can support gene regulation. The plasmid studied also has a luciferase (luc) gene that was not altered and could be used as an internal control for the quantification of gene expression (Fig. 5A).
Fig. 5. Gene regulation via OG in a promoter PQS is dependent on the G4 topology the sequence can adopt. (A) Outline of dual luciferase reporter plasmid to study the impact of OG in a promoter PQS to impact gene expression. (B) The RRR (=Rluc/Luc) value normalized to the original SV40 promoter illustrates the G4 topology that a PQS can adopt impacts gene expression. The data for the VEGF and NEIL3 promoter PQSs was previously reported by our laboratory.6,36 See the ESI† for complete details regarding the sequence studied.
Plasmids with the SV40 promoter, native hTelo, or OG-containing hTelo were transfected into human glioblastoma (U87-MG) cells. After incubation for 48 h, the Rluc and luc expression levels were quantified via a dual-glo luciferase assay. The data were normalized first to yield the relative response ratio (RRR = Rluc/luc), and then the RRR values were normalized against the value found for the original plasmid with the SV40 promoter. The hTelo four-track sequence with all G nucleotides resulted in a twofold greater expression level of Rluc when compared to the SV40 promoter (Fig. 5B). When OG was synthesized in the hTelo four-track sequence, there was no change in the Rluc expression measured (Fig. 5B). Regarding the hTelo five-track sequence, the native sequence produced Rluc expression nearly identical to that of the wild-type SV40 promoter, and again the presence of OG had no impact (Fig. 5B). These findings were compared to our prior work with the VEGF and NEIL3 PQSs with and without OG to find that the addition of the G-rich sequence enhances gene expression relative to the SV40 promoter; moreover, when OG was in the sequences capable of adopting parallel-stranded G4 topologies, the gene expression increased around threefold relative to all G-containing PQSs (Fig. 5B). The observation that the oxidation of G in the hTelo sequence, when located in a gene promoter, does not activate transcription supports our hypothesis that the topology of the G4 is the feature recognized by APE1 to determine gene regulation vs. DNA repair. A noteworthy point is that studies on the hTelo PQS to adopt a G4 topology in a promoter region of the genome with a complementary strand present have not been conducted. It is possible that the lack of a folded G4 topology in the promoter explains why the hTelo sequence failed to activate transcription; although, this also supports the conclusion that the G4 fold and likely its topology is important for gene activation by APE1 during oxidative stress.
The multifunctional protein APE1 can engage in gene regulation or DNA repair on genomic G4 folds containing AP. A gene regulatory role occurs when a promoter PQS in the dsDNA state is subject to G oxidation to OG, which localizes the DNA repair process.2 The initial chemistry occurring in dsDNA is important for the next events to happen in the gene regulation process. In dsDNA, OGG1 removes the oxidized base to yield an AP that is remodeled by APE1 to a high affinity parallel-stranded G4-APE1 complex. This complex allows the recruitment of transcription factors for gene regulation (Fig. 5B). The present studies demonstrate that G4 topology is a feature of the DNA recognized by APE1; the highest affinity (i.e., lowest KD value) occurs when the AP resides in a parallel-stranded G4 that is typical of regulatory G4s in gene promoters (Fig. 3B). In contrast, the hTelo sequence adopts hybrid-like topologies with AP in physiologically relevant K+-containing buffers that are poorly bound by APE1 and do not regulate gene expression (Fig. 3B and 5B). This was demonstrated via an in-cellulo assay that placed the hTelo sequence with an OG in a reporter gene to find that gene induction did not occur (Fig. 5B). This observation supports our hypothesis that G4 topology with an AP is a feature required for APE1 to switch to gene regulation away from DNA repair. At some later point, helicase resolution of the G4 might then return the AP to a duplex context for completion of repair.
The lower affinity interaction between APE1 and telomeric G4 folds can enable DNA repair to continue, although if the hTelo to be cleaved is in the single-stranded overhang of the telomere this could contribute to telomere shortening because any sequence 3′ to the cleavage site would be lost. However, in this region that is single stranded or G4 folded, G oxidation to OG is not a substrate for OGG1 yielding AP,34 which would avoid APE1 from clipping off the chromosome end during oxidative stress. This slow processing of DNA damage in G4 folds may contribute to the late DNA damage processing in telomeres leading to senescence.48 Modifications to DNA and the nucleic acid structure are key components to epigenetics; G oxidation to OG in dsDNA initiating base release and the unmasking of a G4 cue the epigenetic-like stress response,2 which contrasts with G4 folds being refractory to the writing of 5mC in the genome.49 The epigenetic landscape involving G4 folds and chemical modifications will require further studies to fully appreciate their biological impact. The data presented here provide new insight regarding APE1 recognition of different G4 shapes as a means to determine the function of this protein. The various G4 topologies differ in their grooves, exposure of the exterior G-tetrad faces for π stacking, capping base pairs, and steric effects associated with the loops that can cause the differences observed.50 There exist many future opportunities that extend from these findings to understand the G4-topological aspects of APE1 recognition. This G4 topological feature may occur with other protein interactions, particularly those at the interface of DNA damage, DNA repair and gene regulation.51,52
Experimental
Oligomer preparation
The oligonucleotides were synthesized and deprotected by the DNA/Peptide core facility at the University of Utah following standard protocols. The site-specific introduction of an AP analog was conducted by incorporating tetrahydrofuran (F), which is available as a commercial phosphoramidite, at the desired sites in the DNA sequence (Table 1). The oligonucleotides used for binding analysis were 5′ labeled with 6-carboxyfluorescein (FAM), which is available as a commercial phosphoramidite used for solid-phase synthesis of the strands. The crude oligonucleotides were purified using a semi-preparative, anion-exchange HPLC column running a mobile phase system consisting of A (1 M lithium chloride, 20 mM lithium acetate at pH 7 in 1 : 9 MeCN : ddH2O) and B (1 : 9 MeCN : ddH2O). The method was initiated at 1% B and increased to 100% B via a linear gradient over 30 min with a flow rate of 3 mL min−1 while monitoring absorbance at 260 nm. The purified samples were dialyzed against ddH2O for 18 h while changing the ddH2O three times to remove the purification salts, and then they were lyophilized to dryness followed by resuspension in ddH2O. The concentrations of the stock oligonucleotides were determined by measuring the absorbance at 260 nm and the nearest neighbor approximation for the extinction coefficient was used for the calculation of the concentration. The extinction coefficients for these oligonucleotides were estimated by omitting a nucleotide for the F sites. The G4 folds were produced by annealing the oligonucleotides at a 10 μM concentration in the different buffer systems described below by heating them to 90 °C for 5 min in a water bath followed by slow cooling to room temperature. The duplex folds were annealed the same way with the complement to the PQS added at a slight excess in 15 μM concentration. Once the structures were folded, they were stored at 4 °C overnight before further study.
Circular dichroism analysis
The oligonucleotide samples at 10 μM concentration were placed in a 0.1 mm quartz cuvette for circular dichroism (CD) analysis at 22 °C. The CD spectra were recorded from 220–320 nm. The spectra for the DNA strands had the background subtracted and then the ellipticity values obtained were converted to molar ellipticity values for visualization by plotting [θ] on the y-axis and wavelength (nm) on the x-axis.
Thermal melting analysis of APE1
The samples for thermal melting (Tm) analysis were first annealed at a 15 μM DNA concentration and then Tm values were determined in different buffer systems of pH 7.4 at 22 °C. The samples were placed in a quartz Tm analysis cuvette that was placed in a temperature-regulated UV-vis spectrometer (Shimadzu) followed by thermal equilibration at 20 °C before the commencement of the experiment. The sample was heated from 20 to 100 °C at a ramp rate of 0.5 °C min−1 followed by a 1-min equilibration and then measuring the absorbance value at 295 nm. The absorbance data collected were background subtracted, and then Tm values were determined using Shimadzu's Tm analysis software.
Expression and purification of recombinant APE1
Human wild-type APE1 was expressed from the pET28HIS-hAPE1 plasmid obtained from Addgene (#70757). The D210A-APE1 mutant that is catalytically inactive was constructed using the Q5 Site-Directed Mutagenesis Kit (NEB). The mutated plasmid was verified by Sanger sequencing. The APE1 proteins were expressed in BL21 (DE3) competent E. coli cells (NEB), grown at 37 °C until induced at OD = 0.6 with 100 μM IPTG, and then grown overnight at 37 °C. After harvesting by centrifugation, the cells were lysed by sonication in 20 mM sodium phosphate, 300 mM sodium chloride (pH 7.4) with 1 mM PMSF, and 5 mM BME. The lysate was pelleted at 18 000 × g for 30 min. The resulting supernatant was passed through HisPurTM Ni-NTA resin (Thermo Fisher Scientific) that was equilibrated with the lysate buffer. The proteins were eluted from the Ni-NTA column with a linear gradient of imidazole from 10 mM up to 250 mM. The proteins eluted at high imidazole concentration were buffer exchanged into 10 mM sodium phosphate (pH 7.4 at 25 °C), 50 mM NaCl, 1 mM DTT, and 50% glycerol. The resulting buffer-exchanged proteins were stored at −80 °C. The final concentrations were determined by NanoDrop One UV-vis spectrophotometer and confirmed via the Bradford assay.
Oligonucleotide radiolabeling protocol
The F-containing oligonucleotides were radiolabeled with 32P-ATP (PerkinElmer) at the 5′ end by T4-polynucleotide kinase (NEB) following a literature method.20 The radiolabeled oligonucleotides were purified using PD Spin-Trap™ G-25 columns (Cytiva). The samples contained a 2 : 3 molar ratio of the radiolabeled oligonucleotide to the non-radiolabeled oligonucleotide.
APE1 activity assays
The activity assays with APE1 were conducted by adding APE1 (3 nM) to 10 nM solutions of the pre-annealed and radiolabeled oligonucleotide at a 10 μL volume. The enzyme was added after a 15 min thermal equilibration at 37 °C. Enzyme and substrate were incubated at 37 °C for 60 min. The reactions were terminated by adding an equal volume (10 μL) of stop buffer (95% formamide, 10 mM EDTA, 10 mM NaOH, 0.1% bromophenol blue, 0.1% xylene cyanol, and 5% glycerol) followed by heat denaturing the mixture at 65 °C for 20 min. Assay mixtures without enzymes were used as negative controls. The samples were then analyzed using a 20% urea-denaturing PAGE. The gels were exposed on phosphorimager screens for 18 h and the bands were scanned with a Typhoon™ 9400 Variable Mode Imager (GE Amersham Biosciences) and quantified using ImageQuant™ Image Analysis Software. The percent yields were calculated by dividing the band intensity of the product (cleaved strand) by the summed band intensity of the product and the substrate (full-length strand). Error bars indicate the standard deviation of three independent experiments.
Fluorescence anisotropy binding assays
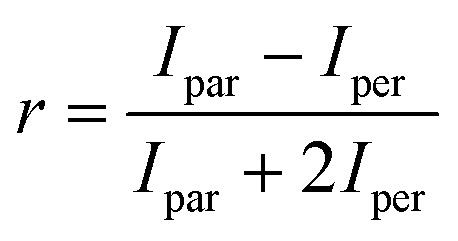
Fluorescence anisotropy measurements were used to quantify the binding of the D210A APE1 mutant to the FAM-labeled oligonucleotide substrates. The binding assays were carried out with 50 nM 5′-FAM-labeled oligonucleotide titrated with a concentration series of D210A APE1 ranging from 0 to 5000 nM. The oligonucleotide protein mixtures were incubated for 1 h at 22 °C before fluorescence analysis. Fluorescence anisotropy measurements were carried out on a BioTek Synergy2 Multi-Mode Microplate Reader. The excitation and emission wavelengths were 485 and 520 nm, respectively. The anisotropy values (r) were calculated with the eqn (1) where Ipar is the parallel emission intensity and Iper is the perpendicular emission intensity.
 |
1 |
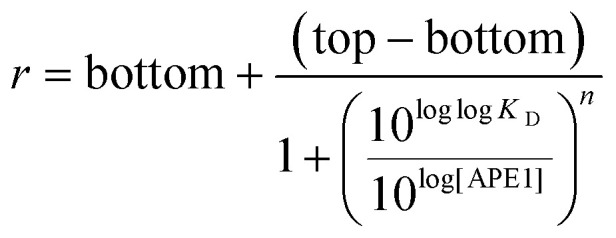
The r values obtained were plotted against the log[APE1] to produce sigmoidal curves that were fit to the following Hill equation (eqn (2)) where bottom is the lowest r value and top is the highest value of the sigmoidal curve. The dissociation-binding constant is KD and n is the Hill coefficient. Error bars indicate the standard deviation of three independent experiments.
 |
2 |
Plasmid preparation and in cellulo assays
Modification of the plasmid to contain the potential G4 in the promoter of a luciferase gene was achieved using a method previously outlined.6 Synthesis of plasmids containing site-specifically incorporated OG was achieved following a previously established protocol.6 Confirmation of the successful incorporation of the modification into the plasmids was performed by a gap ligation and Sanger sequencing protocol that we have reported.53 The complete details of the synthesis and PCR primers used can be found in the ESI.†
Human U87-MG glioblastoma cells (U87) were obtained from ATCC. All cells were grown in Dulbecco's Modified Eagle Medium supplemented with 10% fetal bovine serum, 20 μg mL−1 gentamicin, 1× glutamax, and 1× non-essential amino acids. The cells were grown at 37 °C with 5% CO2 at ∼80% relative humidity and were split when they reached ∼75% confluence. The transfection experiments were conducted in white, 96-well plates by seeding 3 × 10⁴ cells per well and then allowing them to grow for 24 h. After 24 h, the cells were transfected with 200–400 ng of plasmid per well using X-tremeGene HP DNA transfection agent (Roche) following the manufacturer's protocol in Opti-MEM media supplemented with 10% FBS. The dual-glo luciferase assay (Promega) was conducted following the manufacturer's protocol 48 h post-transfection. The transfection experiments were conducted at least four times and the errors reported represent 95% confidence intervals.
Conflicts of interest
The authors do not have conflicts of interest in this work.
Supplementary Material
Acknowledgments
The research was supported in part by the National Cancer Institute via grant no. R01 CA090689 and later by the National Institute of General Medical Sciences grant no. R35 GM145237. The DNA strand synthesis and Sanger sequencing were provided by the University of Utah Health Sciences Core facilities that are supported in part by a National Cancer Institute Cancer Center Support grant (P30 CA042014).
Electronic supplementary information (ESI) available. See DOI: https://doi.org/10.1039/d2cb00233g
References
- Hudson N. O. Buck-Koehntop B. A. Molecules. 2018;23:2555. doi: 10.3390/molecules23102555. [DOI] [PMC free article] [PubMed] [Google Scholar]
- Fleming A. M. Burrows C. J. J. Am. Chem. Soc. 2020;142:1115. doi: 10.1021/jacs.9b11050. [DOI] [PMC free article] [PubMed] [Google Scholar]
- Pan L. Zhu B. Hao W. Zeng X. et al. . J. Biol. Chem. 2016;291:25553. doi: 10.1074/jbc.M116.751453. [DOI] [PMC free article] [PubMed] [Google Scholar]
- Cogoi S. Ferino A. Miglietta G. Pedersen E. B. et al. . Nucleic Acids Res. 2018;46:661. doi: 10.1093/nar/gkx1142. [DOI] [PMC free article] [PubMed] [Google Scholar]
- Perillo B. Ombra M. N. Bertoni A. Cuozzo C. et al. . Science. 2008;319:202. doi: 10.1126/science.1147674. [DOI] [PubMed] [Google Scholar]
- Fleming A. M. Ding Y. Burrows C. J. Proc. Natl. Acad. Sci. U. S. A. 2017;114:2604. doi: 10.1073/pnas.1619809114. [DOI] [PMC free article] [PubMed] [Google Scholar]
- Fleming A. M. Burrows C. J. DNA Repair. 2017;56:75. doi: 10.1016/j.dnarep.2017.06.009. [DOI] [PMC free article] [PubMed] [Google Scholar]
- David S. S. O'Shea V. L. Kundu S. Nature. 2007;447:941. doi: 10.1038/nature05978. [DOI] [PMC free article] [PubMed] [Google Scholar]
- Ding Y. Fleming A. M. Burrows C. J. J. Am. Chem. Soc. 2017;139:2569. doi: 10.1021/jacs.6b12604. [DOI] [PMC free article] [PubMed] [Google Scholar]
- Wu J. McKeague M. Sturla S. J. J. Am. Chem. Soc. 2018;140:9783. doi: 10.1021/jacs.8b03715. [DOI] [PubMed] [Google Scholar]
- An J. Yin M. Yin J. Wu S. et al. . Nucleic Acids Res. 2021;49:12252. doi: 10.1093/nar/gkab1022. [DOI] [PMC free article] [PubMed] [Google Scholar]
- Fang Y. Zou P. Biochemistry. 2020;59:85. doi: 10.1021/acs.biochem.9b00782. [DOI] [PubMed] [Google Scholar]
- Amente S. Di Palo G. Scala G. Castrignanò T. et al. . Nucleic Acids Res. 2019;47:221. doi: 10.1093/nar/gky1152. [DOI] [PMC free article] [PubMed] [Google Scholar]
- Poetsch A. R. Boulton S. J. Luscombe N. M. Genome Biol. 2018;19:215. doi: 10.1186/s13059-018-1582-2. [DOI] [PMC free article] [PubMed] [Google Scholar]
- Antoniali G. Lirussi L. D'Ambrosio C. Dal Piaz F. et al. . Mol. Biol. Cell. 2014;25:532. doi: 10.1091/mbc.e13-05-0286. [DOI] [PMC free article] [PubMed] [Google Scholar]
- Genereux J. C. Barton J. K. Chem. Rev. 2010;110:1642. doi: 10.1021/cr900228f. [DOI] [PMC free article] [PubMed] [Google Scholar]
- Fleming A. M. Burrows C. J. Chem. Soc. Rev. 2020;49:6524. doi: 10.1039/D0CS00579G. [DOI] [PMC free article] [PubMed] [Google Scholar]
- Saito I. Takayama M. Sugiyama H. Nakatani K. et al. . J. Am. Chem. Soc. 1995;117:6406. doi: 10.1021/ja00128a050. [DOI] [Google Scholar]
- Merta T. J. Geacintov N. E. Shafirovich V. Photochem. Photobiol. 2019;95:244. doi: 10.1111/php.12926. [DOI] [PMC free article] [PubMed] [Google Scholar]
- Fleming A. M. Howpay Manage S. A. Burrows C. J. ACS Bio Med Chem Au. 2021;1:44. doi: 10.1021/acsbiomedchemau.1c00031. [DOI] [PMC free article] [PubMed] [Google Scholar]
- Clark D. W. Phang T. Edwards M. G. Geraci M. W. et al. . Free Radical Biol. Med. 2012;53:51. doi: 10.1016/j.freeradbiomed.2012.04.024. [DOI] [PMC free article] [PubMed] [Google Scholar]
- Roychoudhury S. Pramanik S. Harris H. L. Tarpley M. et al. . Proc. Natl. Acad. Sci. U. S. A. 2020;117:11409. doi: 10.1073/pnas.1912355117. [DOI] [PMC free article] [PubMed] [Google Scholar]
- Monsen R. C. Trent J. O. Chaires J. B. Acc. Chem. Res. 2022;55:3242–3252. doi: 10.1021/acs.accounts.2c00519. [DOI] [PubMed] [Google Scholar]
- Mergny J. L. Sen D. Chem. Rev. 2019;119:6290. doi: 10.1021/acs.chemrev.8b00629. [DOI] [PubMed] [Google Scholar]
- Patel D. J. Phan A. T. Kuryavyi V. Nucleic Acids Res. 2007;35:7429. doi: 10.1093/nar/gkm711. [DOI] [PMC free article] [PubMed] [Google Scholar]
- Phan A. T. Kuryavyi V. Luu K. N. Patel D. J. Nucleic Acids Res. 2007;35:6517. doi: 10.1093/nar/gkm706. [DOI] [PMC free article] [PubMed] [Google Scholar]
- Wang Y. Patel D. J. Structure. 1993;1:263. doi: 10.1016/0969-2126(93)90015-9. [DOI] [PubMed] [Google Scholar]
- Ambrus A. Chen D. Dai J. Bialis T. et al. . Nucleic Acids Res. 2006;34:2723. doi: 10.1093/nar/gkl348. [DOI] [PMC free article] [PubMed] [Google Scholar]
- An N. Fleming A. M. Burrows C. J. ACS Chem. Biol. 2016;11:500. doi: 10.1021/acschembio.5b00844. [DOI] [PMC free article] [PubMed] [Google Scholar]
- Fleming A. M. Zhou J. Wallace S. S. Burrows C. J. ACS Cent. Sci. 2015;1:226. doi: 10.1021/acscentsci.5b00202. [DOI] [PMC free article] [PubMed] [Google Scholar]
- Zhou J. Chan J. Lambele M. Yusufzai T. et al. . Cell Rep. 2017;20:2044. doi: 10.1016/j.celrep.2017.08.020. [DOI] [PMC free article] [PubMed] [Google Scholar]
- Fong Y. W. Cattoglio C. Tjian R. Mol. Cell. 2013;52:291. doi: 10.1016/j.molcel.2013.10.018. [DOI] [PMC free article] [PubMed] [Google Scholar]
- Burra S. Marasco D. Malfatti M. C. Antoniali G. et al. . DNA Repair. 2019;73:129. doi: 10.1016/j.dnarep.2018.11.010. [DOI] [PMC free article] [PubMed] [Google Scholar]
- Zhou J. Fleming A. M. Averill A. M. Burrows C. J. et al. . Nucleic Acids Res. 2015;43:4039. doi: 10.1093/nar/gkv252. [DOI] [PMC free article] [PubMed] [Google Scholar]
- Davletgildeeva A. T. Kuznetsova A. A. Fedorova O. S. Kuznetsov N. A. Front. Cell Dev. Biol. 2020;8:590848. doi: 10.3389/fcell.2020.590848. [DOI] [PMC free article] [PubMed] [Google Scholar]
- Fleming A. M. Zhu J. Howpay Manage S. A. Burrows C. J. J. Am. Chem. Soc. 2019;141:11036. doi: 10.1021/jacs.9b01847. [DOI] [PMC free article] [PubMed] [Google Scholar]
- Broxson C. Hayner J. N. Beckett J. Bloom L. B. et al. . Nucleic Acids Res. 2014;42:7708. doi: 10.1093/nar/gku417. [DOI] [PMC free article] [PubMed] [Google Scholar]
- Fleming A. M. Tran R. Omaga C. A. Howpay Manage S. A. et al. . Anal. Chem. 2022;94:15027. doi: 10.1021/acs.analchem.2c02951. [DOI] [PMC free article] [PubMed] [Google Scholar]
- Howpay Manage S. A. Fleming A. M. Chen H. N. Burrows C. J. ACS Chem. Biol. 2022;17:2583. doi: 10.1021/acschembio.2c00511. [DOI] [PMC free article] [PubMed] [Google Scholar]
- Schermerhorn K. M. Delaney S. Biochemistry. 2013;52:7669. doi: 10.1021/bi401218r. [DOI] [PMC free article] [PubMed] [Google Scholar]
- Bhattacharyya D. Mirihana Arachchilage G. Basu S. Front. Chem. 2016;4:38. doi: 10.3389/fchem.2016.00038. [DOI] [PMC free article] [PubMed] [Google Scholar]
- Del Villar-Guerra R. Trent J. O. Chaires J. B. Angew. Chem., Int. Ed. 2018;57:7171. doi: 10.1002/anie.201709184. [DOI] [PMC free article] [PubMed] [Google Scholar]
- Masuda Y. Bennett R. A. Demple B. J. Biol. Chem. 1998;273:30360. doi: 10.1074/jbc.273.46.30360. [DOI] [PubMed] [Google Scholar]
- Berquist B. R. McNeill D. R. Wilson, 3rd D. M. J. Mol. Biol. 2008;379:17. doi: 10.1016/j.jmb.2008.03.053. [DOI] [PMC free article] [PubMed] [Google Scholar]
- Monsen R. Chua E. Hopkins J. Chaires J. et al. . Res. Square. 2022 doi: 10.21203/rs.3.rs-1902173/v2. [DOI] [Google Scholar]
- Spiegel J. Cuesta S. M. Adhikari S. Hänsel-Hertsch R. et al. . Genome Biol. 2021;22:117. doi: 10.1186/s13059-021-02324-z. [DOI] [PMC free article] [PubMed] [Google Scholar]
- Fleming A. M. Zhu J. Ding Y. Burrows C. J. Nucleic Acids Res. 2019;47:5049. doi: 10.1093/nar/gkz207. [DOI] [PMC free article] [PubMed] [Google Scholar]
- Barnes R. P. de Rosa M. Thosar S. A. Detwiler A. C. et al. . Nat. Struct. Mol. Biol. 2022;29:639. doi: 10.1038/s41594-022-00790-y. [DOI] [PMC free article] [PubMed] [Google Scholar]
- Mao S. Q. Ghanbarian A. T. Spiegel J. Martínez Cuesta S. et al. . Nat. Struct. Mol. Biol. 2018;25:951. doi: 10.1038/s41594-018-0131-8. [DOI] [PMC free article] [PubMed] [Google Scholar]
- Chen L. Dickerhoff J. Sakai S. Yang D. Acc. Chem. Res. 2022;55:2628. doi: 10.1021/acs.accounts.2c00337. [DOI] [PMC free article] [PubMed] [Google Scholar]
- Linke R. Limmer M. Juranek S. A. Heine A. et al. . Int. J. Mol. Sci. 2021;22:12599. doi: 10.3390/ijms222212599. [DOI] [PMC free article] [PubMed] [Google Scholar]
- Robinson J. Raguseo F. Nuccio S. P. Liano D. et al. . Nucleic Acids Res. 2021;49:8419. doi: 10.1093/nar/gkab609. [DOI] [PMC free article] [PubMed] [Google Scholar]
- Riedl J. Fleming A. M. Burrows C. J. J. Am. Chem. Soc. 2015;138:491. doi: 10.1021/jacs.5b11563. [DOI] [PMC free article] [PubMed] [Google Scholar]
Associated Data
This section collects any data citations, data availability statements, or supplementary materials included in this article.


