

Abstract
Exposure to food cues activates the brain’s reward system and undermines efforts to regulate impulses to eat. During explicit regulation, lateral prefrontal cortex activates and modulates the activity in reward regions and decreases food cravings. However, the extent to which between-person differences in the recruitment of regions associated with reward processing, subjective valuation and regulation during food cue exposure—absent instructions to regulate—predict body composition and daily eating behaviors is unclear. In this preregistered study, we pooled data from five functional magnetic resonance imaging (fMRI) samples (N = 262) to examine whether regions associated with reward, valuation and regulation, as well as whole-brain pattern expression indexing these processes, were recruited during food cue exposure and associated with body composition and real-world eating behavior. Regression models for a single a priori analytic path indicated that univariate and multivariate measures of reward and valuation were associated with individual differences in body mass index and the enactment of daily food cravings. Specification curve analyses further revealed reliable associations between univariate and multivariate neural indicators of reactivity, regulation and valuation and all outcomes. These findings highlight the utility of these methods to elucidate brain–behavior associations and suggest that multiple processes are implicated in proximal and distal markers of eating behavior.
Keywords: reactivity, regulation, valuation, body composition, eating behavior, fMRI
Although health and well-being have improved for many over the last few centuries, preventable chronic illnesses remain a significant risk factor—even in developed countries. Greater insight is therefore needed into particular behavioral patterns, including over-eating, that modulate the risk of developing various conditions, including cardiovascular disease, type 2 diabetes and some forms of cancer. Translational neuroscience takes a comprehensive, multi-level approach to identify the relevant psychological processes and their neural correlates in order to effectively intervene on specific behaviors (Fisher and Berkman, 2015) and is a useful framework for addressing this issue. Specifically, it can be used to test competing theories about the brain as a predictor, moderator or mediator of health risk behaviors, including unregulated eating (Hall et al., 2018).
Foundational work in behavioral and cognitive neuroscience with animal and human models has demonstrated that exposure to appetitive cues reliably activates the brain’s reward system (Tang et al., 2012), promotes hedonically motivated eating via the mesolimbic dopamine pathway (Wang et al., 2002; Berridge, 2009) and can thwart people’s efforts to curb impulses to eat (e.g. Wagner et al., 2013). Food cue reactivity and craving are also reliably associated with increased eating and weight gain (Boswell and Kober, 2016). However, regulatory strategies, such as cognitive reappraisal, can dampen the strength of food cravings and modulate the activity in reward regions (Kober et al., 2010; Giuliani et al., 2014). Reappraisal reliably recruits the regions in dorsal and ventral lateral prefrontal cortex (d/vlPFC; Han et al., 2018), and activity in these regions is associated with successful self-control during food choice (Hare et al., 2009).
Building on this work to increase the predictive and ecological validity of brain-based measures of self-regulation of food cravings, some studies have adopted a ‘brain-as-predictor’ approach (Berkman and Falk, 2013) by characterizing brain–behavior relationships in the appetitive domain. For example, reward-related activity in the ventral striatum during incidental food cue exposure is prospectively predictive of momentary self-control failures, as captured by ecological momentary assessment (Lopez et al., 2014 2017), as well as long-term weight gain over a 6-month period (Demos et al., 2012). Activity in vlPFC/IFG (Lopez et al., 2014; Krönke et al., 2018) and the frontoparietal control network more broadly (Lopez et al., 2017) also promotes the successful resistance of daily self-control challenges. Notably, patterns of brain activity predictive of real-world self-control outcomes often account for variance above and beyond the self-reported measures (Berkman et al., 2011; Lopez et al., 2014; Krönke et al., 2018). However, the predictive utility of neural indicators might be increased if they are assessed in more ecologically valid contexts. Whereas most research to date has utilized controlled tasks to assess the neural activation during self-control, recent research has administered tasks and stimuli with fewer constraints and little to no instructions, enabling naturally occurring psychological processes to be captured (e.g. Reggente et al., 2018; Vanderwal et al., 2019). Indeed, this approach has been applied by measuring the brain activation associated with food cue reactivity and self-regulation in response to naturalistic food cues (i.e. food commercials; Rapuano et al., 2017; Lopez et al., 2019a) and during food choice (Cosme et al., 2020).
In the present study, we took a relatively unconstrained approach to better characterize the neural correlates of self-regulation of eating behaviors, as they might naturally and spontaneously occur. We were particularly interested in examining the engagement of multiple cognitive processes when participants were exposed to high-calorie, appetizing food items during an functional magnetic resonance imaging (fMRI) scanning session in which we measured the blood-oxygen-level-dependent signal. We adopted a framework recently proposed by Giuliani et al. (2018) that posits three overarching processes at play during food cue exposure that guide subsequent eating behavior: reactivity, regulation and subjective valuation, with specific neural systems supporting each process (Giuliani et al., 2018). We sought to determine the extent to which between-person differences in the recruitment of regions associated with reward processing, subjective valuation and regulation during food cue exposure—absent instructions to regulate—predict body composition and daily eating behaviors. To do so, we utilized existing data from several neuroimaging studies (Lopez et al., 2014, 2017, 2019b) in which healthy, college-aged adults completed a validated food cue reactivity task consisting of appetizing, high-calorie food images (Demos et al., 2012; Wagner et al., 2013; Lopez et al., 2014) in the magnetic resonance imaging (MRI) scanner. We also assessed body composition at the time of scanning. Following the scanning session, a subset of participants reported various aspects of their real-world eating behaviors for 1 week via a validated ecological momentary assessment protocol adapted from previous work (Hofmann et al., 2012).
We conducted preregistered analyses (https://osf.io/qsbpy) in which we computed both univariate and multivariate brain-based measures hypothesized to index the psychological processes of food cue reactivity, regulation and subjective valuation (Giuliani et al., 2018). For a priori univariate measures, we extracted aggregate reward-related activity from several regions of interest (i.e. ventral striatum bilaterally and lateral orbitofrontal cortex; Wagner et al., 2013) to index reactivity, aggregate activity in the frontoparietal control network (Dosenbach et al., 2007; Power et al., 2011) to capture regulatory processes and activity in a sub-region of ventromedial prefrontal cortex (vmPFC) that integrates multiple attributes during dietary choice behaviors (Tusche and Hutcherson, 2018) to index valuation.
To complement these univariate regions of interest (ROIs), we leveraged whole-brain patterns associated with reactivity, regulation, and valuation and calculated the individual expression of these patterns. Distributed patterns of neural activity associated with target psychological processes may be more sensitive than univariate indicators (Chang et al., 2015), and this approach has been shown to reliably index people’s conscious decisions to regulate negative emotions (Doré et al., 2017) as well as capture negative affective states during a threat-processing task (Kim et al., 2019). Another study showed that whole-brain patterns of activation that more closely resembled a meta-analytic map of cognitive reappraisal (Buhle et al., 2014) during exposure to emotionally evocative stimuli were linked with lower stress during the task, even when participants were not instructed to regulate (Shahane et al., 2019). While these studies utilized patterns derived from meta-analysis, others have utilized machine learning to develop whole-brain patterns indexing target psychological processes, also known as neural signatures (Wager et al., 2013; Chang et al., 2015; Woo et al., 2017). In the eating domain, Cosme et al. (2020) showed that patterns of activation indexing food craving regulation derived using machine learning exhibited greater out-of-sample accuracy than patterns derived from univariate contrasts when classifying whether people were regulating their food cravings or not (Cosme et al., 2020).
Here, we selected several a priori multivariate patterns representing the cognitive processes related to food cue reactivity, regulation, and valuation using whole-brain term maps from the NeuroSynth database (Yarkoni et al., 2011) as well as the aforementioned neural signature of food craving regulation (Cosme et al., 2020). Specifically, we categorized Neurosynth maps for ‘reward’ and ‘craving’ under reactivity, ‘cognitive control’ and the signature developed by Cosme et al. (2020) under regulation and the Neurosynth ‘value’ map under valuation, as per the tripartite framework cited above (Giuliani et al., 2018). For each participant and for each multivariate pattern, we computed pattern expression values, which can be interpreted as an index of how strongly the target cognitive process was engaged during exposure to appetizing food cues. We then fit a series of linear regression models to assess the degree to which each neural indicator was associated with proximal and distal aspects of eating behavior; namely, daily eating behavior and body composition.
However, due to the relatively large number of variables we were interested in and the numerous analytic decisions employed to operationalize them, we complemented these analyses by adopting a multiverse approach (Steegen et al., 2016) to assess the robustness of these brain–behavior associations and overcome issues related to undisclosed analytic flexibility (Simmons et al., 2011), which is often magnified in neuroimaging studies (e.g. there can be upwards of 69 000 workflows when analyzing fMRI data; Poldrack et al., 2017). Specifically, we employed specification curve analysis (SCA; Simonsohn et al., 2020) to assess how analytic decisions and inclusion of covariates affected the associations between criterion variables and univariate and multivariate neural indicators related to reactivity, regulation and valuation. This approach has been used within psychological research on technology use (Orben and Przybylski, 2019a,b), and recent work in cognitive neuroscience has highlighted the utility of SCA applications to neuroimaging research (Klapwijk et al., 2019; Flournoy et al., 2020). We argue that SCA is especially useful in translational contexts because it provides an explicit framework to test the effect of analytic decisions, which otherwise undisclosed might lead to increased false positives and lower overall translational value within the literature.
Across all analyses in this study, we had two sets of directional hypotheses about the relationships between univariate and multivariate neural indicators, and body composition and daily eating behaviors. First, we predicted that (i) ROI activity and pattern expression indexing reactivity and valuation would be positively associated with criterion variables (BMI, body fat percentage and proportion of daily food cravings enacted) and (ii) ROI activity and pattern expression indexing regulation would be negatively associated with criterion variables, with the neural signature of food craving regulation performing better since it may be a more specific indicator of regulation in this context. Second, given the theoretical importance of distributed processing during self-regulation (Kelley et al., 2015), and direct comparisons of the predictive validity of univariate and multivariate measures (Chang et al., 2015; Doré et al., 2017), we expected that multivariate pattern expression would be more strongly associated with the criterion variables than univariate ROI activity.
Method
Data and analysis scripts are available online: https://github.com/dcosme/RRV_scripts.
Participants
For this study, we pooled existing data from male and female young adults recruited from the Dartmouth community, many of whom were undergraduate students. While all present analyses are new and not reported elsewhere, some participants’ (N = 172) data were included in previously published research to test related but separable hypotheses (Lopez et al., 2014, 2017, 2019b). To be able to participate in the study, individuals were required to meet the following inclusion criteria: (i) be of at least 18 years of age and (ii) report no history of any neurological problem or psychiatric disorder. A total of 272 participants enrolled in these studies (226 females; Mage = 19.53; s.d.age = 1.58; age range: 18–28 years) and completed a food cue reactivity task while undergoing functional neuroimaging (fMRI) and body composition assessment. Following the procedures employed by previous food cue reactivity studies in our lab (e.g. Wagner et al., 2013), we instructed all participants to refrain from eating or drinking for at least 2 hours prior to the functional magnetic resonance imaging (fMRI) scanning session, so varying levels of hunger would not impact the imaging results. A subset of participants (N = 100, all female) also enrolled in a weeklong ecological momentary assessment (EMA) procedure in which they reported their daily eating patterns. Six participants were excluded due to poor data quality, three for problematic motion artifacts (see Methods) and one due to a structural anomaly, yielding a total of 262 participants. Of these, nine participants were missing the body mass index (BMI) measure and 12 were missing body fat percentage, yielding the following sample sizes for analysis: BMI N = 253, body fat percentage N = 250 and daily craving enactment N = 97.
In each study, participants were informed that we were interested in cognition and emotion in everyday life, to avoid revealing the true nature of our hypotheses and our focus on eating behaviors. Additionally, when we assessed body composition we alerted participants that we needed accurate body weight measurements from every participant for fMRI scanning. Upon completion of each study, participants were debriefed on the study’s overall goal to establish the links between brain activity and self-regulatory behaviors in the eating domain. All participants gave their informed consent according to protocols and guidelines set by Dartmouth’s Committee for the Protection of Human Subjects.
Cue reactivity task
We administered an event-related task that has been validated in previous cue reactivity studies and reliably elicits activity in regions associated with reward and self-regulation (Wagner et al., 2013; Lopez et al., 2014, 2017). Specifically, the participants viewed a series of images depicting appetizing foods, social scenes or nature scenes and were instructed to make a simple perceptual judgment (i.e. indicate whether the image was an indoor or outdoor scene) and, importantly, were not instructed to regulate their responses.
Body composition assessment
We measured BMI (kg/m2) and body fat percentage using a Tanita Total Body Composition Analyzer (model TBF-300A; Tanita Corporation, Arlington Heights, IL, USA). This is an acceptable method that is comparable to other techniques that use electrical impedance to estimate various metrics of body composition, including total body water and body fat percentage (Jebb et al., 2000).
Daily eating behavior assessment (EMA)
A subset of participants (N = 100) in the present sample enrolled in a weeklong EMA procedure adapted from previous work (Hofmann et al., 2012; Lopez et al., 2014) in which we assessed the various aspects of their daily eating behaviors. Given that studies have observed brain–behavior relationships with food craving enactment as a primary outcome of interest (Lopez et al., 2014, 2017), we focused on craving enactment as our main criterion measure to reflect real-world eating behavior. Additional measures were collected as part of the EMA procedure, but they were intended to test other hypotheses in previously published studies. Here, we focused on enactment because it is a valid and overt measure of outward eating behavior, as opposed to measures capturing inner psychological processes examined in prior work (e.g. the joint role of desire strength and positive/negative mood to predict self-regulation success and failure in Lopez et al., 2016). We computed craving enactment as the proportion of EMA pings for which participants answered ‘yes’ to the question: ‘Did you already consume some of the food you desired?’ relative to all pings in which participants reported a current or recent (≤20 minutes) craving.
Dietary restraint
We included sum scores from the 10-item Revised Restraint Scale, which captures two key facets of dieting, concern for dieting and weight fluctuations (Herman and Polivy, 1980; Heatherton et al., 1988), as a covariate in the specification curve analyses and in post-hoc cross-validation models (see Supplementary Material). Six participants did not complete this measure (N = 266).
Neuroimaging data acquisition and preprocessing
Additional details regarding neuroimaging acquisition information, preprocessing and first-level modeling procedures are provided in Supplementary Material. MRI data were preprocessed using fMRIPrep 1.1.4 (Esteban et al., 2019). Briefly, anatomical images were segmented and normalized to Montreal Neurological Institute (MNI) space using FreeSurfer (Fischl, 2012); functional images were susceptibility distortion corrected, realigned and coregistered to the normalized anatomical images. Preprocessed functional data were smoothed using a 6-mm full-width at half maximum smoothing kernel. At the first level, linear contrasts for each food stimulus type (i.e. snack, meal and dessert), and for the average of all food stimulus types, vs baseline rest, as well as vs nature, were estimated across runs for each participant.
Univariate ROI definition and parameter extraction
Univariate ROIs were selected from previous research on reward, regulation and valuation (Table 1) and were defined as 6-mm spheres around each seed region. For each participant and contrast, we extracted mean parameter estimates from each ROI using the 3dmaskave function in AFNI 18.2.04 (Cox, 1996). Parameter estimates were Z-scored within ROI to account for the differences in variability between ROIs. Outliers that were 3 s.d. from the mean (N = 388 or 1.12% of ROI scores) were winsorized to ±3 s.d. More details about the process of aggregation are listed in Supplementary Material.
Table 1.
Neural indicators
| Process | Neural indicator | Origin | Regions and MNI coordinates |
|---|---|---|---|
| Univariate ROIs | |||
| Reactivity | Reward | Wagner et al. (2013) | Right VS (9, 3, −6); Left VS (−9, 3, −6); OFC (−30, 33, −18) |
| Regulation | Cognitive control | Dosenbach et al. (2007); Power et al. (2011) | dlPFC (46, 28, 31; −44, 27, 33), MFG (44, 8, 34; −42, 7, 36), IPL (54, −44, 43; −53, −50, 39), IPS (32, −59, 41; −32, −58, 46) |
| Valuation | Value | Tusche and Hutcherson (2018) | vmPFC (−6, 49, 1) |
| Multivariate patterns | |||
| Reactivity | Reward | NeuroSynth: ‘reward’ | |
| Craving | NeuroSynth: ‘craving’ | ||
| Regulation | Cognitive control | NeuroSynth: ‘cognitive control’ | |
| Food craving regulation | Cosme et al. (2020) | ||
| Valuation | Value | NeuroSynth: ‘value’ |
Univariate ROIs were Z-scored across participants within ROI and then averaged across ROIs within each process to form aggregate predictors for reward and cognitive control. vmPFC = ventromedial prefrontal cortex, VS = ventral striatum, OFC = orbitofrontal cortex, dlPFC = dorsolateral prefrontal cortex, MFG = middle frontal gyrus, IPL = inferior parietal lobule, IPS = intraparietal sulcus.
Multivariate pattern expression values
We complemented the univariate ROI approach using multivariate patterns also presumed to index the same three overarching processes of reward, regulation and valuation (Table 1). We selected unthresholded meta-analytic maps derived from NeuroSynth (Yarkoni et al., 2011) for the following terms: ‘reward’ and ‘craving’ (for reactivity), ‘cognitive control’ (for regulation) and ‘value’ (for valuation). We expected that association maps—which indicate how much more likely an activation is reported in each region given a term is present (vs absent from a paper)—to be better predictors of criterion variables because they should be more specific indicators of a psychological process. However, we also included uniformity maps—which simply index how consistently a region is activated in studies including a given term—to test this hypothesis directly. Therefore, for each psychological process, we included two meta-analytic maps corresponding to the association and uniformity tests on NeuroSynth. We also included a single unthresholded, whole-brain neural signature of food craving regulation (Cosme et al., 2020) as a secondary measure of cognitive control specific to food craving. We assessed the degree to which participants expressed the patterns of interest by treating each multivariate pattern and each participant-level condition contrast as a vector of weights and taking the dot product of each combination (Doré et al., 2017; Cosme et al., 2020) using the 3ddot function in AFNI. This process yields one scalar ‘pattern expression value’ (PEV) for each condition and multivariate pattern, and this can generally be interpreted as a relative evidence for the target/referent psychological process being present or engaged for that participant. As with the univariate ROIs, we Z-scored the PEVs within each multivariate map and test (i.e. association or uniformity), and the outliers that were 3 s.d. from the mean (Nassociation = 135 or 0.94% of PEVs; Nuniformity = 128 or 1.11% of PEVs) were winsorized to ±3 s.d.
A priori regression analysis
We ran a series of linear regression models to compare the degree to which activation in univariate ROIs and multivariate patterns was associated with the body composition and daily eating behavior and identify the overall best-fitting model. We focused on a single a priori path of analytic decisions that included extracting neural measures from the food > nature contrast (i.e. the average across all food stimulus types) and utilizing meta-analytic maps generated via association tests on NeuroSynth. These decisions constituted our a priori analytic path, which seemed most justified based on the literature and theoretical expectations. We Z-scored criterion variables and regressed each criterion on all nested combinations of the neural indicators and compared the models using a four-step process: First, for each criterion variable, we fit a null model with the intercept as the only predictor. Then, we fit the models with the univariate ROIs as predictors and selected the best-fitting model using the Akaike Information Criterion (AIC) as the model fit index. Next, we followed the same procedure for the models with multivariate PEVs as predictors. Finally, we fit a single model for each criterion combining the predictors from the best-fitting univariate ROI and multivariate PEV models. We then compared these four models to determine whether the neural indicators explained the additional variance beyond the null model, and if so, whether univariate ROIs, multivariate PEVs or both best fit the data.
To assess the stability of the overall best-fitting model, we used 5-fold cross-validation repeated five times implemented using the caret package (Kuhn, 2008) in R (R Core Team, 2019). That is, we partitioned the data into five equally divided folds and fit the best-fitting model for each criterion variable five times holding one of the folds out each time. Although we preregistered doing this procedure once, we repeated this procedure five times, shuffling the data in each partition, for a total of 25 estimates of each best-fitting model, in order to get better estimates of model stability. This allowed us to estimate the degree of variability in variance explained and error for each best-fitting model specification. Post-hoc models including sex and dietary restraint are reported in Supplementary Material.
Specification curve analysis
A primary goal of this study was to determine which neural indicators of reactivity, regulation and value (if any) are reliably associated with the body composition and daily eating behavior. Because there are a vast number of potential predictor variables and analytic decisions (e.g. using association vs uniformity meta-analytic maps, using nature or baseline rest as a control condition), we used specification curve analysis (SCA; Simonsohn et al., 2020) to robustly characterize which neural indicators were most reliably associated with the criterion (outcome) variables. In brief, SCA is a framework for mapping the ‘multiverse’ of possible models that could be reasonably specified to test a research question (Steegen et al., 2016). Rather than specifying one or a handful of models to test a hypothesis, all (or a large subset) of the theoretically justified models are specified and inferential statistics (e.g. the median effect and number of statistically significant positive or negative effects) are conducted across model specifications. This provides an opportunity to investigate how a given hypothesis test changes as a function of various analytic decisions, as well as uncover novel insights from patterns in the specification curve not otherwise discernable.
Here, we used SCAs in two ways. First, we focused on each criterion variable separately to assess which neural indicators were most reliably associated with them. For each criterion variable, we specified 1976 unique models (1820 for food craving enactment as sex was not included as a covariate since the sample was all female) using the specr package (Masur and Scharkow, 2019) in R that included the univariate ROIs and multivariate PEVs as the predictors of interest. In each model, a single neural indicator was specified as the predictor of interest and we assessed how its association with each outcome changed as a function of analytic decisions and covariates included in the model. Specifically, we assessed the effect of stimulus type operationalization (snack, meal, dessert or their average food), control contrast (nature, baseline rest or their average) and meta-analytic test type for multivariate PEVs from NeuroSynth (association or uniformity) by including these dummy-coded variables (or not) in each model specification. We assessed the effect of including sex, dietary restraint and other neural indicators as covariates by including each covariate separately, all covariates or no covariate. For each model specification, the standardized regression coefficients for each predictor of interest were then extracted, ordered by effect size and plotted to form a specification curve. For each model specification in the curve, we visualized which neural indicator was the predictor of interest and the set of analytic decisions used in the model. We also highlight the parameter estimates for the variables from the best-fitting a priori ROI and PEV models identified in the cross-validated regression model comparison to visualize where these effects fall within the curve of possible model specifications.
Second, we focused on each neural indicator individually in order to conduct inferential statistics for each set of indicator–outcome specifications. Specifically, we calculated the median standardized regression coefficient across all model specifications, as well as the proportion of statistically significant positive and negative coefficients, and used bootstrapping to generate confidence intervals around the curve medians and assess how inconsistent the observed curve parameters were with the null hypothesis of no relationship between each indicator–outcome pair. The methodological details for each type of bootstrapping are described in Supplementary Material.
Results
Descriptives
Means, standard deviations, and correlations for the variables in the cross-validated regression model comparison are listed in Table 2. Supplementary figures visualizing outcome distributions (Supplementary Figure S1) and mean parameter estimates as a function of neural indicator, stimulus type, control contrast and meta-analytic test type are provided in Supplementary Material (Supplementary Figures S2–S3).
Table 2.
Means, standard deviations and correlations among variables in the cross-validated regression model comparison, and dietary restraint
| Variable | M | s.d. | 1 | 2 | 3 | 4 | 5 | 6 | 7 | 8 | 9 | 10 | 11 |
|---|---|---|---|---|---|---|---|---|---|---|---|---|---|
| 1. BMI | 23.19 | 3.36 | |||||||||||
| 2. Body fat percentage | 25.43 | 8.00 | 0.66*** | ||||||||||
| 3. Enactment | 0.47 | 0.22 | −0.13 | −0.20* | |||||||||
| 4. Reward ROI | 0.06 | 0.50 | −0.12* | −0.07 | 0.21* | ||||||||
| 5. Reward PEV | 0.07 | 0.77 | −002 | −0.07 | 0.31** | 0.62*** | |||||||
| 6. Craving PEV | −0.13 | 0.76 | −0.02 | −0.07 | 0.21* | 0.47*** | 0.81*** | ||||||
| 7. Cognitive control ROI | −0.13 | 0.50 | −0.02 | −0.03 | 0.01 | 0.31*** | 0.47*** | 0.45*** | |||||
| 8. Cognitive control PEV | −0.11 | 0.78 | −0.06 | −0.06 | 0.05 | 0.41*** | 0.59*** | 0.54*** | 0.91*** | ||||
| 9. Craving regulation PEV | 0.40 | 0.67 | 0.10 | 0.02 | 0.03 | 0.08 | 0.19** | 0.24*** | 0.21*** | 0.23*** | |||
| 10. Value ROI | 0.40 | 0.68 | 0.06 | 0.01 | 0.23* | 0.30*** | 0.58*** | 0.51*** | 0.06 | 0.16** | 0.28*** | ||
| 11. Value PEV | 0.28 | 0.77 | 0.00 | −0.04 | 0.29** | 0.60*** | 0.91*** | 0.76*** | 0.30*** | 0.40*** | 0.15* | 0.65*** | |
| 12. Dietary restraint | 16.9 | 8.10 | 0.24*** | 0.36*** | 0.14 | −0.02 | 0.01 | 0.10 | −0.15* | −0.13* | 0.02 | 0.14* | 0.07 |
P < 0.10, *P < 0.05, **P < 0.01, ***P < 0.001.
A priori regression analysis
BMI.
Model comparison of the neural indicators specified from a single analytic path revealed that the combined model including the reward and value ROIs and the craving regulation PEV best fit the BMI data and explained the additional variance beyond the null model (AICdiff = −2.59). However, this model only marginally fit the data better than the best-fitting ROI model (AICdiff = −0.18). In the combined model, the reward ROI (to index reactivity) was negatively rather than positively associated with BMI (β = −0.31, P = 0.019) and while positive as expected, the value ROI (vmPFC, to index valuation) was not statistically significant (β = 0.12, P = 0.243). Furthermore, while we expected the craving regulation PEV to be negatively associated with BMI, the observed effect was positive and did not differ significantly from zero (β = 0.14, P = 0.144). All results are listed in Table 3.
Table 3.
Results and model fit indices for each outcome variable
| BMI | AIC | R 2 (s.d.) | RMSE (s.d.) | Process | Parameter | β [95% CI] | SE | t | P |
|---|---|---|---|---|---|---|---|---|---|
| Combined* | 721.56 | 0.04 (0.05) | 1.00 (0.13) | Intercept | −0.07 [−0.23, 0.08] | 0.08 | −0.94 | 0.347 | |
| Reactivity | Reward ROI | −0.31 [−0.56, −0.05] | 0.13 | −2.37 | 0.019 | ||||
| Regulation | Craving reg. PEV | 0.14 [−0.05, 0.34] | 0.10 | 1.47 | 0.144 | ||||
| Valuation | Value ROI | 0.12 [−0.08, 0.31] | 0.10 | 1.17 | 0.243 | ||||
| ROI* | 721.74 | 0.03 (0.05) | 1.00 (0.11) | Intercept | −0.03 [−0.17, 0.11] | 0.07 | −0.43 | 0.667 | |
| Reactivity | Reward ROI | −0.31 [−0.56, −0.05] | 0.13 | −2.35 | 0.020 | ||||
| Valuation | Value ROI | 0.16 [−0.03, 0.35] | 0.10 | 1.61 | 0.108 | ||||
| PEV | 723.45 | 0.02 (0.03) | 0.99 (0.14) | Intercept | −0.05 [−0.19, 0.10] | 0.07 | −0.67 | 0.507 | |
| Regulation | Craving reg. PEV | 0.16 [−0.03, 0.34] | 0.09 | 1.64 | 0.102 | ||||
| Null | 724.15 | – | – | Intercept | 0.01 [−0.11, 0.14] | 0.06 | 0.21 | 0.837 | |
| Body fat | AIC | r 2 (s.d.) | RMSE (s.d.) | Process | Parameter | β [95% CI] | SE | t | p |
| Null | 712.18 | – | – | Intercept | 0.02 [−0.11, 0.14] | 0.06 | 0.27 | 0.791 | |
| ROI | 712.92 | 0.02 (0.02) | 1.00 (0.05) | Intercept | 0.02 [−0.10, 0.15] | 0.06 | 0.38 | 0.706 | |
| Reactivity | Reward ROI | −0.14 [−0.39, 0.11] | 0.13 | −1.12 | 0.265 | ||||
| PEV | 712.94 | 0.03 (0.04) | 1.00 (0.07) | Intercept | 0.00 [−0.12, 0.13] | 0.06 | 0.05 | 0.960 | |
| Reactivity | Craving PEV | −0.09 [−0.26, 0.07] | 0.08 | −1.11 | 0.268 | ||||
| Combined | 714.49 | 0.03 (0.03) | 1.01 (0.06) | Intercept | 0.01 [−0.12, 0.14] | 0.07 | 0.19 | 0.849 | |
| Reactivity | Reward ROI | −0.09 [−0.38, 0.19] | 0.14 | −0.66 | 0.508 | ||||
| Reactivity | Craving PEV | −0.06 [−0.25, 0.13] | 0.10 | −0.65 | 0.516 | ||||
| Enactment | AIC | r 2 (s.d.) | RMSE (s.d.) | Process | Parameter | β [95% CI] | SE | t | p |
| PEV* | 270.78 | 0.15 (0.13) | 0.96 (0.16) | Intercept | −0.06 [−0.26, 0.13] | 0.10 | −0.64 | 0.525 | |
| Reactivity | Reward PEV | 0.37 [0.14, 0.59] | 0.11 | 3.19 | 0.002 | ||||
| Combined* | 272.11 | 0.12 (0.11) | 0.97 (0.11) | Intercept | −0.11 [−0.35, 0.12] | 0.12 | −0.97 | 0.332 | |
| Reactivity | Reward PEV | 0.31 [0.05, 0.58] | 0.13 | 2.33 | 0.022 | ||||
| Valuation | Value ROI | 0.13 [−0.19, 0.45] | 0.16 | 0.81 | 0.419 | ||||
| ROI* | 275.56 | 0.11 (0.09) | 0.99 (0.08) | Intercept | −0.16 [−0.39, 0.08] | 0.12 | −1.32 | 0.189 | |
| Valuation | Value ROI | 0.32 [0.04, 0.60] | 0.14 | 2.27 | 0.026 | ||||
| Null | 278.66 | – | – | Intercept | −0.01 [−0.21, 0.19] | 0.10 | −0.10 | 0.918 |
Models for each outcome are ordered based on AIC. Standard deviations for R2 and RMSE were generated during cross-validation. It was not possible to run cross-validation for the null models. All variables were Z-scored across participants. Asterisks indicate statistically significant better model fit compared to the null model at P < 0.05. Craving reg. = Craving regulation.
Body fat percentage.
Contrary to our hypothesis, neither the ROI, the PEV or the combined model better fit the data than the null model containing the intercept as the only predictor (Table 3).
Enactment.
The neural indicator models explained the additional variance beyond the null model, and overall, the best-fitting PEV model best fit the data. As expected, in this model, the multivariate reward PEV indexing reactivity was positively associated with desire enactment (β = 0.37, P = 0.002).
Specification curve analysis
We expected that (i) neural indices of reactivity (reward ROIs and reward and craving PEVs) and valuation (vmPFC ROI and value PEV) would be positively associated with outcomes, whereas indices of regulation would be negatively associated with them, and (ii) these relationships would be stronger for multivariate PEVs relative to univariate ROIs. Figure 1 shows that there were reliable positive and negative associations across the specified analytic paths for a subset of the neural indicators and outcomes. It also shows that the parameter estimates from the best-fitting a priori ROI and PEV models tended to be toward the positive and negative extremes of the curves, but were not the largest regression coefficients. In general, body fat percentage showed the weakest relationships (i.e. median curve coefficients) with the neural indicators, while food craving enactment showed the strongest relationships (Figure 2; Table 4). Overall, the pattern of results did not indicate that multivariate PEVs showed consistently stronger relationships with the outcomes. Individual neural indicator curves and median effects are visualized in Figure 2; inferential statistics are reported in Table 4. More detailed specification curves for each neural indicator are provided in Supplementary Material.
Fig. 1.
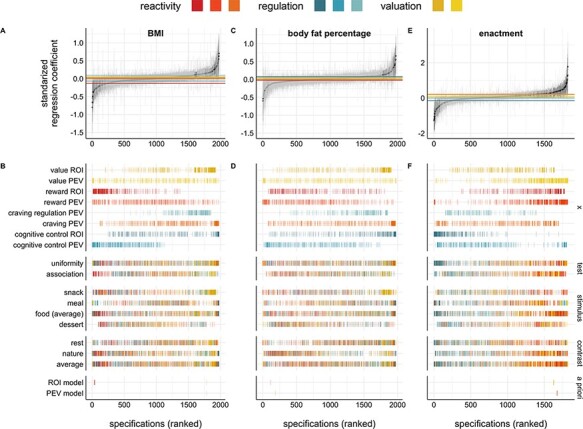
Specification curves for each outcome (BMI, body fat percentage and food craving enactment). The top panel depicts the association between neural indicators (x) and (A) BMI, (C) body fat percentage and (E) enactment. Each dot represents the standardized regression coefficient for the neural indicator from a unique model specification with a 95% confidence interval around it. Model specifications are ordered by the regression coefficient; models for which the regression coefficient of interest was statistically significant at P < 0.05 are visualized in black, whereas coefficients P > 0.05 are in gray. The colored horizontal lines represent the median regression coefficient of the curve for each neural indicator, separately. The bottom panels show the neural indicators and analytic decisions that were included in each model specification for (B) BMI, (D) body fat percentage and (F) enactment. Model specifications are colored based on the neural indicator; models for which the regression coefficient of interest was statistically significant at P < 0.05 are visualized are opaque, whereas coefficients P > 0.05 are partially opaque. Models under the a priori label highlight the neural indicators from the best-fitting ROI and PEV models listed in Table 3. Test = whether multivariate covariates were derived from association or uniformity tests on NeuroSynth.org; stimulus = food stimulus type during the cue reactivity task; contrast = control contrast; average = the average across condition (i.e. across food types or control contrasts).
Fig. 2.

Specification curve comparison for each neural indicator and outcome. The top panel shows separate specification curves for each neural indicator and (A) BMI, (C) body fat percentage and (E) food craving enactment. Within each curve, models are ordered by regression coefficient. The bottom panel shows the median effect (standardized regression coefficient) from the curve for each neural indicator, (B) BMI, (D) body fat percentage and (F) food craving enactment. Error bars are bootstrapped 95% CIs around the median regression coefficient of the curve. Asterisks indicate a statistically significant share of positive or negative associations in the curve at P <0.05.
Table 4.
Bootstrapped results from the specification curve analyses for each outcome variable
| Model/Process | Neural indicator | Median standardized regression coefficient | Number of significant negative associations | Number of significant positive associations | |||
|---|---|---|---|---|---|---|---|
| BMI | β [95% CI] | p | N | p | N | p | |
| Reactivity | Reward ROI | −0.13 [−0.24, −0.02] | <0.001 | 22 | <0.001 | 0 | 1.000 |
| Reward PEV | −0.00 [−0.08, 0.05] | 0.391 | 5 | 0.764 | 1 | 1.000 | |
| Craving PEV | 0.04 [0.01, 0.13] | <0.001 | 2 | 0.989 | 17 | <0.001 | |
| Regulation | Cognitive control ROI | 0.02 [−0.04, 0.20] | 0.033 | 0 | 1.000 | 9 | 0.223 |
| Cognitive control PEV | −0.07 [−0.16, −0.04] | <0.001 | 22 | <0.001 | 0 | 1.000 | |
| Craving regulation PEV | 0.09 [0.03, 0.16] | <0.001 | 0 | 1.000 | 17 | <0.001 | |
| Valuation | Value ROI | 0.05 [0.02, 0.14] | <0.001 | 0 | 1.000 | 56 | <0.001 |
| Value PEV | 0.02 [−0.05, 0.09] | <0.001 | 7 | 0.680 | 6 | 0.740 | |
| Body fat | β [95% CI] | P | N | P | N | P | |
| Reactivity | Reward ROI | −0.02 [−0.12, 0.08] | 0.012 | 0 | 1.000 | 0 | 1.000 |
| Reward PEV | −0.01 [−0.10, 0.03] | 0.043 | 4 | 0.948 | 0 | 1.000 | |
| Craving PEV | 0.04 [−0.00, 0.12] | <0.001 | 1 | 1.000 | 15 | 0.012 | |
| Regulation | Cognitive control ROI | 0.08 [−0.00, 0.21] | <0.001 | 0 | 1.000 | 12 | 0.009 |
| Cognitive control PEV | −0.01 [−0.09, 0.03] | 0.007 | 2 | 0.997 | 0 | 1.000 | |
| Craving regulation PEV | 0.06 [−0.01, 0.12] | <0.001 | 0 | 1.000 | 10 | 0.027 | |
| Valuation | Value ROI | 0.04 [−0.00, 0.12] | <0.001 | 0 | 1.000 | 35 | <0.001 |
| Value PEV | 0.01[−0.06, 0.07] | 0.012 | 1 | 1.000 | 1 | 1.000 | |
| Enactment | β [95% CI] | P | N | P | N | P | |
| Reactivity | Reward ROI | 0.19 [0.03, 0.33] | <0.001 | 0 | 1.000 | 24 | <0.001 |
| Reward PEV | 0.21 [0.13, 0.33] | <0.001 | 2 | 0.992 | 99 | <0.001 | |
| Craving PEV | 0.07 [−0.06, 0.11] | <0.001 | 7 | 0.421 | 23 | <0.001 | |
| Regulation | Cognitive control ROI | −0.15 [−0.38, −0.10] | <0.001 | 34 | <0.001 | 0 | 1.000 |
| Cognitive control PEV | 0.00 [−0.08, 0.09] | 0.324 | 8 | 0.387 | 10 | 0.063 | |
| Craving regulation PEV | −0.01 [−0.11, 0.07] | 0.347 | 1 | 0.999 | 0 | 1.000 | |
| Valuation | Value ROI | 0.07 [−0.02, 0.18] | <0.001 | 0 | 1.000 | 19 | <0.001 |
| Value PEV | 0.19 [0.14, 0.33] | <0.001 | 0 | 1.000 | 81 | <0.001 | |
N = the number of models in each observed specification curve analysis in which the regression coefficient was statistically significant at p < 0.05. 95% CIs were bootstrapped with 1000 samples. See Supplementary Material for methodological details related to the bootstrapped confidence intervals and P values.
BMI.
As expected, both valuation indicators showed positive median effects (ROI: β = 0.05, 95% confidence interval [CI] [0.02, 0.14], P < 0.001; PEV: β = 0.02, 95% CI [−0.05, 0.09], P < 0.001) that differed from the null distribution. However, the number of positive associations that were statistically significant only differed from the null distribution for the valuation ROI (ROI: N = 56, P < 0.001; PEV: N = 6, P = 0.740; Figure 2A–B). The craving PEV, indexing reactivity, also showed the expected positive median effect (β = 0.04, 95% CI [0.01, 0.13], P < 0.001), and the number of significant positive associations was higher than expected in the null distribution (N = 17, P < 0.001). However, in contrast to our hypothesis, the reward ROI (also hypothesized to index reactivity) was negatively associated with BMI across specifications (β = −0.13, 95% CI [−0.24, −0.02], P < 0.001; N = 22, P < 0.001) and the reward PEV (reactivity) showed a median effect of zero (β = −0.00, 95% CI [−0.08, 0.05], P = 0.391). As expected, the cognitive control PEV (indexing regulation) was negatively associated with BMI (β = −0.07, 95% CI [−0.16, −0.04], P < 0.001; N = 22, P < 0.001). However, the relationship between BMI and the cognitive control ROI (regulation) was mixed. While the median effect differed from the null distribution (β = 0.02, 95% CI [−0.04, 0.20], P = 0.033), the bootstrapped confidence interval included zero and the share of positive significant results did not (N = 9, P = 0.223). In addition, the craving regulation PEV was positively rather than negatively associated with BMI (β = 0.09, 95% CI [0.03, 0.16], P < 0.001; N = 17, P < 0.001). All parameter estimates and statistics are listed in Table 4.
Body fat percentage.
The craving PEV (β = 0.04, 95% CI [−0.00, 0.12], P < 0.001; N = 15, P = 0.012) and value ROI (β = 0.04, 95% CI [−0.00, 0.12], P < 0.001; N = 35, P < 0.001), indexing reactivity and valuation, respectively, were positively associated with body fat percentage as expected (Figure 2C–D). Contrary to our hypotheses, indicators of regulation, namely the cognitive control ROI (β = 0.08, 95% CI [−0.00, 0.21], P < 0.001; N = 12, P = 0.009) and craving regulation PEV (β = 0.06, 95% CI [−0.01, 0.12], P < 0.001; N = 10, P = 0.027), were positively associated with body fat percentage. Other indicators of reactivity, regulation, and valuation did not show clear positive or negative associations with body fat percentage (Table 4).
Enactment.
With respect to enactment (Figure 2E–F), these associations were largely in the predicted direction. Key indicators of reactivity (reward ROI: β = 0.19, 95% CI [0.03, 0.33], P < 0.001; reward PEV: β = 0.21, 95% CI [0.13, 0.33], P < 0.001; craving PEV β = 0.07, 95% CI [−0.06, 0.11], P < 0.001) and valuation (value ROI: β = 0.07, 95% CI [−0.02, 0.18], P < 0.001; value PEV: β = 0.19, 95% CI [0.14, 0.33], P < 0.001) had positive median associations with enactment, whereas an indicator of regulation, the cognitive control ROI, was negatively associated with it (β = −0.15, 95% CI [−0.38, −0.10], P < 0.001). Contrary to expectations, the multivariate indicators of regulation showed median effects of zero for the cognitive control PEV (β = −0.00, 95% CI [−0.08, 0.09], P = 0.324) and craving regulation PEV (β = −0.01, 95% CI [−0.11, 0.07], P = 0.347). These median effects were mirrored in the number of statistically significant positive and negative associations (Table 4).
Discussion
In this study, we tested the degree to which univariate and multivariate neural indicators of food cue reactivity, regulation, and valuation were related to body composition and daily eating behavior and identified robust associations in a large sample of young adults. The strongest and most consistent associations across model specifications were observed for the frequency of enactment of daily food cravings. Although largely consistent with the a priori regression analyses, specification curve analyses revealed additional reliable associations, highlighting the benefit of explicitly testing the effects of analytic decisions. Overall, the findings indicate that the extent to which individuals spontaneously recruited discrete brain regions and instantiated whole-brain patterns indexing food cue reactivity, regulation and valuation was related to both the proximal and distal markers of eating behavior. Specifically, neural indicators of reactivity (the reward ROI and multivariate pattern and craving multivariate pattern) and valuation (the value ROI and multivariate pattern) were the most reliable predictors across criterion variables and had the greatest number of significant associations (across processes and both univariate and multivariate measures) when predicting people’s enactment of daily food cravings.
First, we assessed these associations for a single a priori analytic path and used model comparison to identify the best-fitting models for each outcome. Overall, the most reliable neural indicators were those that indexed reward processing; the reward ROI was surprisingly negatively associated with BMI and the reward PEV was positively associated with food craving enactment. There were no other statistically significant associations in these models and neural indicators did not explain additional variance beyond a null model for body fat percentage. It is also notable that these neural indicators explained more variance for craving enactment than BMI or body fat percentage, suggesting a stronger relationship with more proximal processes related to eating behavior.
Next, we conducted specification curve analyses to assess the reliability of these effects across other reasonable model specifications. The SCAs were consistent with the a priori regression models in that neural indicators of reactivity were reliably associated with BMI and food craving enactment across models, but also revealed additional robust associations. Overall, we did not find evidence that multivariate pattern expression values were better predictors of outcomes than univariate ROI activation (Chang et al., 2015; Doré et al., 2017). Instead, while they tended to be in the same direction for each process, the strength of the relationships varied as a function of process and outcome, suggesting univariate and multivariate indicators may have a complementary predictive value. For example, when predicting enactment, both univariate activity in the reward ROI [i.e. bilateral ventral striatum and orbitofrontal cortex (OFC)] and whole-brain pattern expression of the ‘reward’ Neurosynth map emerged as the reliable positive predictors of enactment.
BMI
With respect to BMI, several univariate and multivariate neural indicators were associated with BMI, and the majority of these were in the hypothesized direction. Specifically, we observed consistent positive associations between BMI and the value ROI and the craving PEV, while the cognitive control PEV was negatively associated with BMI. However, the reward ROI was consistently negatively associated with BMI, whereas the craving regulation PEV was positively associated, and the cognitive control ROI, value PEV and reward PEV were not strongly associated with BMI. Although the relationship between the reward ROI and BMI was in the opposite direction than hypothesized, this is not inconsistent with other work suggesting that obese individuals have blunted food cue reactivity in the mesolimbic dopamine pathway (Stice et al., 2008; Burger and Stice, 2011; Green et al., 2011). With respect to the craving regulation signature, one potential explanation for the positive association is that individuals with higher BMIs may be more likely to engage in spontaneous reappraisals during unhealthy food cue exposure because they feel greater conflict. While we were unable to test this directly, it is consistent with other evidence showing positive associations between BMI and pattern expression of the craving regulation signature during exposure to healthy and unhealthy foods, and this relationship was stronger for unhealthy foods (see supplementary material in Cosme et al., 2020).
Food craving enactment
We also observed robust associations between food craving enactment and multiple indicators of reactivity, regulation, and valuation. These results were most clearly interpretable and aligned with our directional hypotheses. All neural indicators of reactivity and valuation were positively associated with enactment. The reward activation and pattern expression indicators showed the largest median effect sizes (β ROI = 0.19, β PEV = 0.21), replicating findings from previous works (Lopez et al., 2014, 2017) in a larger sample. Additionally, increased activity in the cognitive control ROI was associated with less frequent enactment, as expected. Together, this pattern of results is consistent with Giuliani et al. (2018) framework and suggests that successful self-regulation in the eating domain arises from multiple processes that are integrated to guide eating behavior, vs an outcome exclusively determined by impulsive and inhibitory processes as predicted by dual-process models (e.g. Hofmann et al., 2009; Heatherton and Wagner, 2011), as demonstrated by Cosme and colleagues (Cosme et al., 2019).
Body fat percentage
In contrast to BMI and food craving enactment, associations between neural indicators and body fat percentage were less consistent and generally lower in magnitude. One possibility is that because the accumulation of body fat is the result of complex interactions between behavioral and biological processes and is highly heritable (20–60%(Price, 1987), neural activation during food cue exposure may simply be less directly related to body fat percentage. Another possibility is that body fat percentage, as measured by bioelectrical impedance, may not be the most valid way to capture body fat, or it may not be as reliable compared to other measures of body composition, such as waist circumference or waist-to-hip ratio.
Limitations and future directions
This study has several limitations. First, these results are correlational and thus cannot establish a causal role for the neural indicators. For example, it could be that reactivity, regulation and valuation—as indexed by univariate and multivariate indicators—drive eating behavior, or the causal direction may be reversed (e.g. certain eating patterns may make it easier or more difficult to maintain one’s self-regulatory abilities, with attendant changes in univariate activation or pattern expression). Next, we only assessed eating behavior for 1 week in a subset of participants. This relatively short assessment period prohibits inferences about trends and changes in eating patterns over time. A more intensive, longitudinal EMA design with multiple neural and behavioral assessments would better address how changes in neural indicators result in subsequent changes in eating behaviors.
Building on recent research examining the effects of self-regulatory training in the eating domain (Chen et al., 2018), future interventions might directly test the extent to which ROI activity and pattern expression related to reactivity, regulation and valuation change as a function of training and how change relates to eating behaviors, including food craving enactment. We also would recommend that subsequent studies provide additional measures to establish convergent validity of neural indicators during the passive viewing tasks, especially those that index regulatory processes. For example, researchers can directly compare the extent to which blood-oxygen-level-dependent activity in neural indicators of regulation during an explicit craving regulation task is equally or more predictive of body composition and daily eating patterns than activity during passive viewing of food cues. Another possibility would be to collect craving ratings for all food items, either during the scanning session or immediately following the scan, to determine whether greater or lesser engagement of regulation-related indicators correlates with the participants’ craving levels.
Lastly, inferences drawn from the present work are limited to the population under study—young adults, most of whom were female college students at an elite, private college in New England. It is therefore important to assess the generalizability in populations with greater diversity in age, sex, race, and socio-economic status. Furthermore, daily eating behavior was only assessed in a sample of women, so these results in particular may not generalize to men. Future work would also have to specifically test whether these associations generalize to clinical populations with marked patterns of irregular or disordered eating, such as binge eating disorder or anorexia nervosa.
Despite these limitations, this study has several strengths. First, we conducted preregistered analyses, specifying a priori univariate and multivariate neural indicators of reactivity, regulation and valuation and testing directional hypotheses about the relationships between these indicators and key outcome measures. Second, we strengthened the inferential value of the preregistered analyses by systematically testing their robustness using SCA. This is the first study we are aware of that has applied this method to fMRI data to explicitly test the effects of analytic decisions on brain–behavior associations, and the results highlight its utility for assessing robustness as well as uncovering patterns in the data that might not otherwise be revealed with traditional modeling approaches. This method has great promise for social, cognitive and affective neuroscience, and wide adoption could help strengthen the replicability and translational impact of our research.
Conclusion
We demonstrated that univariate and multivariate neural indicators of reactivity, regulation, and valuation—as captured by fMRI during a cue reactivity task—are reliably associated with body composition and daily eating behavior among young adults. This replicates prior work using univariate activation to predict appetitive behaviors (Berkman et al., 2011; Lopez et al., 2014) and also establishes the utility of whole-brain pattern expression as a way to operationalize food-cue-evoked activity and relate it to real-world outcomes. Overall, the present findings suggest that both univariate and multivariate brain measures are needed to characterize proximal and distal aspects of eating behavior, and these measures can potentially serve as viable neural targets for self-regulatory training. More broadly, researchers may consider applying the present approach to other domains of self-regulation and goal pursuit by mapping neural indicators to different aspects of appetitive and addictive behaviors.
Supplementary Material
Acknowledgements
The authors are listed in alphabetical order due to equal contribution. We would like to thank Elliot Berkman for his thoughtful feedback on an earlier version of this manuscript and John Flournoy for his helpful statistical consultation.
Contributor Information
Danielle Cosme, Annenberg School for Communication, University of Pennsylvania, Philadelphia, PA 19104, USA.
Richard B Lopez, Department of Psychology, Bard College, Annandale-on-Hudson, NY 12504, USA.
Conflict of interest
The authors declare no conflicts of interest with regard to this scholarly work.
Supplementary data
Supplementary data are available at SCAN online.
References
- Berkman, E.T., Falk, E.B. (2013). Beyond brain mapping: using neural measures to predict real-world outcomes. Current Directions in Psychological Science, 22(1), 45–50. [DOI] [PMC free article] [PubMed] [Google Scholar]
- Berkman, E.T., Falk, E.B., Lieberman, M.D. (2011). In the trenches of real-world self-control: neural correlates of breaking the link between craving and smoking. Psychological Science, 22(4), 498–506. [DOI] [PMC free article] [PubMed] [Google Scholar]
- Berridge, K.C. (2009). “Liking” and “wanting” food rewards: brain substrates and roles in eating disorders. Physiology & Behavior, 97(5), 537–50. [DOI] [PMC free article] [PubMed] [Google Scholar]
- Boswell, R.G., Kober, H. (2016). Food cue reactivity and craving predict eating and weight gain: a meta-analytic review. Obesity Reviews: An Official Journal of the International Association for the Study of Obesity, 17(2), 159–77. [DOI] [PMC free article] [PubMed] [Google Scholar]
- Buhle, J.T., Silvers, J.A., Wager, T.D., et al. (2014). Cognitive reappraisal of emotion: a meta-analysis of human neuroimaging studies. Cerebral Cortex, 24(11), 2981–90. [DOI] [PMC free article] [PubMed] [Google Scholar]
- Burger, K.S., Stice, E. (2011). Variability in reward responsivity and obesity: evidence from brain imaging studies. Current Drug Abuse Reviews, 4(3), 182–89. [DOI] [PMC free article] [PubMed] [Google Scholar]
- Chang, L.J., Gianaros, P.J., Manuck, S.B., Krishnan, A., Wager, T.D. (2015). A sensitive and specific neural signature for picture-induced negative affect. PLoS Biology, 13(6), e1002180. [DOI] [PMC free article] [PubMed] [Google Scholar]
- Chen, P.-H.A., Kelley, W.M., Lopez, R.B., Heatherton, T.F. (2018). Reducing reward responsivity and daily food desires in female dieters through domain-specific training. Social Neuroscience, 14(4), 470–83. doi: 10.1080/17470919.2018.1495667 [DOI] [PubMed] [Google Scholar]
- Cosme, D., Ludwig, R.M., Berkman, E.T. (2019). Comparing two neurocognitive models of self-control during dietary decisions. Social Cognitive and Affective Neuroscience, 14(9), 957–66. [DOI] [PMC free article] [PubMed] [Google Scholar]
- Cosme, D., Zeithamova, D., Stice, E., Berkman, E. (2020). Multivariate neural signatures for health neuroscience: assessing spontaneous regulation during food choice. Social Cognitive and Affective Neuroscience, 15(10), 1120–1134. doi: 10.1093/scan/nsaa002 [DOI] [PMC free article] [PubMed] [Google Scholar]
- Cox, R.W. (1996). AFNI: software for analysis and visualization of functional magnetic resonance neuroimages. Computers and Biomedical Research, an International Journal, 29(3), 162–73. [DOI] [PubMed] [Google Scholar]
- Demos, K.E., Heatherton, T.F., Kelley, W.M. (2012). Individual differences in nucleus accumbens activity to food and sexual images predict weight gain and sexual behavior. The Journal of Neuroscience: The Official Journal of the Society for Neuroscience, 32(16), 5549–52. [DOI] [PMC free article] [PubMed] [Google Scholar]
- Doré, B.P., Weber, J., Nicholas Ochsner, K. (2017). Neural predictors of decisions to cognitively control emotion. The Journal of Neuroscience: The Official Journal of the Society for Neuroscience, 37(10). doi: 10.1523/JNEUROSCI.2526-16.2016 [DOI] [PMC free article] [PubMed] [Google Scholar]
- Dosenbach, N.U.F., Fair, D.A., Miezin, F.M., et al. (2007). Distinct brain networks for adaptive and stable task control in humans. Proceedings of the National Academy of Sciences of the United States of America, 104(26), 11073–78. [DOI] [PMC free article] [PubMed] [Google Scholar]
- Esteban, O., Markiewicz, C.J., Blair, R.W., et al. (2019). fMRIPrep: a robust preprocessing pipeline for functional MRI. Nature Methods, 16(1), 111–16. doi: 10.1038/s41592-018-0235-4 [DOI] [PMC free article] [PubMed] [Google Scholar]
- Fischl, B. (2012). FreeSurfer. NeuroImage, 62(2), 774–81. [DOI] [PMC free article] [PubMed] [Google Scholar]
- Fisher, P.A., Berkman, E.T. (2015). Designing interventions informed by scientific knowledge about effects of early adversity: a translational neuroscience agenda for next generation addictions research. Current Addiction Reports, 2(4), 347–53. [DOI] [PMC free article] [PubMed] [Google Scholar]
- Flournoy, J.C., Vijayakumar, N., Cheng, T.W., Cosme, D., Flannery, J.E., Pfeifer, J.H. (2020). Improving practices and inferences in developmental cognitive neuroscience. Developmental Cognitive Neuroscience, 100807. [DOI] [PMC free article] [PubMed] [Google Scholar]
- Giuliani, N.R., Mann, T., Tomiyama, A.J., Berkman, E.T. (2014). Neural systems underlying the reappraisal of personally craved foods. Journal of Cognitive Neuroscience, 26(7), 1390–402. [DOI] [PMC free article] [PubMed] [Google Scholar]
- Giuliani, N.R., Merchant, J.S., Cosme, D., Berkman, E.T. (2018). Neural predictors of eating behavior and dietary change. Annals of the New York Academy of Sciences, 1428(1), 208–20. [DOI] [PMC free article] [PubMed] [Google Scholar]
- Green, E., Jacobson, A., Haase, L., Murphy, C. (2011). Reduced nucleus accumbens and caudate nucleus activation to a pleasant taste is associated with obesity in older adults. Brain Research, 1386, 109–17. [DOI] [PMC free article] [PubMed] [Google Scholar]
- Hall, P.A., Bickel, W.K., Erickson, K.I., Wagner, D.D. (2018). Neuroimaging, neuromodulation, and population health: the neuroscience of chronic disease prevention. Annals of the New York Academy of Sciences, 1428(1). doi: 10.1111/nyas.13868 [DOI] [PMC free article] [PubMed] [Google Scholar]
- Han, J.E., Boachie, N., Garcia, I.G., Michaud, A., Dagher, A. (2018). Neural correlates of dietary self-control in healthy adults: a meta-analysis of functional brain imaging studies. Physiology & Behavior, 192. doi: 10.1016/j.physbeh.2018.02.037 [DOI] [PubMed] [Google Scholar]
- Hare, T.A., Camerer, C.F., Rangel, A. (2009). Self-control in decision-making involves modulation of the vmPFC valuation system. Science, 324(5927), 646–48. [DOI] [PubMed] [Google Scholar]
- Heatherton, T.F., Herman, C.P., Polivy, J., King, G.A., McGree, S.T. (1988). The (mis)measurement of restraint: an analysis of conceptual and psychometric issues. Journal of Abnormal Psychology, 97(1), 19–28. [DOI] [PubMed] [Google Scholar]
- Heatherton, T.F., Wagner, D.D. (2011). Cognitive neuroscience of self-regulation failure. Trends in Cognitive Sciences, 15(3), 132–39. [DOI] [PMC free article] [PubMed] [Google Scholar]
- Herman, C.P., Polivy, J. (1980). Restrained eating. In: Stunkard, A.J., editor. Obesity. Philadelphia: Saunders, 208–25. [Google Scholar]
- Hofmann, W., Baumeister, R.F., Förster, G., Vohs, K.D. (2012). Everyday temptations: an experience sampling study of desire, conflict, and self-control. Journal of Personality and Social Psychology, 102(6), 1318–35. [DOI] [PubMed] [Google Scholar]
- Hofmann, W., Friese, M., Strack, F. (2009). Impulse and self-control from a dual-systems perspective. Perspectives on Psychological Science: A Journal of the Association for Psychological Science, 4(2), 162–76. [DOI] [PubMed] [Google Scholar]
- Jebb, S.A., Cole, T.J., Doman, D., Murgatroyd, P.R., Prentice, A.M. (2000). Evaluation of the novel Tanita body-fat analyser to measure body composition by comparison with a four-compartment model. The British Journal of Nutrition, 83(2), 115–22. [DOI] [PubMed] [Google Scholar]
- Kelley, W.M., Wagner, D.D., Heatherton, T.F. (2015). In search of a human self-regulation system. Annual Review of Neuroscience, 38(1), 389–411. [DOI] [PMC free article] [PubMed] [Google Scholar]
- Kim, J.M., Knodt, A.R., Hariri, A.R. (2019). Meta-analytic activation maps can help identify affective processes captured by contrast-based task fMRI: the case of threat-related facial expressions. doi: 10.1101/820969 [DOI] [PMC free article] [PubMed] [Google Scholar]
- Klapwijk, E., van den Bos, W., Tamnes, C.K., Mills, K.L., Raschle, N. (2019). Opportunities for increased reproducibility and replicability of developmental cognitive neuroscience. doi: 10.31234/osf.io/fxjzt [DOI] [PMC free article] [PubMed] [Google Scholar]
- Kober, H., Mende-Siedlecki, P., Kross, E.F., et al. (2010). Prefrontal–striatal pathway underlies cognitive regulation of craving. Proceedings of the National Academy of Sciences of the United States of America, 107(33), 14811–16. [DOI] [PMC free article] [PubMed] [Google Scholar]
- Krönke, K.-M., Wolff, M., Mohr, H., et al. (2018). Monitor yourself! Deficient error-related brain activity predicts real-life self-control failures. Cognitive, Affective & Behavioral Neuroscience, 18(4). doi: 10.3758/s13415-018-0593-5 [DOI] [PubMed] [Google Scholar]
- Kuhn, M. (2008). Building predictive models in R using the caret package. Journal of Statistical Software, 28(5), 1–26.27774042 [Google Scholar]
- Lopez, R.B., Chen, P.-H.A., Huckins, J.F., Hofmann, W., Kelley, W.M., Heatherton, T.F. (2017). A balance of activity in brain control and reward systems predicts self-regulatory outcomes. Social Cognitive and Affective Neuroscience, 12(5), 832–38. [DOI] [PMC free article] [PubMed] [Google Scholar]
- Lopez, R.B., Courtney, A.L., Wagner, D.D. (2019a). Recruitment of cognitive control regions during effortful self-control is associated with altered brain activity in control and reward systems in dieters during subsequent exposure to food commercials. PeerJ, 7, e6550. [DOI] [PMC free article] [PubMed] [Google Scholar]
- Lopez, R.B., Heatherton, T.F., Wagner, D.D. (2019b). Media multitasking is associated with higher risk for obesity and increased responsiveness to rewarding food stimuli. Brain Imaging and Behavior, 14. doi: 10.1007/s11682-019-00056-0 [DOI] [PubMed] [Google Scholar]
- Lopez, R.B., Hofmann, W., Wagner, D.D., Kelley, W.M., Heatherton, T.F. (2014). Neural predictors of giving in to temptation in daily life. Psychological Science, 25(7), 1337–44. [DOI] [PMC free article] [PubMed] [Google Scholar]
- Lopez, R.B., Milyavskaya, M., Hofmann, W., Heatherton, T.F. (2016). Motivational and neural correlates of self-control of eating: a combined neuroimaging and experience sampling study in dieting female college students. Appetite, 103, 192–99. [DOI] [PMC free article] [PubMed] [Google Scholar]
- Masur, P.K., Scharkow, M. (2019). Specr: statistical functions for conducting specification curve analyses. Available: https://github.com/masurp/specr [2019, June 3, 2020].
- Orben, A., Przybylski, A.K. (2019a). The association between adolescent well-being and digital technology use. Nature Human Behaviour, 3(2), 173–82. [DOI] [PubMed] [Google Scholar]
- Orben, A., Przybylski, A.K. (2019b). Screens, teens, and psychological well-being: evidence from three time-use-diary studies. Psychological Science, 30(5), 682–96. [DOI] [PMC free article] [PubMed] [Google Scholar]
- Poldrack, R.A., Baker, C.I., Durnez, J., et al. (2017). Scanning the horizon: towards transparent and reproducible neuroimaging research. Nature Reviews Neuroscience, 18(2), 115–26. [DOI] [PMC free article] [PubMed] [Google Scholar]
- Power, J.D., Cohen, A.L., Nelson, S.M., et al. (2011). Functional network organization of the human brain. Neuron, 72(4), 665–78. [DOI] [PMC free article] [PubMed] [Google Scholar]
- Price, R.A., (1987). Genetics of human obesity. Annals of Behavioral Medicine. Philadelphia: Saunders, 9(1), 9-14. [Google Scholar]
- Rapuano, K.M., Zieselman, A.L., Kelley, W.M., Sargent, J.D., Heatherton, T.F., Gilbert-Diamond, D. (2017). Genetic risk for obesity predicts nucleus accumbens size and responsivity to real-world food cues. Proceedings of the National Academy of Sciences of the United States of America, 114(1), 160–65. [DOI] [PMC free article] [PubMed] [Google Scholar]
- Reggente, N., Essoe, J.K.-Y., Aghajan, Z.M., et al. (2018). Enhancing the ecological validity of fMRI memory research using virtual reality. Frontiers in Neuroscience, 12, 408. [DOI] [PMC free article] [PubMed] [Google Scholar]
- Shahane, A.D., Lopez, R.B., Denny, B.T. (2019). Implicit reappraisal as an emotional buffer: reappraisal-related neural activity moderates the relationship between inattention and perceived stress during exposure to negative stimuli. Cognitive, Affective & Behavioral Neuroscience, 19(2), 355–65. [DOI] [PubMed] [Google Scholar]
- Simmons, J.P., Nelson, L.D., Simonsohn, U. (2011). False-positive psychology: undisclosed flexibility in data collection and analysis allows presenting anything as significant. Psychological Science, 22(11), 1359–66. [DOI] [PubMed] [Google Scholar]
- Simonsohn, U., Simmons, J.P., Nelson, L.D. (2020). Specification curve analysis. Nature Human Behaviour, 1–7. doi: 10.1038/s41562-020-0912-z [DOI] [PubMed] [Google Scholar]
- Steegen, S., Tuerlinckx, F., Gelman, A., Vanpaemel, W. (2016). Increasing transparency through a multiverse analysis. Perspectives on Psychological Science: A Journal of the Association for Psychological Science, 11(5), 702–12. [DOI] [PubMed] [Google Scholar]
- Stice, E., Spoor, S., Bohon, C., Veldhuizen, M.G., Small, D.M. (2008). Relation of reward from food intake and anticipated food intake to obesity: a functional magnetic resonance imaging study. Journal of Abnormal Psychology, 117(4), 924–35. [DOI] [PMC free article] [PubMed] [Google Scholar]
- Tang, D.W., Fellows, L.K., Small, D.M., Dagher, A. (2012). Food and drug cues activate similar brain regions: a meta-analysis of functional MRI studies. Physiology & Behavior, 106(3), 317–24. [DOI] [PubMed] [Google Scholar]
- Tusche, A., Hutcherson, C.A. (2018). Cognitive regulation alters social and dietary choice by changing attribute representations in domain-general and domain-specific brain circuits. eLife, 7, e31185. doi: 10.7554/eLife.31185 [DOI] [PMC free article] [PubMed] [Google Scholar]
- Vanderwal, T., Eilbott, J., Castellanos, F.X. (2019). Movies in the magnet: naturalistic paradigms in developmental functional neuroimaging. Developmental Cognitive Neuroscience, 36, 100600. [DOI] [PMC free article] [PubMed] [Google Scholar]
- Wager, T.D., Atlas, L.Y., Lindquist, M.A., Roy, M., Woo, C.-W., Kross, E. (2013). An fMRI-based neurologic signature of physical pain. The New England Journal of Medicine, 368(15), 1388–97. [DOI] [PMC free article] [PubMed] [Google Scholar]
- Wagner, D.D., Altman, M., Boswell, R.G., Kelley, W.M., Heatherton, T.F. (2013). Self-regulatory depletion enhances neural responses to rewards and impairs top-down control. Psychological Science, 24(11), 2262–71. [DOI] [PMC free article] [PubMed] [Google Scholar]
- Wang, G.-J., Volkow, N.D., Fowler, J.S. (2002). The role of dopamine in motivation for food in humans: implications for obesity. Expert Opinion on Therapeutic Targets, 6(5), 601–09. [DOI] [PubMed] [Google Scholar]
- Woo, C.-W., Chang, L.J., Lindquist, M.A., Wager, T.D. (2017). Building better biomarkers: brain models in translational neuroimaging. Nature Neuroscience, 20(3), 365–77. [DOI] [PMC free article] [PubMed] [Google Scholar]
- Yarkoni, T., Poldrack, R.A., Nichols, T.E., Van Essen, D.C., Wager, T.D. (2011). Large-scale automated synthesis of human functional neuroimaging data. Nature Methods, 8(8), 665–70. [DOI] [PMC free article] [PubMed] [Google Scholar]
Associated Data
This section collects any data citations, data availability statements, or supplementary materials included in this article.