

Abstract
Collagen quantity and integrity play an important role in understanding diseases such as myelofibrosis (MF). Label-free mid-infrared spectroscopic imaging (MIRSI) has the potential to quantify collagen while minimizing the subjective variance observed with conventional histopathology. Infrared (IR) spectroscopy with polarization sensitivity provides chemical information while also estimating tissue dichroism. This can potentially aid MF grading by revealing the structure and orientation of collagen fibers. Simultaneous measurement of collagen structure and biochemical properties can translate clinically into improved diagnosis and enhance our understanding of disease progression. In this paper, we present the first report of polarization-dependent spectroscopic variations in collagen from human bone marrow samples. We build on prior work with animal models and extend it to human clinical biopsies with a practical method for high-resolution chemical and structural imaging of bone marrow on clinical glass slides. This is done using a new polarization-sensitive photothermal mid-infrared spectroscopic imaging scheme that enables sample and source independent polarization control. This technology provides 0.5 μm spatial resolution, enabling the identification of thin (≈1 μm) collagen fibers that were not separable using Fourier Transform Infrared (FT-IR) imaging in the fingerprint region at diffraction-limited resolution (≈ 5 μm). Finally, we propose quantitative metrics to identify fiber orientation from discrete band images (amide I and amide II) measured under three polarizations. Previous studies have used a pair of orthogonal polarization measurements, which is insufficient for clinical samples since human bone biopsies contain collagen fibers with multiple orientations. Here, we address this challenge and demonstrate that three polarization measurements are necessary to resolve orientation ambiguity in clinical bone marrow samples. This is also the first study to demonstrate the ability to spectroscopically identify thin collagen fibers (≈ 1 μm diameter) and their orientations, which is critical for accurate grading of human bone marrow fibrosis.
Keywords: Collagen, photothermal infrared imaging, mid-infrared spectroscopic imaging, MIRSI, bone marrow, myelofibrosis, IR spectroscopic imaging, optical photothermal IR, O-PTIR, polarization, vector computation
Introduction
Collagen fibers form structural networks in several biological tissues. The intrinsic birefringence of collagen type I and II has been studied extensively using bright field microscopy.1–3 Polarized light microscopy is used to improve visualization of collagen fibers and evaluate staining quality. However, pathologists still rely on chemical staining agents, such as trichrome, for histopathologic analysis and diagnosis of diseases such as myelofibrosis (MF). Moreover, this process is subjective, and results vary depending on staining quality.4 Label-free imaging, such as second-harmonic generation (SHG),5 LC-PolScope,6 and mid-IR spectroscopic imaging (MIRSI),7 has the potential to overcome these challenges by eliminating staining. The anisotropic structure of collagen, especially triple helix structures, makes it ideal for SHG and LC-PolScope.6 However, SHG and LC-PolScope only capture structural information, whereas IR imaging can simultaneously provide diverse molecular information,8 which has demonstrated utility in label-free histopathology.9–14
Fourier transform infrared (FT-IR) imaging with polarization control has been used to demonstrate the dichroic nature of collagen fibers under linearly polarized light.8,15 However, these studies are based on collagen fibers from animal models. In a study by Bi et al.,8 polarized FT-IR imaging was used to quantify collagen fiber orientation in rabbit tendons and horse cartilage. Work by Bakier et al.15 demonstrated mid-IR spectral variations due to changes in fiber orientation under linearly polarized IR radiation in collagen fibers and fibrils in tail tendons from steers. Study by Bi et al. was based on stained and manually stretched and aligned fibers and extracted fibrils. Tissue processing such as stretching and staining increases intrinsic birefringence and dichroism.16 Our current work builds on previous animal studies to demonstrate this dichroic behavior in clinical, human bone marrow biopsies without the application of external force or chemical stains. We preserve and extract intrinsic fiber orientation properties in a label-free manner.
Myelofibrosis (MF) is a bone marrow disorder in which abnormal collagen growth disrupts normal function leading to chronic leukemia. WHO grading guideline for MF uses a four-grade system based on collagen fiber morphology in bone marrow biopsies.1,17 Accurate grading is critical to understand prognosis and measuring the treatment effectiveness, but is prone to subjective variance due to the qualitative nature of staining and pathologists’ interpretations.1 Since IR spectroscopy has been successful in diagnosing diseases where collagen structure plays an important role, such as breast carcinoma17 and pancreatic ductal adenocarcinoma,18 we applied a similar approach to bone marrow biopsies.19 Our previous study of bone marrow fibrosis19 using FT-IR imaging was successful at classifying collagen type I and trabecular bone (type IV) in biopsies with 99% accuracy. However, MF grading accuracy was only 50% due to difficulty in categorizing abnormal growth of thin collagen fibers (2 μm diameter) with the limited spatial resolution of FT-IR. Recent advances in optical photothermal (O-PTIR) imaging enable mid-IR spectroscopic imaging at a wavelength-independent spatial resolution of 0.5 μm, which is beyond the IR diffraction limit.20,21 We believe this technology is especially applicable where the identification of thin collagen fibers is critical.
IR absorption at amide I is due to stretching vibrations of the C=O of the peptide bond and IR absorption at amide II is due to a combination of C—N stretch and N—H bending vibrations.22 Transition moments of C=O stretching vibrations (amide I) are perpendicular to the fiber orientation.22,23 Hence, the amide I peak intensity is higher than the amide II peak intensity when IR polarization is perpendicular to the fiber orientation, and the inverse is true for parallel polarization.8,23 As significant changes in the amide I and amide II peaks are seen depending on the IR polarization with respect to the fiber orientation, the orientation of collagen fibers can be determined using polarization sensitive IR imaging.
In this work, we leverage high-resolution O-PTIR imaging24 to study collagen fibers. We study naturally formed collagen fibers in human bone marrow biopsies without traditional processing, such as staining and manual stretching of the tissue. We present the first report of polarization-dependent spectroscopic variations in collagen from human bone marrow samples. We demonstrate a technique that utilizes wavelength-dependent dichroic properties for the identification of collagen and determination of collagen fiber orientation. We obtain IR band images at two discrete band images (amide I and amide II) measured under three polarization orientations and propose a quantitative data synthesis scheme for identifying fiber orientation at each microscopic location from this imaging dataset. We show that high-resolution, polarization-sensitive mid-IR spectroscopic imaging can detect thin collagen fibers along with their orientation. This can potentially aid early MF diagnosis.
Materials and Methods
Materials
Three 3 μm thick sections were obtained from formalin-fixed paraffin-embedded clinical tissue samples of human subjects. One unstained section was mounted on a glass slide for spectroscopic imaging, and two adjacent sections were stained with reticulin and trichrome. Figure 1 shows an FT-IR band image along with corresponding trichrome and reticulin stains for one sample. Two samples used in this study were bone marrow biopsies from patients with myeloproliferative neoplasms (MPN) with grade 3 myelofibrosis containing densely interconnected networks of collagen fibers (collagen type I and reticulin).
Figure 1.
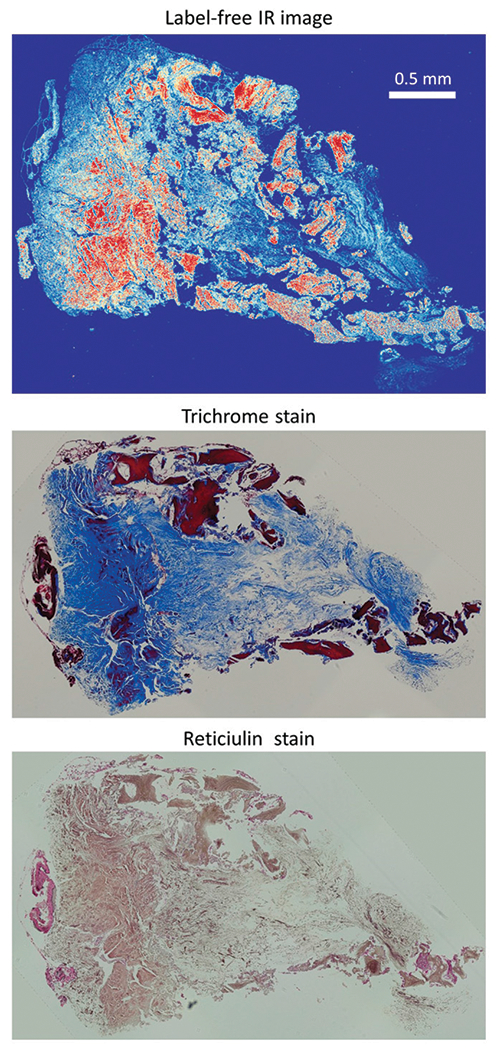
Adjacent sections of bone marrow biopsy imaged with (a) O-PTIR (1660 cm−1) and stained with (b) Masson’s trichrome, and (c) reticulin silver stain. IR spectroscopy provides molecular signature without any chemical stain, Masson’s trichrome stains collagen type I fibers with blue color and reticulin silver stains reticulin fibers (collagen type III) with black and brown color.
FT-IR Imaging
Deparaffinized and unstained tissue sections on glass slides were imaged with an Agilent 670 FT-IR spectrometer (Agilent Technologies, Inc.) coupled to a Cary 620 microscope (Agilent Technologies, Inc.) for reference. Agilent Cary 620 FT-IR uses a broadband globar source with a 15 × 0.62 NA objective and 128 × 128 pixel focal plane array (FPA) detector. FT-IR facilitates two imaging modes of standard-definition (SD) and high-definition (HD) with pixel size of 5.5 μm and 1.1 μm, respectively. We imaged tissues in HD mode (1.1 μm pixel size) to provide the closest comparison to O-PTIR. Since glass absorbs in the fingerprint region, we limited imaging to higher wavenumbers and collected hyperspectral images between 2500 and 3800 cm−1 at a spectral resolution of 8 cm−1.
O-PTIR Imaging
O-PTIR images were collected on a mIRage system (Photothermal Spectroscopy Corp.); mIRage is a non-contact, sub-micron IR spectroscopic imaging system that uses a QCL laser source and 532 nm probe to detect localized photothermal effects. Images were collected with a 40× magnification 0.65 NA objective and a pixel size of 0.25 μm. Due to constraints on hyperspectral data collection times in O-PTIR while imaging large bone marrow biopsies (≈0.5 cm long), we imaged smaller tissue regions of interest (ROIs) with collagen fibers of known orientations. We collected hyperspectral images of tissue sections in the fingerprint region (920 to 1700 cm−1) at a spectral resolution of 8 cm−1 and pixel size of 0.25 μm. Band images of larger ROIs were collected at two discrete wavenumbers representing amide I (1660 cm−1) and amide II (1536 cm−1).
Polarization Sensitive O-PTIR Imaging.
Previous studies8,25 use the IR dichroic ratio, or the ratio of absorbance under both parallel and perpendicular polarized light, as an indicator of collagen fiber orientation. However, in clinical samples, obtaining two polarization measurements alone lead to ambiguity in fibers orientation as detailed in the results section. We therefore introduce source and sample independent control on polarization in OPTIR instrumentation by implementing a new collection scheme that uses three polarization measurements. The O-PTIR QCL laser source is linearly polarized with an intrinsic polarization parallel to the X-axis of the image plane. We insert a wire-grid polarizer to change laser polarization by matching the polarization angle θ = 0° to the intrinsic polarization of the source.
Measuring absorbance with a polarizer perpendicular to polarization of the QCL is not possible since rotating the polarizer by 90° completely blocks the source. We therefore selected two orthogonal polarizations P45° and P−45° which are at angles of 45° and −45°/35° from the intrinsic QCL polarization (θ = 0°). Measurements with these two orthogonal polarizations (P45° and P−45°) results in the same absorbance measurement for fibers oriented along either of the two orientations 0° (red) or 90°(green) in Fig. 2a. We resolve this ambiguity by performing a third polarization measurement P0° at θ = 0° as shown in Fig. 2b.
Figure 2.

Proposed polarization angles and polarization-sensitive spectra measurements of collagen fibers from bone marrow tissue section on the glass slide. Two fibers with different orientations horizontal (red) and vertical (green), have the same absorbance magnitude when intensity measurements of IR absorbance are performed at two orthogonal polarizations (P45° and P−45°) as illustrated in (a). Therefore, we propose performing measurements at three polarizations (P0°, P45°, and P−45°) as shown in (b) to resolve this ambiguity and uniquely determine collagen orientation. Spectra acquired with proposed IR laser polarizations for collagen fibers: thick fibers approximately oriented at angle 0° (c), thin fibers approximately oriented at an angle of 45° (d), and fibers from the trabecular bone (e). Polarization-sensitive spectral variations at amide I and amide II peaks are present in all spectra (c-e). However, the effect of polarization on amide III peak is seen only on spectra for trabecular bone (e), not on the thin fibers as glass absorbance signal dominates spectral range of 900 to 1300 cm−1 for thin fibers (c,d).
Collagen Identification and Orientation Estimation
We identify collagen fibers by computing the absolute difference between amide I and amide II ratios across polarizations.
| (1) |
Here, R0°, R45°, and R−45° are amide II to amide I peak ratios at each pixel measured using IR light polarized P0°, P45°, and P−45°, respectively.
The principal orientation of collagen fibers is calculated using Jones calculus.26 Normalized Jones vectors and Jones matrices corresponding to the proposed polarizations are shown in Table 1. For all pixels in the image, tensors for Pθ are computed by multiplying the amide ratio Rθ to the Jones matrix Jθ (see Eq. 2). The final tensor T is computed by summing tensors for P0°, P45°, and P−45°:
| (2) |
| (3) |
Here, Tθ is the tensor for polarization Pθ and T is combination of Tθ computed for all the proposed polarizations.
Table 1.
Jones vectors for proposed polarizations.
| Polarization | Jones vector | Jones matrix |
|---|---|---|
| P 0° | ||
| P 45° | ||
| P −45° |
The principal orientation of fibers Φ at each pixel is computed by eigen decomposition of the tensor T:
| (4) |
| (5) |
Here, eigV is a matrix of eigenvectors and w is a vector of eigenvalues of tensor T. v is an eigenvector corresponding to the highest eigenvalue from w.
Results
Polarization sensitive IR imaging with two orthogonal polarizations is not sufficient to uniquely determine the orientation of collagen fibers in clinical samples. For example, two fibers oriented at ± 45° to the selected polarizations will result in identical measurements. This challenge is illustrated in Fig. 2a where fibers oriented at an angle of 0° (red) and 90°(green) have the same projected magnitude on the polarization axes oriented at θ = 45° and θ = −45°. Since the instrument measures light intensity without (±) sign, we cannot distinguish between fibers oriented at 0° and 90° with measurements at just two orientations (θ = 45° and θ = −45°). To overcome this ambiguity, we imaged with three polarizations: P0°, P45° and P−45° at angles θ = 0°, 45°, and −45°, respectively (Fig. 2b).
Collagen spectra collected using the proposed polarization scheme measure wavelength-dependent and polarization-dependant absorption (Figs. 2c–e). The relative intensity of amide II to amide I is highest when the polarization is linear and parallel to the fiber orientation, and decreases as the polarization changes from parallel to the perpendicular. The orientation of collagen bundles is clearly visible in brightfield images (Fig. 2). Spectra collected at indicated locations (yellow markers) show changes in the spectral profiles of fibers acquired with the proposed polarizations. Spectra shown in Fig. 2c are from the bundle of collagen fibers with an approximate orientation of 0°; therefore, the ratio of amide II to amide I is highest for polarization Pθ°. When the fiber orientation is near 45°, the ratio is higher under polarization P45° and lower for polarization P−45°. Spectra shown in Fig. 2d are from the bundle of collagen fibers with a principal orientation of 50°; therefore, the amide II to amide I ratio is highest for polarization P45°. Since the polarization P−45° is perpendicular to the fibers, the amide II to amide I ratio is lowest for P− 45°. Spectra shown in Fig. 2e are from trabecular bone, which contains collagen type IV fibers. Collagen fiber orientation is not visible in brightfield images, but wavelength-dependent dichroic effects are seen in the spectra where the amide II to amide I ratio changes with polarization angle. We also observed significant changes in the height of the amide III peak with varying polarizations.
O-PTIR allows measurement of infrared spectra on clinical glass substrates. However, the absorption cross-section and density of absorbing molecules, and consequently the thickness of tissue, has an influence on the measured spectra. IR absorbance spectra from Figs. 2c and d show a strong signal from glass absorbance relative to the tissue absorbance in the spectral range of 920 to 1300 cm−1. Collagen fibers from thin samples such as bone marrow (3 μm) have a relatively low density of absorbers and a correspondingly low absorbance signal. This makes it challenging to extract tissue absorbance from the spectral region between 920 to 1300 cm−1. Trabecular bone is denser, providing a stronger signal relative to glass (Fig. 2e). This explains why the dichroic effect in the amide III region is seen in the spectra from trabecular bone (Fig. 2e) but not in the spectra from collagen fiber bundles from the central region in Figs. 2c and d.
High-resolution imaging by O-PTIR enables detection of thin fibers that are not seen with FT-IR imaging at diffraction-limited spatial resolution. In Fig. 3, we compare the spatial resolution offered by O-PTIR with that from FT-IR. We collected O-PTIR hyperspectral images in the fingerprint region (900 to 1800 cm−1) and obtained FT-IR hyperspectral images in the (2500 to 3800 cm−1) wavenumber range. This is because the strong infrared absorption by glass hinders the measurement of tissue spectra in the fingerprint region in FT-IR. Note that FT-IR resolution in the fingerprint region is expected to be poorer than the FT-IR images presented in Fig. 3 due to their longer wavelengths. A comparison of band images in Fig. 3 demonstrates that the spatial resolution of O-PTIR at 1660 cm−1 (a) is better than the spatial resolution of FT-IR at 3316 cm−1 (b). The tissue region corresponding to inset A from Fig. 3a is expanded and presented in Fig. 3e visible, (f) FT-IR, and (g) O-PTIR. A comparison of these images shows that several spatial details such as thin fibers which are ≈ 1 μm diameter are visible in the brightfield and O-PTIR images but not in the FT-IR image in inset B.
Figure 3.

Comparing spatial resolution of visible, FT-IR, and O-PTIR imaging for detecting collagen fibers in a bone marrow biopsy for myelofibrosis grading. Bone marrow biopsy with high grade of fibrosis are imaged with (a) FT-IR and (b) O-PTIR adjacent sections stained with (c) Masson’s trichrome and (d) reticulin stains. Inset from region A with a thin (1 μm) collagen fiber is shown using (e) visible, (f) FT-IR, and (g) O-PTIR(g) imaging. These images show that the fiber which is not visible with diffraction-limited FT-IR imaging is visible using O-PTIR. The ratio of amide II peak to amide I peak for the collagen fiber from inset B of (e–g) for three polarizations: P0°, P45° and P−45° shown in (h), (i), and (j), respectively, indicate higher values for polarization P0° as polarization is parallel to the fiber orientation.
The ability of our polarization-sensitive O-PTIR scheme to measure the dichroic properties of thin fibers is illustrated in three images (h-j) from Fig. 3. These images present ratios of amide bands (amide II/I) for thin fibers from the inset (B) in .O-PTIR image 3(g) for the three proposed polarizations. As the fiber is horizontal in the center of the image the amide ratio (amide II/I) is highest for polarization P0° as seen in Fig. 3h (with red corresponding to high values and blue to low). The fiber orientation at the left edge changes along 20° and correspondingly, there is a small decrease in the amide ratio for P0° and an increase in the amide ratio for P45°. The fiber orientation towards the right changes from 0° to −45° and then 90° due to bend in the fiber as seen in inset B in Fig. 3e. In this case, the amide ratio is higher for P−45° at the bend than the other two polarizations (Fig. 3h–j). Results from Fig. 3 demonstrate that polarization-sensitive high-resolution O-PTIR imaging enables the determination of the orientation of micrometer diameter fibers in clinical bone marrow samples. Background pixels with values close to the noise level in the amide I bands are masked out in Figs. 3h–j.
Next, we quantitatively analyze changes in amide ratios between fiber orientations by acquiring hyperspectral images from regions of interest (ROIs) on tissue where collagen fiber bundles are predominantly oriented along one of the proposed polarizations (P0°, P45° and P−45°). Figure 4 shows boxplots (column a) and amide ratios for ROIs (columns c-e) in which most fibers are oriented along θ =0° (top row), 45° (middle row), and −45° (bottom row). Boxes from the boxplots present the quantitative spread of amide ratios corresponding to each polarization. The boxplot for the top row where fibers are oriented predominantly along 0° showsthe maximum value of amide ratios for P0° and almost equal values for P45° and P−45°. Qualitative visualization of amide ratios per pixel shows similar results for the three proposed polarizations. Similarly, where most of the fibers are oriented predominantly along −45°/135° (middle row), the highest amide ratios are seen for P−45° and the lowest for P45°. Visualization of amide ratios at each pixel also shows higher values for P−45° and lower values for P45° for most pixels, except at the edge where thin fibers are branching out at different orientations. The bottom row ROI contains fibers oriented predominantly along 40°. Quantitative results from boxplot shows the highest values of amide ratio for P45° and the lowest for P−45°. Figure 4 shows the relation between amide II to amide I ratios for each polarization with fiber orientation. These three ROIs show that the amide ratio follows a trend: the amide ratio is highest when the polarization is parallel to the fiber orientation and lowest when polarization is perpendicular, with the third measurement being in between. Based on these observations, we propose a method of determining fiber orientation using the amide II to amide I ratio under the three proposed polarizations.
Figure 4.

Quantifying variance of intrinsic dichroism of collagen in clinical biopsy samples by computing ratio of amide II to amide I Rθ at three proposed polarizations: P0°, P45°, and P−45°. Each row shows box plots and false-color images of amide II to amide I ratio for proposed polarization for fibers predominantly oriented along 0° (top), −45°, (middle) and 45° (bottom). Boxplot shows a trend in amide II to amide I ratio for different polarization measurements that can be used to determine the orientation of collagen fibers.
Figure 4 utilizes Eq. 1 and Eq. 5 to relate collagen fiber orientations and the IR dichroic ratio at amide I and amide II. In Fig. 4, ROIs contain collagen fibers that are approximately parallel to one of the selected linear polarization to within ±10° as seen in the visible light images. Boxplot results from Fig. 4 show that amide peak ratios computed with the proposed linear polarizations follow a trend. For example, fibers parallel to light polarization have amide ratios that are 0.8 or higher. Fibers oriented diagonally have moderate amide ratio values ( ≈ 0.6), and fibers oriented perpendicular to the light polarization have low amide ratios ( < 0.4). The trend observed in Fig. 4 shows that we can determine collagen fiber orientation based on amide ratios obtained from polarization-sensitive imaging at just two wavenumbers. This observation enables a new technique to quantitatively characterize the structural integrity of collagen fibers on a microscopic scale in a label free and time efficient manner. We synthesize data from multiple measurements into a single metric which can be used to microscopically characterize bone marrow fibrosis.
Wavenumber dependant dichroic behavior can distinguish histology classes such as collagen with polarization-dependant absorption. Here, we present a quantitative technique to distinguish collagen from other histology classes and determine collagen orientation by imaging bone tissue with O-PTIR at two wavenumbers under three polarizations. We collected band images at (1536 cm−1 and 1660 cm−1) using polarized light at P0°, P45°, and P−45° for large bone tissue areas (500 μm × 500 μm). Figure 5 shows ROIs with trabecular bone (yellow arrows), blood vessel (red arrow), and small clusters of collagen fibers (green arrows). The top row of Fig. 5 shows (a) a visible image, (b) O-PTIR band image at 1660 cm−1 and (c) a false-color image for absolute differences of amide II to amide I ratio measured from proposed polarizations. Values at each pixel in Fig. 5c are computed using the Eq. 1. Figure 5c shows higher values at locations where collagen fibers are expected to be present: trabecular bone (yellow arrows), pixels around a blood vessel (red arrow), and collagen fiber clusters (green arrows).
Figure 5.

Identifying collagen and its orientation based on IR dichroic ratio computed from polarization-sensitive O-PTIR imaging at two wavenumbers (1536 cm−1 and 1660 cm−1). Visible image (a) and O-PTIR image (b) at 1660 cm−1 shows a region of interest from bone marrow biopsy that includes trabecular bone (yellow arrows), blood vessel (red arrows), and diffused collagen (green arrow). Image (c) shows the polarization sensitivity of each pixel computed from polarization-sensitive O-PTIR images. It highlights collagen from trabecular bone, around blood vessels, and diffused in the center. Collagen orientation represented with amide ratios from three polarization as red-green-blue color channels of the image (d) with Red: R0°, Green: R45°, and Blue:R−45°. Image (e) shows principal fiber direction extracted from T (cf. Eqs. 3 and 4). Colors encode principal orientation (angle in degrees) of fibers in this image as indicated by the colorbar. Image (f) shows the projection of the tensor onto an angular distribution using Eq. 5. This measure can be used for the quantitative characterization of the structural integrity of collagen fibers.
Figure 5d shows the amide ratio images for three polarizations combined into a single color image where the red, green and blue channels correspond to R0°, R45°, and R−45°, respectively. We quantified collagen orientation by computing tensors using the Jones matrix (Table 1) on amide ratios (see Eq. 2 and Eq. 3). Tensors in Fig. 5e shown in red indicate horizontal orientation, green indicates orientation at angle 45°, and blue indicate orientation at angle −45°. Tensors are plotted on the top of a grayscale O-PTIR band image at 1660 cm−1. To highlight the anisotropic structure of the sample, tensors in Fig. 5e are multiplied by the coherence metric computed from tensor eigenvalues. Figure 5f shows collagen fiber orientation in degrees overlayed on a grayscale O-PTIR band image at 1660 cm−1. Here, a single numerical metric for collagen orientation is obtained at each image location by projecting the tensor images onto an angular distribution using Eq. 5. This metric can be used to quantify the structural integrity of collagen fibers for MF grading in the future.
We performed polarized IR imaging on bone marrow tissue section mounted on an infrared transparent CaF2 substrate to compare and analyze spectral differences with glass-mounted tissue. We chose regions of interest (ROIs) from both the trabecular bone section and central area of bone marrow tissue, just as in the glass-mounted case. In Fig. 6, the top row corresponds to data from the trabecular bone region and the bottom row corresponds to the central region. The figure shows brightfield (visible) images in (a) and (d), IR band images at amide I band (1660 cm−1) in (b) and (e), and visualization of collagen orientation in (c) and (f) corresponding to the ROIs. Plots on the right show spectra measured using three proposed polarizations at the location marked with a yellow star on the visible image corresponding to each ROI. Spectra from the top row (trabecular bone) show very strong polarization-sensitive results as collagen fiber at that location of measurement is parallel to the one of proposed polarization, that is, P−45°. Hence, the relative intensity of amide II to amide I and amide III to amide I is higher for polarization P−45° than polarizations P0° and P45°. In clinical samples, collagen fibers from the central region are thin and are have complex interconnected structures. Therefore it is challenging to find the orientation of fiber using visible images. However, at the location where spectra in the bottom row are measured, collagen fiber orientation is not parallel to any of the proposed polarization. However, the ratio of the amide II to amide I peak is higher for polarizations P0° and P45° than for polarization P−45°. Using the aforementioned tensor calculus, we estimate the fiber orientation to be ≈ 20°.
Figure 6.

Polarization-sensitive IR imaging using CaF2 substrate. We imaged bone marrow tissue mounted on CaF2 using polarization-sensitive IR imaging at two regions of interest (ROIs): one from the trabecular bone region (top row) and the other from the central region (bottom row). Image (a) and (c) are brightfield (visible) images, (b) and (e) are IR band images at amide I band (1660cm−1), and (c) and (f) are collagen orientation corresponding to the regions of interests. Plots on the right show spectra measured using three polarizations at the location marked (yellow star) on the visible image corresponding to each ROIs.
Discussion
The intrinsic birefringence of collagen fibers is well known and has been explored using polarized bright field microscopy. Polarization-sensitive vibrational spectroscopy has also been used to study a variety of polymer samples.27 However, a limited number of studies measure the dichroic behavior of collagen fibers in biological samples.8,15 In this paper, we present the first study of human bone marrow tissue using polarization-sensitive IR. Collagen is present in trabecular bone and around blood vessels in normal human bone marrow biopsies. Increased collagen deposition in the central region of bone marrow is an indication of myelofibrosis. Polarization-sensitive IR imaging can quantify abnormal growth of collagen in bone marrow biopsy, leading to understanding the prognosis and effectiveness of treatments for bone marrow fibrosis.
Previous polarized IR imaging studies are based on manually aligned collagen fibers or extracted fibrils. Studies based on manually stretching and aligned tendons show significant changes in the spectral profiles under parallel and perpendicular polarization of IR laser. Changes in the natural state of fibers due to stretching, staining, and manual aligning increase the intrinsic birefringence of collagen fibers.16 In this paper, we have studied collagen fibers from unstained clinical samples of human bone marrow biopsies. Polarization-sensitive IR imaging measurements of collagen fibers in the natural state provide chemical and structural information, crucial for structural analysis of collagen fibers, and accurate grading of bone marrow biopsies1 in myelofibrosis.
Imaging clinical samples is more challenging than prior studies due to complex interconnected structures of fibers and interference from surrounding structures such as hematopoietic cells, making the measurements sensitive to focusing in the z-direction. To avoid changes in the spectral measurements due to focusing, we used a thin tissue section of 3 μm thickness. An other challenge imaging clinical bone marrow tissue is variation in laser power sensitivity among different histology classes due to dramatic differences in IR absorbance. Central regions of bone marrow biopsies have thin and sparse fibers compared to trabecular bone structures with thick and dense fibers. Selection of right IR laser power and probe power is required to achieve a good signal-to-noise ratio in the central part of bone marrow and avoid chemical deformation of trabecular bone due to significant absorbance.
The FT-IR imaging requires tissue mounted on either mid-IR transparent substrates in transmission mode or glass substrates with mid-IR reflective coatings for transflection. O-PTIR allows spectroscopic imaging on glass slides without reflective coatings. We obtain chemical as well as structural information of collagen from clinical bone marrow biopsies mounted on glass slides that are routinely used for histo-pathology. Glass absorbance in the 900 to 1250 cm−1 wavenumber range makes spectral measurements challenging. We have intentionally avoided this spectral range for our calculations. We have shown that spectral information from amide I and amide II regions is sufficient for determining collagen orientation. Also, imaging tissue on histology glass slides is less expensive and fits into the normal pathology pipeline with minimal changes to existing protocols. It also enables prognostic study on retrospective clinical samples.
Comparing spectra from Figs. 2 and 6, we observe that polarization-sensitive O-PTIR spectra on both CaF2 and glass substrates are similar in the amide I and amide II regions, but not in the amide III region. This is due to strong glass absorbance in the later spectral range. We perform orientation calculations only using amide I and amide II bands by design so that the tissue measurements can be substrate independent. This provides the flexibility required for clinical translation of our results. Orientation calculations and results from both CaF2 (Fig. 6) and glass substrates (Fig. 5) demonstrate the consistency of these calculations and the efficacy of our approach especially when using clinically convenient glass substrates. Such measurements and calculations with tissue mounted on glass substrates was previously not possible using FT-IR imaging due to the infrared opaqueness of glass.
Spectra observed in this study show baseline offset especially in regions with high absorbance. However, the mechanism and interpretation of these offsets is different from FT-IR imaging. The theoretical underpinning28 of O-PTIR imaging differs from FT-IR imaging, and knowledge from FT-IR imaging, especially about artifacts, cannot be extrapolated to O-PTIR imaging. For instance, O-PTIR can provide measurements from the surface of optically thick and opaque samples, which FT-IR cannot. The O-PTIR instrument is a “pump-probe” optical spectroscopic microscope, and unlike in FT-IR, scattering is the source of the signal in O-PTIR and not an artifact to reconcile or mitigate. The scattering and thickness effects seen in FT-IR have been modeled extensively and explained quantitatively29;30, and O-PTIR does not exhibit the same effects because the nature of light-matter interaction is different.
In Fig. 4, we demonstrate the ability of polarization-sensitive O-PTIR imaging to determine the orientation of isolated thin collagen fibers (≈1 μm thickness). This can help in the early detection of fibrosis by identifying divergence in the zonal arrangement of collagen. Regions of interests from the second row of Fig. 4 show thin fibers at the edges which are growing outwards horizontally in contrast to the zonal arrangement of fiber in the rest of the tissue. This is not self-evident from the brightfield image but is clearly seen in the red–blue color contrast in images R0° and R45° obtained using polarization-sensitive O-PTIR imaging. Previous study on finding collagen orientation proposed imaging with FT-IR at several polarizations ranging from 0° to 180° which is time consuming.8 Proposed imaging scheme is time-efficient compared to conventional FT-IR imaging as it involves discrete frequency imaging with only two wavenumbers under three polarizations. Moreover, the proposed O-PTIR technology has higher resolution relative to prior diffraction limited FT-IR studies. All ROIs imaged in this study showed positive staining for both trichrome and reticulin stain. They contain both collage type I and reticulin (collagen type III) fibers. Therefore, results presented here are applicable to collagen type I, collagen type IV, and reticulin fibers.
Conclusion
In this work, we first recognize the qualitative spectral differences between the absorption properties of collagen fiber in clinical human bone tissue samples measured at different light polarizations. We propose and implement a scheme to measure polarization dependant absorption (dichroic) properties under three polarizations to eliminate ambiguity in extracting fiber orientation from measurements. We present data to show that thin fibers (≈1 μm diameter) that are not visible under FT-IR imaging are made visible using our O-PTIR instrumentation. Furthermore, we propose a technique to quantify fiber orientation using measurements of collagen dichroic properties at two wavenumbers (amide I and amide II). We show that the amide ratio measured at the three proposed polarizations can be related to fiber orientation and present experimental evidence in support of the proposed technique. Moreover, experimental data in this study is obtained on routine glass slides that facilitate the clinical translation of MIRSI. This work provides quantitative measures of fiber disorder in human bone marrow tissue and has the potential to facilitate the early diagnosis of fibrosis.
Acknowledgments
We like to thank Photothermal spectroscopy corp. for their support with mIRage instrument.
Funding
The author(s) disclosed receipt of the following financial support for the research, authorship, and/or publication of this article: This work is supported in part by the NLM Training Program in Biomedical Informatics and Data Science T15LM007093 (RM, RR), the Cancer Prevention and Research Institute of Texas (CPRIT) #RR170075 (RR), National Institutes of Health #R01HL146745 (DM), and the National Science Foundation CAREER Award #1943455.
Footnotes
Declaration of Conflicting Interests
DM is a stakeholder in SwiftFront, LLC. The author(s) declared no potential conflicts of interest with respect to the research, authorship, and/or publication of this article.
References
- 1.Bromage TG, Goldman HM, McFarlin SC, et al. “Circularly Polarized Light Standards for Investigations of Collagen Fiber Orientation in Bone”. Anat. Rec. Part B 2003. 274(1): 157–168. [DOI] [PubMed] [Google Scholar]
- 2.Rich L, Whittaker P. “Collagen and Picrosirius Red Staining: A Polarized Light Assessment of Fibrillar Hue and Spatial Distribution”. J. Morphol. Sci 2017. 22(2): 97–104. [Google Scholar]
- 3.Whittaker P, Kloner R, Boughner D, et al. “Quantitative Assessment of Myocardial Collagen with Picrosirius Red Staining and Circularly Polarized Light”. Basic Res. Cardiol 1994. 89(5): 397–410. [DOI] [PubMed] [Google Scholar]
- 4.Kvasnicka HM, Beham-Schmid C, Bob R, et al. “Problems and Pitfalls in Grading of Bone Marrow Fibrosis, Collagen Deposition and Osteosclerosis: A Consensus-Based Study”. Histopathology. 2016. 68(6): 905–915. [DOI] [PubMed] [Google Scholar]
- 5.Cicchi R, Vogler N, Kapsokalyvas D, et al. “From Molecular Structure to Tissue Architecture: Collagen Organization Probed by Shg Microscopy”. J. Biophotonics 2013. 6(2): 129–142. [DOI] [PubMed] [Google Scholar]
- 6.Keikhosravi A, Liu Y, Drifka C, et al. “Quantification of Collagen Organization in Histopathology Samples Using Liquid Crystal Based Polarization Microscopy”. Biomed. Opt. Express 2017. 8(9): 4243–4256. [DOI] [PMC free article] [PubMed] [Google Scholar]
- 7.Walsh MJ, Reddy RK, Bhargava R. “Label-Free Biomedical Imaging with Mid-IR Spectroscopy”. IEEE J. Sel. Top. Quantum Electron 2012. 18(4): 1502–1513. [Google Scholar]
- 8.Bi X, Li G, Doty S, et al. “A Novel Method for Determination of Collagen Orientation in Cartilage by Fourier Transform Infrared Imaging Spectroscopy (FT-IRIS)”. Osteoarthr. Cartil 2005. 13(12): 1050–1058. [DOI] [PubMed] [Google Scholar]
- 9.Baker MJ, Gazi E, Brown MD, et al. “FTIR-based Spectroscopic Analysis in the Identification of Clinically Aggressive Prostate Cancer”. Br. J. Cancer 2008. 99(11): 1859–1866. [DOI] [PMC free article] [PubMed] [Google Scholar]
- 10.Reddy RK, Bhargava R. “Accurate Histopathology from Low Signal-To-Noise Ratio Spectroscopic Imaging Data”. Analyst. 2010. 135(11): 2818–2825. [DOI] [PubMed] [Google Scholar]
- 11.Pounder FN, Reddy RK, Bhargava R. “Development of a Practical Spatial-Spectral Analysis Protocol for Breast Histo-pathology Using Fourier Transform Infrared Spectroscopic Imaging”. Faraday Discuss. 2016. 187: 43–68. [DOI] [PMC free article] [PubMed] [Google Scholar]
- 12.Mankar R, Walsh MJ, Bhargava R, et al. “Selecting Optimal Features from Fourier Transform Infrared Spectroscopy for Discrete-Frequency Imaging”. Analyst. 2018. 143(5): 1147–1156. [DOI] [PMC free article] [PubMed] [Google Scholar]
- 13.Mittal S, Yeh K, Leslie LS, et al. “Simultaneous Cancer and Tumor Microenvironment Subtyping Using Confocal Infrared Microscopy for All-Digital Molecular Histopathology”. Proc. Natl. Acad. Sci. USA 2018. 115(25): E5651–E5660. [DOI] [PMC free article] [PubMed] [Google Scholar]
- 14.Pahlow S, Weber K, Popp J, et al. “Application of Vibrational Spectroscopy and Imaging to Point-Of-Care Medicine: A Review”. Appl. Spectrosc 2018. 72(101): 52–84. [DOI] [PMC free article] [PubMed] [Google Scholar]
- 15.Bakir G, Girouard BE, Wiens R, et al. “Orientation Matters: Polarization Dependent IR Spectroscopy of Collagen From Intact Tendon Down to the Single Fibril Level”. Molecules. 2020. 25(18): 4295. [DOI] [PMC free article] [PubMed] [Google Scholar]
- 16.Wolman M, Kasten F. “Polarized Light Microscopy in the Study of the Molecular Structure of Collagen and Reticulin”. Histochemistry. 1986. 85(1): 41–49. [DOI] [PubMed] [Google Scholar]
- 17.Conklin MW, Eickhoff JC, Riching KM, et al. “Aligned Collagen is a Prognostic Signature for Survival in Human Breast Carcinoma”. Am. J. Pathol 2011. 178(3): 1221–1232. [DOI] [PMC free article] [PubMed] [Google Scholar]
- 18.Drifka CR, Tod J, Loeffler AG, et al. “Periductal Stromal Collagen Topology of Pancreatic Ductal Adenocarcinoma Differs from that of Normal and Chronic Pancreatitis”. Mod. Pathol 2015. 28(11): 1470–1480. [DOI] [PubMed] [Google Scholar]
- 19.Mankar R, Bueso-Ramos CE, Yin CC, et al. “Automated Osteosclerosis Grading of Clinical Biopsies Using Infrared Spectroscopic Imaging”. Anal. Chem 2019. 92(1): 749–757. [DOI] [PMC free article] [PubMed] [Google Scholar]
- 20.Samolis PD, Sander MY. “Phase-Sensitive Lock-In Detection for High-Contrast Mid-Infrared Photothermal Imaging with SubDiffraction Limited Resolution”. Opt. Express 2019. 27(3): 2643–2655. [DOI] [PubMed] [Google Scholar]
- 21.Marcott C, Kansiz M, Dillon E, et al. “Two-Dimensional Correlation Analysis of Highly Spatially Resolved Simultaneous IR and Raman Spectral Imaging of Bioplastics Composite Using Optical Photothermal Infrared and Raman Spectroscopy”. J. Mol. Struct 2020. 1210: 128045. [DOI] [PMC free article] [PubMed] [Google Scholar]
- 22.Xia Y, Ramakrishnan N, Bidthanapally A. “The Depth-Dependent Anisotropy of Articular Cartilage by Fourier-Transform Infrared Imaging (FTIRI)”. Osteoarthr. Cartil 2007. 15(7): 780–788. [DOI] [PMC free article] [PubMed] [Google Scholar]
- 23.Eklouh-Molinier C, Sebiskveradze D, Feru J, et al. “Changes of Skin Collagen Orientation Associated with Chronological Aging as Probed by Polarized-FTIR Micro-Imaging”. Analyst. 2014. 139(10): 2482–2488. [DOI] [PubMed] [Google Scholar]
- 24.Kansiz M, Spadea A, Nallala J, et al. “Review of Life Science Applications Using Submicron O-PTIRand Simultaneous Raman Microscopy: A New Paradigm in Vibrational Spectroscopy”. SPIE BIOS In Advanced Chemical Microscopy for Life Science and Translational Medicine. 2021. 11656: 1165617. [Google Scholar]
- 25.Gadaleta SJ, Landis WJ, Boskey AL, et al. “Polarized FT-IR Microscopy of Calcified Turkey Leg Tendon”. Connect. Tissue Res 1996. 34(3): 203–211. [DOI] [PubMed] [Google Scholar]
- 26.Heffner BL. “Automated Measurement of Polarization Mode Dispersion Using Jones Matrix Eigenanalysis”. IEEE Photonics Technol. Lett 1992.4(9): 1066–1069. [Google Scholar]
- 27.de Campos Vidal B. “Using the FT-IR Linear Dichroism Method for Molecular Order Determination of Tendon Collagen Bundles And Nylon 6”. Acta Histochem. 2013. 115(7): 686–691. [DOI] [PubMed] [Google Scholar]
- 28.Zhang D, Li C, Zhang C, et al. “Depth-Resolved Mid-Infrared Photothermal Imaging of Living Cells and Organisms with Submicrometer Spatial Resolution”. Sci. Adv 2016. 2(9): e1600521. [DOI] [PMC free article] [PubMed] [Google Scholar]
- 29.Davis BJ, Carney PS, Bhargava R. “Theory of Mid-Infrared Absorption Microspectroscopy: II. Heterogeneous Samples”. Anal. Chem 2010. 82(9): 3487–3499. [DOI] [PubMed] [Google Scholar]
- 30.Reddy R, Davis B, Carney PS, et al. “Modeling Fourier Transform Infrared Spectroscopic Imaging of Prostate and Breast Cancer Tissue Specimens”. 2011 IEEE International Symposium on Biomedical Imaging: From Nano to Macro. Chicago, Illinois; 30 March-2 April 2011. Pp. 738–741. [Google Scholar]