

Abstract
Background:
The kynurenine pathway (KP) comprises a family of tryptophan-derived metabolites that some studies have reported are associated with poorer cognitive performance and an increased risk of Alzheimer’s disease and related dementias (ADRD).
Objective:
The objective of this study was to determine the associations of plasma KP metabolites (kynurenine [KYN], kynurenic acid [KA], and tryptophan [TRP]) with a panel of plasma ADRD biomarkers (Aβ42/Aβ40 ratio, pTau-181, glial fibrillary acidic protein [GFAP], and neurofilament light [NfL]) and cognitive performance in a subset of older adults drawn from the Duke Physical Performance Across the LifeSpan (PALS) study.
Methods:
The Montreal Cognitive Assessment (MoCA) was used to assess cognitive performance. We used multivariate multiple regression to evaluate associations of the KYN/TRP and KA/KYN ratios with MoCA score and plasma ADRD biomarkers at baseline and over two years (n=301; Age=74.8±8.7).
Results:
Over two years, an increasing KYN/TRP ratio was associated with increasing concentrations of plasma p-Tau181 (β=6.151; 95%CI [0.29, 12.01]; p=0.040), GFAP (β=11.12; 95%CI [1.73, 20.51]; p=0.020), and NfL (β=11.13; 95%CI [2.745, 19.52]; p=0.009), but not MoCA score or the Aβ42/Aβ40 ratio. There were no significant associations of KA/KYN with MoCA score or plasma ADRD biomarkers.
Conclusion:
Our findings provide evidence that greater concentrations of KP metabolites are associated longitudinally over two years with greater biomarker evidence of neurofibrillary tau pathology (pTau-181), neuroinflammation (GFAP), and neurodegeneration (NfL), suggesting that dysregulated KP metabolism may play a role in ADRD pathogenesis.
Keywords: kynurenines, tryptophan, ADRD, biomarkers, cognition
INTRODUCTION
The kynurenine pathway (KP) comprises a family of tryptophan-derived metabolites that regulate innate and adaptive immune responses, while also serving as the major biosynthetic pathway for nicotinamide adenine dinucleotide (NAD+)[1]. KP metabolites are produced primarily by the liver and immune cells, including brain microglia[2]. Dysregulated KP metabolism is seen with aging and chronic inflammation and has been implicated in the pathogenesis of neuroinflammatory conditions, including Alzheimer’s Disease and related dementias (ADRD). Dysregulated KP signaling is hypothesized to contribute to ADRD by the direct, neurotoxic effects of KP intermediates and/or by enhancing the neuroinflammatory response to ADRD pathology.
The first step in the KP is the oxidation of tryptophan (TRP) to kynurenine (KYN) by tryptophan 2,3-dioxygenase (TDO) or indolamine 2,3 dioxygenase 1 (IDO-1). KYN generated in the periphery is readily transported across the blood brain barrier (BBB), where it is further metabolized to 3-OH-kynurenine and quinolinic acid, both of which have neurotoxic effects[2]. Peripheral KYN can be also be metabolized by kynurenine amino transferases (KATs) to KA, which is unable to cross the BBB. Analyses of the KP therefore use the KYN/TRP ratio as an indirect measure of TDO/IDO-1 activity and the KA/KYN ratio as an indirect measure of KAT activity.
Available human studies evaluating associations of KP metabolites with amyloid pathology and cognitive performance have reported discrepant findings [3–6]. A recent systematic review and meta-analysis by Almulla, et al. found that differences in KYN/TRP between AD and controls were driven by differences in TRP concentrations as opposed to KYN [7]. To our knowledge, no studies have evaluated associations of KP metabolites with plasma biomarkers of neurofibrillary tau pathology (pTau-181) or neuroinflammation (GFAP) and few studies have evaluated longitudinal associations of KP metabolites with cognitive performance and plasma ADRD biomarkers.
The objective of this analysis was to determine, in a cohort of community-dwelling older adults, the cross-sectional and longitudinal associations of KP metabolites with performance on the Montreal Cognitive Assessment (MoCA) and plasma ADRD biomarkers, including measures of amyloid pathology (the ratio of Aβ42/Aβ40), neurofibrillary tau pathology (pTau-181), neurodegeneration (NfL) and neuroinflammation (GFAP).
METHODS
Study Design.
The Duke Physical Performance Across the Lifespan (PALS) study is a longitudinal cohort study designed by the Duke (Pepper) Older Americans Independence Center to examine patterns of age- and sex-related differences in biological markers and physical function across the adult lifespan [8,9]. Enrolled participants (n=975) were stratified in equal numbers by sex and by decade of life with a target of 100 participants per decade from age 30 to 59; 200 per decade from ages 60 to 79; and all interested participants over age 80. Assessments were repeated after two years. PALS study participants were drawn from the Measurement to Understand the Reclassification of Disease of Cabarrus/Kannapolis (MURDOCK) Community Registry and Biorepository and were recruited between 2013 and 2016[10,11].
We quantified plasma concentrations of KP metabolites (KYN, KA, and TRP) and ADRD biomarkers (Aβ40, Aβ42, pTau-181, GFAP, NfL) in the subset of PALS participants aged ≥55 with available data and plasma at the baseline and two-year assessments (n=301). The MoCA was used to assess cognitive performance. MoCA scores were adjusted for self-reported educational attainment by adding one point to the total score for participants who did not obtain additional education beyond a high school degree. Given previously published findings that KP metabolites are associated with depression and presence of type 2 diabetes[6,12], we included history of major depression or another psychiatric diagnosis and history of diabetes in our analysis. History of depression or other psychiatric diagnoses and diabetes were obtained by self-report; assessment of diabetes status did not differentiate type 1 from type 2 diabetes. PALS was approved by the Institutional Review Boards of Duke University Medical Center and the Carolinas Healthcare System and participants provided written informed consent.
Biomarker Quantification.
Plasma concentrations of KYN, KA, and TRP were quantified from non-fasted EDTA plasma samples by mass spectrometry according to previously-published methods[13]. 50 μl of plasma spiked with the heavy isotope-labeled internal standards KYN-d6 (Cambridge Isotope Laboratories), KA-d5 (CDN Isotopes), and TRP-d5 (Cambridge Isotope Laboratories) was deproteinated with methanol, dried under nitrogen, and reconstituted in water. Metabolites were analyzed on a Waters Acquity UPLC system coupled to a Waters Xevo TQ-S triple quadrupole mass spectrometer (Milford, MA). The analytical column (Waters Acquity UPLC HSS T3 Column, 1.8 μm, 2.1×100 mm) equipped with a guard column (Agilent Rapid Resolution cartridge, ZORBAX SB-C8, 3.5 m, 2.1 30 mm) was maintained at 30°C and the flow rate was set at 0.3 ml/min. The gradient began with 100% eluent A (0.1% formic acid in water) and was then programmed as follows: 0–2 min 0% eluent B (95:5 acetonitrile-water, 0.1% formic acid); 2–10 min gradient to 40% eluent B; 10–11 min gradient to 100% eluent B followed by a 2 min wash and 2 min equilibration. Mass transitions of m/z 209>146 for KYN, m/z 215>151 for KYN-d6, m/z 190>116 for KA, 195>121 for KA-d5, m/z 205>146 for TRP, and 210>150 for TRP-d5 were monitored in a positive ion electrospray ionization mode. Metabolite concentrations were computed using Waters TargetLynx Quantitative Analysis and an external calibration constructed from a serial dilution of the KYN, KA, and TRP standards (Sigma, St. Louis, MO) in dialyzed FBS.
Plasma Aβ40, Aβ42, pTau-181, GFAP, and NfL were quantified in singlicate from non-fasted EDTA plasma samples using the ultrasensitive Quanterix Simoa assay on a Simoa HD-X instrument (Quanterix, Billerica, MA, USA). For quantification of pTau-181, the Simoa pTau-181 Advantage V2 kit was used. For quantification of Aβ40, Aβ42, GFAP, and NfL, the Simoa Neuro 4-Plex E kit was used. A high and low concentration quality control sample and a pooled human plasma control sample were included in duplicate on each plate. Intra-assay coefficients of variation (CoV) for the high and low concentration quality controls and pooled human plasma control samples were below 15% for GFAP, Aβ40, and Aβ42. For pTau-181, one batch of plates had a CoV for the low concentration control of 17.9%, while the CoVs for the high concentration and pooled human plasma controls were <10%. For NfL, one batch of plates had a CoV for the high concentration control of 16.4%, while the CoVs for the low concentration and pooled human plasma controls were <10%. Normality of plasma biomarker distribution were evaluated by visual inspection; non-normally distributed biomarkers were log transformed.
Statistical Analysis.
All analyses were conducted in R Version 4.1. We used the KYN/TRP and KA/KYN ratios for all analyses. Plasma KYN, KA, pTau-181, GFAP, and NfL were not normally-distributed and therefore were log-transformed. We calculated Pearson correlation coefficients for the association of KP metabolite ratios and plasma ADRD biomarkers with age using data from the baseline assessment. We used a paired Student’s t-test to evaluate change in KP metabolites and plasma ADRD biomarkers over the two-year study period.
To determine the association of the KP metabolites with MoCA score and plasma ADRD biomarkers at baseline and over two years of follow up, we used multivariate multiple linear regression. To minimize multiple testing, we used Wilk’s Λ as an omnibus test to determine whether each predictor was significantly associated with the outcomes. We next fitted univariate models for each outcome of interest, retaining variables with a Wilk’s Λ <0.05. For analyses evaluating change in the KP metabolite with change in the outcome, we retained variables that were significantly associated with the outcome of interest at the baseline assessment. For models evaluating change, outcome variables and predictors were residualized for their baseline values.
Given previously-published findings suggesting that plasma concentrations of KP metabolites were associated with presence of type 2 diabetes and major depressive and other psychiatric disorders, we conducted additional sensitivity analyses adjusting for self-reported diagnosis of diabetes and major depressive disorder or other psychiatric diagnosis in addition to age and sex. We also conducted sensitivity analyses to determine whether these associations differed by sex, baseline age, and baseline MoCA score by including an interaction term for the KP metabolite and sex, baseline age, or baseline MoCA score.
A recent meta-analysis reported that differences in KYN/TRP between AD and controls were driven by differences in TRP as opposed to KYN [7]. To determine whether our findings were driven by differences in TRP concentrations, we conducted additional sensitivity analyses with individual KP metabolites (not ratios) as the predictors, following the same methods described above.
RESULTS
Sample Characteristics.
Descriptive statistics for PALS participants in this cohort are shown in Table 1. The mean baseline MoCA score for the sample was 25, below the published cut-off of ≥26 for mild cognitive impairment, but consistent with population means in a large United States-based sample[14]. One participant self-reported a diagnosis of Alzheimer’s disease. There were two participants with missing diabetes assessment data and five with missing psychiatric diagnosis data; these were recoded as not having diabetes or a psychiatric diagnosis. Compared to the participants included in our analysis, participants ≥ 55 years of age who did not return for the two-year assessment had a lower baseline MoCA Score (23 vs. 25; p<0.001), but there were no significant differences with respect to age or sex.
Table 1. PALS Cohort Descriptive Statistics.
Mean (SD) provided for continuous variables. Count and percentage provided for categorical variables. We used a paired Student’s t-test to evaluate change in KP metabolites and plasma ADRD biomarkers over the two-year study period. Biomarkers for which there was a significant change over the two-year study period are bolded.
| Baseline (n=301) | Year 2 (n=301) | Change | |
|---|---|---|---|
| Age | 74.8 (8.65) | 76.8 (8.67) | 2.0 (0.45) |
| Sex | |||
| Male | 135 (44.9%) | — | — |
| Female | 166 (55.1%) | — | — |
| Race/Ethnicity | |||
| African-American | 11 (3.7%) | — | — |
| Other Race/Ethnicity | 2 (0.7%) | — | — |
| White | 288 (95.7%) | — | — |
| Education | |||
| > HS Education | 234 (77.7%) | — | — |
| HS Education or Less | 67 (22.3%) | — | — |
| BMI | 26.8 (4.38) | 26.7 (4.55) | −0.11 (1.38) |
| MoCA Score | 25 (3.46) | 25 (3.70) | 0.09 (2.54) |
| KYN (μM) | 1.80 (0.52) | 1.85 (0.57) | 4.14E-02 (4.75E–01) |
| KA (μM) | 5.73E-02 (3.46E–02) | 5.69E-02 (2.70E–02) | −3.53E-04 (2.64E–02) |
| TRP (μM) | 53.32 (10.85) | 51.91 (11.88) | −1.41 (11.25)* |
| KYN/TRP Ratio | 1.98E-02 (5.58E–03) | 2.01E-02 (6.28E–03) | 9.92E-04 (4.02E–03) *** |
| KA/KYN Ratio | 1.10E-03 (7.65E–04) | 1.12E-03 (6.14E–04) | 2.1E-05 (5.33E–04) |
| Aβ42/Aβ40 Ratio | 0.06 (0.01) | 0.06 (0.01) | 4.8E-04 (0.01) |
| pTau-181 (pg/mL) | 3.40 (2.45) | 3.58 (2.80) | 0.18 (1.20) * |
| NFL (pg/mL) | 26.88 (15.47) | 28.51 (17.21) | 1.63 (11.38) * |
| GFAP (pg/mL) | 175.24 (103.95) | 169.88 (99.30) | −5.35 (65.73) |
= p-value < 0.05;
** = p-value < 0.01;
= p-value <0.001.
BMI = body mass index; KTR = KYN/TRP ratio; KATR = KA/TRP ratio.
At the baseline assessment, associations with age included: positive correlations with KYN (r=0.33; p<0.001), KA (r=0.19; p<001), the KYN/TRP ratio (r=0.36; p<0.001), pTau-181 (r=0.40; p<0.001), GFAP (r=0.62; p<0.001), and NfL (r=0.62; p<0.001); and inverse correlations with TRP (r=−0.16; p=0.006) and the Aβ−42/Aβ−40 ratio (r=−0.24; p<0.001); but not the KA/KYN ratio (r=0.09; p=0.123). We performed a paired Student’s t-test to determine if there was a significant change in the biomarkers over the two-year study period. Over two-years, plasma KYN/TRP, p-Tau181, and NfL increased and TRP decreased (all p≤0.03), while there were no significant changes in KYN, KA/KYN, MoCA score, Aβ42/Aβ40 ratio, or GFAP.
Cross-sectional Associations of KP Metabolites with MoCA Score and Plasma ADRD Biomarkers.
We first evaluated the association of KYN/TRP and KA/KYN with MoCA score and plasma ADRD biomarkers at the baseline PALS assessment. The Wilk’s Λ p-values for the association of age, sex, and KYN/TRP with MoCA score and the plasma ADRD biomarkers were statistically significant (all Wilk’s Λ p <0.001). There was no significant association of KA/KYN with any of the outcomes (Wilk’s Λ p=0.610). Evaluating the individual models, greater KYN/TRP was associated with lesser Aβ42/Aβ40 and greater concentrations of p-Tau-181, GFAP, and NfL, but not MoCA Score, adjusting for age and sex (Figure 1). Adjusting for self-reported psychiatric or diabetes diagnosis did not affect our results (data not shown). There was no evidence that associations of KYN/TRP with the plasma ADRD biomarkers differed by sex, baseline age, or baseline MoCA score (Wilk’s Λ p-value for all interaction terms ≥0.212).
Figure 1. Baseline associations of plasma KYN/TRP with MoCA score and plasma ADRD biomarkers.
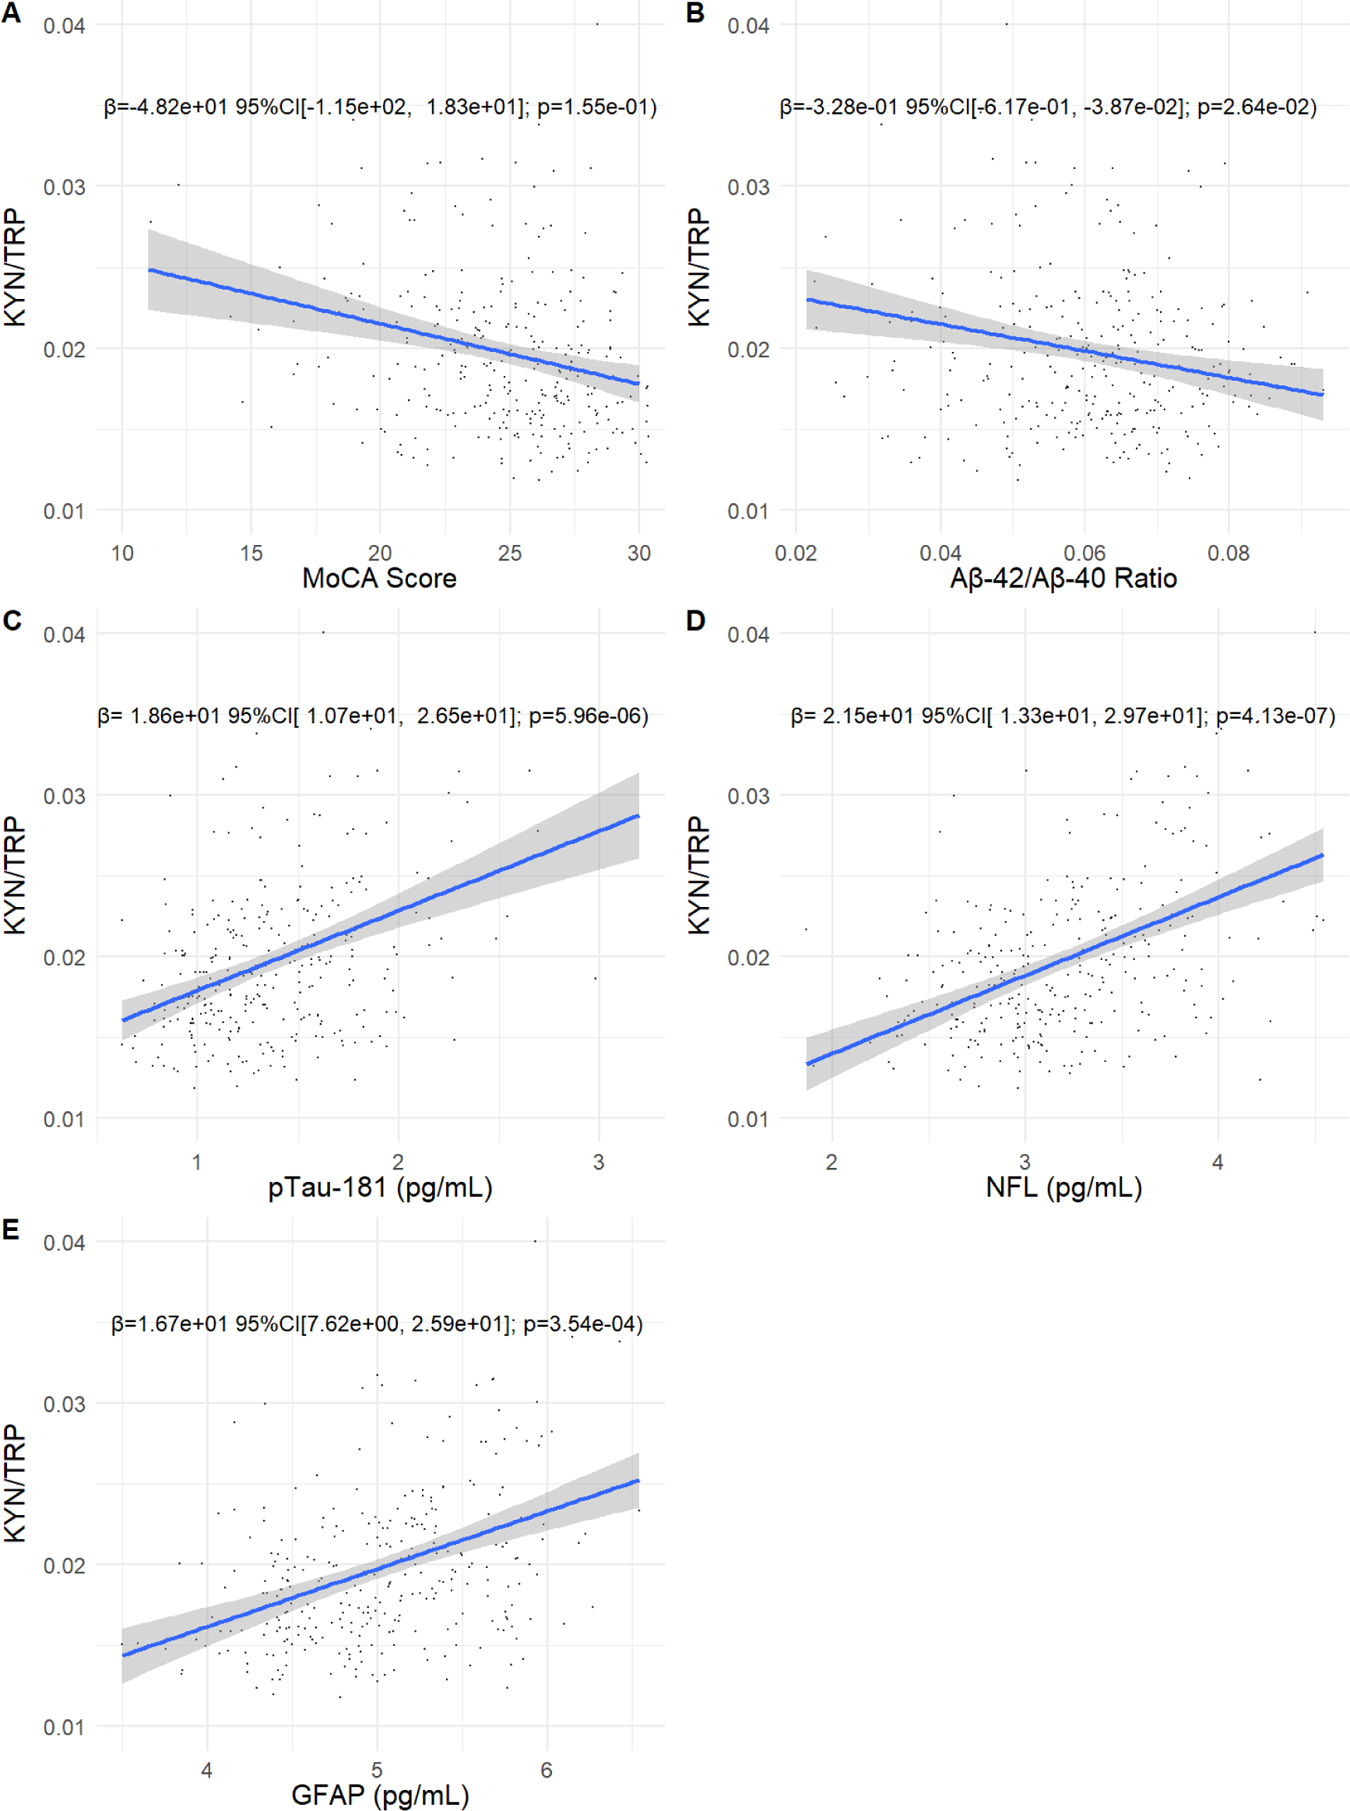
Scatter plots showing the association of the KYN/TRP ratio with MoCA score, the Aβ−42/Aβ−42 ratio, pTau-181, GFAP, and NfL. Plasma kynurenine, kynurenic acid, NfL, pTau-181, and GFAP were not normally-distributed and were log transformed. MoCA score and the plasma ADRD biomarkers are plotted on the x axis and the KYN/TRP ratio is plotted on the y axis. Effect size, 95% confidence intervals, and p-values are shown for the association of the KYN/TRP ratio with each biomarker, adjusting for age and sex.
Longitudinal Associations of KP Metabolites with Plasma ADRD Biomarkers.
We next evaluated whether change in KYN/TRP over two years associated with change in MoCA score and plasma ADRD biomarkers. The Wilk’s Λ p-values for the associations of age and change in KYN/TRP with change in plasma ADRD biomarkers were statistically significant (Wilk’s Λ p-values: age p=0.0002; KYN/TRP p=0.031). Evaluating the individual models, increasing KYN/TRP associated with increasing concentrations of pTau-181, NfL, and GFAP, but not MoCA score or the Aβ42/Aβ40 ratio (Table 2).
Table 2. Association of change in the KYN/TRP ratio with change in plasma ADRD biomarkers over two years.
Plasma kynurenine, kynurenic acid, NfL, pTau-181, and GFAP were not normally-distributed and were log transformed. Univariate models showing the association of baseline age and change in the KYN/TRP ratio with change in the plasma ADRD biomarkers.
| MoCA Score | Δ Aβ Ratio | Δ pTau-181 | Δ GFAP | Δ NfL | |||||||||||
|---|---|---|---|---|---|---|---|---|---|---|---|---|---|---|---|
| Beta | 95% CI | p | Beta | 95% CI | p | Beta | 95% CI | p | Beta | 95% CI | p | Beta | 95% CI | p | |
| Age | −5.28e−02 | −8.45e−02, −2.11e−02 | 0.001 | 1.55e−04 | 4.97e−05, 2.59e−04 | 0.004 | 2.98e–03 | 3.05e–04, 5.66e−03 | 0.029 | 4.50e−05 | −4.25e–03, 4.34e−03 | 0.984 | 1.87e−03 | −1.97e−03, 5.70e−03 | 0.339 |
| Δ KYN/TRP | −3.53e+01 | −1.05e+02, 3.40e+01 | 0.317 | −4.82e−02 | −2.77e−01, 1.81e−01 | 0.679 | 6.15e+00 | 2.91e–01, 1.20e+01 | 0.040 | 1.11e+01 | 1.73e+00, 2.05e+01 | 0.020 | 1.11e+01 | 2.74e+00, 1.95e+01 | 0.009 |
CI = Confidence Interval; p = p-value; Aβ Ratio = ratio of Aβ42/Aβ40.
Cross-sectional and Longitudinal Associations of Individual KP Metabolites with MoCA Score and Plasma ADRD Biomarkers.
A recently-published systematic review and meta-analysis reported that differences in peripheral KYN/TRP between cognitively-unimpaired older adults and those with AD were largely driven by differences in TRP concentrations [7]. To determine whether our findings were driven by differences in TRP, we repeated our analysis substituting KYN, KA, and TRP for the KYN/TRP and KA/KYN ratios. Greater TRP was associated with a greater MoCA score and lesser concentrations of pTau-181, NfL, and GFAP; greater KYN was associated with greater concentrations of pTau-181 and NfL (Supplementary Results - Table 1). Over two years, increasing concentrations of TRP associated with an increasing MoCA score and decreasing concentrations of GFAP, while an increasing concentration of KYN associated with a declining MoCA score and increasing concentrations of NfL and GFAP (Supplemental Results - Table 2).
Discussion
In a cohort of community-dwelling older adults, we found that greater KYN/TRP was cross-sectionally associated with greater biomarker evidence of ADRD pathology (Aβ42/Aβ40 ratio, pTau-181, GFAP, and NfL). Over two years, increasing KYN/TRP associated with increasing plasma concentrations of pTau-181, GFAP and NfL. Our findings provide evidence that KP activation, leading to increased KYN/TRP, is associated with increasing biomarker evidence of ADRD pathology over time. More specifically, the pattern of our findings suggests that KP metabolites associate most strongly with ADRD biomarkers reflecting greater tau pathology (pTau-181), neuroinflammation (GFAP), and neurodegeneration (NfL). We also demonstrate that these associations are not exclusively due to alterations in TRP concentrations. To our knowledge, this is the first study to report associations of kynurenine pathway metabolites with plasma pTau-181 and GFAP, which adds to the novelty of our findings.
Dysregulated KP metabolism may contribute to ADRD pathogenesis through its role in regulating neuroinflammation and/or through the direct, neurotoxic effects of its intermediate metabolites. The KP is the major biosynthetic pathway for the generation of NAD+ and recent experimental studies demonstrate that KP-mediated NAD+ production regulates macrophage effector functions[1]. Experimental inhibition of quinolate phophoribosyltransferase (QPRT), the final step in the KP that metabolizes quinolinic acid to NAD+, shifts macrophage polarization towards a pro-inflammatory phenotype [1]. Given shared characteristics between peripheral macrophages and microglia, KP dysregulation leading to decreased NAD+ production may contribute to ADRD-associated neuroinflammation. A recent human study using a novel positron emission tomography (PET) ligand that binds to activated microglia found that microglial activation associated with tau pathology and that the combination of Aβ pathology, tau pathology, and microglial activation better predicted cognitive impairment than Aβ and tau pathology alone[15]. Consistent with this, Aβ42 – the most toxic Aβ oligomer – induces expression of IDO-1 in CNS macrophages and microglia[16] and in post-mortem AD brains, IDO-1 and TDO are up-regulated in the hippocampus and co-localize with AD pathology [17,18].
While alterations in KP signaling may reflect a pro-inflammatory immune state, evidence from in vitro and animal studies suggest that KP intermediates directly induce development of ADRD pathology and have neurotoxic effects independent of ADRD pathology [18,19]. In an in vitro study of primary human neurons, exposure to quinolinic acid induced formation of tau fibrils in a dose-dependent manner[18]. Quinolinic acid can also act as an N-methyl-D-aspartate (NMDA) receptor agonist, increase oxidative stress, and contribute to dysregulated proteostasis[19].
Human studies evaluating the association of KP metabolites with ADRD pathology and cognitive performance have produced discrepant findings. Some studies, including our own, report that plasma KP metabolites are associated with greater biomarker evidence of ADRD pathology[4,20–22]. However, a large study (N=1531) using data from the Alzheimer’s Disease Neuroimaging Initiative (ADNI) found that greater peripheral KYN was associated with a lesser amyloid PET burden and better memory performance in a mixed sample of cognitively-impaired and unimpaired participants[5]. A recent systematic review and metanalysis found that while the KYN/TRP was elevated in AD, these differences were driven by lesser concentrations of TRP [7]. With respect to cognitive performance, several studies, including one large population study found that greater plasma KYN was associated with poorer cognitive performance[3,23,24] while others have reported no or positive associations [6,23]. These discrepancies may be due to methodologic differences in quantifying and analyzing KP metabolite data, but more likely reflect incomplete assessment of the KP, particularly with respect to downstream synthesis of NAD+ and its effects on neuroinflammation.
Our findings suggest that dysregulated KP metabolism may be implicated in the pathogenesis of ADRD. Drugs targeting the kynurenine pathway are currently in development for other indications, e.g., cancer and schizophrenia [25]. In addition, diet modification studies in both humans and animal models have also demonstrated favorable changes in KP metabolites [26–29].
Strengths & Limitations.
Our work has several strengths, including the use of a longitudinal cohort of community-dwelling older adults. In addition, to our knowledge, this is the first study to evaluate associations of KP metabolites with plasma pTau-181 and GFAP. Limitations of our work include the small sample size, limited duration of follow up, and lack of clinically-adjudicated cognitive diagnoses. We also limited our analysis to participants who completed the two-year follow up assessment, which could introduce sampling bias. We would expect that PALS participants with greater cognitive impairment would be more likely to be lost to follow up, potentially making it more difficult to detect associations of interest.
Conclusions.
In conclusion, we report – in a longitudinal cohort study of community-dwelling older adults – that greater plasma KYN/TRP is associated cross-sectionally and longitudinally with greater biomarker evidence of ADRD pathology. Our findings add to the existing human literature linking dysregulated KP metabolism with ADRD pathology. Interventions targeting the KP may hold promise for the prevention and treatment of ADRD.
Supplementary Material
Acknowledgements
The authors would like to thank Douglas Wixted, Julie Eckstrand, Abha Singh, Leah Bouk, Colette Blach, Andrew Shiloh, Stephanie Arvai, Karen Abramson, Simon Gregory, the MURDOCK Study team, the Duke Molecular Physiology Institute’s Metabolomics Laboratory, and the study participants for their contribution to this research.
Funding
The Duke PALS study was funded by a philanthropic gift to Duke University from the David H. Murdock Institute for Business and Culture, and by the Claude D. Pepper Older Americans Independence Center National Institutes of Health/National Institute on Aging Grant (P30AG028716 to H.J.C.); the National Center for Research Resources (NCRR) at the NIH (grant number UL1TR001117); the Duke Clinical and Translational Science Institute supported by the National Centers for Advancing Translational Sciences (UL1TR002553). Trial Registration: Clinicaltrials.gov (NCT01720472; https://www.clinicaltrials.gov/ct2/show/NCT01720472). This study was supported by a GEMSSTAR R03 award to D.C.P. (5R03-AG067897–02). J.R.B. was supported by the Duke Edward R. Roybal Centers for Translational Research in the Behavioral and Social Sciences of Aging (P30-AG064201). Mass spectrometry analysis was supported by the NIH Diabetes and Endocrine Research Center (DERC)(P30-DK124723).
Footnotes
Conflict of Interest
None of the authors report any conflicts of interest.
Data Availability Statement
The data that support the findings of this study are available from the Duke Claude D. Pepper Older Americans Independence Center (Duke Pepper Center). Restrictions apply to the availability of these data, which were used under license for this study. Data are available via a Data Request Form [https://sites.duke.edu/centerforaging/claude-d-pepper-older-americans-independence-center/pals-study/] with the permission of the Duke Pepper Center Internal Operating Committee.
References
- [1].Minhas PS, Liu L, Moon PK, Joshi AU, Dove C, Mhatre S, Contrepois K, Wang Q, Lee BA, Coronado M, Bernstein D, Snyder MP, Migaud M, Majeti R, Mochly-Rosen D, Rabinowitz JD, Andreasson KI (2019) Macrophage de novo NAD+ synthesis specifies immune function in aging and inflammation. Nat Immunol 20, 50–63. [DOI] [PMC free article] [PubMed] [Google Scholar]
- [2].Savitz J (2020) The kynurenine pathway: a finger in every pie. Mol Psychiatry 25, 131–147. [DOI] [PMC free article] [PubMed] [Google Scholar]
- [3].Solvang S-EH, Nordrehaug JE, Tell GS, Nygård O, McCann A, Ueland PM, Midttun Ø, Meyer K, Vedeler CA, Aarsland D, Refsum H, Smith AD, Giil LM (2019) The kynurenine pathway and cognitive performance in community-dwelling older adults. The Hordaland Health Study. Brain Behav Immun 75, 155–162. [DOI] [PubMed] [Google Scholar]
- [4].Chatterjee P, Zetterberg H, Goozee K, Lim CK, Jacobs KR, Ashton NJ, Hye A, Pedrini S, Sohrabi HR, Shah T, Asih PR, Dave P, Shen K, Taddei K, Lovejoy DB, Guillemin GJ, Blennow K, Martins RN (2019) Plasma neurofilament light chain and amyloid-β are associated with the kynurenine pathway metabolites in preclinical Alzheimer’s disease. J Neuroinflammation 16, 186. [DOI] [PMC free article] [PubMed] [Google Scholar]
- [5].Nho K, Kueider-Paisley A, Arnold M, MahmoudianDehkordi S, Risacher SL, Louie G, Blach C, Baillie R, Han X, Kastenmüller G, Doraiswamy PM, Kaddurah-Daouk R, Saykin AJ, for the Alzheimer’s Disease Neuroimaging Initiative and on behalf of the Alzheimer Disease Metabolomics Consortium (2021) Serum metabolites associated with brain amyloid beta deposition, cognition and dementia progression. Brain Commun 3, fcab139. [DOI] [PMC free article] [PubMed] [Google Scholar]
- [6].Bakker L, Ramakers IHGB, van Boxtel MPJ, Schram MT, Stehouwer CDA, van der Kallen CJH, Dagnelie PC, van Greevenbroek MMJ, Wesselius A, Midttun Ø, Ueland PM, Verhey FRJ, Eussen SJPM, Köhler S (2021) Associations between plasma kynurenines and cognitive function in individuals with normal glucose metabolism, prediabetes and type 2 diabetes: the Maastricht Study. Diabetologia 64, 2445–2457. [DOI] [PMC free article] [PubMed] [Google Scholar]
- [7].Almulla AF, Supasitthumrong T, Amrapala A, Tunvirachaisakul C, Jaleel A-KKA, Oxenkrug G, Al-Hakeim HK, Maes M (2022) The Tryptophan Catabolite or Kynurenine Pathway in Alzheimer’s Disease: A Systematic Review and Meta-Analysis. J Alzheimers Dis 88, 1325–1339. [DOI] [PubMed] [Google Scholar]
- [8].Hall KS, Cohen HJ, Pieper CF, Fillenbaum GG, Kraus WE, Huffman KM, Cornish MA, Shiloh A, Flynn C, Sloane R, Newby LK, Morey MC (2016) Physical Performance Across the Adult Life Span: Correlates With Age and Physical Activity. J Gerontol A Biol Sci Med Sci 72, 572–578. [DOI] [PMC free article] [PubMed] [Google Scholar]
- [9].Parker D, Sloane R, Pieper CF, Hall KS, Kraus VB, Kraus WE, Huebner JL, Ilkayeva OR, Bain JR, Newby LK, Cohen HJ, Morey MC (2018) Age-Related Adverse Inflammatory and Metabolic Changes Begin Early in Adulthood. J Gerontol Ser A. [DOI] [PMC free article] [PubMed] [Google Scholar]
- [10].Bhattacharya S, Dunham AA, Cornish MA, Christian VA, Ginsburg GS, Tenenbaum JD, Nahm ML, Miranda ML, Califf RM, Dolor RJ, Newby LK (2012) The Measurement to Understand Reclassification of Disease of Cabarrus/Kannapolis (MURDOCK) Study Community Registry and Biorepository. Am J Transl Res 4, 458–470. [PMC free article] [PubMed] [Google Scholar]
- [11].Tenenbaum JD, Christian V, Cornish MA, Dolor RJ, Dunham AA, Ginsburg GS, Kraus VB, McHutchison JG, Nahm ML, Newby LK, others (2012) The MURDOCK Study: a long-term initiative for disease reclassification through advanced biomarker discovery and integration with electronic health records. Am J Transl Res 4, 291–301. [PMC free article] [PubMed] [Google Scholar]
- [12].Pedersen BK (2019) Physical activity and muscle–brain crosstalk. Nat Rev Endocrinol 15, 383–392. [DOI] [PubMed] [Google Scholar]
- [13].Coppola A, Wenner BR, Ilkayeva O, Stevens RD, Maggioni M, Slotkin TA, Levin ED, Newgard CB (2013) Branched-chain amino acids alter neurobehavioral function in rats. Am J Physiol Endocrinol Metab 304, E405–413. [DOI] [PMC free article] [PubMed] [Google Scholar]
- [14].Rossetti HC, Lacritz LH, Cullum CM, Weiner MF (2011) Normative data for the Montreal Cognitive Assessment (MoCA) in a population-based sample. 4. [DOI] [PubMed] [Google Scholar]
- [15].Pascoal TA, Benedet AL, Ashton NJ, Kang MS, Therriault J, Chamoun M, Savard M, Lussier FZ, Tissot C, Karikari TK, Ottoy J, Mathotaarachchi S, Stevenson J, Massarweh G, Schöll M, de Leon MJ, Soucy J-P, Edison P, Blennow K, Zetterberg H, Gauthier S, Rosa-Neto P (2021) Publisher Correction: Microglial activation and tau propagate jointly across Braak stages. Nat Med 27, 2048–2049. [DOI] [PubMed] [Google Scholar]
- [16].Guillemin GJ, Smythe GA, Veas LA, Takikawa O, Brew BJ (2003) Aβ1–42 induces production of quinolinic acid by human macrophages and microglia: NeuroReport 14, 2311–2315. [DOI] [PubMed] [Google Scholar]
- [17].Guillemin GJ, Brew BJ, Noonan CE, Takikawa O, Cullen KM (2005) Indoleamine 2,3 dioxygenase and quinolinic acid Immunoreactivity in Alzheimer’s disease hippocampus. Neuropathol Appl Neurobiol 31, 395–404. [DOI] [PubMed] [Google Scholar]
- [18].Rahman A, Ting K, Cullen KM, Braidy N, Brew BJ, Guillemin GJ (2009) The Excitotoxin Quinolinic Acid Induces Tau Phosphorylation in Human Neurons. PLoS ONE 4, e6344. [DOI] [PMC free article] [PubMed] [Google Scholar]
- [19].Guillemin GJ (2012) Quinolinic acid, the inescapable neurotoxin: Quinolinic acid, the inescapable neurotoxin. FEBS J 279, 1356–1365. [DOI] [PubMed] [Google Scholar]
- [20].Schwarz MJ, Guillemin GJ, Teipel SJ, Buerger K, Hampel H (2013) Increased 3-Hydroxykynurenine serum concentrations differentiate Alzheimer’s disease patients from controls. Eur Arch Psychiatry Clin Neurosci 263, 345–352. [DOI] [PubMed] [Google Scholar]
- [21].Jacobs KR, Lim CK, Blennow K, Zetterberg H, Chatterjee P, Martins RN, Brew BJ, Guillemin GJ, Lovejoy DB (2019) Correlation between plasma and CSF concentrations of kynurenine pathway metabolites in Alzheimer’s disease and relationship to amyloid-β and tau. Neurobiol Aging 80, 11–20. [DOI] [PubMed] [Google Scholar]
- [22].van der Velpen V, Teav T, Gallart-Ayala H, Mehl F, Konz I, Clark C, Oikonomidi A, Peyratout G, Henry H, Delorenzi M, Ivanisevic J, Popp J (2019) Systemic and central nervous system metabolic alterations in Alzheimer’s disease. Alzheimers Res Ther 11, 93. [DOI] [PMC free article] [PubMed] [Google Scholar]
- [23].Whiley L, Chappell KE, D’Hondt E, Lewis MR, Jiménez B, Snowden SG, Soininen H, Kłoszewska I, Mecocci P, Tsolaki M, Vellas B, Swann JR, Hye A, Lovestone S, Legido-Quigley C, Holmes E (2021) Metabolic phenotyping reveals a reduction in the bioavailability of serotonin and kynurenine pathway metabolites in both the urine and serum of individuals living with Alzheimer’s disease. Alzheimers Res Ther 13, 20. [DOI] [PMC free article] [PubMed] [Google Scholar]
- [24].Widner B, Leblhuber F, Walli J, Tilz GP, Demel U, Fuchs D (2000) Tryptophan degradation and immune activation in Alzheimer’s disease. J Neural Transm 107, 343–353. [DOI] [PubMed] [Google Scholar]
- [25].Modoux M, Rolhion N, Mani S, Sokol H (2021) Tryptophan Metabolism as a Pharmacological Target. Trends Pharmacol Sci 42, 60–73. [DOI] [PubMed] [Google Scholar]
- [26].Heischmann S, Gano LB, Quinn K, Liang L-P, Klepacki J, Christians U, Reisdorph N, Patel M (2018) Regulation of kynurenine metabolism by a ketogenic diet. J Lipid Res 59, 958–966. [DOI] [PMC free article] [PubMed] [Google Scholar]
- [27].Żarnowska I, Wróbel-Dudzińska D, Tulidowicz-Bielak M, Kocki T, Mitosek-Szewczyk K, Gasior M, Turski WA (2019) Changes in tryptophan and kynurenine pathway metabolites in the blood of children treated with ketogenic diet for refractory epilepsy. Seizure 69, 265–272. [DOI] [PubMed] [Google Scholar]
- [28].Barton S, Navarro SL, Buas MF, Schwarz Y, Gu H, Djukovic D, Raftery D, Kratz M, Neuhouser ML, Lampe JW (2015) Targeted plasma metabolome response to variations in dietary glycemic load in a randomized, controlled, crossover feeding trial in healthy adults. Food Funct 6, 2949–2956. [DOI] [PMC free article] [PubMed] [Google Scholar]
- [29].Ulven SM, Christensen JJ, Nygård O, Svardal A, Leder L, Ottestad I, Lysne V, Laupsa-Borge J, Ueland PM, Midttun Ø, Meyer K, McCann A, Andersen LF, Holven KB (2019) Using metabolic profiling and gene expression analyses to explore molecular effects of replacing saturated fat with polyunsaturated fat—a randomized controlled dietary intervention study. Am J Clin Nutr 109, 1239–1250. [DOI] [PMC free article] [PubMed] [Google Scholar]
Associated Data
This section collects any data citations, data availability statements, or supplementary materials included in this article.
Supplementary Materials
Data Availability Statement
The data that support the findings of this study are available from the Duke Claude D. Pepper Older Americans Independence Center (Duke Pepper Center). Restrictions apply to the availability of these data, which were used under license for this study. Data are available via a Data Request Form [https://sites.duke.edu/centerforaging/claude-d-pepper-older-americans-independence-center/pals-study/] with the permission of the Duke Pepper Center Internal Operating Committee.