

Highlights
-
•
Mesenchymal stem cells (MSCs) were derived from the human adipose tissue.
-
•
GPCR agonists stimulated Ca2+ signaling in MSCs.
-
•
IP3/Ca2+-regulated Ca2+ release was a key mechanism mediating agonist responses.
-
•
The mathematical model was proposed to formalize coupling of agonist binding to Ca2+ mobilization.
Keywords: Agonist-induced Ca2+ signaling, IP3 receptors, Ca2+-induced Ca2+ release, Mathematical modeling, Mesenchymal stromal cells
Abstract
The integrative study that included experimentation and mathematical modeling was carried out to analyze dynamic aspects of transient Ca2+ signaling induced by brief pulses of GPCR agonists in mesenchymal stromal cells from the human adipose tissue (AD-MSCs). The experimental findings argued for IP3/Ca2+-regulated Ca2+ release via IP3 receptors (IP3Rs) as a key mechanism mediating agonist-dependent Ca2+ transients. The consistent signaling circuit was proposed to formalize coupling of agonist binding to Ca2+ mobilization for mathematical modeling. The model properly simulated the basic phenomenology of agonist transduction in AD-MSCs, which mostly produced single Ca2+ spikes upon brief stimulation. The spike-like responses were almost invariantly shaped at different agonist doses above a threshold, while response lag markedly decreased with stimulus strength. In AD-MSCs, agonists and IP3 uncaging elicited similar Ca2+ transients but IP3 pulses released Ca2+ without pronounced delay. This suggested that IP3 production was rate-limiting in agonist transduction. In a subpopulation of AD-MSCs, brief agonist pulses elicited Ca2+ bursts crowned by damped oscillations. With properly adjusted parameters of IP3R inhibition by cytosolic Ca2+, the model reproduced such oscillatory Ca2+ responses as well. GEM-GECO1 and R-CEPIA1er, the genetically encoded sensors of cytosolic and reticular Ca2+, respectively, were co-expressed in HEK-293 cells that also responded to agonists in an “all-or-nothing” manner. The experimentally observed Ca2+ signals triggered by ACh in both compartments were properly simulated with the suggested signaling circuit. Thus, the performed modeling of the transduction process provides sufficient theoretical basis for deeper interpretation of experimental findings on agonist-induced Ca2+ signaling in AD-MSCs.
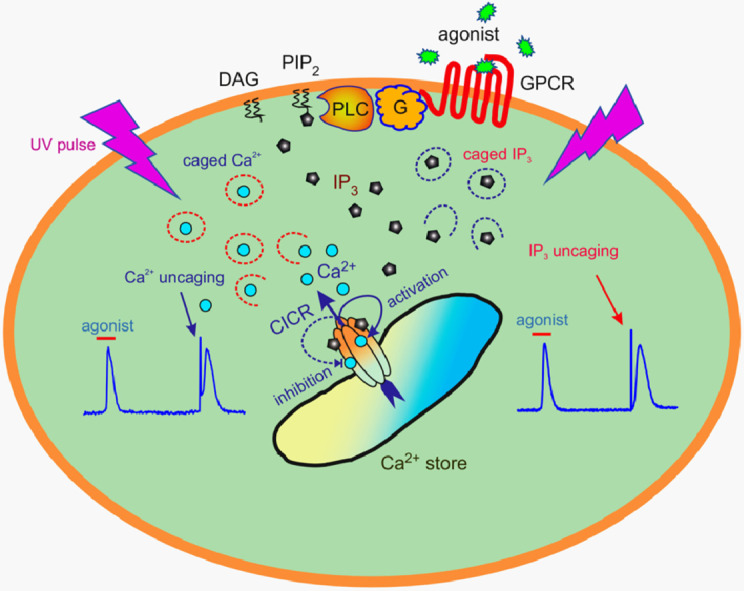
Graphical abstrtact
1. Introduction
Extracellular cues mobilize intracellular Ca2+ to regulate diverse cellular functions, such as fertilization, proliferation, secretion, metabolism, gene expression, mobility, and muscle contraction [1]. It is amazing that the Ca2+ ion, a very simple chemical substance, is capable of controlling so many different physiological processes in a stimulus dependent manner. As a matter of fact, the regulatory potential of intracellular Ca2+ stems from the versatility of coupling of surface receptors to a variety of downstream signaling pathways, resulting in local and global Ca2+ signals of diverse kinetics, amplitude, duration, and spatial patterning, depending on intracellular context and cell stimulation [2], [3], [4], [5].
Many of G-protein coupled receptors (GPCRs) can activate the phosphoinositide cascade directly by stimulating the β1–4 isoforms of phospholipase C (PLC) in a αGq- and/or βγGi-dependent manner or indirectly by transactivating tyrosine kinase receptors coupled to PLCγ [4,6]. The stimulated PLC hydrolyzes the precursor lipid phosphatidylinositol 4,5-bisphosphate to produce two second messengers, IP3 and diacylglycerol. The primary mode of action of IP3 is to bind to IP3 receptors and release Ca2+ from Ca2+ store [4,7,8]. Three genes encode IP3 receptor subunits IP3R1, IP3R2, and IP3R3 to form tetrameric IP3-gated Ca2+ channels in endoplasmic reticulum [4,[7], [8], [9]]. All IP3 receptors contain allosteric Ca2+-binding sites enabling cytosolic Ca2+ to regulate IP3-dependent Ca2+ release in a bimodal manner [4,7,8,10]. The binding of the primary agonist IP3 promotes a conformational change entailing an increased affinity of the activatory Ca2+-binding site at the IP3 receptor. In turn, the enhanced binding of cytosolic Ca2+ to the activatory cite markedly increases the open probability of the IP3–gated channel [10], so that Ca2+ ions released from the ER can promote activity of IP3 receptors. This positive feedback can underlie the avalanche-like process called Ca2+-induced Ca2+ release (CICR), which also can be mediated by ryanodine receptors [4,11]. Exerting the stimulatory action at a low level, cytosolic Ca2+ suppresses activity of the IP3 receptor at higher concentrations by binding to the inhibitory site [10]. This multimodal control of the IP3 receptor by IP3 and Ca2+ is central to certain modes of intracellular Ca2+ signaling [4,8].
Mesenchymal stromal cells (MSCs) are described as a heterogeneous cellular pool that includes immature cells responsible for the replenishment of supportive and connective tissues due to their capability of maintaining self-renewal and multipotent differentiation [12], [13], [14]. Because of unique biologic properties, these cells attract sufficient interest in the fields of regenerative medicine and immunotherapy [15], [16], [17]. Existing evidence implicates MSCs from different sources in sensing multiple extracellular cues, including certain hormones, nucleotides, cytokines, and leukotrienes as well as lysophosphatidic acid and sphingosine-1-phosphate [15,[18], [19], [20], [21], [22], [23]]. Thus, MSCs employ numerous surface receptors and signaling pathways presumably to adjust their physiological functions to specific tissue microenvironment.
The mathematical modeling provides a complementary insight into experimental data by evaluating a role for particular signaling elements in signaling/regulatory processes. Multiple models, which were developed previously to probe into intracellular Ca2+ signaling, largely focused on mechanisms capable of yielding sustained Ca2+ oscillations. The intrinsic instability of cytosolic Ca2+ could be simulated with CICR in combination with relatively slow processes, such as the variation of stored Ca2+ and/or inactivation of IP3Rs [24,25]. Reportedly, stimulation triggered the transition of cytosolic Ca2+ from a resting level to sustained base-line Ca2+ oscillations, which occurred with a latency correlated with an oscillation period. This phenomenon was correctly simulated with two-pool model, wherein CICR was triggered by agonist-evoked Ca2+ release from a separated intracellular pool [26]. Among numerous theoretical works, only some studies [24,25] took into account the cell-type specific details of Ca2+ signaling, which might be central to discriminating appropriate models. Note as an example hormone-induced Ca2+ oscillations in hepatocytes that were characterized by long inter-spike intervals, which were shortened by increasing stimulation, and fast Ca2+ spikes universally shaped at different agonist doses [27]. These features were poorly reproducible with simple models that included the biphasic regulation of IP3Rs by Ca2+ as a core [28,29]. The model extended with a feedback regulation of IP3 production seems to be more appropriate for the analysis of agonist-induced Ca2+ signaling in hepatocytes [30,31].
In previous studies, we found a variety of GPCR agonists, such as noradrenaline, adenosine, ACh, ADP, ATP, and UTP, to mobilize Ca2+ in MSCs derived from the human adipose tissue (AD-MSCs) [22,32]. Although solely a small AD-MSC subgroup was specifically responsive to a particular agonist, the phenomenology of agonist-induced Ca2+ signaling was rather universal over the whole AD-MSC population. The agonist transduction in AD-MSCs has not been analyzed yet in terms of dynamic models. Here we performed mathematical modeling of agonist-induced Ca2+ signaling in AD-MSCs. The proposed model was based on our own experimental findings and adjusted to simulate Ca2+ transients elicited by short agonist pulses.
2. Materials and methods
2.1. AD-MSC isolation, culturing and preparing for Ca2+ imaging
The primary culture of AD-MSCs of the first passage was provided by the Department of Biochemistry and Molecular Medicine at the Faculty of Basic Medicine of Lomonosov Moscow State University. AD-MSCs were isolated from the subcutaneous adipose tissue of 15 healthy men from 32 to 60 years old as described previously [32]. All donors gave informed consent for harvesting their adipose tissue. The obtained AD-MSC population was maintained in culture medium (AdvanceSTEM basal medium for undifferentiated human mesenchymal stem cells (HyClone) + 10% AdvanceSTEM stem cell growth supplement (HyClone)) and in a humidified atmosphere (5% CO2, 95% O2) at 37 °C. Cells of the second to fifth passages were used in experiments.
Before assaying with Ca2+ imaging, cells were washed with the Versene solution (Sigma), incubated in HyQTase cell detachment solution (HyClone) for 3–5 min, resuspended in a complete cell growth medium, placed into a tube, and centrifuged at 50 g for 45 s for sedimentation. Cells were collected and plated onto a recording chamber of nearly 150 μl volume. The last was a coverslip (Menzel-Glaser) with attached ellipsoidal resin wall. The chamber bottom was coated with Cell-Tak Cell and tissue Adhesive (Corning). Attached cells were then loaded with dyes at room temperature (23–25 °С) by adding Fluo-4AM (4 μM), or Fluo-4AM (4 μM) + NP-EGTA-AM (4 μM), or Fluo-4AM (4 μM) + caged-Ins(145)P3/PM (SiChem) (4 μM) and Pluronic (0.02%) (all from Molecular Probes) to the bath solution (mM): 110 NaCl, 5.5 KCl, 2 CaCl2, 0.8 MgCl2, 10 HEPES (pH 7.4), and 10 glucose. After 40-min incubation cells were rinsed several times with the bath solution and stored at 4 °С for 40 min.
2.2. Ca2+ imaging and uncaging
Experiments were carried out using an inverted fluorescent microscope Axiovert 135 equipped with an objective Plan NeoFluar 20x/0.75 (Zeiss) and a digital ECCD camera LucaR (Andor Technology). Apart from a transparent light illuminator, the microscope was equipped with a hand-made system for epi-illumination via an objective. The epi-illumination was performed using a bifurcational glass fiber. One channel, which was used for Fluo-4 excitation, transmitted 480 ± 5 nm irradiation of LED controlled by a computer. Fluo-4 emission was collected at 535 ± 20 nm. Serial fluorescent images were captured every second and analyzed using Imaging Workbench 6 software (INDEC). Deviations of cytosolic Ca2+ from the resting level were quantified by a relative change in the intensity of Fluo-4 fluorescence (ΔF/F0) recorded from an individual cell. Another channel was connected to a pulsed solid laser TECH-351 Advanced (680 mW) (Laser-Export, Moscow). This unit operated in a two-harmonic mode and generated not only 351 nM UV light used for Ca2+ uncaging but also visible light at 527 nm. The last could penetrate into an emission channel through non-ideal optical filters and elicited optical artifacts during uncaging. For Ca2+ or IP3 uncaging, cells were loaded with 4 μM Fluo-4-AM (Invitrogen) and 4 μM NP-EGTA-AM (Invitrogen) or 4 μM caged-Ins(145)P3/PM (SiChem) + 0.02% Pluronic (Invitrogen) for 30 min. In certain cases, cells that were initially loaded with Fluo-4 alone were additionally stained in the presence of 4 μM NP-EGTA-AM + 0.02% Pluronic during recordings. When necessary, 2 mM CaCl2 in the bath solution was replaced with 1 mМ EGTA to completely remove Ca2+, and the glucose concentration was increased to 13 mM to keep osmolarity. All chemicals used in experiments described below were applied by the complete replacement of the bath solution in a 150 μl photometric chamber for nearly 2 s using a perfusion system driven by gravity. The used salts and buffers were from Sigma-Aldrich, agonists and inhibitors were from Tocris.
2.3. HEK-293 cells with genetically encoded Ca2+ sensors
The HEK-293 cells were routinely cultured in the Dulbecco's modified Eagle's medium (DMEM) (Invitrogen) containing 10% (vol/vol) fetal bovine serum (HyClone), glutamine (1%) and the antibiotic gentamicin (100 μg/ml) (Invitrogen) in 12-well culture plates. Cells were grown in a humidified atmosphere (5% CO2, 95% O2) at 37 °C. To induce transient expression of genetically encoded sensors for cytosolic and reticular Ca2+, GEM-GECO1 and R-CEPIA1er, respectively, cells were transfected simultaneously with two plasmid vectors CMV–GEM-GECO1 and pCMV R-CEPIA1er. Before the day of transfection, 3–5 × 10⁵ cells were put in the well of 12-well culture plates. For transfection of cultured cells, the growth medium was replaced with the transfection mixture, containing 800 μl the growth medium, 200 μl OptiMEM media (Gibco), 2 μl Р3000 Reagent (Invitrogen), 2 μl Lipofectamine 3000 (Invitrogen) and both vector of 1 μg each. After 24-h incubation, the transfection mixture was replaced with the normal culture medium. The concurrent transfection was considered effective if at least a 30% fraction of transfected cells exhibited sufficient fluorescence in the green and red spectral ranges. Cells were assayed 24–72 h after transfection.
CMV-GEM-GECO1 was a gift from Robert Campbell (Addgene plasmid # 32442; http://n2t.net/addgene:32442; RRID:Addgene_32442) [33]; pCMV R-CEPIA1er was a gift from Masamitsu Iino (Addgene plasmid # 58216; http://n2t.net/addgene:58216; RRID:Addgene_58216) [34].
2.4. Computations
The DBsolve software [35] was used to numerically solve a system of differential equations based on a kinetics model of agonist transduction. Algebraic functions and data graphs were plotted using SigmaPlot 12 (Systat Software).
3. Results
3.1. Experimental findings
Given that the experimental findings presented below were invariantly reproducible for each sample of AD-MSCs irrespective of donors, those were used as check-points for modeling agonist-induced Ca2+ signaling.
3.1.1. Dose-dependence of AD-MSC responses to GPCR agonists
In a typical experiment, nearly a hundred of AD-MSCs loaded with Fluo-4 resided in a photometric camera, and their responsiveness to different compounds was assayed with Ca2+ imaging. In the case of adrenergic and purinergic agonists, cell responsivity was detailed by dose-response curves generated at widely varied agonist concentrations [22,32]. As illustrated in Fig. 1A–C, noradrenalin, ATP, or adenosine applied shortly elicited Ca2+ transients that varied weakly or negligibly by magnitude with agonist dose above the threshold. Note that the threshold concentration varied from cell to cell within 100–200 nM for noradrenaline, 100–300 nM for adenosine, 0.5–1 μM for ATP. By choosing robust AD-MSCs that exhibited similar threshold responsivity to a particular agonist, we generated averaged dose-response curves for noradrenalin-, ATP-, and adenosine-sensitive cells (Fig. 1D,E). This “all-or-nothing” fashion was also characteristic of ADP and UTP responses [22]. One more interesting feature of agonist transduction was that Ca2+ transients were markedly postponed relative to a moment of agonist application (Fig. 1A–C), and the characteristic time of the response lag (τd, Fig. 1D) gradually decreased with agonist concentration (Fig. 1D, E).
Fig. 1.

Dose dependencies of agonist responses. (A–С) Representative monitoring of intracellular Ca2+ in three different AD-MSCs, which were serially stimulated by noradrenaline (A), ATP (B), or adenosine (С) at indicated concentrations. (D) Summary of noradrenaline responses of 10 cells exhibiting the same threshold concentration of 0.15 μM. The dose-response curve was generated by averaging normalized Ca2+ responses at a given noradrenaline concentration within 0.03–1 μM. In each case, Ca2+ transients were normalized to a cell response to 1 μM noradrenaline. (E) Dose-response curves for ATP (triangles) and adenosine (squares) responses. The data were overaged over 9 cells responsive to ATP with the threshold of 1 μM and 7 adenosine-responsive cells exhibiting the 0.3-μM threshold. In each case, responses to 10 μM ATP and 5 μM adenosine were normalizing. (F) Representative Ca2+ transients elicited by adenosine at 100 nM (near-threshold concentration) and 2 μM in the same cell. These adenosine responses were delayed relative to the moment of agonist application by 97 s and 32 s, respectively. The characteristic time of the response delay (τd) was calculated as a time interval necessary for a Ca2+ transient to reach the half-magnitude. (G) Response lag versus agonist concentration (mean ± S.D.). The data were collected solely from robust noradrenaline-, ATP-, and adenosine-responsive cells (n=10, 16, and 21, respectively), which exhibit negligible responsivity rundown and tolerated the serial stimulation by the particular agonist at all indicated doses. In (A-D), ΔF = F-F0, F is the instant intensity of cell fluorescence, F0 is the averaged intensity of cell fluorescence in the very beginning of a recording.
3.1.2. Agonist transduction involves the phosphoinositide cascade and Ca2+-induced Ca2+ release
The agonist-induced mobilization of cytosolic Ca2+ can involve a number of Ca2+ sources, including Ca2+ entry via Ca2+-permeable channels of several types and Ca2+ release from reticular and acidic lysosomal Ca2+ store. Given some evidence that argued against any role of the acidic Ca2+ store in agonist transduction in AD-MSCs (Supplementary Materials, Fig. 1S), we focused on evaluating contributions of Ca2+ influx and reticular Ca2+ release to agonist responses. In a number of experiments, we substituted 2 mM CaCl2 in the bath solution with 1 mM EGTA to assay the responsiveness of AD-MSCs to agonists in the absence of extracellular Ca2+. Typically, AD-MSCs poorly tolerated the treatment with EGTA, so this agent could be applied only shortly. It turned out that the removal of bath Ca2+ insignificantly affected Ca2+ transients elicited by noradrenaline (Fig. 2A), ATP, adenosine, UTP, and ADP [22]. Thus, receptor/store-operated Ca2+ entry contributed slightly to short-term Ca2+ signals initiated by agonist pulses. At the same time, the PLC inhibitor U73122 rendered assayed cells nonresponsive to noradrenaline (Fig. 2A) and purinergic ligands [22]. The inhibitory effect of U73122 was presumably specific, because its much less active analog U73343 was ineffective at the same concentrations (Fig. 2A). The above findings indicated that GPCRs implicated in agonist transduction were coupled by the phosphoinositide cascade to Ca2+ release rather than to Ca2+ entry. In this pathway, IP3 generation should have been central. To verify this inference, we loaded AD-MSCs with both Fluo-4 and caged-IP3 and stimulated them by 2-s UV flashes, producing brief pulses of IP3 in their cytosol. Cells expectedly responded to IP3 uncaging with Ca2+ transients, and UV responses were amazingly similar to agonist responses by kinetics and magnitude (Fig. 2B). However, in contrast to agonist responses, which were markedly postponed relative to agonist application (Fig. 2B, left Ca2+ transient), IP3 uncaging triggered Ca2+ transients without a pronounced delay (Fig. 2B, right Ca2+ transient). This implied that IP3 production could be a rate-limiting process in agonist transduction.
Fig. 2.

Involvement of the phosphoinositide cascade and CICR in agonist transduction. (A) Removal of bath Ca2+ weakly affected Ca2+ responses to 1 μM noradrenaline (18 cells). The PLC inhibitor U73122 (1 μM) suppressed AD-MSC responsivity to noradrenaline, while its much less effective analogue U73343 (1 μM) was ineffective (18 cells). (B, C) Evidence for Ca2+-induced Ca2+ release mediated by IP3R. ATP (3 μM) and IP3 uncaging by a 2-s UV flash elicited similar responses in a cell loaded with caged-Ins(145)P3/PM (36 cells) (B). In MSCs loaded with NP-EGTA and responsive to ATP (3 μM), 2-s Ca2+ uncaging elicited a small Ca2+ jump relaxing exponentially, while a 4-s UV flash elicited a large biphasic Ca2+ transient that was similar to an ATP response (13 cells) (C). Because a UV laser employed for uncaging was in fact a biharmonic light source emitting at 351 and 527 nm, a light stimulus caused an optical artifact that was seen as a marked overshoot in the fluorescence traces acquired at 535 ± 25 nm. (D) Ryanodine (50 μM) affected neither AD-MSC responsiveness to 0.5 μM noradrenaline nor Ca2+ transients elicited by Ca2+ uncaging by a 4-s UV flash (11 cells). In contrast, 50 μM 2-APB completely abolished biphasic agonist-like responses to Ca2+ uncaging by 4-s UV flashes. In the experiments with Ca2+ uncaging (C, D), emission of a UV laser was weakened by the factor ten, so that Ca2+ uncaging should have lasted for 4 s to liberate as many Ca2+ ions as necessary for stimulating CICR. This more gradual release of caged Ca2+ slowed the rising phase of a biphasic Ca2+ transient produced by CICR, thereby making a lag between a UV flash and a light response clearly visible. In (A-D), intracellular Ca2+ was monitored in different AD-MSCs.
How the invariant shape of agonist responses (Fig. 1A–C) could be blended with the gradual dependence of response lag on agonist dose (Fig. 1G)? We considered the following possibility. Initially, an agonist stimulated IP3 production that drove a small and local Ca2+ rise presumably in agonist depended manner. When exceeded a threshold level, this initial Ca2+ signal pushed CICR [4,36], which finalized agonist transduction by producing a large and global Ca2+ signal. Being a trigger-like self-driven process, CICR formed cellular responses of a virtually universal shape, regardless of agonist concentrations (Fig. 1A–C). The gradual dose-delay dependence (Fig. 1G) took place because the initial Ca2+ signal rose proportionally to cell stimulation, thus reaching the CICR threshold for a shorter time at a higher agonist dose.
To clarify whether CICR was functional in agonist responsive AD-MSCs, we employed Ca2+ uncaging for generating sufficiently fast and intensive cytosolic Ca2+ bursts to initiate the CICR process [37]. In designated experiments, cells were loaded with both Fluo-4 and NP-EGTA, photolabile Ca2+ chelator with high affinity to Са2+ (Kd ~ 10-7 М). In NP-EGTA loaded cells, 2-s UV pulses elicited small Ca2+ bursts, which were produced without evident delay and relaxed exponentially (Fig. 2C, 1st response). In contrast, 4-s UV pulses usually elicited biphasic Ca2+ transients that were pretty similar to agonist responses (Fig. 2C, 2nd and 3rd responses). The stimulus strength-dependent switch of UV responses from the small exponentially relaxing Ca2+ jump to the high biphasic Ca2+ transient pointed out that a threshold mechanism, most likely CICR, was functional in AD-MSCs.
Note that ryanodine and IP3 receptors, Ca2+-regulated Ca2+-release channels operating in the endo/sarcoplasmic reticulum, mediate CICR in apparently all cell types [36,38]. In our experiments, ryanodine undetectably affected both agonist responses and Ca2+ transients elicited by UV pulses in AD-MSCs (Fig. 2D), suggesting a negligible role for ryanodine receptors in agonist transduction in general and in CICR in particular. In contrast, light responses were dramatically and reversibly transformed in the presence of 2-APB known to inhibit IP3 receptors [39]. In particular, while AD-MSCs normally responded to 4-s UV flashes with biphasic Ca2+ transients (Fig. 2D, 1st light response), the same Ca2+ uncaging elicited relatively small exponentially relaxing Ca2+ bursts after the cell treatment with 50 μM 2-APB (Fig. 2D, 2nd light response), as was the case with 2-s UV pulses in control (Fig. 2C, 1st light response). The removal of 2-APB from the bath restored activity of IP3 receptors, and Ca2+ uncaging triggered biphasic, agonist response-like Ca2+ transients again (Fig. 2D, 3rd light response). The observed transformations of serial light responses could be expected if a relatively small Ca2+ signal produced by Ca2+ uncaging (Fig. 2D, 2nd light response) was converted by the CICR mechanism into a universal biphasic Ca2+ transient (Fig. 2D, 1st and 3rd light responses). Altogether, the above observations and previous evidence [22,32] strongly supported the idea that the CICR mechanism involving IP3/Ca2+-regulated IP3 receptors amplified and shaped an initial Ca2+ signal produced either by a GPCR agonist or by caged-IP3/NP-EGTA photolysis.
3.2. Mathematical model of agonist transduction
We postulated here that brief agonist pulses mobilized Ca2+ in AD-MSCs by involving a pathway that could be reduced to the following signaling sequence. Binding of an agonist to GPCR initiates its coupling to PLC mediated by a G-protein, thereby stimulating IP3 production followed by activation of IP3 receptors (IP3Rs) and Ca2+ release from Ca2+ store. The IP3-dependent Ca2+ release mechanism was under control of both positive and negative feedbacks mediated by stimulatory and inhibitory regulations of IP3Rs by cytosolic Ca2+. Although the Ca2+ feedback regulation of IP3 metabolism has been implicated in Ca2+ oscillations in certain cells [25], this mechanism was omitted as its existence in MSCs was never demonstrated. The deactivation of the transduction cascade and removal of released Ca2+ by reticular and plasmalemmal Ca2+ pumps terminated a Ca2+ signal initiated by an agonist pulse. The experimental findings (Fig. 2A) suggested a subtle contribution of Ca2+ influx to AD-MSC responses to brief agonist pulses, and therefore it could be postulated for simplicity as apparently invariable and independent of Ca2+ store.
The suggested signaling circuit is represented by the kinetic scheme in Fig. 3. Here the formalism of agonist-dependent IP3 production was based on the mechanism proposed by Lemon and co-workers [40], which was simplified based on the assumption that active GPCRs inactivated insignificantly for a short period of cell stimulation. Note that more complex interactions were considered in the model by Falkenburger et al. [41], which particularly included the formation of a ternary complex by receptor, agonist, and G-protein molecules, dissociation of a G-protein heterotrimer, and interaction of a Gα-subunit with PLC. For this pathway, simulated PLC activity monotonically increased with stimulation time as was the case in our computations (see below Fig. 5). It thus appeared that despite simplified receptor-PLC coupling adopted in our model, it could adequately reproduce the kinetics of IP3 production upon a brief agonist pulse.
Fig. 3.

Kinetic model of agonist transduction in AD-MSCs. Substances: A, agonist; R, receptor; R*, activated receptor formed by reversible binding of A to R; G, G-protein; G*, activated G-protein; PIP2, phosphatidylinositol (4,5)-bisphosphate; IP3, inositol (1,4,5)-trisphosphate; Ca2+c,cytosolic Ca2+; Ca2+s, stored Ca2+ releasable by IP3; Ca2+e, extracellular Ca2+ postulated to be constant. The arrows with symbols denote +g: formation of G* catalyzed by R*. -g: inactivation of G* to G due to GTPase activity. +s: synthesis of PIP2. -s: removal of PIP2 by dephosphorylation and phosphorylation. plc: reaction catalyzed by phospholipase C. met: IP3 metabolism 1. Ca2+ release through the IP3 receptor 2. Refilling of Ca2+ store by reticular Ca2+-ATPase (SERCA). 3. Ca2+entry mediated by Ca2+ channels operating in the plasma membrane. 4. Ca2+ extrusion by plasma membrane Ca2+-ATPase (PMCA). The dashed red and blue arrows denote activation and inhibition, respectively.
Fig. 5.

Dynamics of the key mediators and cytosolic/reticular Ca2+ during agonist transduction. The kinetics of G*, PIP2 and IP3 (variables g, s, and p), cytosolic Ca2+ (C), and reticular Ca2+ (Cs) were simulated using Eqs. (2)–(6) at the basic parameter set (Table 1S). The sequential stimuli of increased concentrations (a=0.1, 0.2, and 1) were applied as indicated. G*, PIP2, and IP3 are presented in arbitrary units.
3.2.1. Model description
In the phosphoinositide subsystem (Fig. 3), the reaction velocities are described by the expressions:
| (1) |
where dg and dplc determine basal rates in the absence of activators, and Vs is constant. At rapid and equilibrium agonist-receptor binding and constant Rt=[R]+[R*], , where and is the dissociation constant. Given that , the variable can be excluded. Here and below, time is in seconds, concentrations are in μM.
For the normalized concentrations
the following system of differential equations was derived, taking the expressions (1) into account:
| (2) |
with the parameters , , , , .
All parameters in (2) are dimensionless except for k-g, ks and kmet (in s-1), which determine kinetics of the variables but do not affect their steady-state levels.
For Ca2+ fluxes mediated by Ca2+ channels and pumps, the appropriate rates are expressed as:
| (3) |
where C=[Ca2+c] and Cs=[Ca2+s]. The parameter l represents non-regulated passive Ca2+ leak; the expressions for v2 and v4 are written assuming that these rate can dependon [Ca2+c] cooperatively [25]; the rate of Ca2+ entry V3 is taken constant, given the insignificant influence of bath Ca2+ on agonist responses (Fig. 2A). Although it is widely accepted that the fraction ra of open IP3Rs is a bell-shaped function of cytosolic Ca2+ that can be shifted in an IP3-dependent manner [7], saturating curves were also reported [10]. Note that such a monotonic dependence can be derived in the physiologically relevant range of cytosolic Ca2+ concentrations from a generally bell-shaped function, should the Ca2+ inhibition constant be sufficiently high. Although a variety of mechanistic models has been suggested to describe IP3R gating at variable Ca2+ and IP3 [24,25], a particular circuit could hardly provide a precise description of IP3/Ca2+-dependent Ca2+ release occurring under in vivo conditions, given that it is commonly mediated by a combination of IP3R isoforms differently regulated by IP3, Ca2+, and other mechanisms [42]. In addition, different kinetic mechanisms formalizing IP3 and Ca2+ binding can underly the same dynamic properties of IP3Rs [43]. For simplicity, we suggested independent binding of IP3 and Ca2+ to appropriate domains at IP3Rs and employed the phenomenological approach, by analogy with [44] and [45], by using the following equations to describe IP3R activity:
| (4a) |
| (4b) |
where ra is the fraction of open IP3Rs; x is the fraction of IP3Rs not inactivated by Ca2+, and
| (5) |
where and . The term is the normalized form of the expression , which characterizes the dependence of open probability of IP3R on IP3, provided that IP3R can spontaneously open in the absence of IP3. Because in essence, < 1 at any p, this requires δp < ξ. Finally, Ca2+ balance can be analytically expressed as:
| (6a) |
| (6b) |
where v1 to v4 are described by Eq. (3); αc and αs are binding coefficients characterizing fast non-saturated Ca2+ buffers located in the cytosol and in Ca2+ store, respectively; θ is the ratio of Ca2+ store and cytosol volumes.
Based on the above equations, we particularly analyzed which forms of transient Ca2+ dynamics could be reproduced by our model (see Supplementary Materials). The values of model parameters were initially chosen, when possible, based on available experimental data and reported theoretical estimates, and then most of them were varied to elucidate a set that allowed for the best fit of our experimental data (Table 1S). Reportedly, signaling circuits, which include CICR as in Fig. 3, are intrinsically capable of producing intracellular Ca2+ signals of diverse types, from single Ca2+ transients to Ca2+ oscillations. The decisive is the existence of a critical manifold folded with respect to the fast variable C that corresponds to folded C-nullcline [25]. As demonstrated in Fig. 4S, S-shaped nullcline could be derived from rate-concentration diagrams characterizing Ca2+ fluxes, thus enabling the model to generate spike-like agonist responses (Fig. 5S).
Fig. 4.

Simulations of Ca2+ transients in stimulated AD-MSCs. (A) The deviation of cytosolic Ca2+ on serial 60-s stimulation by an agonist at three different normalized ([A]/KD) doses of 0.1, 0.2, and 1. (B) Model response magnitude (ο) versus normalized agonist dose ([A]/KD). The dose-response curve for noradrenaline from Fig. 1D (•) is presented for comparison. The noradrenaline concentrations were normalized to 1 μM. (C) Model response lag (ο) versus normalized agonist concentration. The dose-response curve for noradrenaline from Fig. 1G (•) is presented for comparison. Agonist concentrations were normalized as in (B). (D) Simulation of Ca2+ uncaging by a step-like increase of intracellular Ca2+ from 100 nM to 180 and 300 nM. While the 80 nM jump elicited the small exponentially relaxing Ca2+ transient, the 200 nM jump produced the agonist-like Ca2+ response.
We also evaluated a role of plasmalemmal and reticular Ca2+ cycles (Fig. 3) in shaping model responses. It was particularly found that the shape and magnitude of agonist responses moderately depended on the maximal SERCA rate, while a response lag substantially decreased as SERCA activity rose (Fig. 6SA,C). In contrast, an increase in the maximal PMCA activity markedly prolonged the response latency and shortened the falling phase at moderately decreased magnitude (Fig. 6SB,D). The impact of each cycle was quantified by sensitivity coefficients (Eq. (21S)). Interestingly, agonist pulses triggered Ca2+ spikes only if activity of the particular Ca2+ cycle either exceeded (SERCA) or was below (PMCA) a certain threshold value. The threshold-like influence of the timescale parameters on response features did not take place within the examined range of k-g, ks, kmet, τ, αc, and αsθ values (Fig. 7S).
Fig. 6.

Effect of exogeneous Ca2+ buffer on agonist response. (A) Loading of AD-MSCs with NP-EGTA affected AD-MSC responsiveness to 3 μM ATP, while the photolysis of this exogeneous Ca2+ buffer reversed effects of NP-EGTA. The recordings from cells 1–3 exemplify the diversity of NP-EGTA effects. (B) Simulations of effects of exogeneous saturable NP-EGTA-like Ca2+ buffers on agonist-induced Ca2+ transients using the Eqs. (2)–(5), 6b), ((8), and (9) with increasing Bt. Parameter values were as in Table 1S, and KbD=0.08 μM, k-b=0.5 s-1.
Fig. 7.

Oscillatory Ca2+ signals elicited by agonist. (A) Representative (43 cells) monitoring of GEM-GECO1 and R-CEPIA1er fluorescence in a transfected HEK-293 cell. The upper curve reflects the behavior of cytosolic Ca2+ upon cell stimulation with ACh at doses varied as indicated. The evolution of reticular Ca2+ is depicted by the bottom trace. To evaluate a relative change in reticular Ca2+ elicited by ACh, in the end of the recording, Ca2+ store was emptied by ionomycin (5 μM ) applied with 260 nM Ca2+ in the bath. For GEM-GECO1 or R-CEPIA1er, the fluorescence traces were presented as ΔF/F0, where ΔF = F0-F, or ΔF = F-F0, respectively, F is the instant intensity of cell fluorescence, F0 is the averaged intensity of cell fluorescence in the very beginning of a recording. The R-CEPIA1er signal was corrected for photobleaching (Supplementary Fig. 1S). (B) Simulations of oscillatory Ca2+ signals elicited by an agonist at two doses in the cytosol (upper curves) and in Ca2+ store (bottom curves). The computations were performed using the Eqs. (2)-(6) with the basic parameter set (Table 1S) except for m=3, Ki=0.4 μM, and ac=70.
Our analysis also suggested that the kinetics of IP3R inhibition by cytosolic Ca2+ could be the central factor, which determines the Ca2+ transient type, single spike or burst-like, generated by the above model (2–6) on a short agonist pulse. For all parameter sets probed by us, the studied model system was characterized by a unique and stable steady state, the feature precluding sustained Ca2+ oscillations that could be originated by steady state instability. On the other hand, at certain values of m, Ki and αc, a stable focus was characteristic of the reduced calcium subsystem (Eqs. (3)–(6)) with frozen Cs, thus enabling the full system to generate agonist responses in the form of Ca2+ bursts crowned with damped oscillations (Figs. 8S and 9S).
3.3. Comparison with experiments
3.3.1. Dose-dependence of Ca2+ transients
By integrating Eqs. (2), (4), (6) numerically, we simulated cellular responses to agonists and Ca2+ uncaging. The agonist application was mimicked by a stepwise increase of a from 0 to a particular value for 60 s; Ca2+ uncaging was imitated by a jump of cytosolic Ca2+ (model variable C). As was the case with Ca2+ transients elicited by adrenergic and purinergic agonists (Fig. 1A–C), the model responded to agonist pulses in an all-or-nothing manner, exhibiting negligibly small deviations of cytosolic Ca2+ at subthreshold doses but generating rather similar Ca2+ transients at stimulations above the threshold (Fig. 4A). The dose-response curve was almost step-like (Fig. 4B, open circles), and for normalized agonist concentrations, the theoretical curve satisfactorily fitted the experimental dose dependences, particularly, for noradrenaline responses (Fig. 4B, filled circles). Consistently with the experimental findings (Fig. 1G), the lag of simulated responses, which was determined as shown in Fig. 1F, was gradually decreased with an agonist dose (Fig. 4C, open circles). In line with the experimental findings (Fig. 2B), simulated Ca2+ uncaging of sufficiently high magnitude elicited Ca2+ transients that were similar to agonist responses (Fig. 4D).
The computer simulation of intracellular signaling allows for monitoring dynamic behavior of all signaling molecules involved in the entire process, the advantage not being achievable with any experimental approach yet, including the use of genetically encoded sensors [46]. Based on the proposed model, we generated a set of backbone intracellular signals related to agonist transduction in AD-MSCs. In particular, dynamics of activated G-protein, PIP2, IP3, cytosolic and reticular Ca2+ were visualized by depicting time courses of corresponding variables g, s, p (in arbitrary units), C, and Cs perturbed by three increasing stimuli (Fig. 5). Interestingly, although the subthreshold stimulation at a=0.1 elicited evident deviations of G*, PIP2, and finally IP3 from resting levels (Fig. 5, G*, PIP2, and IP3 curves), it failed to trigger CICR, and therefore affected cytosolic and reticular Ca2+ rather weakly (Fig. 5, C and Cs curves). Meanwhile, the IP3 signal at a=0.1 was 70% and 44 % of the IP3 signals generated with a=0.2 and a=1, respectively. At a=0.2 and a=1, the resultant IP3 pulses were sufficient for CICR that yielded quite universal Ca2+ transients in both the cytosol and Ca2+ store irrespective of stimulation (Fig. 5, C and Cs curves), provided that reticular Ca2+ returned to a nearly resting level (Fig. 5, Cs curve). Thus, CICR endowed the IP3-dependent Ca2+ release with the threshold feature. Note once again that AD-MSCs responded to IP3 uncaging without evident delay (Fig. 2B), indicating that IP3 production could be a rate-limiting process in agonist transduction. Consistently with this inference, the realistic lag of agonist responses could be simulated only at an appropriately slow rate of IP3 production (Fig. 5).
3.3.2. Effects of exogeneous Ca2+ buffer (NP-EGTA)
The interesting aspect of AD-MSC responses to agonists was their sensitivity to exogenous Ca2+ buffer, particularly NP-EGTA. This photolabile Ca2+ buffer was preferable because a marked increase in Ca2+ buffering capacity of the cell cytosol could be reversed by UV light that converted NP-EGTA into the compound with greatly decreased affinity to Ca2+ [37]. In a typical experiment, AD-MSCs were subjected to control stimulation with 3 μM ATP, and then cells were treated with the permeant precursor NP-EGTA-AM (4 μM) for 15 min, rinsed, and again stimulated by ATP in series (Fig. 6A). Among 74 ATP-responsive AD-MSCs assayed in this manner, 21 cells (28%) became completely nonresponsive to 3 μM ATP after NP-EGTA loading (Fig. 6A, cell 1). In the remaining 53 AD-MSCs, the inhibitory effect of NP-EGTA was postponed to some extent. In particular, 14 cells generated a single ATP response and solely on the first agonist applications performed after loading of NP-EGTA. These ATP responses were markedly slowed and diminished by 30–50% (Fig. 6A, cell 2). Although nearly half NP-EGTA loaded AD-MSCs (n=38) remained somehow responsive, especially cells generating oscillations (n=10), their ATP responses progressively varied with time in shape, kinetics, and magnitude (Fig. 6, cell 3). Next, we tried to reverse effects of the exogeneous Ca2+ buffer by UV light, taking into account that a vigorous UV treatment could strongly desensitize NP-EGTA loaded cells by bursting cytosolic Ca2+ and perhaps reactive oxygen species. We therefore attained the photo-destruction of NP-EGTA gradually, illuminating cells with 100-ms UV flashes every second during 10-min. This moderate UV treatment usually restored agonist responsivity of assayed cells (Fig. 6A).
To account for the abovementioned diversity of the NP-EGTA effects (Fig. 6A, cells 1-3), we assumed that at 15-min incubation of AD-MSCs with NP-EGTA-AM in the bath, NP-EGTA loading varied from cell to cell. Indeed, being determined by varying from cell to cell factors, such as activity of multidrug resistance proteins and intracellular esterase and the surface/volume ratio, NP-EGTA accumulation by AD-MSCs hardly could be uniform and stationary for 15-min loading. Presumably, for some AD-MSCs, the 15-min NP-EGTA loading was sufficient for a high increase in buffering capacity of the cytosol, thereby preventing the generation of detectable Ca2+ transients on ATP (Fig. 6A, cell 1). Even if a cell accumulated enough NP-EGTA-AM, insufficiently active esterase would generate the moderate quantity of NP-EGTA, so that ATP still could trigger Ca2+ signaling (Fig. 6, cells 2 and 3). To all appearances, a nonhydrolyzed fraction of accumulated NP-EGTA-AM was pumped out from cells slowly, and the generation of NP-EGTA could persist even in rinsed AD-MSCs, prolonging the enlargement of Ca2+ buffering capacity of their cytosol. This explained why some cells responded to ATP shortly after 15-min treatment with NP-EGTA-AM but became irresponsive later (Fig. 6, cell 2).
We employed the model (3) to analyze the effects of exogeneous Ca2+ buffer on agonist transduction by using the basic parameter set (Table 1S), at which the model generated a single Ca2+ peak on a short agonist application (Fig. 4A). Note that oscillatory behavior also was exhibited by our model although it required some changes of the parameters (see below). The endogenous Ca2+ buffer in our model was postulated to be fast and non-saturable, so its influence on Ca2+ signaling was manifested simply through the parameter αc in Eq. (5a). In contrast, NP-EGTA characterized by the dissociation constant of nearly 80 nM [32] could not effectively influence the dynamics of cytosolic Ca2+ exceeding 100 nM. In addition, NP-EGTA is presumably slow buffer, given that Ca2+ unbinds EGTA with the rate constant of ~0.5 s-1 [47]. The abovementioned features of NP-EGTA provided rationale to describe the rate of NP-EGTA/Ca2+ binding vb with the following expression that was derived from the two binding equations by excluding concentration of free buffer:
| (8) |
where Cb is the concentration of Ca2+ bound to the buffer, Bt is the total concentration of free and complexed buffer, dissociation constant is the ratio of unbinding and binding rate constants. By combining Eqs. (6a) and (8), the following system was derived:
| (9a) |
| (9b) |
Based on Eqs. (6b) and (9), we simulated effects of exogeneous NP-EGTA-like Ca2+ buffer by varying Bt from 0 to 300 μM at invariable endogenous buffer characterized by αc=120. As should be the case with any Ca2+ buffer, a steady-state Ca2+ level was unaffected by exogeneous Ca2+ buffer irrespective of its concentration (Fig. 6B). In contrast, a Ca2+ response elicited by a shortly applied agonist became slower, smaller, and finally abolished as the concentration of exogeneous Ca2+ buffer rose ( Fig. 6B). Thus, in line with the experimental findings (Fig. 6A, cells 1 and 2), our model predicted that agonist would be unable to elicit detectable Ca2+ mobilization in a cell overloaded with NP-EGTA, the condition mimicked at Bt = 300 μM and higher (Fig. 6B). Such cytosolic concentration of exogeneous Ca2+ buffer appeared to be hardly achievable in practice, given that AD-MSCs were loaded with 4 μM NP-EGTA-AM in the bath (Fig. 6A). Note however that intracellular esterase permanently hydrolyzed NP-EGTA-AM, which penetrated into a cell from outside, producing impermeant NP-EGTA and increasing its level as long as NP-EGTA-AM influx existed and esterase was active. Thus, depending on loading conditions and esterase activity, a cytosolic level of NP-EGTA could be sufficiently high to greatly exceed the extracellular concentration of its precursor.
3.3.3. Dynamics of stored Ca2+
In many non-excitable cells, including MSCs, Ca2+ entry contributes weakly to Ca2+ transients evoked by agonists (Fig. 2A), and intracellular Ca2+ signaling in such cells is largely determined by Ca2+ exchange between intracellular compartments. Given that monitoring of intraluminal Ca2+ in intracellular organelles could uncover important details of intracellular Ca2+ homeostasis, multiple genetically encoded Ca2+ sensors have been elaborated to address this challenge [48]. Unfortunately, in our hands, AD-MSCs were poorly transfected with plasmid vectors. On the other hand, Ca2+ signaling induced by GPCR agonists in HEK-293 cells was phenomenologically similar to agonist transduction in AD-MSCs (Figs.1, 2). We therefore transfected HEK-293 cells with the high- and low-affinity Ca2+ indicators GEM-GECO1 (Kd = 340 nM) and R-CEPIA1er (Kd = 565 μM) with the cytosolic and reticular localization, respectively [33,34]. This allowed for synchronous monitoring of cytosolic and reticular Ca2+ by recording GEM-GECO1 and R-CEPIA1er fluorescence in transfected cells. The fluorescence of the ratiometric indicator GEM-GECO1 was recorded at 510 ± 20 nm, so a rise of cytosolic Ca2+ resulted in a decrease in GEM-GECO1 emission [33]. The R-CEPIA1er fluorescence was recorded at 605 ± 25 nm with a proportional dependence of its intensity on reticular Ca2+ [34].
By using this approach, we studied effects of bath ACh on cytosolic and reticular Ca2+ in GEM-GECO1/R-CEPIA1er-positive HEK-293 cells (n=83), each being identified by the concurrent fluorescence in the green and red spectral ranges. It was particularly found that a serial application of ACh at increasing concentrations elicited Ca2+ bursts in the cytosol, which were oscillatory at 0.6 and 1.25 μM ACh and became pulse-like at 5 μM ACh (Fig. 7A, green curve). The kinetics of reticular Ca2+ signals was in strong correlation with cytosolic Ca2+ signals (Fig. 7A, red curve), the observation indicating that just Ca2+ release was mainly responsible for Ca2+ bursts initiated by ACh in the cytoplasm of HEK-293 cells. To evaluate a relative value of ACh-induced Ca2+ signals in Ca2+ store, in the end of a particular recording, we treated cells with Ca2+ ionophore ionomycin (5 μM), while bath Ca2+ was reduced from 2 mM to 260 nM. Although under these conditions, ionomycin could not initiate effective Ca2+ influx, its application resulted in a marked Ca2+ transient in the cell cytosol that was obviously originated by intracellular Ca2+ source. (Fig. 7A, green curve). Judging by a marked drop in a reticular Ca2+ signal (Fig. 7A, red curve), bath applied ionomycin presumably penetrated into a cell and permeabilized endoplasmic reticulum, thereby emptying this Ca2+ store. Because the ionomycin-induced signal from the reticular Ca2+ sensor greatly exceeded the reticular response to ACh, Ca2+ store was emptied by ACh-triggered Ca2+ release only to a moderate extent.
Although here we adapted our model to simulate spike-like Ca2+ transients, it demonstrated intrinsic excitability in certain range of parameters (see Supplementary Materials). At appropriately adjusted parameters (Table 1S), it was possible to simulate agonist responses in the form of both single Ca2+ spikes (Fig. 6A, cell 1) and oscillatory Ca2+ bursts (Fig. 6A, cell 3, Fig. 7A). In particular, the model satisfactorily reproduced the behavior of cytosolic and reticular Ca2+ in HEK-293 cells stimulated by ACh pulses (Fig. 7A). The model produced a train of oscillations of cytosolic Ca2+ at weak stimulation (a=0.2), while at stronger stimulation (a=1), it generated a pulse-like slightly oscillating Ca2+ response (Fig. 7B, green lines). The corresponding changes in reticular Ca2+ were concordant with cytosolic Ca2+ responses, and by value, they represented relatively small deviations from the resting level (Fig. 7B, red lines).
4. Discussion
The previous study of AD-MSCs revealed the functional expression of a variety of GPCRs that were coupled by the phosphoinositide cascade to the mobilization of intracellular Ca2+ [21,22,32,49]. Characteristic of GPCR-mediated Ca2+ signaling in AD-MSCs was that Ca2+ transients triggered by short agonist pulses were more or less universal kinetically and by magnitude irrespective of agonist doses (Fig. 1A-D). In contrast, the response lag markedly decreased as agonist dose rose (Fig. 1D, E). The evidence presented here suggested that IP3/Ca2+-regulated Ca2+ release via IP3Rs associated with CICR was predominantly responsible for agonist-induced Ca2+ signals: (i) The inhibition of PLC activity with U73122 canceled AD-MSC responses to agonists (Fig. 2A); (ii) IP3 and Ca2+ uncaging elicited quite similar, if not identical, Ca2+ transients, which correctly simulated kinetics and magnitude of agonist responses (Fig. 2B, C); (iii) The RYR antagonist ryanodine inhibited neither agonist responses nor CICR stimulated by Ca2+ uncaging (Fig. 2D).
To verify a key contribution of the phosphoinositide cascade and IP3/Ca2+-dependent CICR mechanism to agonist-induced Ca2+ signaling in AD-MSCs, we employed mathematical modeling. This effective tool can provide a complementary insight into experimental data, particularly by allowing one to evaluate a role for different signaling elements in the functionality of transduction machinery as a whole. Based on experimental findings, we suggested the simplified kinetic circuit (Fig. 3), which enabled us to qualitatively and somewhat quantitatively reproduce the basic phenomenology of Ca2+ signaling induced by short agonist pulses in AD-MSCs. In particular, the model correctly predicted the “all-or-nothing” character of agonist responses and their rather invariant shape (Fig. 1A–E; Fig. 4A, B). Quite consistently with experimental estimates (Fig. 1G), the lag of model responses decreased gradually with agonist dose (Fig. 4C). The prominent similarity between cell responses to Ca2+ uncaging and to agonists (Fig. 2C) was reproduced as well (Fig. 4D).
It should be noted that the threshold responsivity to stimulation is the principal feature of intracellular dynamic subsystems responsible for the phenomenon of cell excitability, which is particularly disclosed as an action potential train in a neuron or a Ca2+ wave in an electrically non-excitable cell [25]. Although we did not study Ca2+ waves in AD-MSCs, their excitability appeared as “all-or-nothing” responsiveness to a variety of agonists (Fig. 1A–E). Our simulations confirmed that CICR-based mechanism could underly the step-like transition of cell responsivity from negligible to maximal, which occurred in a very narrow range of agonist concentrations (Fig. 4B). Apart from this threshold responsivity to so-called parameter disturbance (agonist jump), we also obtained the threshold responsivity to variable (cytosolic Ca2+) disturbance (Fig. 4D). The last represents the essence of active release sites that provide the propagation of spatial Ca2+ waves in distributed excitable systems [25].
4.1. Simplifying assumptions
In the suggested kinetic circuit (Fig. 3), several well-established regulations of transduction machinery were omitted for simplicity. In particular, the GPCR inactivation, which is mediated by receptor kinase and arrestin [50], was ignored for the reason that we considered a short-term signaling process triggered by a relatively brief agonist pulse. Based on the subtle influence of bath Ca2+on cell responsivity (Fig. 2A), Ca2+ influx was considered as a minor factor in generating Ca2+ transients studied. This allowed one to neglect store-operated Ca2+ entry (SOCE) and to take Ca2+ influx as a model parameter. Despite these sufficiently coarse simplifications, the model was capable of reproducing certain fine details of short-term Ca2+ signals observed in the cell cytoplasm and Ca2+ store (Fig. 7A, B).
Reportedly, activity of IP3Rs, a primary conduit for Ca2+ release in our model, is regulated by multiple mechanisms, including phosphorylation by several kinases and modulation by specialized IP3R interacting proteins [42]. Among them, the feedback regulation of IP3Rs by Ca2+ per se and by Ca2+ binding proteins, such as CaM, CaBP1, and NCS-1, appear to be most rapid, and therefore most relevant for our model of short-term agonist signaling. Although Ca2+-binding proteins interact with the IP3R isoforms in a complex way [42], we suggested that their possible influence on IP3-dependent Ca2+ release could be reduced simply to the allosteric modulation of IP3R binding to IP3 and Ca2+ [51]. If so, the regulatory effects of Ca2+-binding proteins could be correctly simulated by adjusting appropriate kinetic constants and cooperativity that characterized the binding of the primary IP3R regulators.
The signaling circuit (Fig. 3) was taken completely homogeneous, thereby disregarding possible compartmentalization of considered intracellular evens, the involvement of several signaling protein isoforms with distinct characteristics as well as the crowding/diffusion problem [52,53]. The influence of diffusion on kinetics of agonist responses analyzed here was presumably small, given that Ca2+ signals recorded by us were generated largely by the active mechanism CICR. As shown in studies of Ca2+ puff generation [52] and SOCE [54], IP3Rs can form spatially separated local clusters as a way to optimize their function. Compared to our homogeneous pathway with identical IP3Rs, the model with several Ca2+-release compartments, each containing different combinations of IP3R and SERCA isoforms, may be more insightful and expedient to address certain quantitative aspects. For example, the none-homogeneous approach might be effective for solving the refractoriness problem discussed below and for describing long-lasting events, such as Ca2+ oscillations or synergism in Ca2+ signaling initiated by a mixture of agonists.
4.2. Refractoriness of model responses
Although our computations reproduced adequately the short-term agonist transduction in AD-MSCs, in certain cases, the model (Fig. 3) did not quite correctly predict the kinetics of Ca2+ store recovery. Note that in multiple cell types we assayed, including MSCs from different sources, HEK-293, and CHO [22,27,49], the refractory period of Ca2+ responses on short stimulation varied within 170–350 s, depending on cell type, GPCR isoform involved, and stimulus strength. The refractory period was determined as the characteristic time required for virtually complete recovery of stored Ca2+ to the resting level (Fig. 7A). For the basic parameter set (Table 1S), at which the model generated single Ca2+ spikes on pulse stimulation (Fig. 4), the apparently complete recovery of system responsivity took 285 s and 165 s at a=0.2 and 1, respectively. These values were rather consistent with the estimates for the refractory period obtained experimentally with the R-CEPIAer sensor (Fig. 7A, red line).
On the other hand, it was impossible to simultaneously get the realistic refractory period and agonist response duration at parameters adjusted to simulate experimental Ca2+ responses crowned with oscillations (Fig. 7A and Fig. 7B, green lines). In particular, for the 60-s stimulation with a=0.2, the Ca2+ store recovered within 420 s at parameters that provided response duration of nearly 30 s (Fig. 7B, upper-left panel). When the parameters establishing response timing were adjusted to generate a response burst of nearly 100 s, the value consistent with the experimental findings (Fig. 7A, green line), the refractory period exceeded 1000 s. Thus, by intrinsic properties of our model, response duration and refractoriness could be varied only mutually. This implies that at least one more regulatory or transport process should have been taken into consideration to reconcile our experimental findings and model predictions on Ca2+ store refilling.
In our model, activity of SERCA depends only on cytosolic Ca2+ and is characterized by the rate that is a monotonic function of cytosolic Ca2+ (Eq. (3)). After the short Ca2+ burst induced by stimulation, cytosolic Ca2+ rapidly decreases to a nearly resting level (Fig. 7B, upper panel). Consequently, the activity of SERCA becomes proportionally low, and the Ca2+ pump refills Ca2+ store slowly. Meanwhile, the existing evidence points at the possibility that luminal Ca2+ can negatively affect SERCA activity [55]. Hence, Ca2+ release might stimulate SERCA activity not only by increasing cytosolic Ca2+ but also by emptying Ca2+ store.
We imitated this regulation by using the following expression for the SERCA-mediated Ca2+ flux:
where the denominator 1+(Cs/Kis)2 described the inhibition of SERCA by luminal Ca2+, while V2m was adjusted to keep the same SERCA activity at rest. By enhancing Ca2+ store refilling, this negative feedback somewhat restricted an agonist-induced drop in reticular Ca2+ by value and duration. However, being unable to properly enhance critically low activity of SERCA at resting or close levels of cytosolic Ca2+, this mechanism did not shorten response refractoriness to realistic values below 400 s.
Note as one more possibility that the rapid recovery of luminal Ca2+ in a real cell might be provided by Ca2+ exchange between a reticular compartment storing Ca2+ and nearby mitochondrion [56]. This organelle, which accumulates a portion of released Ca2+, might liberate the ion and locally maintain a high Ca2+ level in the close vicinity of a SERCA abundant site of the reticular membrane, whereas the bulk of cytosolic Ca2+ has relaxed to a nearly resting level. Although we neglected a contribution of SOCE to Ca2+ bursts initiated by short agonist pulses, the key cellular function of SOC channels is to provide Ca2+ for Ca2+ store refilling [57], the sufficiently slow process. The further inclusion of SOCE into our model in combination with appropriate experimental validation may help in addressing the refractoriness problem highlighted above.
4.3. Self-cessation of Ca2+ responses
The presented model includes two feedback mechanisms, which negatively regulate IP3R-mediated Ca2+ release, thereby contributing to the falling phase of Ca2+ transients triggered by agonist pulses. The key mechanism is associated with the inactivation of IP3R by high cytosolic Ca2+ and takes place irrespective of luminal Ca2+ [4,10]. As evolving within 1 s [58], this relatively quick process should develop synchronously with the initial rising phase of a Ca2+ response and shape its peak. The second negative feedback arises due to the proportionality of Ca2+ efflux to the luminal Ca2+ concentration at a huge trans-reticular Ca2+ gradient. Therefore, by producing a drop in luminal Ca2+, Ca2+ release causes self-inhibition (Fig. 7A, bottom panel). This negative regulation of Ca2+ release could play an essential role only when Ca2+ store is emptied sufficiently. Nevertheless, just this mechanism establishes a critical level of luminal Ca2+, below which the Ca2+ exchange between the Ca2+ store and cytosol switches from Ca2+ release through IP3Rs to Ca2+ intake mediated by SERCA.
Note in conclusion that here we largely focused on IP3R-based mechanisms with intrinsic self-cessation, which could couple a short agonist stimulation to a single Ca2+ burst. Meanwhile, more diverse agonist-induced intracellular Ca2+ signals, from single Ca2+ transients to sustained Ca2+ oscillations, could be generated with mechanisms involving CICR, characteristic of which is the existence of a critical manifold in the phase space folded with respect to the fast variable C that corresponds to folded nullclines [25]. By using the graphical approach, we tried to outline conditions that determined a form of transient Ca2+ signals produced by our model (Supplementary Materials). The analysis particularly suggested that the kinetics of IP3R inhibition by cytosolic Ca2+ could be central to determining a form of Ca2+ transients, single spike or burst-like, generated in response to short agonist pulses. The oscillatory regime might also be achieved by extending the model with SOCE, which, mathematically, brought the steady-state point on the unstable part of the folded nullcline [59] (see Fig. 4S).
The bursting Ca2+ oscillations have been reproduced with several model mechanisms, which included a Ca2+ feedback regulation of IP3 degradation or two separate Ca2+ stores [60], implicated mitochondria in Ca2+ homeostasis [61], or involved Ca2+-activated PLC [31]. The further analysis of fine details in agonist-induced Ca2+ signaling in AD-MSCs may necessitate the enrichment of our model with some of the signaling/regulatory processes mentioned above.
5. Conclusion
Here we developed a simplified mathematical model to perform the analytical dissection of agonist transduction in AD-MSCs for the first time. The proposed approach allowed us to adequately simulate different aspects of early Ca2+ signaling initiated by short agonist pulses. The proposed model not only exhibited the threshold responsiveness but also reproduced the inverse dependence of agonist response lag on stimulus strength, accounting for prolonged response delay by relatively slow IP3 production. The simulations performed pointed out that the kinetics of IP3R inhibition by cytosolic Ca2+ was central to determining the character, single spike or burst, of Ca2+ transients elicited by brief agonist pulses. The model could be extended to take into account a contribution of several other mechanisms, including SOCE and ER-mitochondrion interaction. Yet, the plasmalemmal Ca2+ extrusion was simulated by Ca2+ pumping solely dependent on cytosolic Ca2+. By detailing this process as mediated by PMCA and electrogenic Na+/Ca2+ exchange, it is possible to take into account a contribution of membrane voltage and the main monovalent cations to Ca2+ signaling.
The prolonged cell stimulation triggers long-lasing Ca2+ signaling that can involve multiple feedbacks mediated by a variety of Ca2+-binding proteins and Ca2+-dependent enzymes, including Ca2+-regulated kinases, phosphatases, cyclases, phospodiesterases, and many others. The contribution of these factors to short-term processes like one considered here can be ignored, thus simplifying their modeling. Meanwhile, a Ca2+ signal elicited by brief stimulation represents in fact the initial transient phase of Ca2+ signaling at prolonged stimulation, including Ca2+ oscillations. Therefore, our model of Ca2+ transients in AD-MSCs can be of more general significance as somehow complementing the theoretical studies of Ca2+ oscillations performed previously.
Yet, experiments with HEK-293 cells expressing the genetically encoded Ca2+ sensors R-CEPIA1er and GEM-GECO1 showed that the former was subjected to relatively quick photobleaching. The mathematical approach, which was proposed by us for the correction of experimental R-CEPIA1er signals (Supplementary Materials), can be applicable to the reconstruction of true evolution of cell signals originated by R-CEPIA1er-like fluorophores.
Declaration of Competing Interest
The authors disclose no conflict of interest.
Acknowledgments
The authors thank Dr. Veronika Yu. Sysoeva for providing the primary AD-MSC culture of the first passage. This work was supported by the Russian Science Foundation, including MSC studies (grant 18-14-00347) and experiments with genetically encoded Ca2+ sensors (grant 19-75-10068).
Footnotes
Supplementary material associated with this article can be found, in the online version, at doi:10.1016/j.bbadva.2021.100012.
Appendix. Supplementary materials
References
- 1.Clapham D. Calcium signaling. Cell. 2007;131:1047–1058. doi: 10.1016/j.cell.2007.11.028. [DOI] [PubMed] [Google Scholar]
- 2.Berridge M.J., Bootman M.D., Roderick H.L. Calcium signaling: dynamics, homeostasis and remodeling. Nat. Rev. Mol. Cell Biol. 2003;4:517–529. doi: 10.1038/nrm1155. [DOI] [PubMed] [Google Scholar]
- 3.Rizzuto R., De Stefani D., Raffaello A., Mammucari C. Mitochondria as sensors and regulators of calcium signaling. Nat. Rev. Mol. Cell Biol. 2012;13:566–578. doi: 10.1038/nrm3412. [DOI] [PubMed] [Google Scholar]
- 4.Berridge M.J. The inositol trisphosphate/calcium signaling pathway in health and disease. Physiol. Rev. 2016;96:1261–1296. doi: 10.1152/physrev.00006.2016. [DOI] [PubMed] [Google Scholar]
- 5.Trebak M., Kinet J.-P. Calcium signalling in T cells. Nat. Rev. Immunol. 2019;19:154–169. doi: 10.1038/s41577-018-0110-7. [DOI] [PMC free article] [PubMed] [Google Scholar]
- 6.Cattaneo F., Guerra G., Parisi M., De Marinis M., Tafuri D., Cinelli M., Ammendola R. Cell-surface receptors transactivation mediated by G protein-coupled receptors. Int. J. Mol. Sci. 2014;15:19700–19728. doi: 10.3390/ijms151119700. [DOI] [PMC free article] [PubMed] [Google Scholar]
- 7.Foskett J.K., White C., Cheung K.H., Mak D.O. Inositol trisphosphate receptor Ca2+ release channels. Physiol. Rev. 2007;87:593–658. doi: 10.1152/physrev.00035.2006. [DOI] [PMC free article] [PubMed] [Google Scholar]
- 8.Mikoshiba K. Role of IP3 receptor signaling in cell functions and diseases. Adv. Biol. Regul. 2015;57:217–227. doi: 10.1016/j.jbior.2014.10.001. [DOI] [PubMed] [Google Scholar]
- 9.Taylor C.W., da Fonseca P.C.A., Morris E.P. IP3 receptors: the search for structure. Trends Biochem. Sci. 2004;29:210–219. doi: 10.1016/j.tibs.2004.02.010. [DOI] [PubMed] [Google Scholar]
- 10.Mak D.O., Foskett J.K. Inositol 1,4,5-trisphosphate receptors in the endoplasmic reticulum: a single-channel point of view. Cell Calcium. 2015;58:67–78. doi: 10.1016/j.ceca.2014.12.008. [DOI] [PMC free article] [PubMed] [Google Scholar]
- 11.Rios E. Calcium-induced release of calcium in muscle: 50 years of work and the emerging consensus. J. Gen. Physiol. 2018;150:521–537. doi: 10.1085/jgp.201711959. [DOI] [PMC free article] [PubMed] [Google Scholar]
- 12.Keating A. Mesenchymal stromal cells: new directions. Cell Stem Cell. 2012;10:709–716. doi: 10.1016/j.stem.2012.05.015. [DOI] [PubMed] [Google Scholar]
- 13.Baer P.C., Geiger H. Adipose-derived mesenchymal stromal/stem cells: tissue localization, characterization, and heterogeneity. Stem Cells Int. 2012;2012 doi: 10.1155/2012/812693. [DOI] [PMC free article] [PubMed] [Google Scholar]
- 14.Andrzejewska A., Lukomska B., Janowski M. Concise review: mesenchymal stem cells: from roots to boost. Stem Cells. 2019;37:855–864. doi: 10.1002/stem.3016. [DOI] [PMC free article] [PubMed] [Google Scholar]
- 15.Lou G., Chen Z., Zheng M., Liu Y. Mesenchymal stem cell-derived exosomes as a new therapeutic strategy for liver diseases. Exp. Mol. Med. 2017;49:e346. doi: 10.1038/emm.2017.63. [DOI] [PMC free article] [PubMed] [Google Scholar]
- 16.Fitzsimmons R.E.B., Mazurek M.S., Soos A., Simmon C.A. Mesenchymal stromal/stem cells in regenerative medicine and tissue engineering. Stem Cells Int. 2018;2018 doi: 10.1155/2018/8031718. [DOI] [PMC free article] [PubMed] [Google Scholar]
- 17.Takahashi H., Sakata N., Yoshimatsu G., Hasegawa S., Kodama S. Regenerative and transplantation medicine: cellular therapy using adipose tissue-derived mesenchymal stromal cells for type 1 diabetes mellitus. J. Clin. Med. 2019;8:249. doi: 10.3390/jcm8020249. [DOI] [PMC free article] [PubMed] [Google Scholar]
- 18.Meriane M., Duhamel S., Lejeune L., Galipeau J., Annabi B. Cooperation of matrix metalloproteinases with the RhoA/Rho kinase and mitogen-activated protein kinase kinase-1/extracellular signal-regulated kinase signaling pathways is required for the sphingosine-1-phosphate-induced mobilization of marrow-derived stromal cells. Stem Cells. 2006;24:2557–2565. doi: 10.1634/stemcells.2006-0209. [DOI] [PubMed] [Google Scholar]
- 19.Scarfi S. Purinergic receptors and nucleotide processing ectoenzymes: their roles in regulating mesenchymal stem cell functions. World J. Stem Cells. 2014;6:153–162. doi: 10.4252/wjsc.v6.i2.153. [DOI] [PMC free article] [PubMed] [Google Scholar]
- 20.Igarashi H., Akahoshi N., Ohto-Nakanishi T., Yasuda D., Ishii S. The lysophosphatidic acid receptor LPA4 regulates hematopoiesis-supporting activity of bone marrow stromal cells. Sci. Rep. 2015;5:11410. doi: 10.1038/srep11410. [DOI] [PMC free article] [PubMed] [Google Scholar]
- 21.Forostyak O., Forostyak S., Kortus S., Sykova E., Verkhratsky A., Dayanithi G. Physiology of Ca2+ signalling in stem cells of different origins and differentiation stages. Cell Calcium. 2016;59:57–66. doi: 10.1016/j.ceca.2016.02.001. [DOI] [PubMed] [Google Scholar]
- 22.Kotova P.D., Bystrova M.F., Rogachevskaja O.A., Khokhlov A.A., Sysoeva V.Yu., Tkachuk V.A., Kolesnikov S.S. Coupling of P2Y receptors to Ca2+ mobilization in mesenchymal stromal cells from the human adipose tissue. Cell Calcium. 2018;71:1–14. doi: 10.1016/j.ceca.2017.11.001. [DOI] [PubMed] [Google Scholar]
- 23.Najar M., Fayyad-Kazan M., Raicevic G., Fayyad-Kazan H., Meuleman N., Bron D., Lagneaux L. Advanced glycation end-products-, C-type lectin- and cysteinyl/leukotriene-receptors in distinct mesenchymal stromal cell populations: differential transcriptional profiles in response to inflammation. Cell J. 2018;20:250–258. doi: 10.22074/cellj.2018.5104. [DOI] [PMC free article] [PubMed] [Google Scholar]
- 24.Sneyd J., Falсke M. Models of the inositol trisphosphate receptor. Prog. Biophys. Mol. Biol. 2005;89:207–245. doi: 10.1016/j.pbiomolbio.2004.11.001. [DOI] [PubMed] [Google Scholar]
- 25.Dupont G., Falcke M., Kirk V., Sneyd J. Springer International Publishing Switzerland; 2016. Models of Calcium Signalling. [Google Scholar]
- 26.Dupont G., Berridge M.J., Goldbeter A. Latency correlates with period in a model for signal-induced Ca2+ oscillations based on Ca2+-induced Ca2+ release. Cell Regul. 1990:853–861. doi: 10.1091/mbc.1.11.853. 1. [DOI] [PMC free article] [PubMed] [Google Scholar]
- 27.Rooney T.A., Sass E.J., Thomas A.P. Characterization of cytosolic calcium oscillations induced by phenylephrine and vasopressin in single fura-2-loaded hepatocytes. J. Biol. Chem. 1989;264:17131–17141. [PubMed] [Google Scholar]
- 28.Thurley K., Falcke M. Derivation of Ca2+ signals from puff properties reveals that pathway function is robust against cell variability but sensitive for control. Proc. Natl. Acad. Sci. USA. 2011;108:427–432. doi: 10.1073/pnas.1008435108. [DOI] [PMC free article] [PubMed] [Google Scholar]
- 29.Sneyd J., Han J.M., Wang L., Chen J., Yang X., Tanimura A., Sanderson M.J., Kirk V., Yule D.I. On the dynamical structure of calcium oscillations. Proc. Natl. Acad. Sci. USA. 2017;114:1456–1461. doi: 10.1073/pnas.1614613114. [DOI] [PMC free article] [PubMed] [Google Scholar]
- 30.Cloete I., Bartlett P.J., Kirk V., Thomas A.P., Sneyd J. Dual mechanisms of Ca2+ oscillations in hepatocytes. J Theor Biol. 2020;503 doi: 10.1016/j.jtbi.2020.110390. [DOI] [PubMed] [Google Scholar]
- 31.Bartlett P.J., Cloete I., Sneyd J., Thomas A.P. IP3-dependent Ca2+ oscillations switch into a dual oscillator mechanism in the presence of PLC-linked hormones. iScience. 2020;23 doi: 10.1016/j.isci.2020.101062. [DOI] [PMC free article] [PubMed] [Google Scholar]
- 32.Kotova P.D., Sysoeva V.Y., Rogachevskaja O.A., Bystrova M.F., Kolesnikova A.S., Tyurin-Kuzmin P.A., Fadeeva J.I., Tkachuk V.A., Kolesnikov S.S. Functional expression of adrenoreceptors in mesenchymal stromal cells derived from the human adipose tissue. Biochim. Biophys. Acta. 2014;1843:1899–1908. doi: 10.1016/j.bbamcr.2014.05.002. [DOI] [PubMed] [Google Scholar]
- 33.Zhao Y., Araki S., Wu J., Teramoto T., Chang Y.F., Nakano M., Abdelfattah A.S., Fujiwara M., Ishihara T., Nagai T., Campbell R.E. An expanded palette of genetically encoded Ca2+ indicators. Science. 2011;333:1888–1891. doi: 10.1126/science.1208592. [DOI] [PMC free article] [PubMed] [Google Scholar]
- 34.Suzuki J., Kanemaru K., Ishii K., Ohkura M., Okubo Y., Iino M. Imaging intraorganellar Ca2+ at subcellular resolution using CEPIA. Nat. Commun. 2014;5:4153. doi: 10.1038/ncomms5153. [DOI] [PMC free article] [PubMed] [Google Scholar]
- 35.Goryanin I., Hodgman T.C., Selkov E. Mathematical simulation and analysis of cellular metabolism and regulation. Bioinformatics. 1999;15:749–758. doi: 10.1093/bioinformatics/15.9.749. [DOI] [PubMed] [Google Scholar]
- 36.Thomas N.L., Williams A.J. Pharmacology of ryanodine receptors and Ca2+-induced Ca2+ release. Wiley Interdiscip. Rev. Membr. Transp. Signal. 2012;1:383–397. [Google Scholar]
- 37.Ellis-Davies G.C. Caged compounds: photorelease technology for control of cellular chemistry and physiology. Nat. Methods. 2007;4:619–628. doi: 10.1038/nmeth1072. [DOI] [PMC free article] [PubMed] [Google Scholar]
- 38.Park J.B., Lee C.S., Jang J.H., Ghim J., Kim Y.J., You S., Hwang D., Suh P.-G., Ryu S.H. Phospholipase signalling networks in cancer. Nat. Rev. Cancer. 2012;12:782–792. doi: 10.1038/nrc3379. [DOI] [PubMed] [Google Scholar]
- 39.Saleem H., Tovey S.C., Molinski T.F., Taylor C.W. Interactions of antagonists with subtypes of inositol 1,4,5-trisphosphate (IP3) receptor. Br. J. Pharmacol. 2014;171:3298–3312. doi: 10.1111/bph.12685. [DOI] [PMC free article] [PubMed] [Google Scholar]
- 40.Lemon G., Gibson W.G., Bennett M.R. Metabotropic receptor activation, desensitization and sequestration - I: modelling calcium and inositol 1,4,5-trisphosphate dynamics following receptor activation. J. Theor. Biol. 2003;223:93–111. doi: 10.1016/s0022-5193(03)00079-1. [DOI] [PubMed] [Google Scholar]
- 41.Falkenburger B.H., Jensen J.B., Hille B. Kinetics of M1 muscarinic receptor and G protein signaling to phospholipase C in living cells. J. Gen. Physiol. 2010;135:81–97. doi: 10.1085/jgp.200910344. [DOI] [PMC free article] [PubMed] [Google Scholar]
- 42.Parys J.B., Vervliet T. New insights in the IP 3 receptor and its regulation. Adv. Exp. Med. Biol. 2020;1131:243–270. doi: 10.1007/978-3-030-12457-1_10. [DOI] [PubMed] [Google Scholar]
- 43.Tang Y., Stephenson J., Othmer H. Simplification and analysis of models of calcium dynamics based on IP3-sensitive calcium channel kinetics. Biophys. J. 1996;70:246–263. doi: 10.1016/S0006-3495(96)79567-X. [DOI] [PMC free article] [PubMed] [Google Scholar]
- 44.Atri A., Amundson J., Clapham D., Sneyd J.A. Single-pool model for intracellular calcium oscillations and waves in the Xenopus laevis oocyte. Biophys. J. 1993;65:1727–1739. doi: 10.1016/S0006-3495(93)81191-3. [DOI] [PMC free article] [PubMed] [Google Scholar]
- 45.Gin E., Crampin E.J., Brown D.A., Shuttleworth T.J., Yule D.I., Sneyd J. A mathematical model of fluid secretion from a parotid acinar cell. J. Theor. Biol. 2007;248:64–80. doi: 10.1016/j.jtbi.2007.04.021. [DOI] [PMC free article] [PubMed] [Google Scholar]
- 46.Greenwald E.C., Mehta S., Zhang J. Genetically encoded fluorescent biosensors illuminate the spatiotemporal regulation of signaling networks. Chem. Rev. 2018;118:11707–11794. doi: 10.1021/acs.chemrev.8b00333. [DOI] [PMC free article] [PubMed] [Google Scholar]
- 47.Naraghi M. T-jump study of calcium binding kinetics of calcium chelators. Cell Calcium. 1997;22:255–268. doi: 10.1016/s0143-4160(97)90064-6. [DOI] [PubMed] [Google Scholar]
- 48.Zhong C., Schleifenbaum J. Genetically encoded calcium indicators: a new tool in renal hypertension research. Front. Med. 2019;6:128. doi: 10.3389/fmed.2019.00128. [DOI] [PMC free article] [PubMed] [Google Scholar]
- 49.Kotova P.D., Kochkina E.N., Lyamin O.O., Rogachevskaja O.A., Kovalenko N.P., Ivashin D.S., Bystrova M.F., Enukashvily N.I., Kolesnikov S.S. Calcium signaling mediated by aminergic GPCRs is impaired by the PI3K inhibitor LY294002 and its analog LY303511 in a PI3K-independent manner. Eur. J. Pharmacol. 2020;880:173–182. doi: 10.1016/j.ejphar.2020.173182. [DOI] [PubMed] [Google Scholar]
- 50.Gurevich V.V., Gurevich E.V. GPCR signaling regulation: the role of GRKs and Arrestins. Front. Pharmacol. 2019;10:125. doi: 10.3389/fphar.2019.00125. [DOI] [PMC free article] [PubMed] [Google Scholar]
- 51.Prole D.L., Taylor C.W. Structure and function of IP3 receptors. Cold Spring Harb Perspect. Biol. 2019;11 doi: 10.1101/cshperspect.a035063. [DOI] [PMC free article] [PubMed] [Google Scholar]
- 52.Lock J.T., Smith I.F., Parker I. Spatial-temporal patterning of Ca2+ signals by the subcellular distribution of IP3 and IP3 receptors. Semin. Cell Dev. Biol. 2019;94:3–10. doi: 10.1016/j.semcdb.2019.01.012. [DOI] [PMC free article] [PubMed] [Google Scholar]
- 53.Mourão M.A., Hakim J.B., Schnell S. Connecting the dots: the effects of macromolecular crowding on cell physiology. Biophys. J. 2014;107:2761–2766. doi: 10.1016/j.bpj.2014.10.051. [DOI] [PMC free article] [PubMed] [Google Scholar]
- 54.Thillaiappan N.B., Chavda A.P., Tovey S.C., Prole D.L., Taylor C.W. Ca2+ signals initiate at immobile IP3 receptors adjacent to ER-plasma membrane junctions. Nat. Commun. 2017;8:1505. doi: 10.1038/s41467-017-01644-8. [DOI] [PMC free article] [PubMed] [Google Scholar]
- 55.Mogami H., Tepikin A.V., Petersen O.H. Termination of cytosolic Ca2+ signals: Ca2+ reuptake into intracellular stores is regulated by the free Ca2+ concentration in the store lumen. EMBO J. 1998;17:435–442. doi: 10.1093/emboj/17.2.435. [DOI] [PMC free article] [PubMed] [Google Scholar]
- 56.Moshkforoush A., Ashenagar B., Tsoukias N.M., Alevriadou B.R. Modeling the role of endoplasmic reticulum-mitochondria microdomains in calcium dynamics. Sci. Rep. 2019;9:17072. doi: 10.1038/s41598-019-53440-7. [DOI] [PMC free article] [PubMed] [Google Scholar]
- 57.Di Giuro C.M.L., Shrestha N., Malli R., Groschner K., van Breemen C., Fameli N. Na +/Ca2+ exchangers and Orai channels jointly refill endoplasmic reticulum (ER) Ca2+ via ER nanojunctions in vascular endothelial cells. Pflugers Arch. 2017;469:1287–1299. doi: 10.1007/s00424-017-1989-8. [DOI] [PMC free article] [PubMed] [Google Scholar]
- 58.Finch E.A., Turner T.J., Goldin S.M. Calcium as a coagonist of inositol 1,4,5-trisphosphate-induced calcium release. Science. 1991;252:443–446. doi: 10.1126/science.2017683. [DOI] [PubMed] [Google Scholar]
- 59.Kaimachnikov N.P., Lisnichuk L.Ya. A model for Ca2+ oscillations in lymphocytes based on the regulation of Ca2+ influx into the cell. Membr. Cell Biol. 1995;9:111–120. [Google Scholar]
- 60.Borghans J.M., Dupont G., Goldbeter A. Complex intracellular calcium oscillations a theoretical exploration of possible mechanisms. Biophys. Chem. 1997;66:25–41. doi: 10.1016/s0301-4622(97)00010-0. [DOI] [PubMed] [Google Scholar]
- 61.Szopa P., Dyzma M., Kaźmierczak B. Membrane associated complexes in calcium dynamics modelling. Phys. Biol. 2013;10 doi: 10.1088/1478-3975/10/3/035004. [DOI] [PubMed] [Google Scholar]
Associated Data
This section collects any data citations, data availability statements, or supplementary materials included in this article.