

Abstract
The Central Medical Library (CMK) at the Faculty of Medicine, University of Ljubljana, Slovenia, started to build a library Website that included a guide to library services and resources in 1997. The evaluation of Website usage plays an important role in its maintenance and development. Analyzing and exploring regularities in the visitors' behavior can be used to enhance the quality and facilitate delivery of information services, identify visitors' interests, and improve the server's performance. The analysis of the CMK Website users' navigational behavior was carried out by analyzing the Web server log files. These files contained information on all user accesses to the Website and provided a great opportunity to learn more about the behavior of visitors to the Website. The majority of the available tools for Web log file analysis provide a predefined set of reports showing the access count and the transferred bytes grouped along several dimensions. In addition to the reports mentioned above, the authors wanted to be able to perform interactive exploration and ad hoc analysis and discover trends in a user-friendly way. Because of that, we developed our own solution for exploring and analyzing the Web logs based on data warehousing and online analytical processing technologies. The analytical solution we developed proved successful, so it may find further application in the field of Web log file analysis. We will apply the findings of the analysis to restructuring the CMK Website.
INTRODUCTION
The Web offers libraries the possibility to become disseminators of information through creating Websites. The most effective library Websites appear to be those that have a clear sense of purpose as well as a clear sense of users' needs. Therefore, an important aspect of planning and maintaining a Website is to identify the likely users and to review their needs [1, 2].
To meet Website users' needs better, two evaluation techniques are usually used. Surveys provide estimations of who uses the Web but fail to provide detailed information on exactly how the Web is used. Actual user behavior, as determined from Web server log file analysis, can supplement the understanding of Web users with more concrete data. Website behavior is largely dependent on the users' needs, interests, knowledge, and prejudices. Log file analysis also yields design and usability guidelines for Web pages, sites, and browsers [3–5].
The Central Medical Library (CMK) is a department of the Medical Faculty of University of Ljubljana, Slovenia. The authors started to build a library Website that included a guide to library services and resources in 1997 [6]. The evaluation of Website usage plays an important role in its maintenance and development. Analysis of users' navigational behavior allows for dynamic restructuring of the Website content and structure. We approached this task by developing our own solution for exploring and analyzing the Web logs based on data warehousing (DW) and online analytical processing (OLAP) technologies.
WEBSITE DESIGN
The CMK Website* serves as a guide to the library's resources and services. The planned content of the Website has crucially influenced the decisions regarding its structure. The CMK Website is built as an information entity embedded in uniform graphic design that encompasses three levels of menus, two levels of headers, the footer, and the background. It is possible to choose between eight submenus that provide some key information needed for effective use of CMK and access to information resources.
METHODS
The Website access evaluation was conducted by analyzing the CMK Web server log files. We decided to develop our own environment for Web server log analysis to allow for more flexible interactive exploration of the information contained in the Web log files. Such methodology helps us make decisions about future design improvements of the CMK Website. It is based on DW and OLAP technologies, which are widely used for support of the decision-making process in the business domain, but less frequently in other domains. Apart from Web server log analysis, we have successfully applied DW and OLAP for public health data analysis [7] and Y chromosome deletions analysis [8]. Although a number of ready-made tools for Web log analysis are available [9], most of them provide only a set of predefined reports without any support for interactive data exploration. The predefined reports contain most and least requested Web pages, most active visitor nodes, most frequently used Web clients, and number of requests per year, month, day of month, hour of day, and so on. In contrast, our DW and OLAP-based environment allows for dynamic generation of different user-defined reports.
Web log file structure
The Web server log file collects data records about access requests to the Website. Each request is recorded in one line of the Web server log file as can be seen in Table 1. The record contains the following fields: (1) the visitor node (IP address of the visitor node) where the request was issued from, (2) date and time (Web server local time) when the request was issued, (3) type of request, (4) Web page requested, (5) returned status, (6) number of bytes of content transferred to the visitor's Web client, (7) label of the Web client that issued the request, and (8) referring Web page (i.e., the address of the Web page where the request was issued from). For example, consider the first line from Table 1. It records the request issued by the visitor node with address “squid.amazed.nl” on January 3, 2000, at 7:29 for the page “/cmk/English.” The answer “200” (OK) was returned by the server, indicating that the request for a legal existing page was issued. Furthermore, 3,056 bytes of content were transferred to the visitor's Web client, labelled as “MSIE 4.01.” The last field of the first record from Table 1 indicates that the visitor came to CMK Website using the link provided by the Web search engine. The second and fourth requests listed in Table 1 were issued by the same visitor node, and the last fields of these two records indicate the path that the user followed through the Website: from the home page, through the information resources index page, to the list of journals page. The third row records a request from another visitor node.
Table 1 An example extract of the Central Medical Library Web server log file

To get better insight into the behavior of the visitors of our Website, we clustered the requests into visits. A visit is a sequence of requests issued by the same visitor within some limited time interval: we used an upper limit of thirty minutes for the time interval between two consecutive requests in the same visit. The duration of the visit equals the time interval between the first and last request in the visit. The length of the visit equals number of visited pages during the visit. The visitor is identified by the visitor node address. Consider again the example in Table 1: it contains two visits. The first is the visit by “squid.amazed.nl” of length three and duration of eleven minutes. The second one is the short visit of length one and duration zero performed by “cvp.mf.uni-lj.si.”
Data warehousing (DW) and online analytical processing (OLAP)
The computer systems that run the every day operations of an organization are usually called “online transaction systems,” and the mode of operation is usually referred to as “operational processing.” In the context of Website operation, each user request is a transaction and it is recorded in the Web server log file.
“Analytical systems” are systems that provide information for analyzing a domain or situation. Analytical processing is primarily done through comparisons or by analyzing patterns and trends. For example, an analytical system for Website usage analysis may show the access count by different domains. By comparing the values for several consecutive years, relevant trends may be discovered. The data used for analytical processing is usually organized in a data warehouse. According to Inmon [10], a data warehouse is a subject-oriented, integrated, nonvolatile, and time-variant collection of data in support of management's decisions. In other words, a data warehouse is used as a foundation of a decision-support system. In the case of Website management, decision support is needed for reorganization and restructuring.
One of the technologies most often used for analyzing the data stored in a data warehouse is OLAP. The term OLAP, coined by Codd [11], characterizes the requirements for summarizing, consolidating, viewing, applying formulae to, and synthesizing data according to multiple dimensions. OLAP systems provide an information structure that allows analysts to have very flexible access to data, to slice and dice data in any number of ways, and to dynamically explore the relationship between summary and detail data.
The data in an OLAP system are organized in a multidimensional data structure, usually called a “multidimensional data cube.” Dimensions that usually appear in the Web log analysis context are: time of access, Web server pages organized by the directory hierarchy, Web page content types, access method, and visitor node address. In the intersection of the dimensions lie the measures (or facts). Typical measures for Web log analysis are the bytes transferred and the access count.
Analysts may want to see only a subset of the data and select only values of interest. In OLAP terminology, these operations are called “pivoting” (rotating the multidimensional data cube to show a particular face) and “slicing-dicing” (selecting some subset of the cube) [12]. The multidimensional view also allows hierarchies associated with each dimension to be viewed in a logical manner. Aggregating the date dimension from day to month is expressed as a “roll-up” operation in a multidimensional database. The opposite of roll-up is “drill-down,” which displays detailed information for each aggregated point.
Steps in building our Web log analysis environment
We performed the following steps in the development of our DW and OLAP-based Web log file analysis environment: (1) data cleaning and preprocessing, (2) preaggregating, (3) defining the multidimensional data model and loading of the data into the OLAP server, and (4) developing the end-user analysis application.
In the cleaning and preprocessing step, basic operations on the Web server log file were performed to clean the data and prepare it for input into the OLAP server. These operations included: converting all the text information into lowercase to allow its unique identification, filtering out incomplete records, and adjusting the time and date format. Additionally, the type of the requested page (text, image, multimedia, etc.) was attached to each request.
The clustering of request records into visits was also performed in the preprocessing step. To achieve that, we sorted the Web server log file by the visitor node address and time of the requests, filtering out all the requests regarding content that was not hypertext markup language (HTML). Following the time of the requests issued by the same visitor node, we could easily cluster the requests into visits. An upper limit of thirty minutes for the time interval between two consecutive requests in a visit was used. The information on each visit was written in a new file with a structure very similar to the structure of the Web server log file using one line per visit.
At the end of the preprocessing step, two OLAP hierarchical dimensional tables were generated. One contained the visitor node domain hierarchy and the other the Web pages hierarchy. At first, we wanted to deal with the full visitor node domain hierarchy. But this turned out not to be feasible because of the very large number of hierarchical values. As a solution, we kept only the visitor nodes that had appeared most often. Furthermore, for visitor nodes addresses outside Slovenia, we replaced the node address with the top domain (.com, .net, .org, .gov, or country name). For Slovenian node addresses, we kept the full hierarchy (domain, subdomain, through visitor node address). All the preprocessing scripts were written in the AWK programming language.
In the preaggregation step, we loaded the preprocessed log files into a relational database management system and did some data preaggregation. In the third step, we defined the necessary dimensions and variables in the OLAP server. The OLAP server we used was Oracle Personal Express 6.2. Afterward, the previously prepared data was loaded into the OLAP server, and some additional variables were defined. Finally, we developed the end-user applications for data exploration and analysis using the Oracle Express Analyzer tool.
Figure 1 displays a screen shot of the end-user application, showing the request count of the CMK Website. The dimensions are listed in the upper part of the screen. The file type dimension is set to “html” and the action code to “200,” which means that we are only interested in normally processed HTML pages. The table under the dimension list shows the request count variable broken down by Web page and time dimensions. This table can be used for interactive data exploration. The Web page dimension shown in the first column is a hierarchical one and corresponds to the directory organization of the CMK Website. The numbers in the first row show the aggregated counts for the site as a whole. We can explore the next level of detail by clicking the plus sign to the left of a particular Web page (drill-down in the OLAP terminology). We can also drill-down on the time dimension (e.g., if we want to see the access counts at the month level of detail). We can view the data broken down by some other dimension by simply exchanging the dimensions' positions. For example, we can view the data by the reversed domain dimension by dragging that dimension over the Web page dimension. Selecting data to be viewed using various criteria is also possible.
Figure 1.

Online analytical processing (OLAP) view of the requests to the Central Medical Library (CMK) Website dimensioned by Web page (URL) and time
Problems with Web log analysis
Several problems make analyzing Web logs difficult. Web browsers usually cache recently visited Web pages on the client side to achieve better response time. Therefore, when the users click the back and forward browser buttons, those actions are not registered in the Web log, because browsers read copies of Web pages from local caches. Frequent use of the back and forward buttons could be a sign of bad Website design. However, we cannot infer whether users used these buttons often from the log files.
Many organizations also use proxy servers to fetch Web pages on behalf of their users. This is done primarily for security reasons but also for performance reasons, as the proxy servers maintain caches of the retrieved Web pages. When using proxy servers, all their users appear to Web servers as if they have the same visitor node. That makes attempts to analyze the sequence of Web pages users visit very difficult.
There are several problematic aspects to identifying individual visits in the stream of requests issued by the same visitor node. One of them is caused by the aforementioned problem of different visitors sharing the same visitor node address. Another problem is that we are interested in the reading time, in other words, time used by the visitor to read the page. We can only measure the time interval between two consecutive requests, which does not necessarily reflect the reading time but also includes time for network transfer, coffee breaks, and so on. Also, the reading time of the last requested Web page cannot be estimated, because there is no next request in the visit sequence.
RESULTS
Web log analysis revealed how often the Website was used, who was using it, where the users were from, and which pages and menus were the most popular. Some details about visit patterns and visitors' behavior were revealed as well.
Since the CMK Website was put in operation, its overall usage has been growing rapidly. The request count steadily increased between 1998 and 1999, with some monthly variation especially due to holidays. Users' requests rose by 48% in 1999, compared to 1998. The peak was reached in November 1999 with 13,365 requests (Figure 2).
Figure 2.

Request count of the CMK Website
Visitors were mainly interested in the Internet Resources submenu, followed by Information Resources and General Information submenus, which accounted for 37%, 15%, and 10% of requests, respectively. The English version of the Website received 8% of requests. We also identified Web pages that excited users' interests the most: Databases, Electronic Journals, and WWW Search Engines from the Internet Resources submenu followed by List of CMK Journals, Circulation Policy, and CMK Addresses from the Information Resources and General Information submenus.
Website navigation
Visits are considered entities devoted to solving users' information problems. Once users' visits are identified, statistics related to user behavior can be obtained. Visit characteristics include duration, number of pages visited, and Web pages from or into which users most frequently entered or exited the Website. The number of visits increased steadily over the observed period (Figure 3). The annual growth in 1999 totalled 45%. The average duration of a visit slightly decreased in 1999, but bytes transferred during the visits increased by 59%.
Figure 3.
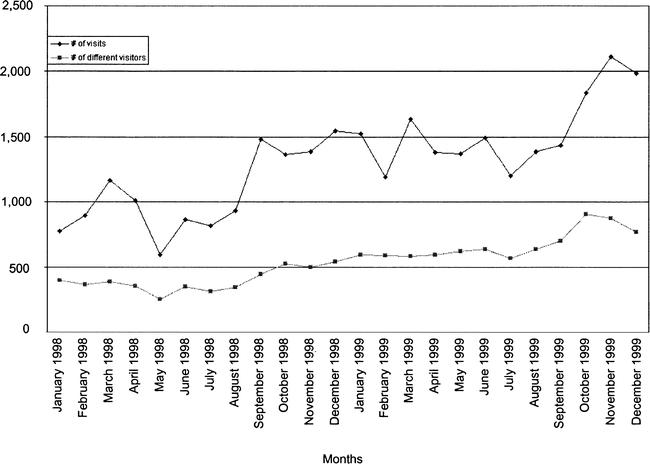
Number of visits and visitors of the CMK Website
The average visit lasted 5.14 minutes and accounted for 6.57 requests. Users most often (in 53% of cases) began their visits of the CMK Website on the CMK home page and, in that case, they spent 5.5 minutes and requested 7.5 Web pages on average. The next most frequent start page was Databases. Visits that started on Web pages in English usually lasted several times longer than average and requested more than ten pages. More than ten requests were often noticed in visits that began on Request Forms, pages in the General Information submenu as well as in the What's New submenu. The main menu Web page was most often used to terminate visits, followed by the Internet Resources submenu. Visits that terminated on English Web pages often lasted more than fifteen minutes, as did those terminating in the content pages of the submenus What's New, Services, and Request Forms.
Visitors' characteristics
Analysis showed the hosts from which most users came and some demographic characteristics of visitors (organization and country). The number of visitors in 1999 was 4,689, representing a 61% increase compared to 1998 (Figure 3). The average number of visits per visitor decreased by 11% in 1999. Request analysis by reversed domain revealed that the majority of the users were from Slovenia. Those from abroad were mostly from Croatia, the United States, and Germany. Users from the Faculty of Medicine issued 40% of all requests. Seventeen percent of visitors accessed the CMK Website over the Slovene Academic and Research Network (ARNES). The next most frequent organizations were research institutes, the government sector, pharmaceutical companies, and members of the University of Ljubljana.
Analysis of individual users revealed that beside CMK personnel, the most frequent visitors were the users of public computers in our library. Intensive use of the CMK Website by numerous Web robots was also noticed. Regular use by many researchers, especially from the Faculty of Medicine, was observed. Unfortunately, we were not able to discover the identity of many frequent users because of the problems with log file analysis already discussed.
DISCUSSION
Evaluations based upon Web server log file analysis offer the benefit of studying the overall usage of the CMK Website with some limitations. Log file analysis adequately reveals overall usage patterns but can only provide estimates of individual user characteristics because of well-known problems.
Despite these limitations, our analysis provided an initial understanding of users' navigational behavior. Several interesting implications for future Website development could be discerned. There were several possible explanations for the overall increased usage of the Website during the observed period. Contents of the Website doubled, patrons became more aware of its importance, and users' computer literacy, computer equipment, and Internet connections have improved significantly. Therefore, we were able to pay less attention to availability by slow modems and readability by old browsers, while starting to think about access by wireless devices.
Concrete data about visits revealed that the number of visitors and bytes transferred per visit increased more than the number of visits. On the other hand, average duration of visit and requests per visit slightly decreased, probably due to expanding the digital library with a wealth of external resources. Accesses to external servers were not registered in our log file. The analysis of referring Web pages that were available only for the last four months of the observed period showed that a growing number of visitors were referred to the CMK Website by search engines. Sometimes the users failed to find the information they sought or found it on the start page, and, by leaving it immediately, they made the duration of the visit zero.
Visitors most frequently started and ended their visits on the CMK home page. Reference pages with lists of print and electronic information resources were also significant starting and ending points in exploring the Website. It seems necessary to ensure greater visibility of these pages and a more convenient navigation path to them. On the other hand, the duration of visits that began with directional pages (Circulation Policy, General Information, and Request Forms) was longer, and these visitors made more requests than the average. It is reasonable to take some time for filling up requests. But a more detailed look at visits beginning with some directional pages indicates that users felt a bit lost in the system, because they needed much time and browsed many pages to get oriented. We observed a similar situation regarding visits beginning with some pages from the Information Resources submenu.
The Website designer was surprised that the most visited Web pages were dispersed among different submenus and subject categories. Therefore, the users probably found the whole Website to be of potential interest.
The percentage of overall usage where the country of origin could not be determined was surprisingly high (26%). From subdomain analysis, we can estimate that visitors of the CMK Website have very diverse interests, both professional and lay.
CONCLUSIONS
The analysis of Website usage behavior revealed groups of visitors having similar needs and interests. Concrete knowledge about the way that visitors navigate the Website will improve its design and content to increase efficiency and effectiveness.
Restructuring of some reference pages (e.g., Databases, Consumer Health, Education) that seem to be hidden from visitors but contain important information is needed to make this information more accessible to future visitors. We are planning a more intuitive design for some directional pages (e.g., Circulation Policy, Addresses), so that visitors will access information more quickly and easily with fewer clicks. We should pay more attention to regular maintenance and improvement of the whole Website to satisfy users' needs, because usage analysis reveals the relevance of nearly all the Web pages, even though some of them had not been anticipated to be of considerable interest.
We found DW and OLAP technologies suitable for Web log file analysis, because they gave us new analytical capabilities not present in the traditional Web log analysis tools. However, considerable effort and technical knowledge is needed to develop and establish such an analytical environment. In the future, we plan to develop more OLAP reports and some additional analytical measures.
Acknowledgments
The authors are grateful to Gaj Vidmar of the Institute of Biomedical Informatics and Stanka Jelenc of the Central Medical Library for reading the manuscript and improving its language and style.
Footnotes
* The Website of the Central Medical Library (CMK) may be viewed at http://www.mf.uni-lj.si/cmk/. The English versions of the CMK home page may be viewed at http://www.mf.uni-lj.si/cmk/english/. The information resources index page may be viewed at http://www.mf.uni-lj.si/cmk/english/info-res/. The list of journals page may be viewed at http://www.mf.uni-lj.si/cmk/english/info-res/journals.html.
Contributor Information
Anamarija Rozic-Hristovski, Email: anamarija.rozic-hristovski@mf.uni-lj.si.
Dimitar Hristovski, Email: dimitar.hristovski@mf.uni-lj.si.
Ljupco Todorovski, Email: ljupco.todorovski@ijs.si.
REFERENCES
- Clyde LA. The library as information provider: the home page. The Electronic Library. 1996 Dec; 14(6):549–58. [Google Scholar]
- Hightower C, Sih J, Tilghman A.. Recommendation for benchmarking Website usage among academic libraries. Coll Res Libr. 1998;59(1):61–79. [Google Scholar]
- Li X.. Library Web page usage: a statistical analysis. Bottom Line. 1999;12(4):153–9. [Google Scholar]
- Catledge LD, Pitkow JE.. Characterizing browsing strategies in the World-Wide Web. Computer Networks and ISDN Systems. 1995;27(6):1065–73. [Google Scholar]
- D'Alessandro MP, D'Alessandro DM, Galvin JR, and Erkonen WE. Evaluating overall usage of a digital health sciences library. Bull Med Libr Assoc. 1998 Oct; 86(4):602–9. [PMC free article] [PubMed] [Google Scholar]
- Rozic-Hristovski A, Todorovski L, and Hristovski D. Developing a medical library Website at the University of Ljubljana, Slovenia. Program. 1999 Oct; 33(4):313–25. [Google Scholar]
- Hristovski D, Rogac M, and Markota M. Using data warehousing and OLAP in public health care. Proc AMIA Symp 2000:369–73. [PMC free article] [PubMed] [Google Scholar]
- Dzeroski S, Hristovski D, and Peterlin B. Using data mining and OLAP to discover patterns in a database of patients with Y-chromosome deletions. Proc AMIA Symp. 2000:215–9. [PMC free article] [PubMed] [Google Scholar]
- Uppsala University . Access log analyzers. [Web document]. Uppsala, Sweden: The University. [cited 12 Jan 2001]. <http://www.uu.se/software/analyzers/access-analyzers.html>. [Google Scholar]
- Inmon WH. Building the data warehouse. 2d ed. New York, NY: John Wiley & Sons, 1996. [Google Scholar]
- Codd EF, Codd SB, and Salley CT. Providing OLAP (On-line Analytical Processing) to user-analysts: an IT mandate. San Jose, CA: Codd and Date, 1993. [Google Scholar]
- Agraval R. Modeling multidimensional databases [research report]. IBM Almaden Research Center, 1995. [Google Scholar]