

Abstract
Introduction
A recent randomized trial has suggested an increased risk of mortality for ceftriaxone-non-susceptible Enterobacterales infections treated with piperacillin/tazobactam compared with meropenem despite MICs within the susceptible range.
Methods
We conducted a retrospective cohort study of clinical encounters within the Cerner Health Facts database to identify all encounters between 2001 and 2017 in which Enterobacterales infections were treated empirically with piperacillin/tazobactam and for which MICs to the drug were available. Multivariate regression analysis was performed to enable partitioning of MICs into discrete strata based on statistically significant difference in mortality risk.
Results
During the study period, 10 101 inpatient encounters were identified meeting inclusion criteria. The crude in-hospital mortality for the entire cohort was 16.5%. Partitioning analysis identified a breakpoint of ≤16/4 mg/L that dichotomized encounters into lower versus higher mortality risk strata in the primary cohort of overall infections. This finding persisted in sequentially granular subsets where specific MICs ≤8/4 mg/L were reported (in lieu of ranges) as well as in the high-reliability subset with bloodstream infections. A higher clinical breakpoint of ≥128/4 mg/L dichotomized encounters with respiratory tract infection. No breakpoint was identified when restricting to encounters with urinary tract infections, ICU admits or upon restricting analysis to encounters with ceftriaxone-resistant isolates.
Conclusions
Clinical data suggest improved outcomes when piperacillin/tazobactam is prescribed for Enterobacterales infections with an MIC of ≤16/4 mg/L compared with ≥32/4 mg/L.
Introduction
The likelihood of therapeutic success in the treatment of a serious bacterial infection is at least partly contingent upon the efficacy of the antimicrobial agent chosen to treat the underlying pathogen. Antimicrobial susceptibilities are quantified by measurement of MICs, and MIC-based susceptibility breakpoints are intended to predict the likelihood of therapeutic success for a given bacterial taxon-antibacterial combination.1 These breakpoints are usually determined from a combination of in vitro data including MIC distributions of WT isolates, data derived from pharmacokinetic/pharmacodynamic Monte Carlo simulations, and clinical outcomes data.2 Unfortunately, although clinical outcomes data should arguably be considered the bedrock of clinical breakpoint determination, they are often missing or limited to small patient samples that do not offer the requisite statistical power.3 Consequently, breakpoints undergo periodic revision as more data become available, which can have implications for the available treatment options and the interpretation of trends in antibiotic resistance prevalence.4–6 Calibrating breakpoints using both in vitro and clinical data is critical to ensure reliable clinical response while avoiding excessive antibiotic exposures and consequent adverse events.
Piperacillin/tazobactam is a β-lactam/β-lactamase inhibitor with a relatively broad spectrum of activity and is often used as empirical and/or targeted therapy among hospitalized patients.7,8 However, in a recent randomized clinical trial, piperacillin/tazobactam did not meet non-inferiority criteria when compared with meropenem for the treatment of bloodstream infections (BSIs) caused by ceftriaxone-non-susceptible Escherichia coli and Klebsiella pneumoniae but susceptible to piperacillin/tazobactam by contemporaneous breakpoints.9 CLSI guidelines were revised in 2022 and are currently ≤8/4 mg/L as susceptible, 16/4 mg/L susceptible-dose-dependent, and ≥32/4 mg/L as resistant, marking a change from previous breakpoints (previously, MIC ≤16/4 mg/L as susceptible, 32/4 mg/L and 64/4 mg/L as intermediate, and ≥128/4 mg/L as resistant).10,11 In contrast, EUCAST has assigned a dichotomous susceptible cut-off for piperacillin/tazobactam against Enterobacterales at an MIC of ≤16/4 mg/L.12,13In vitro-discordant empirical antibiotic therapy in patients with Enterobacterales BSI is associated with lower survival.14 Hence, we hypothesized that the empirical use of piperacillin/tazobactam might evince different outcomes across patients with serious infections due to Enterobacterales isolates displaying different piperacillin/tazobactam MICs. In this study, we leveraged a large US database of hospitalized patients to study the relationship between piperacillin/tazobactam MIC breakpoints and clinical outcomes of Enterobacterales infections treated empirically with piperacillin/tazobactam.
Methods
Data source
We conducted a retrospective cohort study from 2001 to 2017 using the Cerner Health Facts database (North Kansas City, MO, USA). Cerner Health Facts database is a longitudinal and relational electronic health record database including inpatient encounters from Cerner client hospitals within the USA and includes demographics, diagnostic codes, procedure codes, laboratory results, medication order and administrations and vital signs, along with microbiology data, including MICs. It has been leveraged for other studies that associate microbiology, antibiotics and outcomes data, where additional details about this dataset are available.14,15 Given the deidentified nature of the data, the study was considered exempt from instructional ethics review by the revised common rule of the NIH.
Study population
Inpatient encounters that resulted positive for growth of select Enterobacterales isolates (Citrobacter spp., E. coli, Enterobacter spp., Klebsiella spp., Morganella spp., Pantoea spp., Proteus spp., Providencia spp. and Serratia spp.), in cultures from any site (blood, respiratory, urine, skin and soft tissue, and other), and with susceptibility data reported as an MIC (mg/L) that also received at least one dose of piperacillin/tazobactam within the empirical antibiotic window were identified. The empirical antibiotic window was set from 1 day prior to up to 2 days after the day of culture sampling (i.e. day −1 to day +2 if day 0 = culture sampling day). Encounters in which disc diffusion assays were used for susceptibility testing with results reported as zone diameters were excluded. For patients with multiple inpatient encounters or infection episodes, one episode per encounter and one encounter per patient was chosen at random. Patients receiving any other Gram-negative-active antibiotic in the empirical antibiotic window were excluded, as were encounters where growth of the Enterobacterales isolates was part of polymicrobial growth. Given the concerns over gradient diffusion strip testing,13 isolates and therefore encounters in whom MIC values were explicitly stated as having been determined using a gradient diffusion method available during the study period were also excluded from the analysis. Crude mortality was defined as in-hospital deaths or discharges to hospice.
MIC breakpoint models
Included encounters were analysed as four different breakpoint models based on MIC. Breakpoint model 1 was analysed using current CLSI breakpoints and divided into four different groups: ≤16/4 mg/L (susceptible), 32/4 mg/L (intermediate), 64/4 mg/L (intermediate) and ≥128/4 mg/L (resistant). To identify whether there might exist a reduction, or progressive reductions, in mortality risk at MIC levels below the susceptibility breakpoint MIC (≤16/4 mg/L), three additional breakpoint models with sequentially granular reporting of exact MICs (in lieu of ranges) were generated. Specifically, breakpoint model 2 isolated patients with an exact MIC reported as 16/4 mg/L to an individual group, thereby separating out the lower limit MIC group to be ≤8/4 mg/L. Breakpoint model 3 and breakpoint model 4 repeated the process, by identifying and isolating encounters in which the MICs were reported as exactly 8/4 mg/L and exactly 4/4 mg/L, respectively, thereby creating breakpoint models with lower limit MIC groups of ≤4/4 mg/L and ≤2/4 mg/L, respectively, and yielded the following MIC divisions: ≤ 4/4, 8/4, 16/4, 32/4, 64/4, 128/4 mg/L; and ≤2/4, 4/4, 8/4, 16/4, 32/4, 64/4, 128/4 mg/L. Table S1 (available as Supplementary data at JAC-AMR Online) lists the MIC groupings used for each breakpoint model. Susceptibility analyses were performed using individual subsets of patients categorized by site of infection and dichotomized by need for the ICU to evaluate whether there might be different clinically meaningful breakpoints by site or baseline illness severity. In addition, we conducted a susceptibility analysis in the population dichotomized by presence or absence of ceftriaxone susceptibility in encounters restricted to E. coli and K. pneumoniae (MIC ≤1 susceptible and MIC >1 non-susceptible). This enabled us to determine whether presence of the third-generation cephalosporin-resistant phenotype might substantiate a different susceptibility distribution for Enterobacterales treated with piperacillin/tazobactam in the real-world setting.
Statistical analysis
Two separate analyses were conducted. The first was a univariate classification and regression tree analysis with a single primary explanatory variable of MIC group and the outcome of crude mortality, defined as in-hospital death (including discharge to hospice). This analysis was conducted using a partition platform provided in John's Macintosh Project (JMP) (v16). This methodology of associating MIC and outcome has been described previously.16 However, this methodology does not adjust for other confounders of mortality risk, and when using multihospital data does not adjust for clustering at the level of hospital. To overcome these limitations, we conducted a second analysis where multivariable logistic regression was recursively applied to partition data according to a relationship between MIC levels and crude mortality to assess for statistical significance. Each model included dichotomized MIC grouping as the primary explanatory variable and was adjusted for the clinically relevant variables such as age, gender, race, Elixhauser comorbidity index, admission SOFA score, culture site and hospital characteristics such as teaching status, bed size, urban/rural classification and census region. The best breakpoint is selected by the smallest P value <0.05. The same steps are repeated in each child node until there is no available dichotomous partition or no P value is <0.05. The full model was used at each node. All the multivariable logistic models were fit using the generalized estimating equations in SAS 9.4 PROC GENMOD to account for clustering of patients from the same hospital.
Results
Encounter characteristics
Between 2001 and 2017 we identified 367 395 inpatient encounters with positive cultures containing Enterobacterales at any site, 42 093 of which received piperacillin/tazobactam in the treatment window (Figure 1). Limiting to unique inpatients with cultures growing a single Enterobacterales isolate with classifiable susceptibility testing reported as MICs, who received piperacillin/tazobactam in the empirical antibiotic window and had all variables available to analyse resulted in 10 101 patients at 161 hospitals. Of these, 9401 (93.1%) patients had an isolate with an MIC ≤16/4 mg/L, 100 (1.0%) with an MIC of 32/4 mg/L, 211 (2.1%) with an MIC of 64/4 mg/L, and 389 (3.9%) with an MIC of ≥128/4 mg/L.
Figure 1.
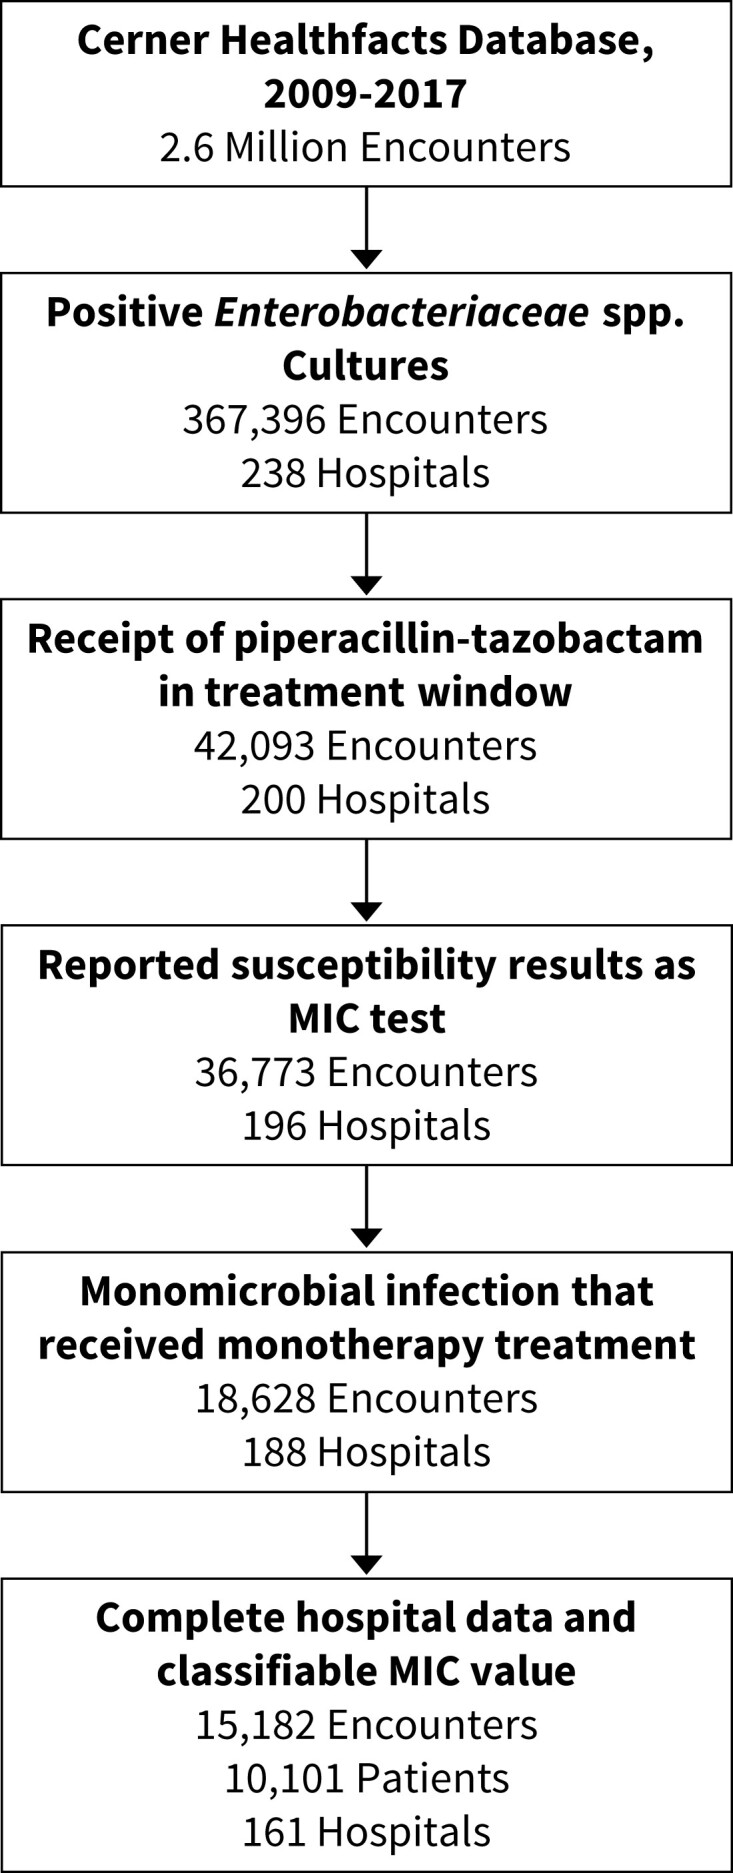
Episode generation flowsheet. Inpatient encounters with complete data and monomicrobial growth of Enterobacterales organisms with interpretable MIC data that received empirical piperacillin/tazobactam were evaluated.
The entire cohort had a median age of 68 years, was predominantly Caucasian (70.1%) and a majority were women (55.5%) (Table 1). E. coli was the most common organism followed by Klebsiella spp., at 55.3% and 21.6%, respectively, and Pantoea spp. was the lowest contributor at 0.3% of all isolates. The most common site of infection was urinary at 57.0% (5750 encounters) followed by blood at 18.0% (1823 encounters). Distributions of the total days of piperacillin/tazobactam therapy are shown in Figure S1a, whereas frequency and distribution of concomitant Gram-negative antibiotics are shown in Figure S1b and c. The median (IQR) SOFA score was 1 (0–2) whereas the median Elixhauser score was 1 (0–4). Encounters were more commonly from teaching hospitals (68.2%), in the South (41.5%) and were evenly distributed across bed capacity ranges. Hospital characteristics are shown in Table S2.
Table 1.
Baseline characteristics for all encounters by CLSI-established piperacillin/tazobactam MIC susceptibility breakpoints
| All encounters | MIC ≤ 16/4 | MIC ≥ 32/4 | MIC ≥ 64/4 | MIC ≥ 128/4 | |
|---|---|---|---|---|---|
| N = 10 101 | N = 9401 | N = 100 | N = 211 | N = 389 | |
| Age in years: median [IQR] | 68 [55, 80] | 68 [55, 80] | 64.50 [51.75, 77.25] | 69 [55, 78.50] | 67 [54, 77] |
| Gender | |||||
| Female | 5608 (55.5) | 5260 (56.0) | 54 (54.0) | 118 (55.9) | 176 (45.2) |
| Male | 4493 (44.5) | 4141 (44.0) | 46 (46.0) | 93 (44.1) | 213 (54.8) |
| Race | |||||
| African American | 1962 (19.4) | 1798 (19.1) | 31 (31.0) | 37 (17.5) | 96 (24.7) |
| Caucasian | 7077 (70.1) | 6624 (70.5) | 57 (57.0) | 151 (71.6) | 245 (63.0) |
| Other | 1062 (10.5) | 979 (10.4) | 12 (12.0) | 23 (10.9) | 48 (12.3) |
| SOFA score: median [IQR] | 1 [0, 2] | 1 [0, 2] | 1 [0, 2] | 1 [0, 2] | 1 [0, 2] |
| ICU admissiona | 2299 (22.8) | 2143 (22.8) | 21 (21.0) | 46 (21.8) | 89 (22.9) |
| Elixhauser score:b median [IQR] | 1 [0, 4] | 1 [0, 4] | 0 [0, 3] | 2 [0, 5] | 1 [0, 5] |
| Comorbid conditionsc | |||||
| Diabetes | 1324 (13.1) | 1222 (13.0) | 11 (11.0) | 36 (17.1) | 55 (14.1) |
| Hypertension | 3078 (30.5) | 2859 (30.4) | 22 (22.0) | 72 (34.1) | 125 (32.1) |
| Congestive heart failure | 1243 (12.3) | 1140 (12.1) | 11 (11.0) | 40 (19.0) | 52 (13.4) |
| Chronic kidney disease | 57 (0.6) | 54 (0.6) | 0 (0.0) | 1 (0.5) | 2 (0.5) |
| Solid tumour | 1141 (11.3) | 1051 (11.2) | 16 (16.0) | 27 (12.8) | 47 (12.1) |
| Lymphoma | 60 (0.6) | 56 (0.6) | 0 (0.0) | 0 (0.0) | 4 (1.0) |
| Liver disease | 522 (5.2) | 485 (5.2) | 5 (5.0) | 10 (4.7) | 22 (5.7) |
| Infection site | |||||
| Blood | 1823 (18.0) | 1715 (18.2) | 25 (25.0) | 35 (16.6) | 48 (12.3) |
| Gastrointestinal | 562 (5.6) | 526 (5.6) | 4 (4.0) | 9 (4.3) | 23 (5.9) |
| Other | 246 (2.4) | 234 (2.5) | 2 (2.0) | 2 (0.9) | 8 (2.1) |
| Respiratory | 1010 (10.0) | 865 (9.2) | 19 (19.0) | 33 (15.6) | 93 (23.9) |
| Skin soft tissue | 710 (7.0) | 668 (7.1) | 2 (2.0) | 15 (7.1) | 25 (6.4) |
| Urinary | 5750 (56.9) | 5393 (57.4) | 48 (48.0) | 117 (55.5) | 192 (49.4) |
| Organism | |||||
| Citrobacter spp. | 238 (2.4) | 217 (2.3) | 7 (7.0) | 9 (4.3) | 5 (1.3) |
| E. coli | 5587 (55.3) | 5274 (56.1) | 29 (29.0) | 130 (61.6) | 154 (39.6) |
| Enterobacter spp. | 720 (7.1) | 574 (6.1) | 19 (19.0) | 36 (17.1) | 91 (23.4) |
| Klebsiella spp. | 2178 (21.6) | 2001 (21.3) | 37 (37.0) | 21 (10.0) | 119 (30.6) |
| Morganella spp. | 142 (1.4) | 135 (1.4) | 2 (2.0) | 2 (0.9) | 3 (0.8) |
| Pantoea spp. | 29 (0.3) | 28 (0.3) | 0 (0.0) | 1 (0.5) | 0 (0.0) |
| Proteus spp. | 917 (9.1) | 913 (9.7) | 2 (2.0) | 2 (0.9) | 0 (0.0) |
| Providencia spp. | 112 (1.1) | 106 (1.1) | 1 (1.0) | 2 (0.9) | 3 (0.8) |
| Serratia spp. | 178 (1.8) | 153 (1.6) | 3 (3.0) | 8 (3.8) | 14 (3.6) |
Data shown are n (%) unless otherwise noted.
ICU at the time of culturing.
Elixhauser calculated using admission codes.
Calculated on admission; see Table S15 for ICD codes.
Overall breakpoint and mortality analysis
The crude mortality for the overall cohort was 16.5%. The crude mortality for encounters with an MIC of ≤16/4 mg/L, 32/4 mg/L, 64/4 mg/L and ≥128/4 mg/L are shown in Figure S2. The lowest adjusted mortality was in the group with an MIC of ≤16/4 at 15.9%, and was highest in those with an MIC of ≥128/4 mg/L at 22.2% (Table S1). When evaluating all sites together, partitioning analysis identified a breakpoint associated with the largest increase in risk-adjusted mortality between MIC ≤16/4 mg/L and ≥32/4 mg/L (Figure 2a). The association between >16/4 mg/L MIC breakpoint and mortality risk was consistently identified across all four breakpoint models and no breakpoints were identified between ≤8/4 mg/L and ≥16/4 mg/L in any model (Figures 2a and S3a–c). Characteristics of encounters dichotomized according to the CLSI susceptibility breakpoint of 16/4 mg/L and between survivors and non-survivors are compared in Tables 2 and 3, respectively. In a susceptibility analysis of patients who received ≥3 days of piperacillin/tazobactam (n = 6497), we found that the breakpoint associated with highest mortality was ≥128 mg/L.
Figure 2.

Results of the classification and regression tree analysis for the overall cohort (all sites), bloodstream isolates, lower respiratory tract isolates, and urinary tract isolates. Partitioning analysis evaluating for breakpoints associated with increased mortality for (a) all sites, (b) bloodstream, (c) lower respiratory and (d) urinary tract. Crude mortality and number of encounters per node (N) are shown as well as the P value for the partition comparison. P values displayed in this figure are generated from the multivariable logistic regression models.
Table 2.
Univariate comparison between encounters with Enterobacterales MIC ≤16/4 mg/L and MIC ≥32/4 mg/L for piperacillin/tazobactam
| Piperacillin/tazobactam MIC ≤16/4 mg/L (n = 9401) | Piperacillin/tazobactam MIC ≥32/4 mg/L (n = 700) | |
|---|---|---|
| Age in years: median [IQR] | 68 [55, 80] | 67 [54, 78] |
| Gender | ||
| Female | 5260 (56.0) | 348 (49.7) |
| Male | 4141 (44.0) | 352 (50.3) |
| Race | ||
| African American | 1798 (19.1) | 164 (23.4) |
| Caucasian | 6624 (70.5) | 453 (64.7) |
| Other | 979 (10.4) | 83 (11.9) |
| SOFA score: median [IQR] | 1 [0, 2] | 1 [0, 2] |
| ICU admissiona | 2143 (22.8) | 156 (22.3) |
| Elixhauser score:b median [IQR] | 1 [0, 4] | 0 [0, 5] |
| Comorbid conditionsc | ||
| Diabetes | 1222 (13.0) | 102 (14.6) |
| Hypertension | 2859 (30.4) | 219 (31.3) |
| Congestive heart failure | 1140 (12.1) | 103 (14.7) |
| Solid tumour | 54 (0.6) | 3 (0.4) |
| Lymphoma | 1051 (11.2) | 90 (12.9) |
| Liver disease | 56 (0.6) | 4 (0.6) |
| Infection site | ||
| Blood | 1715 (18.2) | 108 (15.4) |
| Gastrointestinal | 526 (5.6) | 36 (5.1) |
| Other | 234 (2.5) | 12 (1.7) |
| Respiratory | 865 (9.2) | 145 (20.7) |
| Skin soft tissue | 668 (7.1) | 42 (6.0) |
| Urinary | 5393 (57.4) | 357 (51.0) |
| Organism | ||
| Citrobacter spp. | 217 (2.3) | 21 (3.0) |
| E. coli | 5274 (56.1) | 313 (44.7) |
| Enterobacter spp. | 574 (6.1) | 146 (20.9) |
| Klebsiella spp. | 2001 (21.3) | 177 (25.3) |
| Morganella spp. | 135 (1.4) | 7 (1.0) |
| Pantoea spp. | 28 (0.3) | 1 (0.1) |
| Proteus spp. | 913 (9.7) | 4 (0.6) |
| Providencia spp. | 106 (1.1) | 6 (0.9) |
| Serratia spp. | 153 (1.6) | 25 (3.6) |
Data shown are n (%) unless otherwise noted.
ICU at the time of culturing.
Elixhauser calculated using admission codes.
Calculated on admission; see Table S15 for ICD codes.
Table 3.
Univariate comparison between survivors and non-survivors for all encounters
| Survivor (n = 8438) | Non-survivor (n = 1663) | |
|---|---|---|
| Age in years: median [IQR] | 67 [53, 79] | 74 [62, 84] |
| Gender | ||
| Female | 4718 (55.9) | 890 (53.5) |
| Male | 3720 (44.1) | 773 (46.5) |
| Race | ||
| African American | 1648 (19.5) | 314 (18.9) |
| Caucasian | 5939 (70.4) | 1138 (68.4) |
| Other | 851 (10.1) | 211 (12.7) |
| SOFA score:a median [IQR] | 0 [0, 2] | 1 [0, 3] |
| ICU admissionb | 1605 (19.0) | 694 (41.7) |
| Elixhauser score: median [IQR] | 1 [0, 4] | 1 [0, 5] |
| Comorbid conditionsc | ||
| Diabetes | 1115 (13.2) | 209 (12.6) |
| Hypertension | 2605 (30.9) | 473 (28.4) |
| Congestive heart failure | 970 (11.5) | 273 (16.4) |
| Solid tumour | 816 (9.7) | 325 (19.5) |
| Lymphoma | 47 (0.6) | 13 (0.8) |
| Liver disease | 366 (4.3) | 156 (9.4) |
| Infection site | ||
| Blood | 1456 (17.3) | 367 (22.1) |
| Gastrointestinal | 518 (6.1) | 44 (2.6) |
| Other | 218 (2.6) | 28 (1.7) |
| Respiratory | 731 (8.7) | 279 (16.8) |
| Skin soft tissue | 673 (8.0) | 37 (2.2) |
| Urinary | 4842 (57.4) | 908 (54.6) |
| Organism | ||
| Citrobacter spp. | 194 (2.3) | 44 (2.6) |
| E. coli | 4726 (56.0) | 861 (51.8) |
| Enterobacter spp. | 597 (7.1) | 123 (7.4) |
| Klebsiella spp. | 1761 (20.9) | 417 (25.1) |
| Morganella spp. | 118 (1.4) | 24 (1.4) |
| Pantoea spp. | 24 (0.3) | 5 (0.3) |
| Proteus spp. | 782 (9.3) | 135 (8.1) |
| Providencia spp. | 90 (1.1) | 22 (1.3) |
| Serratia spp. | 146 (1.7) | 32 (1.9) |
Data shown are n (%) unless otherwise noted.
ICU at the time of culturing.
Elixhauser calculated using admission codes.
Calculated on admission; see Table S15 for ICD codes.
Breakpoint and mortality analysis by site
Demographics for patients in each culture site category along with crude and adjusted mortality are presented in Tables S3 and S4, respectively. Partitioning analysis to identify a breakpoint associated with increased mortality for BSI displayed results consistent with the primary analysis, with increased mortality risk at >16/4 (versus at ≤16/4) mg/L (Figures 2b and S3). Patients with lower respiratory tract pathogens that displayed an MIC of ≤16/4 mg/L had a crude mortality of 19.6% whereas those with an MIC ≥128/4 mg/L had a crude mortality of 31.2% (Figure S2). However, the multivariable model (that included adjustment for mechanical ventilation at infection detection) performed on those with lower respiratory tract infections identified a higher breakpoint of ≥128/4 (versus ≤64/4) mg/L associated with increased mortality risk (Figure 2c and Table S4). Infections of the urinary tract displayed no specific MIC associated with higher mortality risk (Figure 2d and Table S4).
ICU versus non-ICU
ICU patients were similar to non-ICU patients across age, gender and race, but as expected, displayed higher median SOFA and Elixhauser comorbidity scores (Table S5). Across sites, ICU patients were more likely to have respiratory infections (22.4% versus 6.4%) than non-ICU patients and had higher rates of infection with a Klebsiella sp. (25.8% in ICU versus 20.2% in non-ICU). Unadjusted crude mortality was 30.2% (694/2299) in the ICU cohort compared with 12.4% (969/7802) in the non-ICU cohort. Partitioning analysis of the non-ICU population identified an MIC breakpoint between ≤16/4 mg/L and ≥32/4 mg/L consistent with the overall cohort, whereas no breakpoint was found in the ICU population at which mortality rates increased (Figure S4a and b and Tables S6 and S7 for ICU and non-ICU populations, respectively).
Ceftriaxone-susceptible versus -resistant
In the model utilizing patient encounters with isolates that were ceftriaxone-susceptible (n = 5114 encounters) across all sites, an initial breakpoint associated with increased mortality was found between 32/4 mg/L and 64/4 mg/L only (Figure S4c and d and Table S8). However, when evaluating just BSIs (n = 1823 patients), an MIC breakpoint of ≤16/4 mg/L and ≥32/4 mg/L was identified (Figure S4e and Table S9). Subsequent analysis of ceftriaxone-resistant isolates (n = 2168 encounters) did not find any consistently identifiable breakpoint associated with increased mortality, but analysis with bloodstream-only isolates was limited by sample size (n = 326 patients) (Tables S10 and S11).
By organism analysis (E. coli and Klebsiella spp.)
Across 5587 E. coli isolates the breakpoint associated with the greatest increase in mortality was between ≤32/4 mg/L and ≥64/4 mg/L (P = 0.0024), although the second strongest cut-off (≤16/4 mg/L versus ≥32 mg/L) was statistically very similar (P = 0.0025) (Table S12). Among Klebsiella spp. (n = 2178) the breakpoint was ≤16/4 mg/L and ≥32/4 mg/L but this was not statistically significant (Table S13). Lastly, among all other Enterobacterales (n = 2336) the breakpoint associated with mortality was like the overall cohort, ≤16/4 mg/L and ≥32/4 mg/L (P = 0.0054) (Table S14).
Discussion
Electronic health record data from the routine care of patients in the real world offered an opportunity for a natural experiment in which we retrospectively evaluated the outcomes of piperacillin/tazobactam empirical therapy for Enterobacterales infections displaying different piperacillin/tazobactam MICs, both above and below current breakpoints. Specifically, we report a risk-adjusted model of 10 101 patients with Enterobacterales infections empirically treated with piperacillin/tazobactam and found that an MIC of ≥32/4 mg/L is associated with increased mortality. This finding was substantiated in a sub-analysis of bacteraemic patients representing a population with unequivocal evidence of infection.
IDSA guidance has discouraged the use of piperacillin/tazobactam in non-cystitis infections due to Enterobacterales displaying third-generation cephalosporin resistance.17 In our study, an MIC ≥32/4 mg/L was found to be poorly prognostic in both cohorts of patients with all infection types and when restricted to BSIs due to isolates that are ceftriaxone susceptible. When restricted to ceftriaxone-resistant isolates, a piperacillin/tazobactam MIC that separated encounters into lower and higher mortality risks could not be identified, supporting the potential independence of the mortality risk from piperacillin/tazobactam susceptibility in third-generation cephalosporin-resistant isolates. This offers robustness to the primary finding by eliminating potential confounding of mortality risk associated with using piperacillin/tazobactam to treat patients with isolates displaying third-generation cephalosporin resistance. These results should be interpreted with caution, however, as the study design captured empirical piperacillin/tazobactam use and not targeted treatment, and as a result many patients may have had their therapy switched to another agent such as a carbapenem once the third-generation cephalosporin resistance was identified. Consequently, our results suggesting the independence of outcome for these infections treated with piperacillin/tazobactam should be considered only hypothesis generating.
Upon sequentially stratifying the CLSI- and EUCAST-designated ‘susceptible’ range by MIC (breakpoint models 2–4), the >2/4 (versus ≤2/4) mg/L, >4/4 (versus ≤4/4) mg/L or >8/4 (versus ≤8/4) mg/L breakpoints were not associated with increased mortality risk. This finding is consistent with a prospective observational cohort study from 13 universities in Spain, which also found no difference in 30 day crude mortality when evaluating patients treated for bacteraemia caused by Enterobacterales with piperacillin MICs that were low (≤4/4 mg/L) versus borderline (8/4−6/4 mg/L).18 Taken together, the evidence suggests that the breakpoint of 16/4 mg/L by EUCAST is likely appropriate and clinically reliable. It should be noted that the CLSI recently changed the MIC breakpoints to ≤8/4 mg/L as susceptible, primarily based on concerns about precision with MIC testing and pharmacokinetics/pharmacodynamic data suggesting high doses needed to obtain drug concentration goals.11 Clinical data supportive of this change were lacking and importantly our study did not find any significant breakpoint between ≤8/4 mg/L and ≥16/4 mg/L to support this decision.
The results of susceptibility analyses were generally consistent with the primary findings, with a few exceptions that warrant discussion. Notably, in an analysis of patients who received ≥3 days of piperacillin/tazobactam, an MIC of ≥128 mg/L was associated with increased mortality, potentially due to prolonged therapy in a group of patients who were resistant to the antibiotic being used for therapy. Additionally, whereas a poor prognostic signal at >16 mg/L was observed among non-critically ill patients, no breakpoint for mortality risk was observed for critically ill patients. Similarly, among patients with respiratory tract infections needing mechanical ventilation, higher mortality risk associated with piperacillin/tazobactam therapy was only observed at an MIC of >128/4 mg/L. One explanation for these findings might be that there are additional competing risks for mortality in severely ill patients. These competing risks include patients presenting with sepsis or septic shock, and a greater tendency towards frailty and more profound underlying illness burden (not gleanable using dichotomous selections in the Elixhauser comorbidity index) among those needing the ICU, or the independent detrimental effects of associated sepsis and septic shock needing ICU admission or the direct harmful effects of mechanical ventilation such as ventilator-induced lung injury. All of these might independently worsen the outcome even of patients with isolates displaying susceptible-range MICs. On the other hand, the lower distribution of mortality and the absence of an observable outcome difference across the spectrum of MICs of urinary isolates, respectively, might be a function of a better outcome (relative to other serious infections) with or without treatment with a highly active agent and a possibly large proportion of isolates representing urinary colonization. This is also in line with previously reported data showing no correlation between piperacillin/tazobactam MIC and outcomes for patients with bacteraemic urinary tract infections (which tend to display a lower mortality distribution than BSI/sepsis from non-urinary sources) with third-generation cephalosporin-resistant isolates.19 Lastly, current CLSI guidelines treat all Enterobacterales equivalently; however, we observed differences in MIC breakpoints associated with mortality risk by species of Enterobacterales. Additional studies are warranted to validate this hypothesis generated in our study.
Although we have a robust sample size in this analysis, there are some limitations. First, we were unable to distinguish clinically between patients who were colonized and received piperacillin/tazobactam and those who had true infection. However, consistency of findings in the bacteraemic groups mitigates this concern. Second, we did not account for drug dosing, which can have a significant impact on outcomes relative to the MIC and could have unveiled potential selective dose-dependent breakpoints and the probability that a β-lactam antibiotic reaches its optimal time above MIC. However, we assumed that in most cases patients would have been treated using recommended doses and dose adjustments in the real world.20 Third, we were unable to account for the biological mechanisms contributing to third-generation cephalosporin resistance and therefore cannot comment on the contribution of specific β-lactamase types to the results (e.g. CTX-M). However, we have provided a susceptibility analysis using ceftriaxone resistance to enrich for ESBL as suggested by CLSI,10 which allows for a generalizable finding. Fourth, during the study period, FDA and EUCAST issued a product warning for piperacillin/tazobactam gradient diffusion strips as a result of mounting evidence of their use leading to categorical errors in MICs, followed by subsequent removal from the market of several commercial products.21 For this reason, encounters where results were explicitly reported as originating from gradient diffusion strips were excluded. However, many centres rely on these tests for MIC determination and may not explicitly state their use and as such, our results likely still contain encounters where MICs were determined by gradient diffusion testing and therefore may have impacted our findings. Similarly, discordant results between some automated antimicrobial susceptibility testing platforms and reference broth microdilution testing methods have been reported.22,23 As a result, within the Cerner dataset where automated platforms were likely commonly used, there is a chance that there was some misclassification of MICs compared with reference methods, which could have biased our results to an unknown degree. Fifth, given the analysis is based on retrospective cohort data captured from the electronic medical records, we were unable to assess the exact quality control methods employed by laboratories. However, given that all the Clinical Laboratory Improvement Amendments (CLIA)-licensed clinical laboratories in the USA must undergo formal certification and regular proficiency testing, it is expected that susceptibility testing quality control metrics should fall within certification limits for most laboratories. Sixth, our study is observational and utilized a variety of variables built on administrative data, and as such, residual confounding might still exist. Seventh, we were unable to control for targeted therapy received and had to assume treatment following susceptibility testing was appropriately selected by clinical providers. Lastly, this study was performed prior to the most recent changes in CLSI breakpoints. However, although these changes would affect the treatment of patients with piperacillin/tazobactam MICs of 16/4 mg/L, it should not alter the correlation between MIC and outcomes, nor the interpretation of our results.
In conclusion, in this large dataset of clinical outcomes of Enterobacterales infections treated with piperacillin/tazobactam, we identified ≤16/4 mg/L as a breakpoint associated with a decrease in mortality compared with ≥32/4 mg/L. Our study offers further clinical validation of MIC breakpoints, which are often data that are unavailable when deliberating specific MIC values.
Supplementary Material
Acknowledgements
This work was done as part of the National Institute of Health Antimicrobial Resistance Outcomes Research Initiative (NIH-ARORI). We thank John Farley (Director) and Thushi Amini (Associate Director for Research) from the Office of Antimicrobial Products within the Center for Drug Evaluation and Research at the US Food and Drug Administration for project funding, and David Fram and Huai-Chen Chun of Commonwealth Informatics for their assistance in data curation and mapping.
Contributor Information
Jeffrey R Strich, Critical Care Medicine Department, Clinical Center, National Institutes of Health, 10 Center Drive B10, 2C145, Bethesda, MD 20892, USA.
Alexander Lawandi, Critical Care Medicine Department, Clinical Center, National Institutes of Health, 10 Center Drive B10, 2C145, Bethesda, MD 20892, USA.
Sarah Warner, Critical Care Medicine Department, Clinical Center, National Institutes of Health, 10 Center Drive B10, 2C145, Bethesda, MD 20892, USA.
Cumhur Y Demirkale, Critical Care Medicine Department, Clinical Center, National Institutes of Health, 10 Center Drive B10, 2C145, Bethesda, MD 20892, USA.
Sadia Sarzynski, Critical Care Medicine Department, Clinical Center, National Institutes of Health, 10 Center Drive B10, 2C145, Bethesda, MD 20892, USA.
Ahmed Babiker, Department of Pathology and Laboratory Medicine, Emory University School of Medicine, Atlanta, GA, USA.
John P Dekker, Bacterial Pathogenesis and Antimicrobial Resistance Unit, Laboratory of Clinical Immunology and Microbiology, National Institute of Allergy and Infectious Diseases, Bethesda, MD, USA.
Sameer S Kadri, Critical Care Medicine Department, Clinical Center, National Institutes of Health, 10 Center Drive B10, 2C145, Bethesda, MD 20892, USA.
NIH–ARORI group members
Only a portion of members from the ARORI group participated in this study, thus those that were not involved are not part of the co-authors list and are not acknowledged here.
Funding
The study was funded in part by the Center for Drug Evaluation and Research of the US Food and Drug Administration and the Intramural Research Program of the National Institutes of Health Clinical Center and the National Institute of Allergy and Infectious Diseases.
Transparency declarations
The authors have no conflicts to disclose.
Disclaimer
The opinions expressed in this article are those of the authors and do not represent any position or policy of the National Institutes of Health, the US Department of Health and Human Services, or the US government.
Supplementary data
Figures S1 to S2 and Tables S1 to S15 are available as Supplementary data at JAC-AMR Online.
References
- 1. Khan ZA, Siddiqui MF, Park S. Current and emerging methods of antibiotic susceptibility testing. Diagnostics (Basel) 2019; 9: 49. [DOI] [PMC free article] [PubMed] [Google Scholar]
- 2. Turnidge J, Paterson DL. Setting and revising antibacterial susceptibility breakpoints. Clin Microbiol Rev 2007; 20: 391–408. 10.1128/CMR.00047-06 [DOI] [PMC free article] [PubMed] [Google Scholar]
- 3. Humphries RM, Abbott AN, Hindler JA. Understanding and addressing CLSI breakpoint revisions: a primer for clinical laboratories. J Clin Microbiol 2019; 57:e00203-19. 10.1128/JCM.00203-19 [DOI] [PMC free article] [PubMed] [Google Scholar]
- 4. Foong KS, Carlson AL, Munigala Set al. Clinical impact of revised cefepime breakpoint in patients with Enterobacteriaceae bacteremia. Open Forum Infect Dis 2019; 6: ofz341. 10.1093/ofid/ofz341 [DOI] [PMC free article] [PubMed] [Google Scholar]
- 5. Hombach M, Bloemberg GV, Bottger EC. Effects of clinical breakpoint changes in CLSI guidelines 2010/2011 and EUCAST guidelines 2011 on antibiotic susceptibility test reporting of gram-negative bacilli. J Antimicrob Chemother 2012; 67: 622–32. 10.1093/jac/dkr524 [DOI] [PubMed] [Google Scholar]
- 6. Park GE, Ko JH, Cho SYet al. Clinical impact of revised ciprofloxacin breakpoint in patients with urinary tract infections by Enterobacteriaceae. Antibiotics (Basel) 2021; 10: 469. [DOI] [PMC free article] [PubMed] [Google Scholar]
- 7. Rhee C, Kadri SS, Dekker JPet al. Prevalence of antibiotic-resistant pathogens in culture-proven sepsis and outcomes associated with inadequate and broad-spectrum empiric antibiotic use. JAMA Netw Open 2020; 3: e202899. 10.1001/jamanetworkopen.2020.2899 [DOI] [PMC free article] [PubMed] [Google Scholar]
- 8. Cunha BA. Sepsis and septic shock: selection of empiric antimicrobial therapy. Crit Care Clin 2008; 24: 313–34. ix. 10.1016/j.ccc.2007.12.015 [DOI] [PubMed] [Google Scholar]
- 9. Harris PNA, Tambyah PA, Lye DCet al. Effect of piperacillin-tazobactam vs meropenem on 30-day mortality for patients with E. coli or Klebsiella pneumoniae bloodstream infection and ceftriaxone resistance: a randomized clinical trial. JAMA 2018; 320: 984–94. 10.1001/jama.2018.12163 [DOI] [PMC free article] [PubMed] [Google Scholar]
- 10. CLSI . Performance Standards for Antimicrobial Susceptibility Testing— Thirtieth Edition:2018. M100. [Google Scholar]
- 11. Tamma PD, Harris PNA, Mathers AJet al. Breaking down the breakpoints: rationale for the 2022 Clinical and Laboratory Standards Institute revised piperacillin-tazobactam breakpoints against Enterobacterales. Clin Infect Dis 2022. 10.1093/cid/ciac688. https://academic.oup.com/cid/advance-articleabstract/doi/10.1093/cid/ciac688/6674674?redirectedFrom=fulltext&login=false [DOI] [PubMed] [Google Scholar]
- 12. The European Committee on Antimicrobial Susceptibility Testing . Breakpoint tables for interpretation of MICs and zone diameters. Version 11.0 hweo. EUCAST ( European Committee on Antimicrobial Susceptibility Testing) Version 13.0, valid from 2023-01-01
- 13. Henderson A, Humphries R. Building a better test for piperacillin-tazobactam susceptibility testing: would that it were so simple (it's complicated). J Clin Microbiol 2020; 58: e01649-19. 10.1128/JCM.01649-19 [DOI] [PMC free article] [PubMed] [Google Scholar]
- 14. Kadri SS, Lai YL, Warner Set al. Inappropriate empirical antibiotic therapy for bloodstream infections based on discordant in-vitro susceptibilities: a retrospective cohort analysis of prevalence, predictors, and mortality risk in US hospitals. Lancet Infect Dis 2021; 21: 241–51. 10.1016/S1473-3099(20)30477-1 [DOI] [PMC free article] [PubMed] [Google Scholar]
- 15. Sarzynski SH, Warner S, Sun Jet al. Trimethoprim-sulfamethoxazole versus levofloxacin for Stenotrophomonas maltophilia infections: a retrospective comparative effectiveness study of electronic health records from 154 US hospitals. Open Forum Infect Dis 2022; 9: ofab644. 10.1093/ofid/ofab644 [DOI] [PMC free article] [PubMed] [Google Scholar]
- 16. Sall J. Monte Carlo calibration of distributions of partition statistics. 2002. https://www.jmp.com/content/dam/jmp/documents/en/white-papers/montecarlocal.pdf
- 17. Tamma PD, Aitken SL, Bonomo RAet al. Infectious Diseases Society of America guidance on the treatment of extended-spectrum β-lactamase producing Enterobacterales (ESBL-E), carbapenem-resistant Enterobacterales (CRE), and Pseudomonas aeruginosa with difficult-to-treat resistance (DTR-P. aeruginosa). Clin Infect Dis 2021; 72: e169–e83. [DOI] [PubMed] [Google Scholar]
- 18. Delgado-Valverde M, Torres E, Valiente-Mendez Aet al. Impact of the MIC of piperacillin/tazobactam on the outcome for patients with bacteraemia due to Enterobacteriaceae: the bacteraemia-MIC project. J Antimicrob Chemother 2016; 71: 521–30. 10.1093/jac/dkv362 [DOI] [PubMed] [Google Scholar]
- 19. Retamar P, López-Cerero L, Muniain MAet al. Impact of the MIC of piperacillin-tazobactam on the outcome of patients with bacteremia due to extended-spectrum-β-lactamase-producing Escherichia coli. Antimicrob Agents Chemother 2013; 57: 3402–4. 10.1128/AAC.00135-13 [DOI] [PMC free article] [PubMed] [Google Scholar]
- 20. Rhodes NJ, Liu J, O’Donnell JNet al. Prolonged infusion piperacillin-tazobactam decreases mortality and improves outcomes in severely ill patients: results of a systematic review and meta-analysis. Crit Care Med 2018; 46: 236–43. 10.1097/CCM.0000000000002836 [DOI] [PubMed] [Google Scholar]
- 21. García-Fernández S, Bala Y, Armstrong Tet al. Multicenter evaluation of the new etest gradient diffusion method for piperacillin-tazobactam susceptibility testing of Enterobacterales, Pseudomonas aeruginosa, and Acinetobacter baumannii complex. J Clin Microbiol 2020; 58: e01042-19. 10.1128/JCM.01042-19 [DOI] [PMC free article] [PubMed] [Google Scholar]
- 22. Henderson A, Paterson DL, Chatfield MDet al. Association between minimum inhibitory concentration, beta-lactamase genes and mortality for patients treated with piperacillin/tazobactam or meropenem from the MERINO study. Clin Infect Dis 2021; 73: e3842–e50. 10.1093/cid/ciaa1479 [DOI] [PubMed] [Google Scholar]
- 23. Zhou M, Wang Y, Liu Cet al. Comparison of five commonly used automated susceptibility testing methods for accuracy in the China antimicrobial resistance surveillance system (CARSS) hospitals. Infect Drug Resist 2018; 11: 1347–58. 10.2147/IDR.S166790 [DOI] [PMC free article] [PubMed] [Google Scholar]
Associated Data
This section collects any data citations, data availability statements, or supplementary materials included in this article.