

Abstract
The combination of immunotherapy and lenvatinib has shown a good response for inoperable hepatocellular carcinoma (HCC) patients. However, a specific marker to predict the response, overall survival (OS) and progression-free survival (PFS) of this combination treatment is lacking. The present work focused on investigating whether subcutaneous adipose tissue (SAT) characteristics on CT could predict the response and survival for HCC patients who receive the combination treatment. This study retrospectively enrolled 100 patients with inoperable HCC who received lenvatinib combined with anti-PD-1 antibody treatment from 2018 to 2022. Fifty-six patients were finally included. The area and density of SAT were measured using unenhanced cross-sectional CT images. The SAT volume index was calculated as the SAT area divided by height squared in meters (cm2/m2). We classified these patients into two groups according to SAT volume index and density. Twenty-one patients (37.5%) with a low SAT volume index and high density were divided into the high risk group. High risk patients showed a markedly decreased objective response rate (ORR) compared with low risk patients (19.0% versus 54.3%, P = 0.021). The median PFS times were 6.00 and 12.03 months for the high risk and low risk groups, respectively (hazard ratio (HR) = 2.296, P = 0.035). High risk patients with Barcelona Clinic Liver Cancer (BCLC) stage-C had a markedly decreased OS of compared to low risk patients (HR = 4.272, P = 0.01). Patients with low SAT volume index and high density were found to have less opportunity to benefit from this combination therapy.
Keywords: Subcutaneous adipose tissue, volume, density, HCC, lenvatinib, immunotherapy
Introduction
Targeted therapy combined with immunotherapy has yielded good responses in hepatocellular carcinoma (HCC) patients. In 2020, atezolizumab plus bevacizumab improved overall survival (OS) and progression-free survival (PFS) compared to sorafenib in the IMbrave150 trial, which was thought to be a ten-year breakthrough in the treatment of advanced HCC. Lenvatinib combined with pembrolizumab showed a high anticancer effect on the inoperable HCC in clinical trials and real clinical studies [1,2]. However, a specific marker for predicting the OS and PFS of this combination therapy remains lacking.
In recent years, body composition factors, such as depleted skeletal muscle mass (sarcopenia) and increased intra-abdominal fat (central obesity), have attracted increasing attention as possible biomarkers for cancer. In HCC, skeletal muscle mass affects the tolerance and prognostic outcome of patients receiving lenvatinib treatment [3], but sarcopenia is not related to OS in patients receiving anti-PD-1 antibodies [4,5]. Subcutaneous adipose tissue (SAT) volume and density were closely related to the prognosis of HCC patients receiving transcatheter intra-arterial treatments [5,6]. Adipose tissue attenuation was reported to serve as a prognostic biomarker, which can be used to stratify moderate-stage HCC patients undergoing transarterial chemoembolization [6]. However, to the best of our knowledge, whether body composition is related to the prognosis of HCC patients receiving lenvatinib and anti-PD-1 antibody combination therapy remains unknown.
The present retrospective study determined the volume and density of SAT using cross-sectional CT scans in unresectable HCC patients receiving combination treatment. This work aimed to evaluate the role of SAT volume and density in predicting the outcome of inoperable HCC patients who received lenvatinib combined with anti-PD-1 antibodies.
Methods
Patients
This is a single-cohort, retrospective, and observational study. We included HCC patients receiving lenvatinib and anti-PD-1 antibody combination treatment from February 1, 2018, to November 30, 2021. HCC was diagnosed according to pathology after surgery or typical imaging features based on multiphasic CT or MRI scan, including non-rim arterial phase hyperenhancement (APHE) and washout on portal venous and/or delayed phases. Biopsy of hepatic lesion was done selectively for patients whose HCC diagnosis remained indeterminate on contrast-enhanced imaging. Lenvatinib plus anti-PD-1 antibody therapy was proposed for patients with inoperable HCC cases. Patients were determined to be ineligible for resection based on the following criteria: (a) the presence of distant metastases or intrahepatic metastases and (b) determined to be unsuitable for surgery due to anatomical causes. Patients with severely impaired liver function characteristics were excluded. Altogether, 100 patients received lenvatinib and anti-PD-1 treatment, and 44 were eliminated due to the lack of CT scans, insufficient CT image quality, or loss of follow-up. Finally, 56 patients were enrolled for subsequent analyses (Figure 1).
Figure 1.
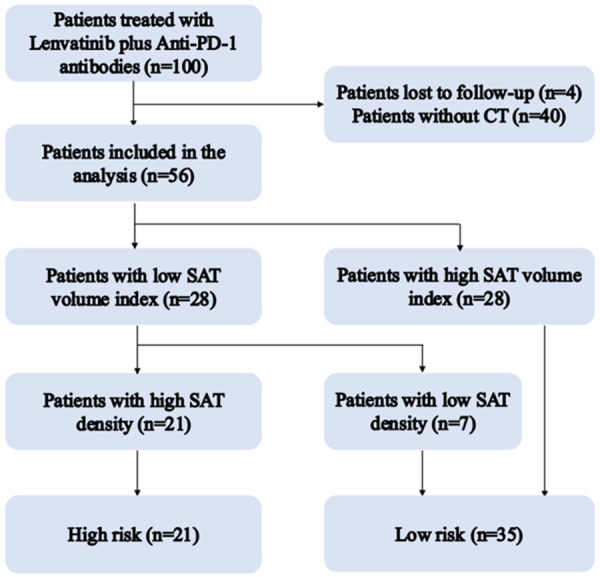
Flowchart of patients included in high risk group and low risk group.
The present retrospective study gained approval from the Ethics Committee of Peking Union Medical College Hospital (JS-1391). Due to data anonymity, no informed consent was needed.
Treatment course
For patients whose body weight (BW) was ≥ 60 kg, 12 mg/day lenvatinib was given orally once daily, and for those whose BW was < 60 kg, 8 mg was administered. The PD-1 dose was administered according to the drug instructions, which involved a fixed amount of 200 mg (240 mg for toripalimab) every three weeks.
Body composition quantification
CT scans obtained within two months prior to initial therapy were evaluated. The measurements were validated by two radiologists with 7 and 15 years of experience. The SAT area and density at the third lumbar vertebra (L3) level were measured by manually outlining the outer boundary of the abdominal muscle (Figure 2) using ImageJ software (National Institute of Health, Bethesda, MD, USA). Threshold value of -190 to -30 HU was set to discriminate the subcutaneous adipose tissue, which was applied in many similar studies [6,7]. The SAT volume index was calculated as the SAT area divided by height squared in meters (cm2/m2). The mean SAT density was documented in Hounsfield units (HU). Due to the small sample size, parameter cutoff values were set as the median number of each parameter [6]. According to the SAT volume index and density, the patients were classified into high risk group (patients with a high SAT volume index and low density) and low risk group (others) (Figure 1).
Figure 2.
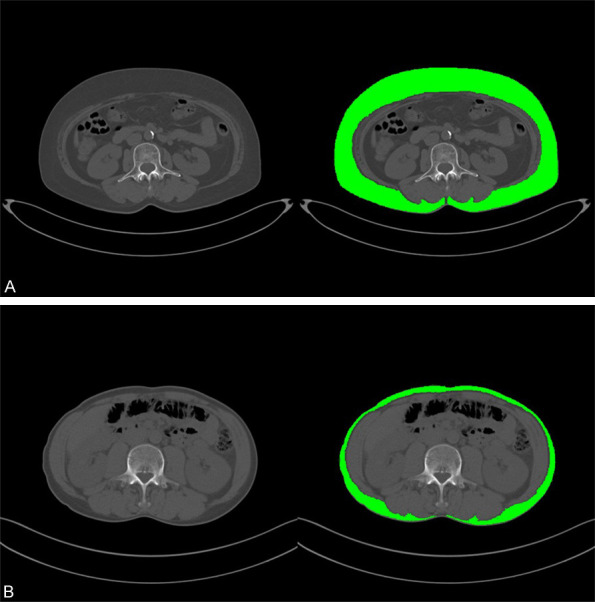
The subcutaneous adipose tissue (SAT) area and density were measured on non-contrast CT axial images at the third lumbar vertebra (L3) level. Green areas indicate subcutaneous adipose tissues. A: One patient with a high SAT volume index and low density. B: One patient with a low SAT volume index and high density.
Clinical information
The following baseline characteristics of the patients were retrospectively collected, including age, gender, BMI, hepatitis virus infection history such as hepatitis B and C virus (HBV/HBC), Child-Pugh classification, BCLC stage, serum alpha-fetoprotein (AFP) content, maximal tumor size, the number of tumors and treatment response. Contrast-enhanced CT or MRI was conducted to measure the tumor response according to the RECIST version 1.1 criteria by at least two radiologists [8]. To observe patient survival, the patients were contacted regularly from November 30, 2021 (every 3 months) via outpatient visits or telephone calls until June 30, 2022, loss to follow-up or death.
Main outcome
The main outcome was overall survival (OS), which was defined as the time between the date of the initial treatment and the date of the final follow-up or death. Progression-free survival (PFS) was the secondary outcome, which was defined as the time from the date of the initial treatment to the date of the radiological progression or death. The aim of this study was to explore the value of SAT volume and density for predicting the OS and PFS of patients with unresectable HCC treated with lenvatinib plus anti-PD-1 antibodies.
Statistical analysis
Continuous variables were presented as the median (interquartile range) and nonparametrically analyzed by the Mann-Whitney U test. Categorical variables were presented as numbers of patients and percentages, and the χ2 test and Fisher’s exact test were performed for comparisons as appropriate. The OS and PFS were predicted by Kaplan-Meier survival analysis, and then compared by the log-rank test. To identify predictive factors for OS and PFS, a univariate logistic regression model was applied. Cox proportional hazards modeling was utilized to predict the hazard ratios (HRs) of each clinicopathological feature for OS and PFS. Two-tailed P < 0.05 indicated for statistical significance. SPSS 26.0 (IBM Corporation, Armonk, NY, USA) and GraphPad Prism 9.0.0 (GraphPad Software, Inc., La Jolla, CA, USA) were employed for statistical analysis.
Results
Patients and baseline characteristics
Table 1 shows the baseline demographic and clinical data of the patients. There were 56 patients finally enrolled in this study (50 males and 6 females), and the median age was 58.5 years. All patients had the Eastern Cooperative Oncology Group (ECOG) score of 0-1, while 53 (94.6%) were classified as having Child-Pugh grade A. The median baseline AFP content was 144 ng/mL, and 37 (66.1%) patients were at the late stage of HCC (BCLC stage C). There were 18 patients with metastatic lesions originating from the liver at baseline before treatment, and 21 had macrovascular invasion. Fifty-four patients received lenvatinib combined with anti-PD-1 antibody treatment as the first-line therapy. Twenty-nine patients developed disease progression, and 15 died during the median observation period of 12 months. Twenty-one patients with a high SAT volume index and low density were divided into the high risk group, whereas the left 35 cases were divided into the low risk group.
Table 1.
Baseline characteristics of the study population
| Parameters | Total (N = 56) |
|---|---|
| Age, years (median, IQR) | 58.5 (52.0, 69.8) |
| < 60 n (%) | 31 (55.4) |
| ≥ 60 n (%) | 25 (44.6) |
| Sex n (%) | |
| Female | 6 (10.7) |
| Male | 50 (89.3) |
| BMI kg/m2 (median, IQR) | 23.29 (21.59, 24.74) |
| < 24 | 27 (49.1) |
| ≥ 24 | 28 (50.9) |
| ECOG performance, n (%) | |
| 0 | 39 (69.6) |
| 1 | 17 (30.4) |
| HBV infection n (%) | 44 (78.6) |
| HCV infection n (%) | 5 (8.9) |
| Child-Pugh score n (%) | |
| A5 | 41 (73.2) |
| A6 | 12 (21.4) |
| B7 | 3 (5.4) |
| AFP ng/mL (median, IQR) | 144 (18.6, 4231) |
| < 400 | 31 (55.4) |
| ≥ 400 | 25 (44.6) |
| BCLC stage n [%] | |
| 0-A | 3 (5.3) |
| B | 16 (28.6) |
| C | 37 (66.1) |
| Vascular invasion, n (%) | 18 (32.1) |
| Extrahepatic spread, n (%) | 21 (38.2) |
| Number of previous treatment regimens n, (%) | |
| 0 | 54 (96.4) |
| ≥ 0 | 2 (3.6) |
| Follow-up time months (median, IQR) | 12 (6.92, 17.00) |
| SAT volume index cm2/m2 (median, IQR) | 39.27 (26.70, 52.35) |
| SAT CT value HU (median, IQR) | -94.4 (-101.8, -187.9) |
| Group | |
| High risk group n (%) | 21 (37.5) |
| Low risk group n (%) | 35 (62.5) |
| Type of anti-PD-1 antibodies n (%) | |
| Camrelizumab | 36 (64.3%) |
| Pembrolizumab | 7 (12.5%) |
| Nivolumab | 1 (1.8%) |
| Tislelizumab | 6 (10.7%) |
| Sintilimab | 1 (1.8%) |
| Toripalimab | 5 (8.9%) |
Abbreviations: BCLC: Barcelona Clinic Liver Cancer; BMI: Body mass index; HBV: hepatitis B virus; HCV: hepatitis C virus; HU: Hounsfield unit; SAT: subcutaneous adipose tissue.
Treatment and efficacy
All patients included in the study underwent regular radiological evaluations. Among all 56 enrolled patients, 23 (41.1%) patients achieved an objective response (all had a partial response), and 24 (42.9%) patients achieved stable disease (SD). Consequently, the overall disease control rate (DCR) was 83.9% (Table 2). Low risk patients (19/35, 54.3%) had an improved objective response rate (ORR) compared with high risk patients (4/21, 19.0%) (P = 0.021, chi-square test) (Figure 3).
Table 2.
Therapeutic response assessment and survival outcomes of evaluable patients (n = 56)
| Therapeutic response assessment | Evaluable patients (n = 56) |
|---|---|
| Confirmed objective response rate (ORR, n, %) | 23 (41.1%) |
| Complete response (CR, n, %) | 0 |
| Partial response (PR, n, %) | 23 (41.1%) |
| Stable disease (SD, n, %) | 24 (42.9%) |
| Disease control rate (DCR, n, %) | 47 (83.9%) |
| Progressive disease (PD, n, %) | 9 (16.1%) |
Abbreviations: CR: complete response; PR: partial response; SD: stable disease; PD: progressive disease; ORR: objective response rate; DCR: disease control rate.
Figure 3.
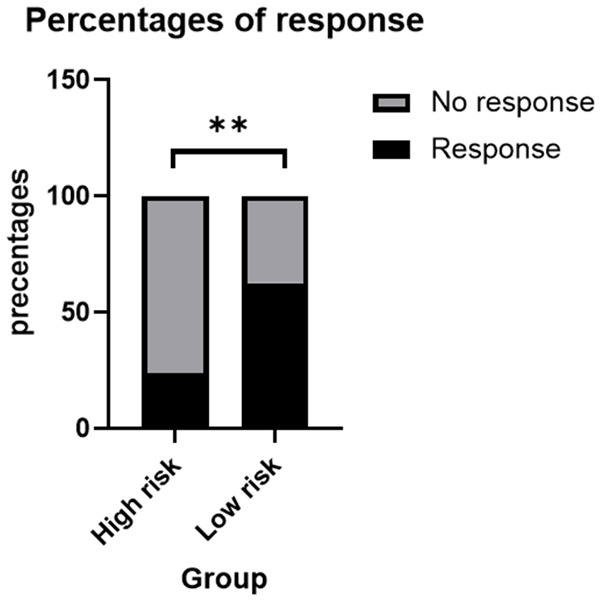
The objective response rate (ORR) (19/35, 53.3%) in low risk group was much higher than that (4/21, 17.4%) in high risk group (P = 0.021, chi-square test). Abbreviations: ORR: objective response rate.
Survival analysis
The median follow-up time was 12 months. The PFS rate for HCC markedly decreased in high risk patients compared to low risk patients (P = 0.0297; Figure 4). The median PFS of high risk patients was 6.00 (3.35, 8.65) months, which was significantly lower than that of low risk group patients [12.03 (7.99, 16.07) months]. Table 3 shows the univariate analysis of PFS among patients, which identified the high risk group (HR = 2.296, P = 0.035) as a unique factor for predicting the disease progression risk.
Figure 4.
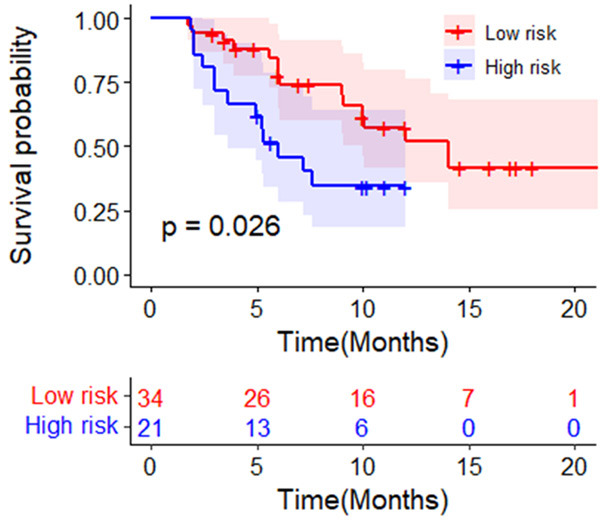
The PFS rate in the high risk group for HCC patients was significantly lower than that in low risk group. Abbreviations: PFS: progress-free survival; BCLC: Barcelona Clinic Liver Cancer; HCC: hepatocellular carcinoma.
Table 3.
Univariate analysis of clinical characteristics for progression-free survival using the Cox proportional hazards model
| Parameters | Univariate analysis | P value |
|---|---|---|
| Age (years) ≥ 60 vs. < 60 | 0.762 (0.361, 1.609) | 0.475 |
| Sex Male vs. Female | 0.667 (0.232, 1.918) | 0.4452 |
| BMI (kg/m2) ≥ 25 vs. < 25 | 0.907 (0.367, 1.222) | 0.833 |
| ECOG performance 1 versus 0 | 1.877 (0.872, 4.085) | 0.107 |
| HBV infection Yes vs. No | 0.919 (0.388, 2.178) | 0.849 |
| HCV infection Yes vs. No | 1.884 (0.564, 6.294) | 0.304 |
| Child-Pugh score B vs. A | 3.958 (0.903, 17.351) | 0.068 |
| AFP (ng/mL) ≥ 400 vs. < 400 | 2.026 (0.972, 4.223) | 0.06 |
| BCLC stage C vs. 0-A, B | 1.209 (0.560, 2.611) | 0.629 |
| Vascular invasion Yes vs. No | 0.668 (0.302, 1.480) | 0.321 |
| Extrahepatic spread Yes vs. No | 1.077 (0.506, 2.289) | 0.848 |
| SAT volume index (cm2/m2) High vs. Low | 0.598 (0.281, 1.273) | 0.182 |
| SAT CT value (HU) High vs. Low | 1.281 (0.614, 2.672) | 0.509 |
| Group High risk vs. Low risk | 2.296 (1.059, 4.997) | 0.035* |
Abbreviations: BCLC: Barcelona Clinic Liver Cancer; BMI: body mass index; HBV: hepatitis B virus; HCV: hepatitis C virus; HU: Hounsfield unit; SAT: subcutaneous adipose tissue.
P < 0.05.
Because patients with BCLC stage 0-B disease had no events, we only included patients with BCLC stage C for analysis. The low risk group of patients with BCLC stage C disease showed an improved OS rate compared with the high risk group (P = 0.0057; Figure 5). The univariate analysis on OS among patient showed that HCV infection (HR 4.141, 95% CI 1.136, 15.088, P = 0.031) and high risk groups (HR 4.272, 95% CI 1.405, 12.985, P = 0.01) were the risk factors (Table 4).
Figure 5.
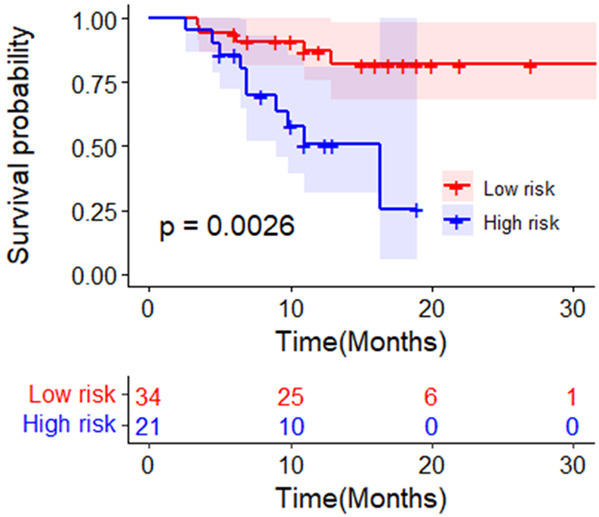
The OS rate of HCC patients with BCLC stage C in low risk group was higher than that of those in the high risk group. Abbreviations: OS: overall survival; BCLC: Barcelona Clinic Liver Cancer; HCC: hepatocellular carcinoma.
Table 4.
Univariate analysis of clinical characteristics for overall survival using the Cox proportional hazards model in BCLC stage C patients (n = 37)
| Parameters | Univariate analysis | P value |
|---|---|---|
| Age (years)≥ 60 vs. < 60 | 1.142 (0.405, 3.220) | 0.801 |
| Sex Male vs. Female | 0.412 (0.116, 1.1462) | 0.170 |
| BMI (kg/m2) ≥ 25 vs. < 25 | 1.019 (0.321, 3.327) | 0.975 |
| ECOG performance 1 versus 0 | 1.715 (0.619, 4.753) | 0.299 |
| HBV infection Yes vs. No | 0.466 (0.159, 1.369) | 0.165 |
| HCV infection Yes vs. No | 4.141 (1.136, 15.088) | 0.031* |
| Child-Pugh score B vs. A | 3.754 (0.418, 33.727) | 0.238 |
| AFP (ng/mL) ≥ 400 vs. < 400 | 2.674 (0.848, 8.428) | 0.093 |
| Vascular invasion Yes vs. No | 0.395 (0.110, 1.422) | 0.155 |
| Extrahepatic spread Yes vs. No | 2.335 (0.828, 6.857) | 0.109 |
| SAT volume index (cm2/m2) High vs. Low | 0.539 (0.183, 1.594) | 0.264 |
| SAT CT value (HU) High vs. Low | 2.931 (0.921, 9.324) | 0.069 |
| Group High risk vs. Low risk | 4.272 (1.405, 12.985) | 0.01* |
Abbreviations: BCLC: Barcelona Clinic Liver Cancer; BMI: Body mass index; HBV: chronic viral hepatitis B infection; HCV: hepatitis C infection; HU: Hounsfield unit; SAT: subcutaneous adipose tissue.
P < 0.05.
Demographic and clinical data comparisons between high risk groups and low risk groups
Table 5 compares demographic and clinical data between two risk groups at baseline. The median BMI for high risk group was 22.05 kg/m2, which was markedly decreased compared to that of the low risk group. BMI, vascular invasion, and SAT volume index and density showed a significant difference between the two groups. No other variables, including sex, etiology, AFP, ECOG score, or Child-Pugh score, showed significant differences between the two groups.
Table 5.
Comparison of demographic and clinical characteristics between the high risk and low risk groups
| Parameters | Patients in the high risk group (n = 21) | Patients in the low risk group (n = 35) | P value |
|---|---|---|---|
| Age, years (median, IQR) | 54.00 (48.00, 63.50) | 62.00 (54.00, 70.00) | 0.052 |
| Sex (Male) n (%) | 20 (95.2) | 30 (85.7) | 0.503 |
| BMI kg/m2 (median, IQR) | 22.05 (20.39, 23.35) | 23.94 (22.81, 25.10) | 0.002** |
| ECOG performance, n (%) (0) | 14 (66.7) | 26 (77.3) | 0.178 |
| HBV infection n (%) | 19 (90.5) | 25 (71.4) | 0.162 |
| HCV infection n (%) | 0 (0) | 5 (14.3) | 0.183 |
| Child-Pugh score n (%) (A) | 19 (90.1) | 35 (97.1) | 0.646 |
| AFP ng/mL (< 400) | 8 (38.1) | 23 (65.7) | 0.056 |
| BCLC stage n (%) (C) | 16 (76.2) | 21 (60.0) | 0.343 |
| Vascular invasion, n (%) (0) | 3 (14.3) | 15 (42.9) | 0.055 |
| Extrahepatic spread, n (%) | 7 (33.3) | 14 (40) | 0.777 |
| SAT volume index cm2/m2 (median, IQR) | 25.85 (18.74, 29.83) | 47.06 (40.20, 60.21) | 0.001 |
| SAT CT value HU (median, IQR) | -88.50 (-90.0, -80.01) | -100.6 (-103.4, -95.20) | 0.001 |
Abbreviations: BCLC: Barcelona Clinic Liver Cancer; BMI: body mass index; HBV: hepatitis B virus; HCV: hepatitis C virus; HU: Hounsfield unit; SAT: subcutaneous adipose tissue.
P < 0.01.
Changes in SAT volume index and density in follow-up scans
We retrospectively collected the follow-up scans during the combination treatment. Thirty-five patients had at least two CT scans. The average interval between the two scans was 71 days. There were no significant differences in SAT volume index (Figure 6) and density (Figure 7). The classification of risk groups did not change considering the follow-up scans.
Figure 6.
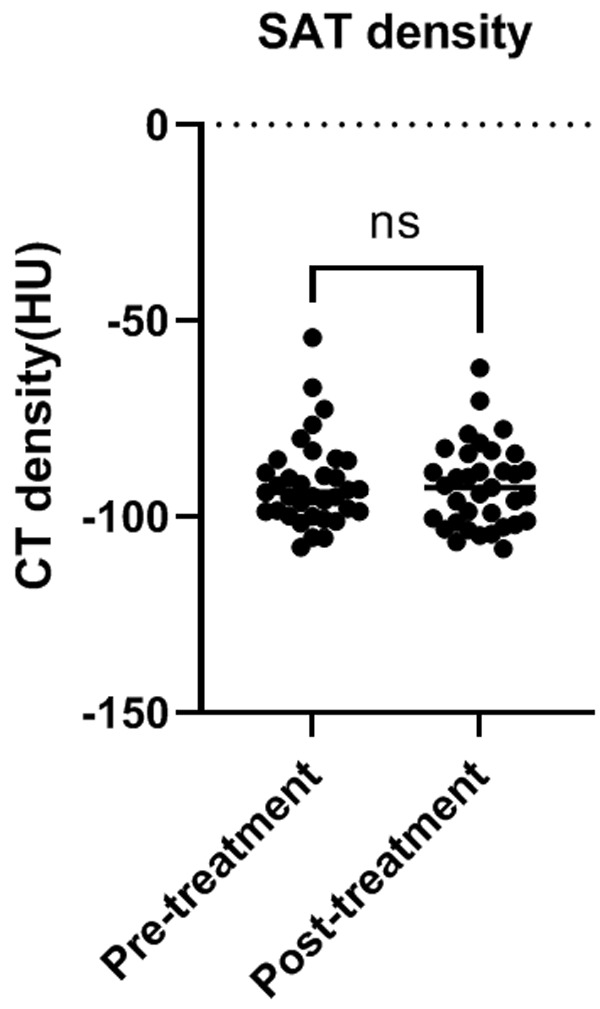
Changes in SAT density during the combination treatment. Abbreviations: HU: Hounsfield unit; SAT: subcutaneous adipose tissue; CT: computer tomograply.
Figure 7.
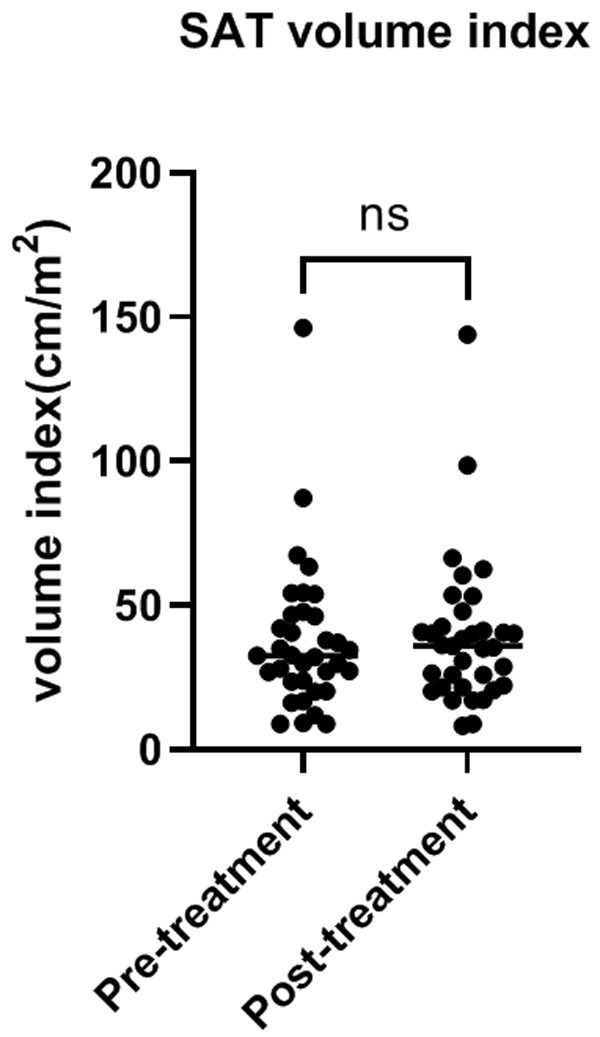
Changes in SAT volume index during the combination treatment. Abbreviations: SAT: subcutaneous adipose tissue; CT: computer tomograply.
Discussion
Lenvatinib and anti-PD-1 antibody combination treatment results in favorable outcomes in inoperable HCC patients, and the disease control rate is as high as 84.1% without serious adverse effects [9]. However, the ORR in that study was only 34.1%, indicating that many patients could not benefit from this combination treatment. To date, a relevant baseline factor for predicting response and survival in patients receiving immunotherapy plus targeted therapy has been lacking till previous studies. To the best of our knowledge, the present work is the first to analyze the relationship between body composition and the survival in patients with inoperable HCC who received lenvatinib plus anti-PD-1 antibody treatment.
The volume and density of visceral and subcutaneous adipose tissues were reported to be significant prognostic markers for HCC patients who underwent locoregional therapy, such as hepatectomy, internal radiotherapy, and transarterial chemoembolization [5,10-12]. Body composition was reported to be the main factor determining HCC prognosis [13]. In addition, a previous study showed that adipose tissue could modulate the therapeutic effect of PD-1/PD-L1 checkpoint blockade immunotherapy within the breast cancer model both in vitro and in vivo [14]. Evaluating body composition from density and volume aspects facilitates the analysis of the associated phenotype of HCC patients [14].
In our cohorts, we observed that HCC patients with a low SAT volume index and high SAT density were more likely to have a poor response and poor prognosis with the combination therapy. Several hypotheses might explain this finding. First, a low SAT volume and a high SAT density are correlated with the depletion of adipose tissue [15]. Unlike visceral adipose tissue, subcutaneous fat is the physiological buffer for excess energy intake and effectively stores excess lipids [15,16]. SAT can also produce leptin, which favorably inhibits insulin activity [17], while insulin together with insulin-like growth factor represents a growth factor that causes tumor development and invasion [18]. In addition, a higher SAT density may be related to the activation of brown adipose tissue (BAT) [19]. BAT is richly vascularized and associated with the overexpression of VEGF [20]. In addition to its essential effect on HCC occurrence and progression, VEGF overexpression could associate with a poor response to lenvatinib [21-23]. Besides, the proinflammatory state may also explain the increased adipose tissue density, which has the features of inflammatory cell infiltration and fibrosis [24,25]. Furthermore, high adipose tissue density is also associated with the decreased expression of anti-inflammatory factors [26]. Thus, these findings indicate that patients with a low SAT density may have impaired immune function that promotes oncogenesis, which could contribute to the poor response of patients with HCC treated with combination therapy in our study.
Our findings conformed to those of prior publications, which showed that a low SAT volume might represent an energy exhaustion status in HCC patients and predict a poor outcome [5,6,27]. SAT volume and CT density could be easily measured with basic image viewer software, and only a non-contrast CT scan is needed. Thus, this evaluation could also be easily integrated into the routine follow-up of patients during treatment, and strategies might be tailored to individual conditions to improve survival and minimize suffering.
Our study is subject to certain limitations. First, this study had a small sample size. Second, due to the retrospective nature of this study, some patients lacked CT examination with sufficient image quality or follow-up and therefore had to be excluded from our research, which may cause a selection bias. In addition, the mechanism related to the relationship between SAT and the response to combination therapy remains unclear, and further experimental studies are needed to help better understand these aspects.
Conclusion
HCC patients with a low SAT volume index and high SAT density may represent a unique subgroup that has a low likelihood of response with lenvatinib plus anti-PD-1 antibody combination treatment and a poor prognosis.
Acknowledgements
This work was supported by National High Level Hospital Clinical Research Funding [2022-PUMCH-B-128] [2022-PUMCH-B-052], CAMS Innovation Fund for Medical Sciences (CIFMS) [2022-I2M-C&T-A-003], CAMS Innovation Fund for Medical Sciences (CIFMS) [2021-I2M-1-061] [2021-I2M-1-003], CSCO-hengrui Cancer Research Fund [Y-HR2019-0239] [Y-HR2020MS-0415] [Y-HR2020QN-0414], CSCO-MSD Cancer Research Fund [Y-MSDZD2021-0213] and National Ten-thousand Talent Program.
Disclosure of conflict of interest
None.
Abbreviations
- SAT
subcutaneous adipose tissue
- HCC
hepatocellular carcinoma
- PFS
progress-free survival
- OS
overall survival
- CT
computed tomography
- HR
hazard ratio
- ORR
objective response rate
- BCLC
Barcelona Clinic Liver Cancer
- HCV
hepatitis C virus
- HU
Hounsfield unit
- HBV
hepatitis B virus
- AFP
alpha-fetoprotein
- ECOG
Eastern Cooperative Oncology Group
- PR
partial response
- CR
complete response
- SD
stable disease
- PD
progressive disease
- DCR
disease control rate
References
- 1.Yang X, Xu H, Zuo B, Yang X, Bian J, Long J, Wang D, Zhang J, Ning C, Wang Y, Xun Z, Wang Y, Lu X, Mao Y, Sang X, Zhao H. Downstaging and resection of hepatocellular carcinoma in patients with extrahepatic metastases after stereotactic therapy. Hepatobiliary Surg Nutr. 2021;10:434–442. doi: 10.21037/hbsn-21-188. [DOI] [PMC free article] [PubMed] [Google Scholar]
- 2.Yi C, Chen L, Lin Z, Liu L, Shao W, Zhang R, Lin J, Zhang J, Zhu W, Jia H, Qin L, Lu L, Chen J. Lenvatinib targets FGF receptor 4 to enhance antitumor immune response of anti-programmed cell death-1 in HCC. Hepatology. 2021;74:2544–2560. doi: 10.1002/hep.31921. [DOI] [PubMed] [Google Scholar]
- 3.Uojima H, Chuma M, Tanaka Y, Hidaka H, Nakazawa T, Iwabuchi S, Kobayashi S, Hattori N, Ogushi K, Morimoto M, Kagawa T, Tanaka K, Kako M, Koizumi W. Skeletal muscle mass influences tolerability and prognosis in hepatocellular carcinoma patients treated with lenvatinib. Liver Cancer. 2020;9:193–206. doi: 10.1159/000504604. [DOI] [PMC free article] [PubMed] [Google Scholar]
- 4.Akce M, Liu Y, Zakka K, Martini DJ, Draper A, Alese OB, Shaib WL, Wu C, Wedd JP, Sellers MT, Bilen MA, El-Rayes BF. Impact of sarcopenia, BMI, and inflammatory biomarkers on survival in advanced hepatocellular carcinoma treated with anti-PD-1 antibody. Am J Clin Oncol. 2021;44:74–81. doi: 10.1097/COC.0000000000000787. [DOI] [PubMed] [Google Scholar]
- 5.Kobayashi T, Kawai H, Nakano O, Abe S, Kamimura H, Sakamaki A, Kamimura K, Tsuchiya A, Takamura M, Yamagiwa S, Terai S. Prognostic value of subcutaneous adipose tissue volume in hepatocellular carcinoma treated with transcatheter intra-arterial therapy. Cancer Manag Res. 2018;10:2231–2239. doi: 10.2147/CMAR.S167417. [DOI] [PMC free article] [PubMed] [Google Scholar]
- 6.von Hessen L, Roumet M, Maurer MH, Lange N, Reeves H, Dufour JF, Radu P. High subcutaneous adipose tissue density correlates negatively with survival in patients with hepatocellular carcinoma. Liver Int. 2021;41:828–836. doi: 10.1111/liv.14755. [DOI] [PubMed] [Google Scholar]
- 7.van Vledder MG, Levolger S, Ayez N, Verhoef C, Tran TC, Ijzermans JN. Body composition and outcome in patients undergoing resection of colorectal liver metastases. Br J Surg. 2012;99:550–557. doi: 10.1002/bjs.7823. [DOI] [PubMed] [Google Scholar]
- 8.Finn RS, Ikeda M, Zhu AX, Sung MW, Baron AD, Kudo M, Okusaka T, Kobayashi M, Kumada H, Kaneko S, Pracht M, Mamontov K, Meyer T, Kubota T, Dutcus CE, Saito K, Siegel AB, Dubrovsky L, Mody K, Llovet JM. Phase Ib study of lenvatinib plus pembrolizumab in patients with unresectable hepatocellular carcinoma. J. Clin. Oncol. 2020;38:2960–2970. doi: 10.1200/JCO.20.00808. [DOI] [PMC free article] [PubMed] [Google Scholar]
- 9.Wu CJ, Lee PC, Hung YW, Lee CJ, Chi CT, Lee IC, Hou MC, Huang YH. Lenvatinib plus pembrolizumab for systemic therapy-naïve and -experienced unresectable hepatocellular carcinoma. Cancer Immunol Immunother. 2022;71:2631–2643. doi: 10.1007/s00262-022-03185-6. [DOI] [PMC free article] [PubMed] [Google Scholar]
- 10.Ebadi M, Moctezuma-Velazquez C, Meza-Junco J, Baracos VE, DunichandHoedl AR, Ghosh S, Sarlieve P, Owen RJ, Kneteman N, Montano-Loza AJ. Visceral adipose tissue radiodensity is linked to prognosis in hepatocellular carcinoma patients treated with selective internal radiation therapy. Cancers (Basel) 2020;12:356. doi: 10.3390/cancers12020356. [DOI] [PMC free article] [PubMed] [Google Scholar]
- 11.Li Q, Zhang L, Hou ZH, Zhao DX, Li JB, Zhang S, Yin Y, Ni CF, Chen T. High visceral adipose tissue density correlates with unfavorable outcomes in patients with intermediate-stage hepatocellular carcinoma undergoing transarterial chemoembolization. Front Cell Dev Biol. 2021;9:710104. doi: 10.3389/fcell.2021.710104. [DOI] [PMC free article] [PubMed] [Google Scholar]
- 12.Hamaguchi Y, Kaido T, Okumura S, Kobayashi A, Shirai H, Yao S, Yagi S, Kamo N, Seo S, Taura K, Okajima H, Uemoto S. Preoperative visceral adiposity and muscularity predict poor outcomes after hepatectomy for hepatocellular carcinoma. Liver Cancer. 2019;8:92–109. doi: 10.1159/000488779. [DOI] [PMC free article] [PubMed] [Google Scholar]
- 13.Fujiwara N, Nakagawa H, Kudo Y, Tateishi R, Taguri M, Watadani T, Nakagomi R, Kondo M, Nakatsuka T, Minami T, Sato M, Uchino K, Enooku K, Kondo Y, Asaoka Y, Tanaka Y, Ohtomo K, Shiina S, Koike K. Sarcopenia, intramuscular fat deposition, and visceral adiposity independently predict the outcomes of hepatocellular carcinoma. J Hepatol. 2015;63:131–140. doi: 10.1016/j.jhep.2015.02.031. [DOI] [PubMed] [Google Scholar]
- 14.Wu B, Sun X, Gupta HB, Yuan B, Li J, Ge F, Chiang HC, Zhang X, Zhang C, Zhang D, Yang J, Hu Y, Curiel TJ, Li R. Adipose PD-L1 modulates PD-1/PD-L1 checkpoint blockade immunotherapy efficacy in breast cancer. Oncoimmunology. 2018;7:e1500107. doi: 10.1080/2162402X.2018.1500107. [DOI] [PMC free article] [PubMed] [Google Scholar]
- 15.Han J, Tang M, Lu C, Shen L, She J, Wu G. Subcutaneous, but not visceral, adipose tissue as a marker for prognosis in gastric cancer patients with cachexia. Clin Nutr. 2021;40:5156–5161. doi: 10.1016/j.clnu.2021.08.003. [DOI] [PubMed] [Google Scholar]
- 16.Ibrahim MM. Subcutaneous and visceral adipose tissue: structural and functional differences. Obes Rev. 2010;11:11–18. doi: 10.1111/j.1467-789X.2009.00623.x. [DOI] [PubMed] [Google Scholar]
- 17.Van Harmelen V, Reynisdottir S, Eriksson P, Thörne A, Hoffstedt J, Lönnqvist F, Arner P. Leptin secretion from subcutaneous and visceral adipose tissue in women. Diabetes. 1998;47:913–917. doi: 10.2337/diabetes.47.6.913. [DOI] [PubMed] [Google Scholar]
- 18.Samani AA, Yakar S, LeRoith D, Brodt P. The role of the IGF system in cancer growth and metastasis: overview and recent insights. Endocr Rev. 2007;28:20–47. doi: 10.1210/er.2006-0001. [DOI] [PubMed] [Google Scholar]
- 19.Baba S, Jacene HA, Engles JM, Honda H, Wahl RL. CT Hounsfield units of brown adipose tissue increase with activation: preclinical and clinical studies. J Nucl Med. 2010;51:246–250. doi: 10.2967/jnumed.109.068775. [DOI] [PubMed] [Google Scholar]
- 20.Bagchi M, Kim LA, Boucher J, Walshe TE, Kahn CR, D’Amore PA. Vascular endothelial growth factor is important for brown adipose tissue development and maintenance. FASEB J. 2013;27:3257–3271. doi: 10.1096/fj.12-221812. [DOI] [PMC free article] [PubMed] [Google Scholar]
- 21.Moon WS, Rhyu KH, Kang MJ, Lee DG, Yu HC, Yeum JH, Koh GY, Tarnawski AS. Overexpression of VEGF and angiopoietin 2: a key to high vascularity of hepatocellular carcinoma? Mod Pathol. 2003;16:552–557. doi: 10.1097/01.MP.0000071841.17900.69. [DOI] [PubMed] [Google Scholar]
- 22.Chen CH, Hsu FT, Chen WL, Chen JH. Induction of apoptosis, inhibition of MCL-1, and VEGF-A expression are associated with the anti-cancer efficacy of magnolol combined with regorafenib in hepatocellular carcinoma. Cancers (Basel) 2021;13:2066. doi: 10.3390/cancers13092066. [DOI] [PMC free article] [PubMed] [Google Scholar]
- 23.Choi SB, Han HJ, Kim WB, Song TJ, Choi SY. VEGF overexpression predicts poor survival in hepatocellular carcinoma. Open Med (Wars) 2017;12:430–439. doi: 10.1515/med-2017-0061. [DOI] [PMC free article] [PubMed] [Google Scholar]
- 24.Batista ML Jr, Henriques FS, Neves RX, Olivan MR, Matos-Neto EM, Alcântara PS, Maximiano LF, Otoch JP, Alves MJ, Seelaender M. Cachexia-associated adipose tissue morphological rearrangement in gastrointestinal cancer patients. J Cachexia Sarcopenia Muscle. 2016;7:37–47. doi: 10.1002/jcsm.12037. [DOI] [PMC free article] [PubMed] [Google Scholar]
- 25.Arano T, Nakagawa H, Tateishi R, Ikeda H, Uchino K, Enooku K, Goto E, Masuzaki R, Asaoka Y, Kondo Y, Goto T, Shiina S, Omata M, Yoshida H, Koike K. Serum level of adiponectin and the risk of liver cancer development in chronic hepatitis C patients. Int J Cancer. 2011;129:2226–2235. doi: 10.1002/ijc.25861. [DOI] [PubMed] [Google Scholar]
- 26.Sanchez-Pino MD, Gilmore LA, Ochoa AC, Brown JC. Obesity-associated myeloid immunosuppressive cells, key players in cancer risk and response to immunotherapy. Obesity (Silver Spring) 2021;29:944–953. doi: 10.1002/oby.23108. [DOI] [PMC free article] [PubMed] [Google Scholar]
- 27.Murphy RA, Wilke MS, Perrine M, Pawlowicz M, Mourtzakis M, Lieffers JR, Maneshgar M, Bruera E, Clandinin MT, Baracos VE, Mazurak VC. Loss of adipose tissue and plasma phospholipids: relationship to survival in advanced cancer patients. Clin Nutr. 2010;29:482–487. doi: 10.1016/j.clnu.2009.11.006. [DOI] [PubMed] [Google Scholar]