Abstract
One of the essential factors for water adsorption on silica gels is the concentration of silanol groups on the silica surface. However, no systematic investigation on the adsorption of sour gas components, methane (CH4), carbon dioxide (CO2), and hydrogen sulfide (H2S) on silica gels with different textural properties and surface silanol concentrations, has been conducted. Three silica gels of 22, 30, and 60 Å pore sizes, with silanol concentrations of αtotal = 2.516, 2.340, and 2.152 OH nm–2, respectively, were studied in this work. The adsorption data for CH4, CO2, H2S, and H2O at T = 0, 25, and 50 °C on the 22 and 30 Å pore size silica gels were presented, and a comparison of the data for the 60 Å pore size silica gel on the same adsorbates was conducted. All three silica gels showed an adsorption affinity in the order of H2O > H2S > CO2 > CH4. The isosteric heats of adsorption of H2O and H2S had a greater dependence on the silanol concentration than CO2 and CH4. At p < 10 bar, there was no difference in the adsorption per m2 of CH4 between the silica gels (nads = 1.7 mmol m–2, for all silicas at p = 10 bar), while higher pressures resulted in greater adsorption capacity in the larger pore volume silica gels (at p = 20 bar: nads = 3.0, 3.3, and 3.4 mmol m–2 for the 22, 30, and 60 Å pore size silicas, respectively). H2S adsorption at low pressures (p < 4 bar) was larger on the samples with larger silanol concentrations (at p = 3 bar: nads = 6.1, 4.7, and 4.5 mmol m–2 for the 22, 30, and 60 Å pore size silicas, respectively), but above p = 4 bar, the 60 Å pore size silica had a greater adsorption capacity than the 30 Å pore size (at p = 5 bar: nads = 8.0, 6.0, and 6.2 mmol m–2 for the 22, 30, and 60 Å pore size silicas, respectively).
1. Introduction
Water removal from natural gas is a necessary industrial process for mitigating pipeline corrosion, avoiding hydrate formation within transportation lines, and avoiding solids within liquefaction. Absorption by glycol is the favored technology for removing water from natural gas, but solid desiccants are preferred when low dew points are required (such as in cryogenic systems) or in remote locations where space is limited (such as off-shore rigs). Silica gels are a common desiccant choice as they can reach lower dew points than glycol units and are inexpensive compared to hygroscopic zeolites.1
It is well known that water adsorption on silica gels is impacted by the concentrations of silanol groups on the surface of the material.2 Water molecules will hydrogen bond with the exposed silanol groups, which therefore increases the affinity of the surface to water. Thermal treatment of silica gels can reduce silanol concentrations, while treatment with water will regenerate or even add additional silanol groups to the surface of silica gels.2,3 Further investigation into water adsorption on silica gels indicates that the silanol groups are expected to be the most important factor for water adsorption rather than varying pore sizes of silica gels.4
While the impact of silanol groups on water adsorption has been readily studied for the past few decades, there are limited investigations on how silica functionality impacts the adsorption of other components of natural gas. Note that natural gas is primarily composed of methane (CH4) but can also contain carbon dioxide (CO2), hydrogen sulfide (H2S), water (H2O), and heavier hydrocarbons (ethane, propane, butane, etc.).5 Of interest, Kim and Jang conducted a molecular simulation study on the adsorption of CO2 on amorphous silica surfaces.6 The authors demonstrated that water adsorption on silica reduces the adsorption of CO2,6 an effect also observed in experimental systems.7 Furthermore, lowering the silanol concentration on the silica surface reduced the amount of CO2 adsorbed.6 Another molecular dynamics simulation by Mohammed et al.8 showed that CO2 and CH4 both preferred the silanol sites over CH3-terminated silica surfaces. These computational studies support increasing the silanol concentration to increase the affinity of natural gas components to silica surfaces.
While computational studies indicate that increasing the surface silanol concentrations of silica gels would increase the affinity of CO2 and CH4 to the silica, no lab-scale experiments have investigated these correlations.9 Correlations for the adsorption of H2S on a silica surface are uncommon and only one study reports the isosteric heat of adsorption for H2S on a silica gel in the literature. Additionally, H2S is a difficult species to work with due to the inherent toxicity of the fluid;10 thus, adsorption experiments with pure H2S are uncommon. Investigations into the adsorption behavior of the major components of natural gas are important for modeling applications, where multicomponent adsorption models can be used to estimate the separation of mixtures on an adsorbent bed.
In this work, the adsorption of the natural gas components H2S, CH4, and CO2 was measured using a manometric adsorption instrument on two silica materials. The isosteric heats of adsorption and the adsorption capacities of H2S, CH4, CO2, and H2O of different silica materials were compared to the silanol concentration of the silica gels and results on how the porosity, specific surface area, and silanol concentration of the silica gels impact the adsorption of the different components were discussed.
2. Results and Discussion
2.1. Material Characterization
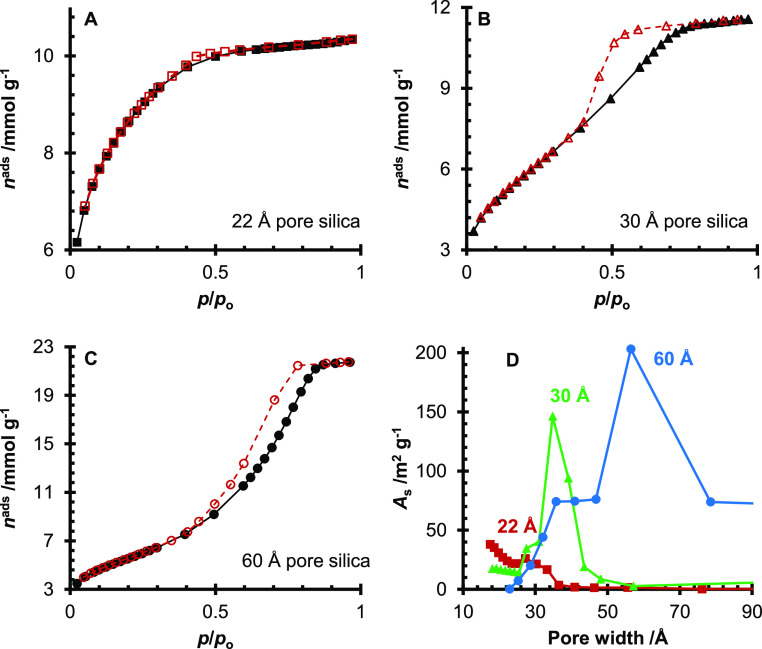
The specific surface area, porosity, and silanol concentration of the three silica gels are reported in Table 1. As expected, the 22 Å pore size silica has the greatest specific surface area of the three silica gels, and it is the only silica gel with a measured microporosity from the t-plot. In addition, TGA of silanol groups on the silica surface showed that the 22 Å pore size silica had the greatest concentration of silanol groups. When the N2 physisorption of the silica gels was analyzed, the 22 Å pore size silica showed a type I isotherm (Figure 1A), while the 30 and 60 Å pore size silicas showed type IV isotherms (Figure 1B,C). All three silica gels showed hysteresis during the desorption, but the 22 Å pore size silica showed minimal hysteresis around p/po = 0.4–0.5. The hysteresis loop of the 30 Å pore silica gel resembles the H2(a) type, typical of silica gels with a complex pore structure.11 The 60 Å pore silica showed a type H1 hysteresis loop, typical of uniform mesopores.11 From the distribution of surface area over the different pore sizes, as shown in Figure 1D, there is a clear maximum surface area for the 30 and 60 Å pore size silicas at wpore = 35 Å and wpore = 56 Å, respectively. In contrast, the 22 Å pore size silica continues to increase in the micropore region. The number of silanol groups per nm2 (αtotal) for the three silica gels is in the range of αtotal = 2.152–2.516 OH nm–2, which is lower than Zhuravlev’s number of αtotal = 4.9 OH nm–2 for the average silanol concentration on silica gels.12
Table 1. Surface Area, Porosity, and Silanol Concentrations of the Three Silica Gels.
| 22 Å pore size silica | 30 Å pore size silica | 60 Å pore size silica | |
|---|---|---|---|
| ABET/m2 g–1 | 641 ± 12 | 470 ± 2 | 453.5 ± 0.6 |
| Amicropore. t-plot/m2 g–1 | 201 | ||
| Vpore/cm3 g–1 | 0.40 | 0.52 | 1.07 |
| Vmicropore. t-plot/cm3 g–1 | 0.10 | ||
| δtotal/mmol g–1a | 2.678 ± 0.001 | 1.828 ± 0.005 | 1.621 ± 0.004 |
| αtotal/OH nm–2b | 2.516 ± 0.001 | 2.340 ± 0.006 | 2.152 ± 0.006 |
| αvicinal/OH nm–2 | 0.8793 ± 0.0004 | 0.471 ± 0.001 | 0.489 ± 0.001 |
| αgeminal+isolated/OH nm–2 | 1.6371 ± 0.0008 | 1.869 ± 0.005 | 1.663 ± 0.005 |
The silanol concentration as mmol g–1.
The silanol concentration normalized to the number of silanols per nm2.
Figure 1.
N2 adsorption isotherms at T = 77 K for the 22 (A), 30 (B), and 60 Å (C) pore size silica gels. For (A–C), black symbols (solid black lines) represent adsorption and red symbols (dashed red lines) represent desorption. The As versus pore width plot for the 22 Å (red. □), 30 Å (green, Δ), and 60 Å (blue, ○) pore size silica gels (D). For all four graphs, the lines connecting the points guide the eye.
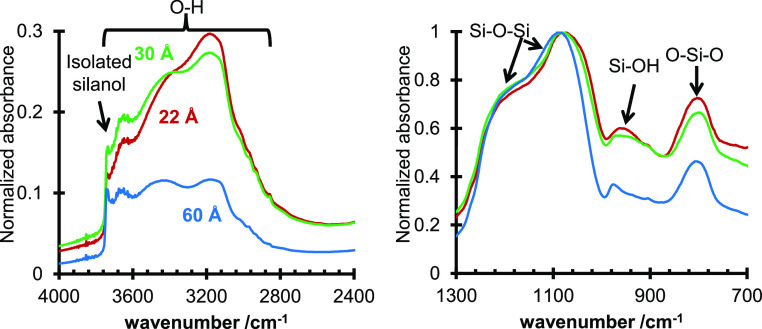
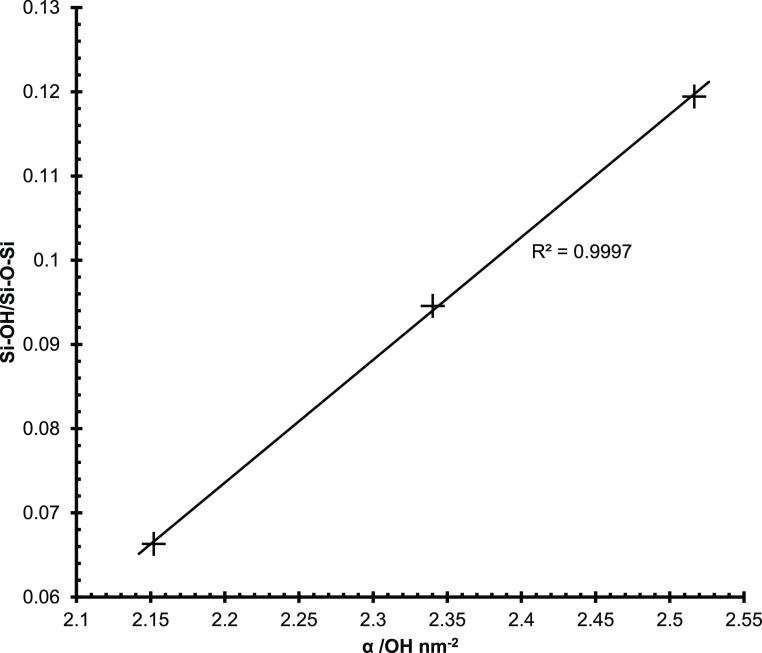
All three silica gels showed an isolated silanol peak at ∼3740 cm–1 in the diffuse reflectance infrared Fourier transform (DRIFT) spectra (Figure 2).3 Interestingly, there are three peaks within the OH stretching range at 3120–3280, 3360–3520, and ∼3680 cm–1 for all three silica gels, but with varying peak heights between materials which likely correspond to hydrogen bonding of adsorbed water to different adsorption sites. The Si–O–Si peaks were observed in the range of 1060–1100 and ∼1220 cm–1.13 The 60 Å pore size silica had the smallest silanol peak at ∼980 cm–1 of the three silicas, while the 22 and 30 Å pore size silicas showed similar shapes and sizes for the silanol peak. A qualitative assessment of the DRIFT results indicates that the 60 Å pore size silica has the least number of silanol groups of the three silica gels. The 22 and 30 Å pore silicas showed similar DRIFT spectra. Analysis of the silanol concentration of the three silica gels was done by comparing the ratio of the maximum peaks for the silanol groups (∼980 cm–1) with the bulk silica (∼1100 cm–1). Comparing the Si–OH/Si–O–Si ratio from the DRIFT spectra with the silanol numbers from the TGA experiments shows a linear correlation with an R2 = 0.9997 between the two methods, indicating agreement between the two techniques for the silanol concentrations (Figure 3).
Figure 2.
DRIFT spectra of the 22 Å (red), 30 Å (green), and 60 Å (blue) silica gels.
Figure 3.
atios of Si–OH (∼950 cm–1) and Si–O–Si (∼1100 cm–1) vs the silanol number of the three silica gels. The solid line indicates a linear fit.
2.2. Adsorption Isotherms
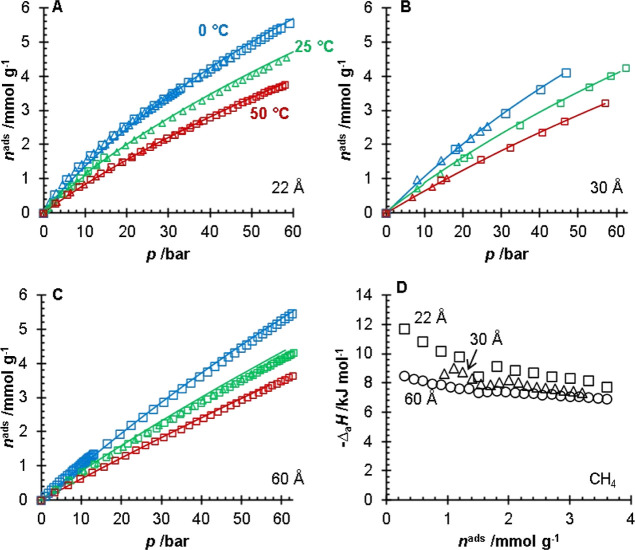
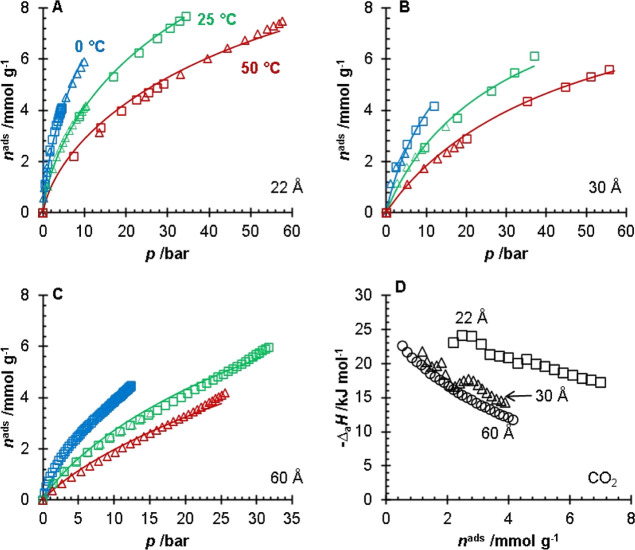
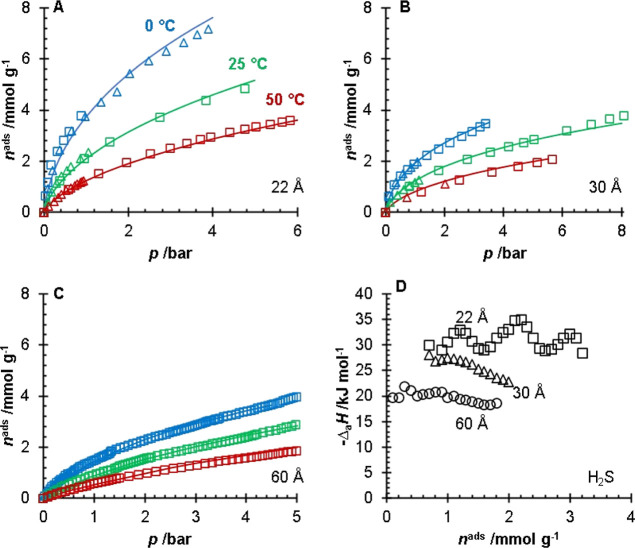
The adsorption isotherms of CH4 (Figure 4), CO2 (Figure 5), and H2S (Figure 6) are shown in Figures 4–6 for the 22, 30, and 60 Å pore size silica gels. The fitting parameters for the modified Tóth equation are presented in Table 2, and the isosteric heats of adsorption are presented in Table 3. The adsorption isotherms for the 60 Å pore size silica gel were collected previously by Wynnyk et al.9 on the same adsorption instrument and the data were refit for the modeling used in this work. The adsorption affinity for the sour gas components on all three silica gels followed the H2O > H2S > CO2 > CH4 order. Silanol groups are polar moieties capable of hydrogen bonding with species such as H2O. Due to polarity and polarizability, it is reasonable that the H2S molecules would have stronger interactions with the silanol groups than the non-polar and relatively unpolarizable CO2 and CH4 molecules. The data on H2S, CO2, and CH4 adsorption for the 22 and 30 Å pore size silica gels are presented in the Supporting Information; this included the uncertainties of the measurements. The water adsorption data for the 22 and 30 Å pore size silica gels and the adsorption of H2S, CO2, CH4, and H2O for the 60 Å pore size silica gel have been previously reported in the literature.9,14
Figure 4.
CH4 adsorption isotherms (A–C) for the 22 (A), 30 (B), and 60 Å (C) pore size silica gels. For (A–C) the different symbols (□, Δ) represent replicates of the experiments and the lines represent a fitted modified Tóth equation collected at T = 0 °C (blue), 25 °C (green), and 50 °C (red). The isosteric heats of adsorption (D) of CH4 for the 22 Å (black, □), 30 Å (black, Δ), and 60 Å (black, ○) pore size silica gels. The data for the 60 Å pore size silica gel were obtained and replotted from the work of Wynnyk et al.9
Figure 5.
CO2 adsorption isotherms (A–C) for the 22 (A), 30 (B), and 60 Å (C) pore size silica gels. For (A–C) the different symbols (□, Δ) represent replicates of the experiments and the lines represent a fitted modified Tóth equation collected at T = 0 °C (blue), 25 °C (green), and 50 °C (red). The isosteric heats of adsorption (D) of CO2 for the 22 Å (black, □), 30 Å (black, Δ), and 60 Å (black, ○) pore size silica gels. The data for the 60 Å pore size silica gel were obtained and replotted from the work of Wynnyk et al.9
Figure 6.
H2S adsorption isotherms (A–C) for the 22 (A), 30 (B), and 60 Å (C) pore size silica gels. For (A–C) the different symbols (□, Δ) represent replicates of the experiments and the lines represent a fitted modified Tóth equation collected at T = 0 °C (blue), 25 °C (green), and 50 °C (red). The isosteric heats of adsorption (D) of H2S for the 22 Å (black, □), 30 Å (black, Δ), and 60 Å (black, ○) pore size silica gels. The data for the 60 Å pore size silica gel were obtained and replotted from the work of Wynnyk et al.9
Table 2. Fitting Parameters for the Modified Tóth Equation.
| pore size | fluid | n∞/mmol g–1 | b°/bar–1 | -ΔHTóth/kJ mol–1 | A | B/K–1 | MSSE |
|---|---|---|---|---|---|---|---|
| 22 Å | CH4 | 4.58 × 10² | 7.42 × 10⁻⁶ | 9.20 | 2.46 × 10⁻¹ | 4.28 × 10⁻⁴ | 4.60 × 10⁻³ |
| CO2 | 5.57 × 10² | 4.29 × 10⁻⁶ | 20.39 | 1.70 × 10⁻¹ | 2.89 × 10⁻⁵ | 1.71 × 10⁻² | |
| H2S | 17.46 | 1.05 × 10⁻⁵ | 26.69 | 6.46 × 10⁻¹ | –7.68 × 10⁻⁴ | 6.9 × 10⁻³ | |
| H2O15 | 35.12 | 2.33 × 10⁻⁵ | 34.9 | 9.02 | –1.98 × 10⁻⁵ | ||
| 30 Å | CH4 | 29.04 | 1.12 × 10⁻⁴ | 7.99 | 9.67 × 10⁻¹ | 1.03 × 10⁻⁴ | 6.77 × 10⁻³ |
| CO2 | 17.93 | 2.09 × 10⁻⁵ | 17.43 | 2.09 × 10⁻¹ | 1.57 × 10⁻³ | 3.24 × 10⁻² | |
| H2S | 73.50 | 1.09 × 10⁻⁵ | 25.30 | 1.69 × 10⁻¹ | 1.10 × 10⁻⁴ | 1.37 × 10⁻² | |
| H2O15 | 22.88 | 1.38 × 10⁻⁴ | 30.2 | 3.07 | –5.26 × 10⁻³ | ||
| 60 Å | CH4 | 3.44 × 10² | 1.08 × 10⁻⁵ | 7.46 | 1.00 | 2.12 × 10⁻⁴ | 7.25 × 10⁻³ |
| CO2 | 2.00 × 10² | 4.64 × 10⁻⁶ | 16.55 | 1.74 × 10⁻¹ | 4.70 × 10⁻⁴ | 1.08 × 10⁻² | |
| H2S | 11.20 | 3.48 × 10⁻⁵ | 19.77 | –7.64 × 10⁻² | 2.64 × 10⁻³ | 4.75 × 10⁻³ | |
| H2O | 4.40 × 10⁵ | 3.34 × 10⁻⁴ | 18.42 | 9.99 × 10⁻² | –7.50 × 10⁻⁵ | 1.52 × 10⁻² |
Table 3. Isosteric Heats of Adsorption of the Silica Gels.
| ΔaH/kJ mol–1 | loading/mmol g–1 | H2O | CH4 | CO2 | H2S |
|---|---|---|---|---|---|
| Literature | 48,16 47.9,17 45.618 | 10.30,19 6.6,20 14.87321 | 22.3,19 24.96721 | ||
| 22 Å | 0 | 34.78 ± 0.04a | 12.5 ± 0.3 | 26.8 ± 0.4 | 31.3 ± 1.1 |
| 1.5 | 34.78 ± 0.04a | 8.7 ± 0.2 | 24.7 ± 0.4 | 31.2 ± 1.1 | |
| 30 Å | 0 | 30.66 ± 0.06a | 9.3 ± 0.2 | 23.4 ± 0.5 | 31.1 ± 0.5 |
| 1.5 | 30.20 ± 0.06a | 8.4 ± 0.1 | 19.9 ± 0.5 | 25.2 ± 0.4 | |
| 60 Å | 0 | 23.3 ± 1.6b | 8.2 ± 0.1b | 23.4 ± 0.3b | 21.1 ± 0.3b |
| 1.5 | 18.7 ± 1.3b | 7.6 ± 0.1b | 18.9 ± 0.2b | 19.0 ± 0.3b |
The isosteric heat of adsorption for water was lower than the literature values. The CO2 isosteric heat measured on the silica gels in this work overlaps with the values reported in the literature. The CH4 isosteric heat is within the range reported in the literature (Table 3). Differences in silanol concentrations can explain the different experimental and literature values in the isosteric heats presented in Table 3. It should be noted that the only study we could find reporting the isosteric heat for H2S on silica gel was the work of Wynnyk et al.9 reported for the 60 Å pore size silica gel, which was used and discussed in this work.
2.3. Adsorption Trends
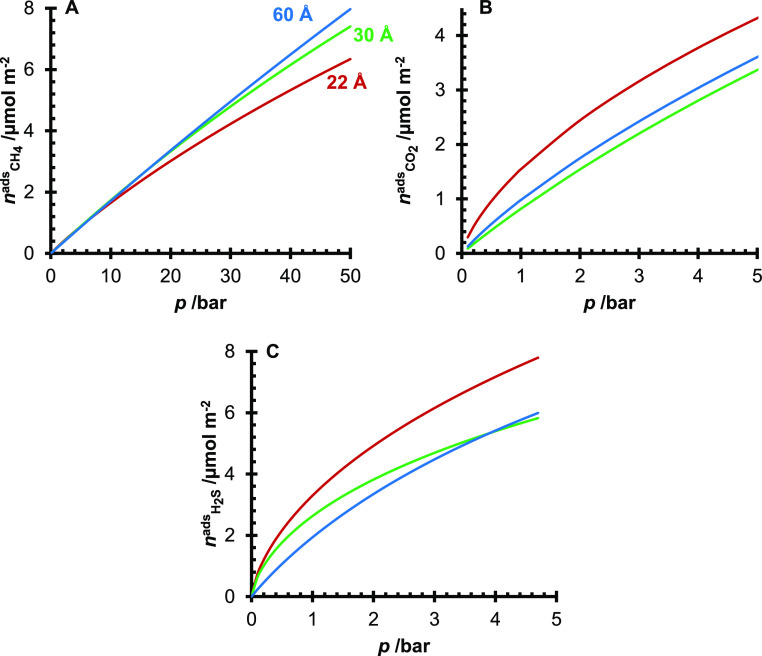
The amount of adsorbed CH4, CO2, and H2S was modeled using the fitted modified Tóth equation at T = 25 °C and shows specific to surface area versus mass (mmol m–2 instead of mmol g–1) in Figure 7. Surface specific adsorption was plotted to highlight the influence of the silanol concentrations on the adsorption of the four sour gas components. Figure 7A shows no significant difference in the CH4 adsorption below p = 10 bar. However, at higher pressures, it is observed that the amount of CH4 adsorbed on the surface is perhaps weakly related to the silanol concentrations of the three silicas, where the 60 Å pore size silica has the highest capacity. In contrast, the 22 Å pore size silica has the lowest capacity. In the literature, it has been shown that, on carbon surfaces, changes in the functional group concentrations can change the bulk attraction of molecules to the surface.22,23 Important factors from the computational analysis are the size of the adsorbates and the intermolecular forces (dipole moments and polarizabilities of the molecules).
Figure 7.
Modeled adsorption isotherms of CH4 (A), CO2 (B), and H2S (C) on the 22 Å (red), 30 Å (green), and 60 Å (blue) pore size silica gels.
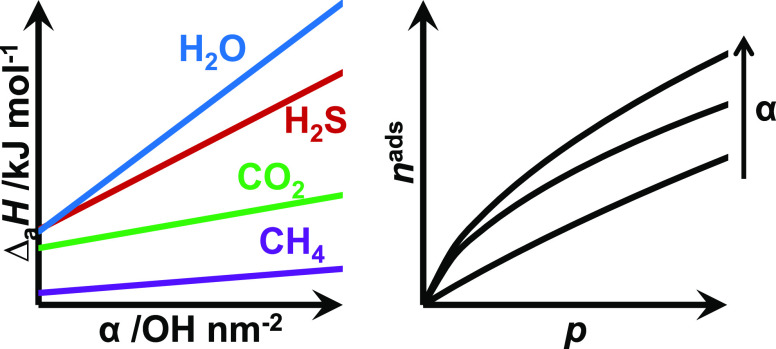
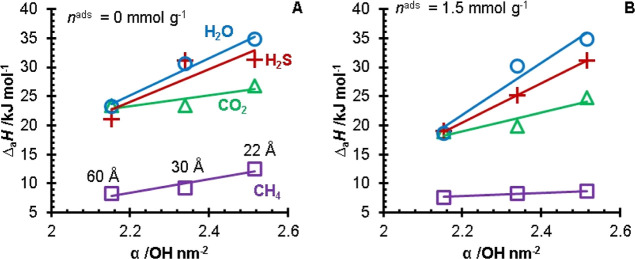
A plot of the isosteric heats of adsorption versus the surface silanol concentrations of the three silica gels is presented in Figure 8 to evaluate the influence of the silanol groups on the adsorption of sour gas components. For all four components, the enthalpy of adsorption increased with the silanol concentration. The isosteric heat versus silanol concentration slope was greatest for water, followed by H2S, CO2, and CH4. The difference in slopes shows that the stronger interactions of hydrogen bonding (H2O) and polarizability (H2S) with the silica surface are greater than non-hydrogen bonding and low polarizable molecules such as CH4. A computational study by Kim et al.24 investigated the adsorption of H2S on α-quartz surfaces. The computations demonstrated that cleaved silica was the preferred adsorption site for H2S. The largest concentration of uncoordinated active sites on the silica surface will be the edges of the silica pores. It would then stand to reason that a more porous silica gel would have a greater concentration of active sites (geminal silanol groups) and thus have a greater affinity for H2S. This observation is supported by Figure 8, where the larger concentration of silanol groups results in a larger isosteric heat of adsorption.
Figure 8.
sosteric heats of adsorption at nads = 0 mmol g–1 (A) and nads = 1.5 mmol g–1 (B) for H2O (blue, ○) as reported in the literature, H2S (red, +), CO2 (green, Δ), and CH4 (purple, □) versus the silanol concentrations of the three silica gels. The heats of adsorption for the 60 Å pore size silica were calculated from the data of Wynnyk et al.15 The H2O heats of adsorption for the 22 and 30 Å pore size silicas were calculated from the data of Jacobs et al.9 Solid lines indicate linear fits.
It should be noted that of the three silica gels, the 60 Å pore size silica has the largest pore volume, while the 22 Å has the smallest. Thus, it is likely that at pressures greater than p = 10 bar, the adsorption mechanism (for CH4) becomes a volume-filling mechanism over a surface coverage mechanism. In Figure 7B (CO2 adsorption), the 60 Å pore size silica gel had a greater capacity than the 30 Å. However, relative to the 22 Å pore size silica, the capacities of the 30 and 60 Å pore size silicas were similar. For the H2S adsorption (Figure 7C), the 30 Å pore size silica gel had a greater capacity than the 60 Å pore size silica gel until around p = 4 bar, where the 60 Å pore size silica gel had a higher amount of adsorbed H2S. The crossover in the amount of adsorbed H2S is likely due to the larger pore volume of the 60 Å pore silica gel.
2.4. Multicomponent Adsorption Modeling
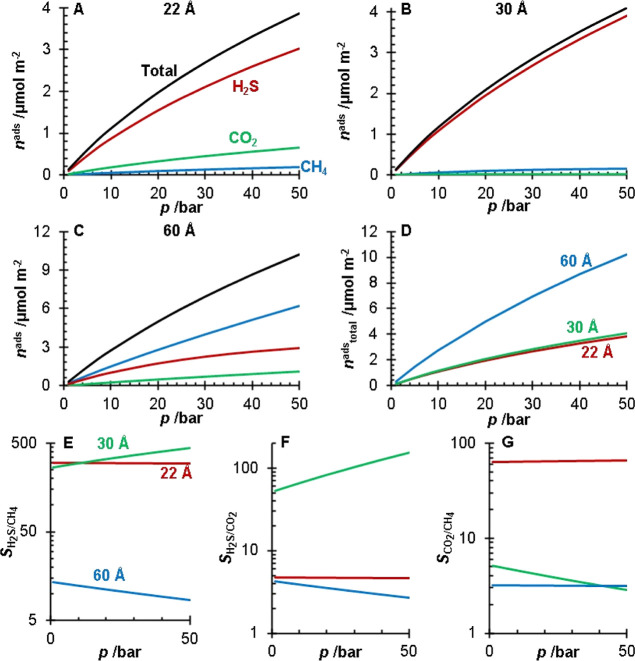
Multicomponent adsorption of a 0.9:0.05:0.05 CH4/CO2/H2S was calculated using the fitted modified Tóth equations for the silica gels determined above. The multicomponent adsorption calculations were conducted using the Ideal Adsorbed Solution Theory (IAST) of Myers and Prausnitz.25 The multicomponent adsorption was calculated at T = 25 °C over the p = 1–50 bar pressure range. The results of the IAST calculations are presented in Figure 9. The IAST calculations show that the 22 and 30 Å pore size silicas adsorb more H2S than CH4 or CO2, while the 60 Å pore size silica adsorb more CH4 (Figure 9A–C). The IAST selectivities indicated that the 22 and 30 Å pore size silicas had a much greater selectivity of H2S over CH4 (SH2S/CH4 > 250). The 60 Å pore size silica showed a higher selectivity for H2S over CH4 (SH2S/CH4 > 8); however, it was not as great as the other silicas. The increased silanol concentration could explain this difference, as it was shown in Figure 8 that increasing the silanol concentration had a more significant impact on the affinity of H2S to the surface than CH4.
Figure 9.
IAST calculations for a 0.9:0.05:0.05 CH4/CO2/H2S gas mixture at T = 25 °C and p = 1–50 bar for the 22 (A), 30 (B), and 60 Å (C) pore size silicas. For graphs (A–C), the total amount adsorbed (black) and the amounts adsorbed of CH4 (blue), CO2 (green), and H2S (red) are presented. Graph (D) compares the total amount adsorbed for the 22 Å (red), 30 Å (green), and 60 Å (blue) pore size silicas. The H2S/CH4 (E), H2S/CO2 (F), and CO2/CH4 (G) selectivities for the 22 Å (red), 30 Å (green), and 60 Å (blue) pore size silicas are reported.
Comparing the total amount adsorbed between the silica gels (Figure 9D) shows that the larger pore volume silica (60 Å pore size) had a greater total amount adsorbed than the other silicas due to the larger available volume for molecules to occupy. Interestingly, the multicomponent adsorption of the 22 Å pore size silica shows some competition between H2S and CO2. The 22 Å pore size silica showed higher selectivity for H2S over CO2 (SH2S/CO2 > 4.5). The 30 Å pore size silica showed little competition between H2S and CO2, with a H2S selectivity (SH2S/CO2 > 52) an order of magnitude greater than the 22 and 60 Å pore size silicas. The 60 Å pore size silica showed the lowest selectivities of the three silicas.
Data on the adsorption of sour gas components can be used in modeling applications to estimate multicomponent behavior. The IAST model was used in this work to estimate the adsorption of a CH4/CO2/H2S mixture at various pressures. The IAST model is often insufficient for modeling at higher pressures or in systems where the strength of the intermolecular forces of the adsorbates are too dissimilar.26−28 While the IAST calculations agree with the correlations in Figure 7, there are no experimental multicomponent adsorption results to validate the IAST calculations.
This work demonstrated that changes in silanol concentration of the silica surface impact the adsorption of natural gas components beyond water. Specifically, H2S was most influenced by changes in the silanol concentrations. Multicomponent modeling by IAST demonstrated that as the silanol concentration increased, so did the adsorption of H2S. Interestingly, the silica with the intermediate concentration of silanol groups (the 30 Å pore size silica) had the greatest selectivity for H2S, while the 22 Å pore size silica showed greater amounts of CO2 adsorbing. The 60 Å pore size silica had the lowest H2S and CO2 selectivities of the silicas, indicating a greater adsorptive competition with CH4.
Silica gels have been used industrially for adsorption separation since World War I.29 The most common industrial application of silica gels is as a desiccant. This is due to a high selectivity toward water over other compounds and a relatively low cost of production compared to other desiccants, such as zeolites.
Materials such as zeolites have a very high affinity to water, and it has been demonstrated that when water is present in multicomponent sour gas mixtures that the amounts of adsorbed H2S and CO2 drop significantly.7 The adsorption of water was not accounted for in the IAST modeling as IAST is known to fail in the estimation of water adsorption when the intermolecular forces of other adsorbates are weaker (i.e., CH4 and CO2).24 The multicomponent adsorption model proposed by Wynnyk has successfully estimated high-pressure adsorption equilibria of sour gas on zeolites 4A and 13X, but the model did not do well for calculating the adsorption on silica gel.14 The optimization of models, such as Wynnyk’s model, requires experimental multicomponent adsorption data to validate the model. Unfortunately, for this work, the multicomponent adsorption of sour gas components could not be collected and is left for future studies.
3. Conclusions
It is known that the adsorption of water on silica gels is primarily affected by the concentration of silanol groups on the silica surface. However, the role of silanol groups on the adsorption of other adsorbates is less studied. This work presents adsorption isotherms for CH4, CO2, and H2S on 22 and 30 Å pore size silica gels at T = 0, 25, and 50 °C. The isosteric heats of adsorption for CH4, CO2, H2S, and H2O on the 22 and 30 Å pore size silica gels and a third 60 Å pore size silica gel were compared to the total silanol concentration of the silica gels. It was found that the molecules with stronger intermolecular forces (hydrogen bonding and polarizability; H2O and H2S) had a more significant dependence on the silanol surface concentration than the molecule with weaker interactions (CH4). The comparison of adsorption on the surface of the three silica gels showed that for CH4 at low pressures (p < 10 bar) that there was no significant difference between the three silica gels. However, H2S adsorption at low surface coverage was higher on silica gels with a higher silanol concentration. Multicomponent modeling by IAST showed that silica gels with a higher silanol concentration had a greater H2S/CH4 selectivity, while the silanol with the lowest concentration of silanol groups showed the lowest H2S and CO2 selectivities of the silicas. These results shed light on the interactions of molecules such as H2S on the surface of silica gels and how the surface concentrations of silanol groups can affect the adsorption of sour gas components.
4. Methods
4.1. Materials
For these experiments, CO2 (Laser grade, 99.9995%), CH4 (99.999%), H2S (99.6%), and nitrogen (N2, 99.998%) were purchased from Praxair Canada Inc. (Mississauga, Ontario, Canada). Helium (He, 99.9990%, Alphagaz 1) was purchased from Air Liquide. Gas purities were confirmed by gas chromatography (TCD/FID and SCD). Two silica gels (22 Å pore size silica gel, high purity, Davisil Grade 12, 28–200 mesh; 30 Å pore size silica gel, high purity, Davisil Grade 923, 100–200 mesh) were purchased from Sigma-Aldrich. A third silica gel (60 Å pore size silica gel: high purity, Davisil Grade 9385, 130–270 mesh) was purchased from Merck. The silica gel materials were used without modification.
4.2. Safety Considerations
The volumetric adsorption apparatus used to collect CH4, CO2, and H2S was designed to operate with high-pressure H2S. The adsorption instrument was located inside a walk-in bay equipped with wall-mounted gas detectors, high-velocity ventilation, and a caustic scrubbing system to absorb H2S during the depletion of the instrument.
4.3. Material Characterization
The silica gels’ specific surface area and pore size distribution were characterized by N2 physisorption using a 3Flex (Micromeritics) instrument. The silica gels were degassed at T = 150 °C under a vacuum of p = 1.33 × 10⁻⁷ bar for at least 12 h. Scanning electron microscopy imaging was conducted with an FEI quanta 250 FEG scanning electron microscope equipped with a GATAN monoCL4 detector. DRIFT spectroscopy was conducted on the silica gels by an FT-IR spectrometer with a diffuse reflectance accessory using Resolutions Pro software. For all DRIFT experiments, samples were placed in a vacuum oven at T = 100 °C for 24 h and then promptly mixed with potassium bromide (KBr) in a 0.02:0.98 sample/KBr mass ratio.
As discussed in the previous literature, the silanol group characterization was carried out using a continuous flow thermogravimetric analyzer (SETARAM LABSYS evo) with a He flow (10 mL min–1).3,15 Following was the temperature program:
-
(i)
the sample was equilibrated at T = 25 °C for 2 h,
-
(ii)
the system was heated at 5 °C min–1 until a temperature of T = 200 °C was reached and then the temperature was maintained for 2 h,
-
(iii)
the system was heated at 5 °C min–1 until a temperature of T = 400 °C was reached and then the temperature was maintained for 2 h, and
-
(iv)
the system was heated at 5 °C min–1 until a temperature of T = 1000 °C was reached and then the temperature was maintained for 2 h.
The mass lost below T = 200 °C was attributed to physisorbed water on the silica gels, mass lost in the range of T = 200–400 °C was attributed to water released due to the condensation of vicinal silanol groups and the mass lost in the range of T = 400–1000 °C was attributed to water released due to the condensation of isolated and geminal silanol groups.30
4.4. Manometric Adsorption
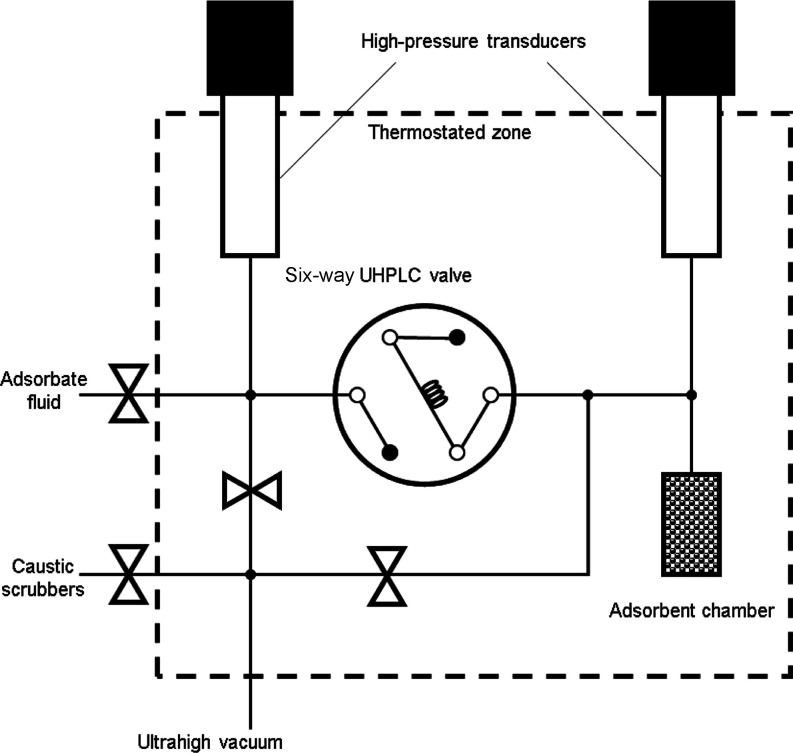
The CH4, CO2, and H2S adsorption isotherms were measured using an in-house-built manometric adsorption instrument, which has been reported elsewhere (Figure 10).9,14,31−33 The adsorption isotherms were collected at T = 0.000 ± 0.005, 25.000 ± 0.005, and 50.000 ± 0.005 °C. The silica gels were activated at T = 150 °C under an ultra-high vacuum (p = 1 × 10⁻¹⁰ bar) for at least 12 h between isotherms.
Figure 10.
Schematic of the manometric adsorption instrument, adapted from the work of Wynnyk et al.31 UHPLC stands for ultra-high-pressure liquid chromatography.
All fluid thermodynamic properties were calculated by the appropriate equation of state (CO2,34 CH4,35 H2S,36 H2O,37 and He38) as provided within the Reference Fluid Thermodynamic and Transport Properties V9.1 (REFPROP, NIST).39
During the adsorption experiments, the system’s temperature, the pressure of the adsorption cell (pads, bar), and the pressure of the reference cell (pref, bar) were measured. The number of moles introduced (nint, mol) to the adsorption cell was calculated by multiplying the difference in density of the adsorption cell (ρads, mol L–1) and the reference cell (ρref, mol L–1) by the dosing loop volume (Vdose, cm3), eq 1. The amount adsorbed (nads, mol) was then calculated by eq 2.
| 1 |
| 2 |
The void volume (Vvoid, cm3) can be calculated by either helium expansion for excess adsorption or multiplying the adsorbent’s mass by the adsorbent’s crystal density (ρcrys, g cm–3). The crystal density can be calculated for amorphous materials by taking the inverse sum of the bulk material volume (Vbulk, cm3 g–1) and the adsorbent pore volume (Vpore, cm3 g–1), as described in eq 3.
| 3 |
The uncertainty of the manometric experiments was determined for nads at each recorded pressure by the propagation of random error. The uncertainties for the 95% confidence interval are reported in the Supporting Information.
4.5. Adsorption Isotherms
The modified Tóth equation (eq 4) was used with fugacity (f, bar) instead of partial pressure to model the adsorption isotherms.40
| 4 |
where n∞ (mmol g–1) is the infinite capacity, b (bar–1) is the affinity parameter, t (unitless) is a heterogeneity parameter, and bo (bar–1) is the infinite adsorption parameter which contributes to Henry’s constant. Both b and t have a temperature dependence, shown in eqs 5 and 6.
| 5 |
| 6 |
where ΔaH (kJ mol–1) is the isosteric heat of adsorption and A (unitless) and B (K–1) are empirical parameters. Here, B corresponds to a constant change in heat capacity. The isosteric heat of adsorption was determined by the methods described in the following section. The value used in the modified Tóth equation was the averaged isosteric heat over the measured loading.
The modified Tóth equation was fit to the experimental data by minimizing the mean summed square error.
4.6. Isosteric Heat of Adsorption
The isosteric heat of adsorption (ΔaH) was calculated using the equations of Titoff and Hückel from the absolute amount adsorbed.41 The methods of Defay et al. are used in this work,42 where ΔaH is estimated by calculating the pure component fugacity for the corresponding absolute amount adsorbed at different temperatures, eq 7.
| 7 |
A least-squares regression is used to obtain the slope for the fugacities at T = 0.000 ± 0.005, 25.000 ± 0.005, and 50.000 ± 0.005 °C. The fugacities were calculated via a cubic spline fit and were only interpolated within the measured data and were not extrapolated. Note that using a spline fit provides a more direct measurement with respect to surface loading (along with standard deviation), versus eq 5, which assumes a constant enthalpy according to the isotherm. From the resulting ΔaH versus nads plot, a linear regression was fit and used to determine the ΔaH at nads = 0. In addition, interpolations were made for comparison at nads = 1.5 mmol g–1, which is within the majority of the experimental points for all adsorbates.
4.7. Ideal Adsorbed Solution Theory Calculations
The multicomponent adsorption calculations were conducted using the IAST theory of Myers and Prausnitz.22 The IAST model works by defining the fugacity of component i as the adsorbate mole fraction (xi) multiplied by a hypothetical pure component fugacity (fi°, bar) that gives an equivalent spreading pressure (π) for all components in the mixture. Note that for this work fugacity was used instead of pressure.
| 8 |
The spreading pressures were defined by eq 9, where yi is the adsorptive mole fraction. The integral presented in eq 9 does not have an analytical solution when the pure component adsorption isotherm is defined by the modified Tóth equation. To solve the integral for the spreading pressures, the algorithm proposed by Do was used to iteratively solve the IAST model.23 The initial estimate for the spreading pressure was determined using the analytical solution for the Langmuir equation to eq 9 (eq 10), where the ni∞ and bi values were obtained from the modified Tóth equation of species i.
| 9 |
| 10 |
The selectivity between components i and j (Si/j) for the multicomponent adsorption was calculated as the ratio of partition coefficients (Ki) for components i and j.
| 11 |
Acknowledgments
The funding for this research was provided through the Natural Science and Engineering Research Council of Canada (NSERC) and Alberta Sulphur Research Ltd. (ASRL) Industrial Research Chair in Applied Sulfur Chemistry. In addition to NSERC, the authors are grateful to the feedback from the member companies of ASRL.
Supporting Information Available
The Supporting Information is available free of charge at https://pubs.acs.org/doi/10.1021/acsomega.3c01366.
Tabulated adsorption data (PDF)
The authors declare no competing financial interest.
Supplementary Material
References
- Gas Processors Supplier’s Assoc. (GPSA), Engineering Data Book; Tulsa, OK, 1987.
- A Christy A. Effect of Heat on the Adsorption Properties of Silica Gel. Int. J. Eng. Technol. 2012, 4, 484–488. 10.7763/IJET.2012.V4.416. [DOI] [Google Scholar]
- Saliba S.; Ruch P.; Volksen W.; Magbitang T. P.; Dubois G.; Michel B. Combined Influence of Pore Size Distribution and Surface Hydrophilicity on the Water Adsorption Characteristics of Micro- and Mesoporous Silica. Microporous Mesoporous Mater. 2016, 226, 221–228. 10.1016/j.micromeso.2015.12.029. [DOI] [Google Scholar]
- Alcañiz-Monge J.; Pérez-Cadenas M.; Lozano-Castelló D. Influence of Pore Size Distribution on Water Adsorption on Silica Gels. J. Porous Mater. 2010, 17, 409–416. 10.1007/s10934-009-9317-0. [DOI] [Google Scholar]
- Marriott R. A.; Pirzadeh P.; Marrugo-Hernandez J. J.; Raval S. Hydrogen Sulfide Formation in Oil and Gas. Can. J. Chem. 2016, 94, 406–413. 10.1139/cjc-2015-0425. [DOI] [Google Scholar]
- Kim K. C.; Jang S. S. Molecular Simulation Study on Factors Affecting Carbon Dioxide Adsorption on Amorphous Silica Surfaces. J. Phys. Chem. C 2020, 124, 12580–12588. 10.1021/acs.jpcc.0c03035. [DOI] [Google Scholar]
- Steuten B.; Pasel C.; Luckas M.; Bathen D. Trace Level Adsorption of Toxic Sulfur Compounds, Carbon Dioxide, and Water from Methane. J. Chem. Eng. Data 2013, 58, 2465–2473. 10.1021/je400298r. [DOI] [Google Scholar]
- Mohammed S.; Sunkara A. K.; Walike C. E.; Gadikota G. The Role of Surface Hydrophobicity on the Structure and Dynamics of CO2 and CH4 Confined in Silica Nanopores. Front. Clim. 2021, 3, 713708. 10.3389/fclim.2021.713708. [DOI] [Google Scholar]
- Wynnyk K. G.; Hojjati B.; Marriott R. A. Sour Gas and Water Adsorption on Common High-Pressure Desiccant Materials: Zeolite 3A, Zeolite 4A, and Silica Gel. J. Chem. Eng. Data 2019, 64, 3156–3163. 10.1021/acs.jced.9b00233. [DOI] [Google Scholar]
- Adeniyi K. I.; Wan H. H.; Deering C. E.; Bernard F.; Chisholm M. A.; Marriott R. A. High-Pressure Hydrogen Sulfide Experiments: How Did Our Safety Measures and Hazard Control Work during a Failure Event?. Safety 2020, 6, 15. 10.3390/safety6010015. [DOI] [Google Scholar]
- Thommes M.; Kaneko K.; Neimark A. V.; Olivier J. P.; Rodriguez-Reinoso F.; Rouquerol J.; Sing K. S. W. Physisorption of Gases, with Special Reference to the Evaluation of Surface Area and Pore Size Distribution (IUPAC Technical Report). Pure Appl. Chem. 2015, 87, 1051–1069. 10.1515/pac-2014-1117. [DOI] [Google Scholar]
- Zhuravlev L. T. The Surface Chemistry of Amorphous Silica. Zhuravlev Model. Colloids Surf., A 2000, 173, 1–38. 10.1016/S0927-7757(00)00556-2. [DOI] [Google Scholar]
- Cappeletti L. B.; Moncada E.; Poisson J.; Butler I. S.; Santos J. H. Z. D. Determination of the Network Structure of Sensor Materials Prepared by Three Different Sol-Gel Routes Using Fourier Transform Infrared Spectroscopy (FT-IR). Appl. Spectrosc. 2013, 67, 441–447. 10.1366/12-06748. [DOI] [PubMed] [Google Scholar]
- Wynnyk K. G.High-pressure Adsorption Equilibria Aimed at Optimizing Sour Gas Conditioning. Ph.D. Dissertation, University of Calgary, Calgary, Alberta, Canada, 2019. [Google Scholar]
- Jacobs J. H.; Deering C. E.; Sui R.; Lesage K. L.; Marriott R. A. Degradation of Desiccants in Temperature Swing Adsorption Processes: The Temperature Dependent Degradation of Zeolites 4A, 13X and Silica Gels. Chem. Eng. J. 2023, 451, 139049. 10.1016/j.cej.2022.139049. [DOI] [Google Scholar]
- Wang Y.; LeVan M. D. Adsorption Equilibrium of Binary Mixtures of Carbon Dioxide and Water Vapor on Zeolites 5A and 13X. J. Chem. Eng. Data 2010, 55, 3189–3195. 10.1021/je100053g. [DOI] [Google Scholar]
- Demir H.; Mobedi M.; Ülkü S. Microcalorimetric Investigation of Water Vapor Adsorption on Silica Gel. J. Therm. Anal. Calorim. 2011, 105, 375–382. 10.1007/s10973-011-1395-y. [DOI] [Google Scholar]
- Chakraborty A.; Saha B. B.; Koyama S.; Ng K. C.; Srinivasan K. Adsorption Thermodynamics of Silica Gel–Water Systems. J. Chem. Eng. Data 2009, 54, 448–452. 10.1021/je800458k. [DOI] [Google Scholar]
- de Lange R. S. A.; Hekkink J. H. A.; Keizer K.; Burggraaf A. J.; Ma Y. H. Sorption Studies of Microporous Sol-Gel Modified Ceramic Membranes. J. Porous Mater. 1995, 2, 141–149. 10.1007/BF00489722. [DOI] [Google Scholar]
- Kennedy D. A.; Mujcin M.; Trudeau E.; Tezel F. H. Pure and Binary Adsorption Equilibria of Methane and Nitrogen on Activated Carbons, Desiccants, and Zeolites at Different Pressures. J. Chem. Eng. Data 2016, 61, 3163–3176. 10.1021/acs.jced.6b00245. [DOI] [Google Scholar]
- Shen Y.; Shi W.; Zhang D.; Na P.; Fu B. The Removal and Capture of CO2 from Biogas by Vacuum Pressure Swing Process Using Silica Gel. J. CO2 Util. 2018, 27, 259–271. 10.1016/j.jcou.2018.08.001. [DOI] [Google Scholar]
- Tan S. J.; Do D. D.; Chew J. W. The Physisorption Mechanism of SO2 on Graphitized Carbon. Phys. Chem. Chem. Phys. 2020, 22, 21463–21473. 10.1039/D0CP03860A. [DOI] [PubMed] [Google Scholar]
- Liu L.; Tan S.; Do D. D.. Computer Simulation and Experimental Studies of Various Environmental Gases (NH3, CH2O, SO2, H2S, Benzene, Water) on Carbon Materials. In Porous Materials; Moreno-Piraján J. C., Giraldo-Gutierrez L., Gómez-Granados F., Eds.; Springer International Publishing: Cham, 2021; pp 79–111. [Google Scholar]
- Kim H. J.; Jeon H.; Shin Y.-H. H2S Adsorption Process on (0001) α -Quartz SiO2 Surfaces. J. Appl. Phys. 2018, 124, 115301. 10.1063/1.5037500. [DOI] [Google Scholar]
- Myers A. L.; Prausnitz J. M. Thermodynamics of Mixed-Gas Adsorption. AIChE J. 1965, 11, 121–127. 10.1002/aic.690110125. [DOI] [Google Scholar]
- Do D. D.Adsorption Analysis: Equilibria and Kinetics; Series on chemical engineering; Imperial College Press: London, 1998. [Google Scholar]
- Walton K. S.; Sholl D. S. Predicting Multicomponent Adsorption: 50 Years of the Ideal Adsorbed Solution Theory. AIChE J. 2015, 61, 2757–2762. 10.1002/aic.14878. [DOI] [Google Scholar]
- Jacobs J. H.; Chou N.; McKelvie K. H.; Commodore J. A.; Sui R.; Lesage K. L.; Wynnyk K. G.; Xiao Y.; Biesinger M. C.; Hill J. M.; Marriott R. A. Screening Activated Carbons Produced from Recycled Petroleum Coke for Acid Gas Separation. Carbon Trends 2023, 10, 100243. 10.1016/j.cartre.2022.100243. [DOI] [Google Scholar]
- Ruthven D. M.Principles of Adsorption and Adsorption Processes; Wiley: New York, 1984. [Google Scholar]
- Nawrocki J. The Silanol Group and Its Role in Liquid Chromatography. J. Chromatogr. A 1997, 779, 29–71. 10.1016/S0021-9673(97)00479-2. [DOI] [Google Scholar]
- Wynnyk K. G.; Hojjati B.; Pirzadeh P.; Marriott R. A. High-Pressure Sour Gas Adsorption on Zeolite 4A. Adsorption 2017, 23, 149–162. 10.1007/s10450-016-9841-6. [DOI] [Google Scholar]
- Wynnyk K. G.; Hojjati B.; Marriott R. A. High-Pressure Sour Gas and Water Adsorption on Zeolite 13X. Ind. Eng. Chem. Res. 2018, 57, 15357. 10.1021/acs.iecr.8b03317. [DOI] [Google Scholar]
- Jacobs J. H.; Wynnyk K. G.; Lalani R.; Sui R.; Wu J.; Montes V.; Hill J. M.; Marriott R. A. Removal of Sulfur compounds from Industrial Emission Using Activated Carbon Derived from Petroleum Coke. Ind. Eng. Chem. Res. 2019, 58, 18896–18900. 10.1021/acs.iecr.9b04443. [DOI] [Google Scholar]
- Span R.; Wagner W. A New Equation of State for Carbon Dioxide Covering the Fluid Region from the Triple-Point Temperature to 1100 K at Pressures up to 800 MPa. J. Phys. Chem. Ref. Data 1996, 25, 1509–1596. 10.1063/1.555991. [DOI] [Google Scholar]
- Setzmann U.; Wagner W. A New Equation of State and Tables of Thermodynamic Properties for Methane Covering the Range from the Melting Line to 625 K at Pressures up to 100 MPa. J. Phys. Chem. Ref. Data 1991, 20, 1061–1155. 10.1063/1.555898. [DOI] [Google Scholar]
- Lemmon E. W.; Span R. Short Fundamental Equations of State for 20 Industrial Fluids. J. Chem. Eng. Data 2006, 51, 785–850. 10.1021/je050186n. [DOI] [Google Scholar]
- Wagner W.; Pruß A. The IAPWS Formulation 1995 for the Thermodynamic Properties of Ordinary Water Substance for General and Scientific Use. J. Phys. Chem. Ref. Data 2002, 31, 387–535. 10.1063/1.1461829. [DOI] [Google Scholar]
- Ortiz Vega D. O.A new wide range equation of state for helium-4. Ph.D. Dissertation, Texas A & M University, 2013. [Google Scholar]
- Lemmon E. W.; Bell I. H.; Hubaer M. L.; McLinden M. O.; NIST . Reference Fluid Thermodynamics and Transport Properties - REFPROP; National Institute of Standards and Technology: Gaithersburg, 2013.
- Tóth J. State Equations of the Solid-Gas Interface Layers. Acta Chim. Acad. Sci. Hung. 1971, 69, 311–328. [Google Scholar]
- Hückel E. Theory of Heat Evolved in Capillary Condensation. Trans. Faraday Soc. 1932, 28, 382–386. 10.1039/TF9322800382. [DOI] [Google Scholar]
- Defay R.; Prigogine I.; Bellemans S.; Everett D. H.. Surface Tension and Adsorption; Longmans: London, 1966. [Google Scholar]
Associated Data
This section collects any data citations, data availability statements, or supplementary materials included in this article.


