

Abstract
Scope
Fighting obesity and associated comorbidities through dieting is not always sustained and results in a subsequent weight gain, a phenomenon referred to as weight cycling. Diet is among the most important factors in modifying the composition of gut microbiota. The objective of this work is to determine whether weight cycling affects the composition and the predicted function of mouse fecal bacteria on a long‐term basis.
Methods and results
Mice fed for 40 weeks with either high fat (HF), low fat (LF), or cycled diets (starting and ending by one of the two diets, and the reverse) exhibit a bacterial profile specific to each of the four groups. A higher proportion of Firmicutes and Bacteroidota phyla are observed in mice on Hf and LF diet, respectively. The proportion of functions dedicated to amino acid metabolism is higher in mice on HF or LF/HF diets, whereas the mice on LF or HF/LF diets have a higher proportion of functions involve in carbohydrate metabolism and vitamin B biosynthesis.
Conclusion
Compared to continuous HF or LF diets, cyclic diet specifically alters the composition and function of the mouse fecal microbiota, suggesting that fight against weight gain should be considered on a long‐term basis.
Keywords: Akkermansia, gut, mice, microbiota, weight
Fighting obesity through dieting is not always sustained and results in a subsequent weight gain, a phenomenon referred to as weight cycling. We determined whether weight cycling affects mouse fecal bacteria on a long‐term basis. Compared to continuous High Fat (HF) or Low Fat (LF) diets, cyclic diet specifically alters the composition and function of the mouse fecal microbiota.
1. Introduction
The worldwide prevalence of obesity has nearly tripled over the last 40 years. In 2016, 39% of adults aged 18 years and over were overweight while about 13% of the world's adult population was obese.[ 1 ] Overweight and obesity are critical public health issues worldwide and are associated with increased risk of many non‐communicable diseases, including non‐insulin dependent diabetes mellitus, coronary heart disease and stroke, and different types of cancer.[ 2 ] The etiology of obesity illustrates the complex interactions between genetic and environmental factors, including a sedentary lifestyle and an energy‐rich diet.
Diet is considered as one of most important factors that modify the composition of the gut microbiota.[ 3 ] Indeed, the human gut microbiome contains more than five million genes, thus outnumbering the genetic potential of the host by two orders of magnitude.[ 4 ] This arsenal of gene products causes a wide range of biochemical and metabolic activities that complement host physiology.[ 5 ] The majority of bacteria found in human microbiota belong to five phyla (Firmicutes, Bacteroidota, Actinobacteriota, Proteobacteria, and Verrucomicrobiota), while the less common belong to the phyla Cyanobacteria, Fusobacteriota, Lentisphaerota, and Spirochaetota.[ 6 ] Studies of the intestinal microbiota have helped understand how gut bacteria influence the risk of developing several diseases related to overweight or obesity, such as hypertension[ 7 ] and cardiovascular diseases,[ 8 ] and identified a relationship between microbiota, on the one hand, and obesity and associated co‐morbidities, on the other.[ 9 ]
It is now accepted that a high fat diet has a major impact on the composition of fecal microbiota, in both the long term[ 9 , 10 , 11 ] (several weeks) and the short term (within 1 day).[ 12 ] In general, being overweight is associated with a decrease in the overall diversity and in the proportion of the Bacteroidota phylum and an increase in Firmicutes phylum.[ 13 ] However, these general assumptions have to be considered with caution since each individual fecal microbiota is composed of 500 to 1000 species, of which only a few dozen comprise a phylogenetic core shared by all humans. Thus, individual variability exceeds the differences observed between obese and lean people.[ 14 ] In the human population, the number of confounding factors such as genetic background, living environment, initial microbial composition, or characterization of diet have led to some differences between studies.[ 14 ] Animal models such as mice have regularly been used to avoid these confounding factors, while enabling a better understanding of the relationship between gut microbiota and obesity.[ 9 , 14 ]
Although the relationship between obesity and fecal microbiota composition has been the subject of several studies, analyses of the functional traits of this complex bacterial compartment are rare. Since one of the main causes of obesity is a chronic imbalance between excessive caloric intake and energy expenditure, some studies suggest that differences in gut microbial ecology between humans of different weights may be linked to energy homeostasis. Considering the metabolic aspects of the microbiota, the hypothesis is thus that obese and lean individuals have distinct microbiotas that differ in their ability to extract energy from food and store that energy as fat.[ 9 ]
The alarming increase in the prevalence of obesity has led to continuous medical and scientific efforts to promote weight loss. Although many dietary approaches have proven their effectiveness, in the vast majority of cases, weight loss is not maintained but is even followed by weight regain that exceeds the initial weight.[ 15 ] In humans, the metabolic disturbances associated with overweight and obesity can be worse in subjects with alternating cycles of weight loss and gain.[ 15 ] This cycle of weight gain and loss is referred to as the yo‐yo effect, and it was recently shown in a short term trial in rodents that post‐diet weight regain is controlled by the identity of the gut microbiota, in which a microbial signature persists even after successful dietary restrictions in obese mice.[ 16 ] When high fat (HF) and low fat (LF) diets alternate, ensuing marked fluctuations in body weight and fat mass are associated with changes in glucose metabolism and altered secretion of endocrine and cytokine factors (e.g., resistin, IGF‐1, IL6).[ 17 ] Nevertheless, weight cycled mice and mice fed a LF diet had a comparable lifespan that far exceeded the lifespan of HF obese mice.[ 17 ] Taken together, these results underline the importance of studying the gut microbiota in animal models subjected to diet‐induced weight cycling on a long term basis.[ 16 ]
The objective of this work was thus to characterize the composition of the fecal bacteria of weight‐cycled mice in a long term, i.e., 40‐week experiment, and to compare it with the composition of fecal bacteria in corresponding HF and LF diet controls.[ 17 ] The potential functional characteristics of the microbiota were inferred using Phylogenetic Investigation of Communities by Reconstruction of Unobserved States (PICRUSt2).[ 18 ]
2. Results
2.1. Body Weight of Mice on the HF, LF, or Cyclic Diets
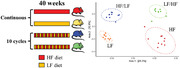
To study the influence of a cyclic diet on the composition of the fecal microbiota, we fed mice for 40 weeks with either a continuous high fat (HF) or low fat (LF) diet or a cyclic diet consisting in 4 weeks on a HF diet followed by 4 weeks on a LF diet. The last group was divided into two subgroups, one started with the HF diet and ended with the LF diet and the other started with the LF diet and ended with the HF diet. First, the weight of the mice in each group was monitored over time. As expected, the weight gain over 40 weeks was significantly higher in mice on the HF diet (+40 g) than in mice on the LF diet (+19 g) (Figure 1 ). Over the first 20 weeks, the weight loss fully compensated for the weight gain and enabled the weight‐cycled mice to recover a comparable mass to that of mice fed the chronic LF diet. However, after 20 weeks, regardless of the weight loss during their period on the LF diet, mice fed the cyclic diet weighed more than mice fed the chronic LF diet. On the other hand, over the study period, mice subjected to a cyclical diet never grew as fat as mice subjected to a chronic HF diet (Figure 1).
Figure 1.
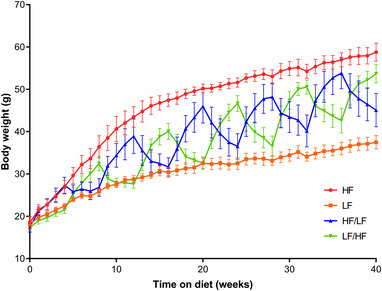
Changes in body weight over time in mice on a high fat (HF) diet (in red), low fat (LF) diet (in orange), HF/LF cyclic diet (in blue), and a LF/HF cyclic diet (in green). Data are shown as means ± SEM.
2.2. Fecal Bacterial Composition of Mice on HF, LF, or Cyclic Diets
The bacterial composition of fecal samples was analyzed by high throughput sequencing of the V4 hypervariable region of bacterial 16S rRNA coding gene. An almost ideal distinction between groups of mice on the different diets was observed with sequencing, where PCoA of weighted Unifrac distances of fecal microbiota composition clustered almost perfectly according to the diet of the mice (Figure 2A). Since the first principal coordinate explained 38% of the variance, our results showed that the composition of the fecal microbiota of mice fed the chronic HF diet and the cyclic LF/HF diet differed considerably from the fecal microbiota of mice fed the chronic LF diet and the cyclic HF/LF diet. Moreover, the second principal coordinate, which explained 16% of variance, made it possible to distinguish the composition of fecal microbiota between groups of mice fed the chronic diets and groups fed the cyclic diets. Similar results were obtained using Jaccard, weighted and unweighted Unifrac distances (Figure 2B–D). These results showed that the kinetics of exposure to the four different diets had a huge influence on—and differently affected—fecal bacterial composition.
Figure 2.
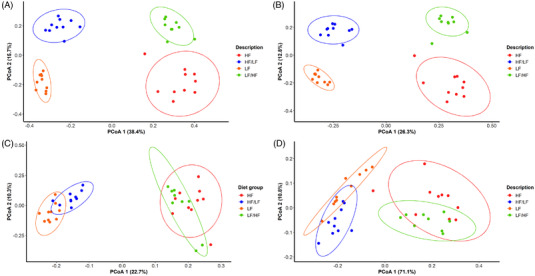
Beta diversity of fecal sample of mice on HF, LF, LF/HF, or HF/LF diets. Principal coordinate analysis (PCoA) of A) Bray‐Curtis distances (R 2 = 0.61, p‐value = 0.001). B) Jaccard distance (R 2 = 0.47, p‐value = 0.01), C) unweighted unifrac (R 2 = 0.34, p‐value = 0.02), D) weighted unifrac (R 2 = 0.72, p‐value = 0.04).
Measurement of bacterial species diversity within each dietary group (alpha‐diversity) clearly showed that mice on HF chronic diets displayed significant lower diversity than mice on the LF diet, whereas the alpha‐diversity of mice on the cyclic LF/HF and HF/LF diet was intermediate between that of mice on the two chronic diets (Shannon and Simpson indexes, Figure 3A,B, respectively). Chao and ACE indexes were not significantly different among dietary groups (data not shown).
Figure 3.
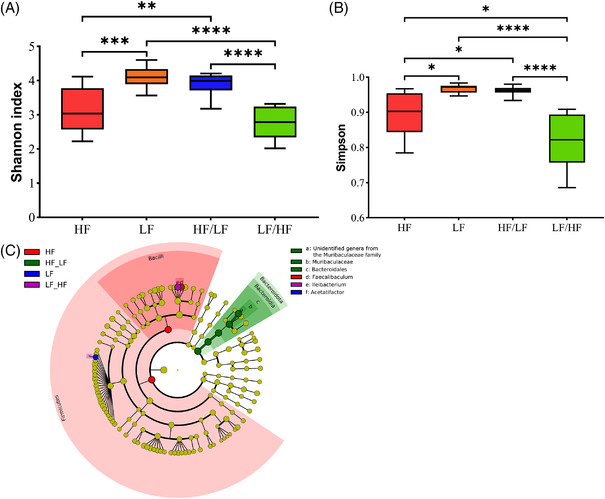
Microbial diversity of fecal sample of mice on HF, LF, LF/HF, or HF/LF diets. A) Shannon, B) Simpson, C) Cladogram of microbiota analysis (LEfSe). **—p ≤ 0.01, ***—p ≤ 0.001, ****—p ≤ 0.0001 used for Shannon and Simpson indices.
To identify the main bacteria responsible for the differences in each dietary group, a cladogram was performed (Figure 3C). Over‐representation of the phylum of Firmicutes (class Bacilli, genus Faecalibaculum) compared to other phyla was characteristic of mice on the HF diet. By contrast, mice on the LF diet were characterized by a higher proportion of the genus Acetatifactor. Interestingly, the fecal bacterial composition of mice on cyclic HF/LF diets displayed an increased proportion of the phylum Bacteroidota (family Muribaculaceae), whereas mice on the cyclic LF/HF diet were characterized by an increase in the proportion of the genus Ileibacterium (phylum Firmicutes).
To examine the phylogeny of the microbiota of mouse fecal samples in more detail, the proportion of the bacteria at different taxonomic levels was analyzed (Figure 4 , Table S3, Supporting Information). At the phylum level, Firmicutes and Bacteroidota accounted for the majority of bacteria present in mouse feces. However, their respective proportion varied markedly depending on the diet. The fecal microbiota of mice on the LF and HF/LF diets contained a high proportion of Bacteroidota (55% and 67%, respectively), while mice on the HF and LF/HF diets had a higher proportion of Firmicutes (16% and 23%, respectively). The Firmicutes/Bacteroidota ratios were 8.4, 0.9, 0.5, and 3.7 for mice on HF, LF, HF/LF, and LF/HF diets, respectively. The average ratios were significantly different between, the two continuous diets, but not between the two cyclic diets (data not shown).
Figure 4.
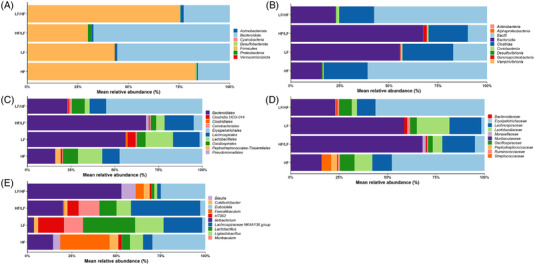
Top 10 taxa of bacteria from feces from mice on HF, LF, HF/LF or LF/HF diets. A) Phylum. B) Class. C) Order. D) Family. E) Genus.
The proportion of the class Bacilli (order Erysipelotrichales, family Erysipelotricaceae) was higher in mice on the HF and LF/HF diets, while the proportion of the class Bacteroidia (order Bacteroidales, family Muribaculaceae) was higher in mice on the LF and cyclic HF/LF diets (Figure 4). The proportion of the Clostridia class remained similar across the different dietary groups. Within the order Lactobacillales, higher proportions of the Lactobacillaceae family were detected in mice fed the LF and HF diets, while the proportions of Streptococcaceae and Peptostreptococcaceae were higher in mice fed the HF diet. Higher proportions of the genera Lactobacillus and Ligilactobacillus were detected in mice on LF or cyclic HF/LF diets. A higher proportion of the genus Dubosiella was detected in mice on HF and cyclic LF/HF diets. The genus Akkermansia (phylum Verrucomicrobiota) was detected only in fecal samples from mice on the LF diet (data not shown).
2.3. Functional Analysis of Fecal Bacterial Microbiota
Since phylogeny and biomolecular functions are strongly correlated, we predicted the functional potential of fecal bacterial communities from phylogeny, using techniques such as PICRUSt2 (Figure 5 ).[18] Compared to mice on the LF diet, microbiota from mice on the HF diet had a higher proportion of functions dedicated to amino acid synthesis (Figure 5A). By contrast, microbiota from mice on the LF diet had a higher proportion of gene coding functions involved in the metabolism of carbohydrates (rhamnose, pentoses, etc.) and in the biosynthesis of vitamins from group B (B1, B5).
Figure 5.
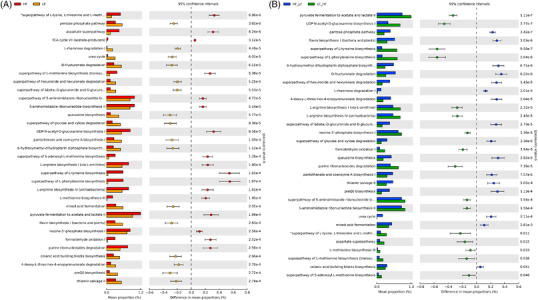
PICRUSt2 analysis of microbiota composition of mice on the on the HF or LF diets A) and on the cyclic diets B).
Similar differences between the two groups were found in the microbiota of mice on cyclic diets (HF/LF and LF/HF) and in the microbiota of mice on chronic diets (Figure 5B). Thus, the proportion of functions dedicated to amino acid synthesis was higher in the fecal microbiota of mice on the LF/HF diet than in the fecal microbiota of mice on HF/LF diet, whereas the proportion of gene coding functions involved in carbohydrate metabolism and biosynthesis of vitamins from group B was higher in mice on the HF/LF diet than in mice on the LF/HF diet.
Mice on the chronic LF diet had a similar proportion of the different functional groups as mice that received the LF diet at the end of the cycle (i.e., HF/LF). This was also true for HF and LF/HF mice (data not shown).
3. Discussion
In this work, we showed that, compared to chronic high fat (HF) or low fat (LF) diets, a cyclic diet consisting of alternating periods of 4 weeks of HF diet with 4 weeks of LF diet, specifically affected the composition of mouse fecal bacteria. We also confirmed that consumption of HF and LF diets had a major impact on the diversity as well as on the proportion of the different bacterial groups in the mice fecal microbiota.
Attempts to lose weight are often accompanied by the use of diets with alternating phases of low‐calorie intake, and “escape” phases characterized by high‐calorie input. Compared to chronic HF or LF diets, we showed that, over our 40‐week experiment, the cyclic diets significantly affected overall weight gain, which was lower than that of mice on the chronic HF diet. These results are consistent with some previously published data[ 17 ] but disagree with other data indicating that mice on cyclic diets have an overall higher[ 19 ] or a similar weight gain[ 16 ] to mice on HF diets. Such discrepancies may be due to differences in the models used (composition of the diet and mouse strains), in the duration of the experiments, and in the number of diet/weight regain cycles. Nonetheless, as previously observed,[ 16 , 17 ] the net weight gain, measured over identical periods of high calorie feeding, was found to be consistently higher in the weight cycling group than in mice fed a chronic HF diet. The notable weight gain observed during the high‐calorie diet stages of mice on a cyclic diet suggests the subsequent appearance of significant metabolic alterations or pathologies. However, the lifespan of mice on the cyclic diets was similar to that of mice on the LF diet (114 weeks) and much longer than that of the mice on the HF diet (77 weeks)[ 17 ] indicating that the deleterious effects of HF diet can be mitigated when the diet is regularly reversed to LF.[ 17 , 20 ]
Although many studies have shown that the nature of the diet, such as an HF diet, can shape the diversity and proportion of the gut microbiota, the reported variations differ from one study to another and are sometimes contradictory.[ 21 ] This is particularly the case in studies in humans in whom there is great variability in many parameters, including genetic background, environment, and the specific nature of the diet.[ 22 ] But this has also been the case in studies in rodent models, even though confounding factors such as genetic background, diet, and environment were better controlled.[ 21 ] Whatever the impact of diets on the microbiota, changes were found to take place extremely rapidly. Thus, germ free mice inoculated with human fecal microbiota underwent changes associated with consumption of western type diet (i.e., high fat and high sucrose) within only 1 day and were still stable after 7 days.[ 23 ]
As obesity is a real public health issue, most of the studies that analyzed the impact of a diet on the composition of the microbiota mainly focused on HF diets. However, this does not accurately reflect the behavior of obese individuals who are subject to the “yo‐yo effect”, i.e., alternate cycles of weight loss and regain. By studying variations in the composition of the microbiota over a long‐term period alternating phases of weight gain and loss, our study came closer to the real physio‐pathological conditions encountered. We showed that, whatever the nature of the diet (LF or HF) that ends the cycle, the composition of microbiota of the mice on a cyclic diet differed from that of mice on a continuous diet. However, despite these differences, we observed that the composition of the microbiota at the end of a cycle resembled that of the corresponding continuously fed mice. Thus, the composition of the microbiota of mice ending their cycle with a LF diet resembled that of mice continuously fed a LF diet, while the reverse was true in mice that ended their cycle with a HF diet. Taken together, these results suggest that, at the end of the 10 cycles, the last 4 weeks on a given diet did not give the microbiota sufficient time to recover the same composition as that of mice on continuous diets. The composition of fecal bacterial has already been shown to be similar 7 days and 2 months after shifting to the HF diet.[ 23 ] The composition of the fecal microbiota changed dramatically after three weeks on the HF diet and did not return to the initial composition following the consumption of the LF diet.[ 16 ] The neat separation on the PCoA representation of the microbiota composition of the mice from the four dietary groups is similar to the one obtained by Thaiss et al.[ 16 ] after two cycles. These results thus suggest that a cyclic diet results in a specific intermediate microbial composition.
Microbiota originating from obese donors has been considered to be obesogenic.[ 13 , 21 , 24 ] Thus, even before the onset of obesity, HF diet‐induced alteration of microbiota composition could lead to a series of metabolic alterations in the host that contribute to obesity.[ 25 ] Therefore, the microbiota of obese mice could favor the development of metabolic complications upon second exposure to a HF diet.[ 16 ] Alternating phases of weight gain and weight loss are associated with profound metabolic alterations and subsequent increases and decreases in leptin, resistin, glucose‐dependent insulin releasing polypeptide, IGF‐1, glucose, insulin, and glucose tolerance, respectively.[ 17 , 20 ] However, our study showed that, even after a long period of cyclic feeding comprising 10 cycles, these mice weighed less than mice on the HF diet. Moreover, the lifespan of mice on cyclic diets was similar to that of mice on the LF diet, despite the fact they were overweight and had consumed a HF diet for half of their life.[ 17 ] Taken together, these results suggest that the metabolic alterations that occur during the HF diet phases are largely counterbalanced during the LF diet phases. Thus, monitoring gut microbial composition after each cycle period should provide a better understanding of the events that explain the overall positive effect of the cyclic diet compared to the HF diet.[ 17 , 20 ]
The Firmicutes/Bacteroidota ratio is already considered to be an important factor linked with obesity. Even if it remains to be formally demonstrated, this ratio can increase in the case of overweight.[ 9 , 14 , 26 ] In fact, an increase in Firmicutes has been regularly linked with facilitated extraction of energy from ingested foods and increased energy storage in adipose tissue, resulting in more efficient absorption of calories.[ 13 , 24 , 27 ] In our study, a marked increase in the proportion of Firmicutes was observed in mice on either the HF diet or on LF/HF diets. More precisely, the classes Erysipelotrichi and Bacilli were more represented in the microbiota of mice on the HF and LF/HF diets. Such an increase in the proportion of Erysipelotrichi (Firmicutes) has also been reported in mice fed a Western‐type diet (enriched in fat and carbohydrate).[ 23 ]
The proportions of the Bacteroidota phylum and of all the following phylogenetic levels were higher in mice on the LF and HF/LF diets. Even if the contribution of Bacteroidota to the lean phenotype remains to be proven,[ 14 ] many studies have shown that an increase in the proportion of this phylum has a positive effect on health. This could be the consequence of its super ability to use polysaccharides, such as mucosal glycans, in the diet or in the host.[ 28 , 29 ]
While the role of Bacteroidota remains to be more clearly determined in both the lean and obese phenotypes, the role of Akkermansia muciniphila, one of the most abundant single species in the human microbiota (0.5–5% of the total bacteria), is better understood. In fact, it has been isolated and characterized as a mucin using specialist, and to be inversely associated with obesity, diabetes, cardiometabolic diseases, and low‐grade inflammation. Moreover, it was also less abundant in the intestinal microbiota of both genetic and diet‐induced obese and diabetic mice.[ 30 , 31 , 32 ] Interestingly, we only identified the Akkermansia genus in microbiota of mice on the LF diet, thereby supporting the hypothesis that this genus is closely linked to the lean phenotype.
In order to help establish a functional hypothesis on the changes observed in the fecal bacterial composition, we used the PICRUSt2 software to predict the functional potential of fecal bacterial communities based on marker gene sequencing profiles.[ 18 ] In contrast to compositional data where each group of mice had a specific microbiota, we found that predicted functions were similar in mice on high fat/low fat diets or their cyclic counterparts. Indeed, mice on the chronic LF and on cyclic HF/LF diets had a higher proportion of functions dedicated to the biosynthesis of group B vitamins and carbohydrate metabolism. Mice on the HF or LF/HF diets had a higher proportion of functions dedicated to amino acid synthesis. This suggests that even if the fecal bacterial composition was drastically affected by cyclic diet, their predicted functions were less affected.
Some bacteria are systematically associated with health promoting effects. This is the case of bacteria belonging to the Lactobacillus genera that are widely used as probiotics thanks to their many beneficial health effects such as reducing diarrheal episodes in young children or reducing the risk of developing allergies.[ 33 , 34 ] In the present study, a higher proportion of the order Lactobacillales was observed in mice on continuous diets (HF and LF) than in mice on cyclic diets. In fact, higher proportions of the family Lactobacillaceae (Lactobacillus genus) were found in mice on the LF diet and lower proportions were found in mice on cyclic diets, while the family Streptococcaceae was found more frequently in mice on the HF diet.[ 33 , 34 ]
In conclusion, we have demonstrated alteration in the composition and function of the intestinal microbiota in all four groups of mice on both continuous and cyclic diets. While a cyclic diet is generally considered to be negative due to the increase in weight gain during the HF period, the results of our study suggest that in mice, weight cycling is nevertheless more beneficial than continuous obesity and that the fight against weight gain should be considered on a long‐term basis.
4. Experimental Section
Animals
All experiments involving mice were performed using protocols and procedures approved by the Ohio University Animal Care and Use Committee (IACUC 12‐H‐026). Male C57BL/6J (4‐week‐old) mice were purchased from Jackson Labs (Bar Harbor, ME, USA) and housed in the animal facility of the Edison Biotechnology Institute. Rooms were kept on a 14‐h light/10‐h dark cycle in a temperature‐controlled environment (23 °C). Mice were provided ad libitum access to food and water (diets described below).
Diets
Mice (5 weeks of age) were placed on one of the following four diets: 1) a high‐fat (HF) diet (5.21 kcal g−1) in which 60% of energy comes from fat, 20% from carbohydrates, and 20% from protein (# D12492, Research Diets, New Brunswick, NJ, USA Table S1, Supporting Information) (n = 10); 2) a standard chow (LF) diet (4.10 kcal g−1) in which 14% of energy comes from fat, 60% from carbohydrates, and 26% from protein (ProLab RMH 3000, LabDiet, St. Louis, MO, USA Table S2, Supporting Information) (n = 10); 3) a cycled diet in which mice alternated between 4 weeks on the LF diet followed by 4 weeks on the HF diet (LF/HF) (n = 10); 4) a reverse cycled diet in which mice alternated between 4 weeks on the HF diet followed by 4 weeks on the LF diet (HF/LF) (n = 9). The 4 weeks duration was chosen since it allowed to go back to the weight of the mice on LF diet as described previously.[ 17 ] Mice were housed 9–10 per cage in large 45 cm × 24 cm microisolator cages.
Fecal Collection
Fecal samples were collected from mice on each diet (see above) after 40 weeks of feeding, which coincided with the end of a cycle for both cyclic groups (i.e., at the end of 4 weeks of weight loss on the LF diet for HF/LF mice and at the end of 4 weeks of weight gain on the HF diet for LF/HF mice). Mice were placed on a stainless‐steel benchtop cleaned with a 70% ethanol solution. Defecation was expedited by gently massaging the animal's back until five to six fecal pellets were collected. The benchtop and utensils to pick up the fecal pellets were cleaned after the fecal material was collected from each mouse. Fecal material was not included if the mouse urinated in the same area as the fecal material.
Extraction and Purification of Total Genomic DNA from Mice Feces
Total DNA was extracted from mice feces using the QIAamp DNA Stool Mini kit (Qiagen, Courtaboeuf, France) according to the manufacturer's protocol with one slight modification: a mechanical lysis step using an amalgamator with zirconium beads (Multi bead‐beater, Biospec Products Inc., VWR, Fontenay sous Bois, France) was added to maximize bacterial lysis. DNA quality was assessed by separation on agarose gel and ethidium bromide staining. The amount of DNA was assessed using a Nanovue spectrophotometer (GE Health care, Uppsala, Sweden). All DNA extracts were stored at −20 °C until analysis.
Analysis of Fecal Microbiota using High Throughput Sequencing
The V4 hypervariable region of bacterial 16S rRNA was sequenced in paired‐end mode (2 × 300 bp) on the MiSeq platform (Illumina) using primers 351F and 926R. Demultiplexed sequences were obtained, and the Divisive Amplicon Denoising Algorithm 2 (DADA2) R package was used to remove low quality reads, to de‐noise, and remove chimeric sequences.
Only forward reads were used for the analysis due to the small amount of overlap between forward and reverse reads following DADA2 trimming and quality filtering. The outputs from DADA2 Amplicon Sequence Variants (ASVs) were assigned to taxonomies using the Ribosomal Database Project, Naïve Bayesian classifier[ 35 ] using SILVA 16S rRNA database version 138.1.[ 36 , 37 ] Sequences were rarefied at 2535 reads per sample to determine bacterial α and β‐diversity using the phyloseq R package.[ 38 ] All alpha‐diversity metrics (Chao, Abundance‐based Coverage Estimators (ACE), Simpson and Shannon) were then plotted and statistically analyzed by ANOVA with a Tukey post‐hoc test (p < 0.05) using GraphPad Prism software (version 9). Beta‐diversity metrics (Bray‐Curtis dissimilarity, Jaccard, weighted and unweighted Unifrac) were created using phyloseq. Principal coordinate analysis (PCoA) was performed on beta‐diversity metrics and statistically confirmed by permutational multivariate analysis of variance using 999 permutations with the Benjamin–Hochberg false discovery rate (FDR, p < 0.05) using phyloseq.[ 38 ] The significance of the separation between study groups in the PCoA space was assessed by a permutation test with pseudo‐F ratio using the adonis function in vegan.[ 39 ]
Additionally, ASVs with prevalence of <5% were removed before taxonomic analysis and linear discriminant analysis effect size (LEfSe) was used (Wilcoxon p‐value <0.05, logarithmic LDA (linear discriminant analysis) score >2) to identify the biomarker in the treatment groups.[ 40 ]
Predictions of Bacterial Function
PICRUSt2 software was used to predict the functional potential from the 16S r RNA. ASVs with prevalence of <5% were removed before functional analysis and the default parameters of the PICRUSt2 pipeline were used.[ 41 ] In PICRUSt2, sequence variants were included in a phylogenetic tree using EPA‐NG,[ 42 ] gappa,[ 43 ] genomic hidden states were predicted using castor,[ 44 ] and MetaCyc pathway abundances were inferred using MinPath.[ 45 ] Statistical analysis of metagenomic profiles was used to test group significance between the groups.[ 46 ] ANOVA with a Tukey‐Kramer post‐hoc test was used with Benjamini–Hochberg FDR (p < 0.05).
Conflict of Interest
The authors declare no conflict of interest.
Author Contributions
C.H., E.O.L., J.J.K., and J.M.R. conceived the experiments. E.O.L., D.E.B., E.A.J., E.G.S., and J.J.K. conducted the live animal portion of the study at Ohio University. C.H. and R.M. carried out the experiments on microbiota analysis. W.T. and Y.S. performed the bioinformatics and statistical analysis. C.H. drafted the paper and all the authors critically revised the manuscript for important intellectual content; C.H., J.J.K., and J.M.R. received funding and had primary responsibility, as the study supervisor.
Supporting information
Supporting Information
Acknowledgements
The authors would like to thank the animal care team for their support. This work was supported by the Edison Biotechnology Institute, the Diabetes Institute at Ohio University (Athens, Ohio, USA) and the French National Research Institute for Sustainable Development (Montpellier, France).
Humblot C., Seyoum Y., Turpin W., Mrabt R., List E. O., Berryman D. E., Jensen E. A., Sustarsic E. G., Kopchick J. J., Ricort J.‐M., Long Term Weight Cycling Affects Fecal Microbiota of Mice. Mol. Nutr. Food Res. 2022, 66, 2200439. 10.1002/mnfr.202200439
Data Availability Statement
Data available on request from the authors.
References
- 1. NCD Risk Factor Collaboration (NCD‐RisC) , Lancet 2017, 390, 2627. [DOI] [PMC free article] [PubMed] [Google Scholar]
- 2. Abdullah A., Wolfe R., Stoelwinder J. U., de Courten M., Stevenson C., Walls H. L., Peeters A., Int. J. Epidemiol. 2011, 40, 985. [DOI] [PubMed] [Google Scholar]
- 3. Ley R. E., Turnbaugh P. J., Klein S., Gordon J. I., Nature 2006, 444, 1022. [DOI] [PubMed] [Google Scholar]
- 4. Davies J., Science 2001, 291, 2316b. [Google Scholar]
- 5. Sommer F., Bäckhed F., Nat. Rev. Microbiol. 2013, 11, 227. [DOI] [PubMed] [Google Scholar]
- 6. Eckburg P. B., Bik E. M., Bernstein C. N., Purdom E., Dethlefsen L., Sargent M., Gill S. R., Nelson K. E., Relman D. A., Science 2005, 308, 1635. [DOI] [PMC free article] [PubMed] [Google Scholar]
- 7. Holmes E., Loo R. L., Stamler J., Bictash M., Yap I. K. S., Chan Q., Ebbels T., De Iorio M., Brown I. J., Veselkov K. A., Daviglus M. L., Kesteloot H., Ueshima H., Zhao L., Nicholson J. K., Elliott P., Nature 2008, 453, 396. [DOI] [PMC free article] [PubMed] [Google Scholar]
- 8. Wang Z., Klipfell E., Bennett B. J., Koeth R., Levison B. S., DuGar B., Feldstein A. E., Britt E. B., Fu X., Chung Y. M., Wu Y., Schauer P., Smith J. D., Allayee H., Tang W. H. W., DiDonato J. A., Lusis A. J., Hazen S. L., Nature 2011, 472, 57. [DOI] [PMC free article] [PubMed] [Google Scholar]
- 9. Turnbaugh P. J., Ley R. E., Mahowald M. A., Magrini V., Mardis E. R., Gordon J. I., Nature 2006, 444, 1027. [DOI] [PubMed] [Google Scholar]
- 10. Muegge B. D., Kuczynski J., Knights D., Clemente J. C., Gonzalez A., Fontana L., Henrissat B., Knight R., Gordon J. I., Science 2011, 332, 970. [DOI] [PMC free article] [PubMed] [Google Scholar]
- 11. Wu G. D., Chen J., Hoffmann C., Bittinger K., Chen Y. Y., Keilbaugh S. A., Bewtra M., Knights D., Walters W. A., Knight R., Sinha R., Gilroy E., Gupta K., Baldassano R., Nessel L., Li H., Bushman F. D., Lewis J. D., Science 2011, 334, 105. [DOI] [PMC free article] [PubMed] [Google Scholar]
- 12. David L. A., Maurice C. F., Carmody R. N., Gootenberg D. B., Button J. E., Wolfe B. E., Ling A. V., Devlin A. S., Varma Y., Fischbach M. A., Biddinger S. B., Dutton R. J., Turnbaugh P. J., Nature 2014, 505, 559. [DOI] [PMC free article] [PubMed] [Google Scholar]
- 13. Kobyliak N., Conte C., Cammarota G., Haley A. P., Styriak I., Gaspar L., Fusek J., Rodrigo L., Kruzliak P., Nutr. Metab. (Lond) 2016, 13, 14. [DOI] [PMC free article] [PubMed] [Google Scholar]
- 14. Gérard P., Annals ATS 2017, 14, S354. [DOI] [PubMed] [Google Scholar]
- 15. Anastasiou C. A., Karfopoulou E., Yannakoulia M., Metabolism 2015, 64, 1395. [DOI] [PubMed] [Google Scholar]
- 16. Thaiss C. A., Itav S., Rothschild D., Meijer M. T., Levy M., Moresi C., Dohnalová L., Braverman S., Rozin S., Malitsky S., Dori‐Bachash M., Kuperman Y., Biton I., Gertler A., Harmelin A., Shapiro H., Halpern Z., Aharoni A., Segal E., Elinav E., Nature 2016, 540, 544. [DOI] [PubMed] [Google Scholar]
- 17. List E. O., Berryman D. E., Wright‐Piekarski J., Jara A., Funk K., Kopchick J. J., Int. J. Obes. 2013, 37, 1088. [DOI] [PMC free article] [PubMed] [Google Scholar]
- 18. Langille M. G. I., Zaneveld J., Caporaso J. G., McDonald D., Knights D., Reyes J. A., Clemente J. C., Burkepile D. E., Vega Thurber R. L., Knight R., Beiko R. G., Huttenhower C., Nat. Biotechnol. 2013, 31, 814. [DOI] [PMC free article] [PubMed] [Google Scholar]
- 19. Dankel S. N., Degerud E. M., Borkowski K., Fjære E., Midtbø L. K., Haugen C., Solsvik M. H., Lavigne A. M., Liaset B., Sagen J. V., Kristiansen K., Mellgren G., Madsen L., Am. J. Physiol. Endocrinol. Metab. 2014, 306, E210. [DOI] [PubMed] [Google Scholar]
- 20. Smith D. L., Yang Y., Nagy T. R., Patki A., Vasselli J. R., Zhang Y., Dickinson S. L., Allison D. B., Obesity 2018, 26, 1733. [DOI] [PMC free article] [PubMed] [Google Scholar]
- 21. Jiao N., Baker S. S., Nugent C. A., Tsompana M., Cai L., Wang Y., Buck M. J., Genco R. J., Baker R. D., Zhu R., Zhu L., Physiol. Genomics 2018, 50, 244. [DOI] [PubMed] [Google Scholar]
- 22. Angelakis E., Armougom F., Million M., Raoult D., Future Microbiol. 2011, 7, 91. [DOI] [PubMed] [Google Scholar]
- 23. Turnbaugh P. J., Ridaura V. K., Faith J. J., Rey F. E., Knight R., Gordon J. I., Sci. Transl. Med. 2009, 1, 6ra14. [DOI] [PMC free article] [PubMed] [Google Scholar]
- 24. Clarke G., Stilling R. M., Kennedy P. J., Stanton C., Cryan J. F., Dinan T. G., Mol. Endocrinol. 2014, 28, 1221. [DOI] [PMC free article] [PubMed] [Google Scholar]
- 25. Qin Y., Roberts J. D., Grimm S. A., Lih F. B., Deterding L. J., Li R., Chrysovergis K., Wade P. A., Genome Biol. 2018, 19, 7. [DOI] [PMC free article] [PubMed] [Google Scholar]
- 26. Crovesy L., Ostrowski M., Ferreira D. M. T. P., Rosado E. L., Soares‐Mota M., Int. J. Obes. 2017, 41, 1607. [DOI] [PubMed] [Google Scholar]
- 27. Hildebrandt M. A., Hoffmann C., Sherrill–Mix S. A., Keilbaugh S. A., Hamady M., Chen Y., Knight R., Ahima R. S., Bushman F., Wu G. D., Gastroenterology 2009, 137, 1716. [DOI] [PMC free article] [PubMed] [Google Scholar]
- 28. Johnson E. L., Heaver S. L., Walters W. A., Ley R. E., J. Mol. Med. 2017, 95, 1. [DOI] [PMC free article] [PubMed] [Google Scholar]
- 29. Ormerod K. L., Wood D. L. A., Lachner N., Gellatly S. L., Daly J. N., Parsons J. D., Dal'Molin C. G. O., Palfreyman R. W., Nielsen L. K., Cooper M. A., Morrison M., Hansbro P. M., Hugenholtz P., Microbiome 2016, 4, 36. [DOI] [PMC free article] [PubMed] [Google Scholar]
- 30. Cani P. D., de Vos W. M., Front Microbiol. 2017, 8, 365. [DOI] [PMC free article] [PubMed] [Google Scholar]
- 31. Collado M. C., Derrien M., Isolauri E., de Vos W. M., Salminen S., Appl. Environ. Microbiol. 2007, 73, 7767. [DOI] [PMC free article] [PubMed] [Google Scholar]
- 32. Derrien M., Vaughan E. E., Plugge C. M., de Vos W. M., Int. J. Syst. Evol. Microbiol. 2004, 54, 1469. [DOI] [PubMed] [Google Scholar]
- 33. Turpin W., Humblot C., Thomas M., Guyot J. P., Int. J. Food Microbiol. 2010, 143, 87. [DOI] [PubMed] [Google Scholar]
- 34. O'Callaghan A., van Sinderen D., Front Microbiol. 2016, 7, 3123. [DOI] [PMC free article] [PubMed] [Google Scholar]
- 35. Wang Q., Garrity George M., Tiedje James M., Cole James R., Appl. Environ. Microbiol. 2007, 73, 5261. [DOI] [PMC free article] [PubMed] [Google Scholar]
- 36. Callahan B. J., McMurdie P. J., Rosen M. J., Han A. W., Johnson A. J. A., Holmes S. P., Nat. Methods 2016, 13, 581. [DOI] [PMC free article] [PubMed] [Google Scholar]
- 37. Quast C., Pruesse E., Yilmaz P., Gerken J., Schweer T., Yarza P., Peplies J., Glöckner F. O., Nucleic Acids Res. 2013, 41, D590. [DOI] [PMC free article] [PubMed] [Google Scholar]
- 38. McMurdie P. J., Holmes S., PLoS One 2013, 8, e61217. [DOI] [PMC free article] [PubMed] [Google Scholar]
- 39. Oksanen J., Blanchet F. G., Kindt R., Legendre P., Minchin P. R., O'Hara R. B., Simpson G. L., Solymos P., Stevens M. H. H., Wagner H., Vegan: community ecology package. R Package version 2.20. 2014, http://CRAN.Rproject.org/package=vegan
- 40. Segata N., Izard J., Waldron L., Gevers D., Miropolsky L., Garrett W. S., Huttenhower C., Genome Biol. 2011, 12, R60. [DOI] [PMC free article] [PubMed] [Google Scholar]
- 41. Douglas G. M., Maffei V. J., Zaneveld J. R., Yurgel S. N., Brown J. R., Taylor C. M., Huttenhower C., Langille M. G. I., Nat. Biotechnol. 2020, 38, 685. [DOI] [PMC free article] [PubMed] [Google Scholar]
- 42. Barbera P., Kozlov A. M., Czech L., Morel B., Darriba D., Flouri T., Stamatakis A., Syst. Biol. 2019, 68, 365. [DOI] [PMC free article] [PubMed] [Google Scholar]
- 43. Czech L., Barbera P., Stamatakis A., Bioinformatics 2020, 36, 3263. [DOI] [PMC free article] [PubMed] [Google Scholar]
- 44. Louca S., Doebeli M., Bioinformatics 2018, 34, 1053. [DOI] [PubMed] [Google Scholar]
- 45. Ye Y., Doak T. G., PLoS Comput. Biol. 2009, 5, e1000465. [DOI] [PMC free article] [PubMed] [Google Scholar]
- 46. Parks D. H., Tyson G. W., Hugenholtz P., Beiko R. G., Bioinformatics 2014, 30, 3123. [DOI] [PMC free article] [PubMed] [Google Scholar]
Associated Data
This section collects any data citations, data availability statements, or supplementary materials included in this article.
Supplementary Materials
Supporting Information
Data Availability Statement
Data available on request from the authors.