

Abstract
Objectives
To assess the magnitude of, and changes in, absolute and relative oral health inequality in Canada and the United States, from the 1970s till the first decade of the new millennium.
Methods
Data were obtained from four national surveys; two Canadian (NCNS 1970–1972 and CHMS 2007–2009) and two American (HANES 1971–1974 and NHANES 2007–2008). The slope and relative index of inequality were used to measure absolute and relative inequality, respectively. Percentage change in inequality was also calculated.
Results
Relative inequality for untreated decay increased by 91% in Canada and 189% in the United States, while for filled teeth it declined by 63% in Canada and 16% in the United States. Relative inequality in edentulism rose by 200% and 78% in Canada and United States, respectively. Absolute inequality declined in both countries.
Conclusions
There was persistent absolute and relative inequality in Canada and the United States. An increase in relative inequality for adverse outcomes suggests that improvements in oral health were occurring primarily among the rich, while reductions in relative inequality for filled teeth indicate higher utilization of restorative services among the poor. These results point to the necessity of tackling the sociopolitical determinants of health to mitigate oral health inequality in Canada and the United States.
Keywords: country comparisons, dental care, dental health surveys, income distribution, inequality, oral health, political factors
INTRODUCTION
Socioeconomic inequality in oral health is well documented within high‐income countries, where oral disease is disproportionately prevalent in disadvantaged members of society [1, 2]. Country comparisons of oral health outcomes can provide insight into sociopolitical and health system factors that shape inequality [3, 4, 5]. For example, evidence suggests that liberal democracies with market‐dominated economies and health systems accentuate differences in oral health between the rich and poor [4]. Canada and the United States, in particular, have consistently demonstrated low public health expenditure, social spending, and increases in income inequality over time (Table 1) [10, 11, 12]. One notable difference between the two countries is the availability of Canada's national system of universal health insurance, which covers physician and hospital care, yet excludes oral health care. The Canadian and American approaches to oral health care are actually quite similar, with most care financed by employer and individually‐sponsored insurance and out‐of‐pocket payments, and limited contributions from government [6]. In addition, most care in both countries is delivered in the private sector by dentists on a fee‐for‐service basis. Nevertheless, as liberal democracies, Canada still provides more support to its citizens than the United States in terms of unemployment insurance, social assistance for the poor, tax credits, and other universal benefits [6]. Thus, despite similar demography and macroeconomic environments, the Canadian social safety is generally considered more extensive in terms of both population coverage and the level of benefits provided [7]. Given the potential role played by political and social institutions in mediating oral health inequality, it would be reasonable to speculate that the extent of such differences may impact the distribution of oral health‐related outcomes in both countries. However, little comparative information on the magnitude of, and changes in, oral health inequality is available for Canada and the United States over time.
TABLE 1.
Comparative framework to analyze oral health inequality over time in Canada and the United States
| Sociopolitical contexts | ||||
|---|---|---|---|---|
| Canada | United States | |||
| 1970s | 2000s | 1970s | 2000s | |
| Total healthcare expenditure a | 6.2 | 10.73 | 6.2 | 16.38 |
| Public healthcare expenditure a | 4.4 | 7.5 | 2.3 | 7.9 |
| Public social spending a | 13.3 (1980) | 15.7 | 12.8 (1980) | 14.2 |
| Income inequality b | 0.30 | 0.32 | 0.31 | 0.38 |
| Oral healthcare system features | ||||
|---|---|---|---|---|
| Canada | United States | |||
| 1970s | 2000s (%) | 1970s | 2000s (%) | |
| Total oral health expenditure c | e | 6 | e | 4.2 |
| Public insurance d | e | 6.2 | e | 9 |
| Private insurance d | e | 60 | e | 46.4 |
| Out of pocket payments d | e | 40 | e | 40.1 |
| Population coverage (%) | ||||
| Public insurance | e | 5.5 | e | 5 |
| Private insurance | e | 62.6 | e | 60 |
| No coverage | e | 32 | e | 35 |
Expressed as % of GDP.
Expressed as Gini coefficient.
Expressed as % of total healthcare expenditure.
Expressed as % of oral healthcare expenditure.
Information not available.
Elani et al. reported a declining prevalence of untreated decay and edentulism in both Canada and the United States from the 1970s until the first decade of the new millennium, along with a flattening of socioeconomic gradients for filled teeth outcomes, with more low‐income individuals arguably consuming more restorative services in both countries over time [8]. While there was persistent inequality, improvements for untreated decay were higher in Canada and, for edentulism in the United States [8]. Farmer et al. supported these findings, reporting steeper income gradients in the United States than Canada, with adverse outcomes concentrated among the poor, which were attributed to the effects of income, gender, and age [2]. These are the only two studies using nationally representative data to compare the magnitude of, and changes in, oral health inequality in Canada and the United States, yet they have shortcomings. Elani et al. only measured the association between socioeconomic status on oral health, but not the extent to which differences in socioeconomic position might impact the distribution of oral health in the respective populations [9]. Farmer et al. used more robust measures to address the limitations of Elani et al.'s analysis, but only estimated the extent to which oral health outcomes were concentrated in certain segments of the population, and not changes in the magnitude of inequality over time.
Measuring and monitoring inequality in oral health is considered important, yet research on trends over time remains limited [13]. While it is known that the poor are worse‐off than the rich, there is almost no information on changes in the magnitude of the gap between the best and worst‐off members of society in Canada and the United States, particularly for clinical indicators. This study aims to quantify the extent to which differences in income impact the distribution of clinical oral health indicators, along with the percentage changes in inequality in Canada and the United States from the 1970s until the first decade of the new millennium.
METHODS
Data sources
Data from four nationally representative surveys was used to obtain information on clinical oral health, demographic and socioeconomic status. For Canada, we used the Nutrition Canada National Survey 1970–1972 (NCNS) and the Canadian Health Measures Survey 2007–2009 (CHMS). The NCNS was conducted between October 1970 and September 1972 and collected data from 19,590 individuals aged 0–100 years, including Indigenous populations. The CHMS was conducted between March 2007 and 2009 and collected information from 5586 Canadians aged 6–79 years, excluding indigenous populations, institutionalized populations, and the Canadian Armed Forces. The NCNS and CHMS had unweighted response rates of 46.0% and 51.7%, respectively. Both surveys followed a stratified multistage sampling technique, collecting data over two phases, which included household interviews followed by clinical examination [14, 15].
For comparison with the NCNS and CHMS, we used the US Health and Nutrition Examination Survey 1971–1974 (HANES) and National Health and Nutrition Examination Survey 2007–2008 (NHANES). Both HANES and NHANES used stratified multi‐stage probability samples to collect information from noninstitutionalized Americans aged 0–74 and 0–80 years, respectively. The unweighted response rates for the surveys were 74.0% and 75.4%, respectively. Demographic and socioeconomic data were collected via household interviews, while oral health information was collected via clinical examination [16].
Oral health outcomes
We focused on three clinical oral health outcomes; (i) ≥1 untreated decayed teeth, which included pit and fissure, occlusal, proximal, overt, and grossly decayed teeth that had never been restored, to represent untreated decay levels in each population; (ii) ≥1 filled teeth comprising all permanent amalgam, composite resin, and glass ionomer surface restorations along with previously filled teeth presenting with secondary decay and fractured/defective restorations; and (iii) edentulism, as an indicator of unmet treatment need, utilization of services, and history of dental disease. Individual tooth counts with the assessment of each tooth surface was carried out in three of the four surveys to estimate both prevalence and severity of oral disease, while in NHANES only a basic screening examination was conducted to assess the prevalence of oral conditions. In order to maintain comparability, all the oral health outcomes were dichotomized and analyzed as binary variables.
Income
To measure inequality in oral health, we used total annual income as a socioeconomic indicator, as it was consistently reported in an ordinal form across all four surveys. The NCNS and HANES reported total annual family income, while the CHMS and NHANES reported total annual household income. The income variable was further ranked into quintiles, from highest to lowest.
Indices of inequality
Two complex regression‐based measures of inequality, the slope index of inequality (SII) and relative index of inequality (RII) were used to estimate absolute and relative inequality, respectively. The SII and RII not only reflect the socioeconomic dimension to inequality, they also incorporate the experiences of every socioeconomic group and are sensitive to changes in the distribution of socioeconomic groups in a population [17]. The SII and RII were estimated by the regression of the midpoint value of the health outcome for each socioeconomic group along with a cumulative distribution, represented by a ridit score. The ridit scores were calculated by ranking weighted proportions of the income variable from the highest to lowest income groups, and assigning each category scores ranging from 0 to 1, based on the midpoint of the cumulative distribution of individuals within each group [17]. The ridit scores were then incorporated in linear regression models, generating the regression coefficient, which represents the estimate of inequality. A positive value for the SII and an RII of greater than 1 is indicative of “pro‐rich” inequality, meaning the outcome is disproportionately distributed among higher‐income groups; while a negative value of the SII and an RII of less than 1 is indicative of “pro‐poor” inequality, meaning the outcome is disproportionately distributed among lower‐income groups [17].
Analysis
Data analysis using survey command was conducted in STATA version 15.0. Individuals aged ≥18 years, with complete data in all variables were included in the analysis. A very small percentage of participants ranging from 3% to 5% were excluded from the analysis due to missing data. Age‐standardized distributions of oral health outcomes across income groups were estimated for each country at both time points. Direct age‐standardization, using the US 2000 Census was performed to account for changes in distributions across time and country. The magnitude and direction of sex‐adjusted oral health inequality was estimated along with percentage change in inequality over time. Finally, an unpaired t‐test was conducted to determine the statistical significance of changes in the magnitude of inequality over time.
RESULTS
Survey sample characteristics
The characteristics of the sample population are presented in Table 2. The gender and age distribution were similar in both countries in the 1970s and 2000s. The age‐standardized prevalence of oral health outcomes by income category is presented in Figure 1. While income gradients persisted, the overall prevalence of untreated decay and edentulism decreased over time in both Canada (untreated decay: 64%–20.5%; edentulism: 16.4%–4.4%) and the United States (untreated decay: 45.7%–21.2%; edentulism: 15.5%–5.7%). For filled teeth, the overall prevalence increased over time in Canada (74.5%–89.7%), but remained stable in the United States (82%–82.6%). It also appears that increases in filled teeth among low and middle‐income groups in Canada were greater than in the United States. Finally, while the income gradient for filled teeth remained in both countries, it was more delineated in the United States in the 2000s.
TABLE 2.
Sample characteristics. Weighted proportions expressed as % and 95% CI
| Canada | Canada | United States | United States | |
|---|---|---|---|---|
| 1970–1972 | 2007–2009 | 1971–1974 | 2007–2008 | |
| n = 11,142 | n = 3715 | n = 13,145 | n = 4988 | |
| Age | ||||
| 18–39 | 49.0 (46.7, 51.4) | 40.1 (36.1, 44.2) | 48.9 (47.2, 50.6) | 39.8 (36.8, 42.9) |
| 40–59 | 32.7 (30.2, 35.3) | 39.8 (37.3, 42.4) | 34.8 (33.3, 36.3) | 37.7 (35.3, 40.1) |
| ≥ 60 | 18.3 (16.2, 20.5) | 20.1 (16.7, 23.9) | 16.3 (15.2, 17.4) | 22.4 (20.2, 24.7) |
| Sex | ||||
| Female | 54.1 (52.2, 55.9) | 50.6 (47.8, 53.6) | 52.5 (51.5, 53.5) | 51.1 (49.7, 52.6) |
| Male | 45.9 (44.1, 47.8) | 49.4 (46.4, 52.4) | 47.5 (46.5, 48.5) | 48.9 (47.4, 50.3) |
| Income | ||||
| Lowest | 21.5 (18.6, 24.8) | 24.7 (20.0, 30.1) | 16.1 (14.5, 17.6) | 22.5 (18.5, 26.4) |
| Lower middle | 18.7 (16.4, 21.4) | 18.8 (16.5, 21.2) | 14.4 (13.3, 15.5) | 20.5 (17.8, 23.2) |
| Middle | 32.8 (29.9, 35.7) | 16.6 (14.5, 18.8) | 23.5 (22.1, 25.0) | 15.7 (13.3, 18.0) |
| Higher middle | 18.3 (15.0, 22.1) | 12.5 (10.5, 14.8) | 24.1 (23.0, 25.2) | 20.3 (17.1, 23.5) |
| Highest | 8.7 (7.0, 10.8) | 27.5 (22.3, 33.5) | 21.9 (19.8, 23.9) | 21.0 (16.7, 25.4) |
FIGURE 1.
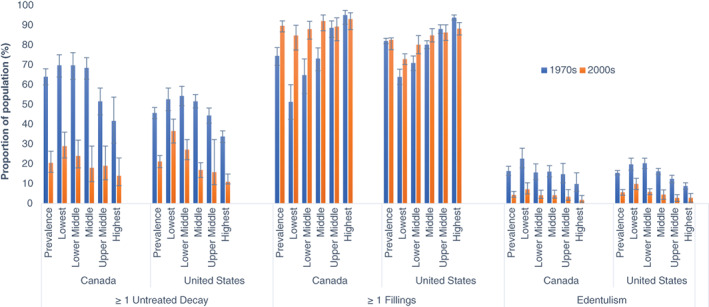
Age‐standardized prevalence of oral health outcomes by income category. Weighted proportions and 95% CI. Decayed and filled teeth outcomes based on dentate population. Edentulism based on the whole population [Color figure can be viewed at wileyonlinelibrary.com]
Income‐related inequality in oral health outcomes
As seen in Table 3, among dentate adults, there was significant absolute income‐related inequality (SII) in the prevalence of untreated decay at both time points; however, this decreased by approximately 31% in Canada and remained unchanged in the United States. Relative income‐related inequality (RII) for untreated decay increased significantly over time in both countries. The increase in relative inequality in Canada (91%) was half of that in the United States (189%). For filled teeth, both the SII and RII declined significantly over time in both countries. The reduction in the SII in Canada (79%) was almost double that in the United States (38%). For filled teeth, the RII decreased over time by 63% and 16% in Canada and the United States, respectively. For edentulism, the SII decreased by 57.1% in Canada and 50.9% in the United States, while the RII rose by 200% in Canada and 78% in the United States.
TABLE 3.
Sex adjusted absolute and relative oral health inequality and changes over time in Canada and United States
| SII | Direction of change | RII | Direction of change | ||
| 1 ≥ untreated decay a | |||||
| Canada | 1970–1972 | 29.2***(20.2, 38.2) | 1.54***(1.34, 1.78) | ||
| 2007–2009 | 20.2***(13.3, 27.2) | ↓ | 2.95**(1.60, 5.50) | ↑ | |
| % change | 30.8NS | 91.5* | |||
| United States | 1971–1974 | 26.2***(21.5, 30.9) | 1.67***(1.52, 1.83) | ||
| 2007–2008 | 29.4***(22.9, 35.9) | ↓ | 4.83*** (3.14, 7.44) | ↑ | |
| % change | 12.2NS | 189*** | |||
| 1 ≥ filled teeth a | |||||
| Canada | 1970–1972 | −46.5***(−54.4, −38.5) | 0.55***(0.49, 0.62) | ||
| 2007–2009 | −10.0**(−15.6, −4.4) | ↓ | 0.9**(0.85, 0.95) | ↓ | |
| % change | 78.5*** | 63.6*** | |||
| United States | 1971–1974 | −32.2***(−36.1, −28.3) | 0.68***(0.65, 0.71) | ||
| 2007–2008 | −19.7***(−23.9, −15.5) | ↓ | 0.79*** (0.75, 0.83) | ↓ | |
| % change | 38.8*** | 16.1*** | |||
| Edentulism b | |||||
| Canada | 1970–1972 | 30.3***(24.0, 36.7) | 4.29***(3.06, 6.02) | ||
| 2007–2009 | 13.0***(7.4, 18.7) | ↓ | 12.9***(4.62, 35.7) | ↑ | |
| % change | 57.1*** | 200.6* | |||
| United States | 1971–1974 | 21.6***(18.6, 24.7) | 5.11***(4.01, 6.5) | ||
| 2007–2008 | 10.6***(7.1, 14.2) | ↓ | 9.1*** (3.76, 22.08) | ↑ | |
| % change | 50.9*** | 78.4*** | |||
Abbreviation: NS, not significant.
p < 0.001, ** p < 0.01, *p < 0.05.
Decayed and filled teeth estimate based on dentate population.
Estimates for edentulism based on the whole population.
DISCUSSION
Absolute inequality in the prevalence of untreated decay and edentulism decreased over time in Canada. In the United States, absolute inequality decreased for edentulism only, and remained unchanged for untreated decay. However, relative inequality for untreated decay and edentulism increased over time in both countries. For untreated decay, the increase in relative inequality in Canada was half of that in the United States; for edentulism, relative inequality more than doubled in Canada compared to the United States. For filled teeth, both absolute and relative inequality declined over time in both countries, with improvements among lower and middle‐income groups appearing more pronounced in Canada than in the United States. Overall, apart from edentulism, the magnitude of oral health‐related inequality in untreated decay and filled teeth appears to be worse in the United States than in Canada.
In their pioneering study, Sanders et al. demonstrated that high population coverage for social benefits contributes significantly toward mitigating oral health inequality, and that a high reliance on private dental insurance is ineffective in achieving equity in population oral health [4]. These findings help to explain our own. For instance, a higher level of welfare benefits in Canada covering larger portions of the population [10, 11, 12] may have contributed to lower oral health‐related inequality than in the United States, despite a high reliance on private dental insurance in both countries. Sanders et al. and other authors also suggest that the population's oral health and inequality therein might be impacted by the unequal distribution of income (or income inequality) in a country [3, 4]. Canada has had lower income inequality than the United States (Table 1); thus, despite higher levels of social spending in the United States over the past 35 years, low population coverage in regard to this spending and higher income inequality relative to Canada [10, 11, 12] may explain why oral health‐related inequality appears to be worse in the United States than Canada.
On the other hand, both absolute and relative inequality for filled teeth declined over time, albeit to a greater extent in Canada than in the United States. The narrowing of inequality for this outcome is indicative of an increasing uptake of dental services among lower‐income individuals. Both countries have predominantly privatized oral health care systems, suggesting there would be similar barriers in accessing dental services [6]. Yet, the utilization of dental services has arguably improved over time, particularly among the poor, as indicated by declining inequality for filled teeth, which may, in fact, suggest enhanced access to dental care over time [18]. Nevertheless, whatever improvement in access to dental services has been present, it appears to be inadequate in mitigating inequality in oral disease.
Similarly, a reduction in absolute inequality over time for adverse oral health outcomes, such as in untreated decay and edentulism, reflects an overall declining prevalence of these outcomes within the population, which is a desirable effect; yet this was followed by an unequal rise in relative differences. The widening of relative inequality suggests that improvements in oral health has occurred at a higher rate among those at the upper end of the income gradient [17]. Further, the stabilization of absolute inequality in the United States reflects persistent and intractable gaps between income groups in terms of oral health‐related outcomes [1].
Despite the relatively low availability of public dental services in both countries [7], and the rising costs of private insurance and dental care in real terms [19, 20], the gaps between the rich and poor in the utilization of services still declined. However, as argued above, this does not fully address the distributional burden of oral disease, as is indicated by the concentration of unmet needs (e.g., untreated decay) among lower‐income individuals. Moreover, the concentration of edentulism among the poor over time suggests the inadequacy of oral health policies in addressing the lasting impacts of socioeconomic inequality over the lifespan. These findings are in line with the “inverse care law,” which states that health services structured by market forces are inversely available based on people's needs [21]. Thus, while the oral healthcare system may play a mediating role in inequality, it alone appears to be insufficient in addressing inequality in Canada and the United States.
Overall, our results suggest that while oral health has improved over time, inequality in oral disease has in fact worsened. Despite the negative unabating impacts of aging over time, the decline in the prevalence of untreated decay and edentulism could be attributed to period and cohort effects as well [22]. However, the large significant rise in relative inequality in untreated decay and edentulism over time in both countries suggests that the decline in the prevalence of oral disease is largely attributed to improvements primarily among higher‐income groups. As per the “inverse equity” hypothesis, inequality emerges as a result of public health interventions being first and most accessible to those higher‐up on the socioeconomic ladder with a trickle‐down effect to those at the bottom [23]. It is plausible then that inequality in untreated decay may be exacerbated through differential access and uptake of preventive dental services (e.g., topical fluorides).
Moreover, the state of oral health, which is likely modified by behavior, such as smoking, diet, and tooth brushing, is related to the trajectory of behavior change along the income gradient, wherein those higher‐up on the gradient adopt new and healthy behaviors earlier than those below them, which serves as a potential explanation for the widening inequality observed in this study [24]. Behavior change does not occur in isolation either, but is born out of social and living conditions [25], highlighting the important role of social determinants, which in turn points to the role of the Canadian and American welfare state (or failures therein) in mitigating inequality.
This study presents with certain strengths and limitations. All analyses were based on nationally representative surveys, using comparable clinical data from both countries at two points in time. In addition, to the best of our knowledge, this is the first study to quantify both the magnitude and direction of change in oral health inequality over time in Canada and the United States, and to assess absolute and relative inequality using robust methods that align with World Health Organization recommendations. Some might question why we only focused on income‐related inequality in this study. The reason is that other indicators of socioeconomic status such as educational attainment and occupational status tend to be stable and provide little variation among adults over time, thus potentially underestimating socioeconomic inequality in health outcomes. Income has also been shown to be the strongest predictor of inequality in dental care use among organisation for economic co‐operation and development countries [26]. Nevertheless, it must also be recognized that differences in income may be compounded by other socioeconomic indicators such as educational attainment and occupation [1], which were not accounted for in this study. In addition, this study did not account for the role race or ethnicity in exacerbating inequality. While the health differential between privileged and disadvantaged racial groups has existed across time and space, with disadvantaged racial groups bearing the greatest burden of poor oral health outcomes, a key feature explaining racial gaps in oral health is socioeconomic status, accounting for a considerable proportion of racial inequality [27]. Finally, while there has been a clear consensus to prioritize research on trends in oral health inequality, due to data availability, this study was limited in this regard by only focusing on comparing inequality over two points in time.
While our results are consistent with the limited research comparing oral health inequality between Canada and the United States [1, 2], it has also captured the magnitude extent to which inequality has precipitated in the respective countries over time. Moreover, results from previous studies on inequality trends in high‐income countries such as Australia and the United Kingdom, have demonstrated small improvements over time, which were occurring predominantly among the rich, despite improved access to care overall [1, 23], further corroborating our results. Future research opportunities include a comparative analysis on inequality trends in the distribution of oral and general health indicators in these countries. While there is some descriptive research in this area, time trend analyses using robust methodologies is limited in the North American context [28]. Although this study did not empirically explore pathways to inequality, our findings do suggest a potential role for the sociopolitical environment. While research in this area exists in the European context [4, 5], there is almost no information for North America and other nations. Moreover, while we assessed changes in oral health inequality among adults, extending such research into analyzing inequality patterns among children would augment knowledge on the extent to which public policy addresses differences by age.
In conclusion, oral health appears to have improved significantly over time in Canada and the United States, however, this was accompanied by an increasing and disproportionate share of unmet needs and poor oral health among the poor, particularly in the United States. Despite highly privatized oral health systems in both countries with concomitant barriers to care, utilization of restorative services appears to have grown, particularly among the poor. Nevertheless, the oral healthcare system appears to be inadequate in mitigating inequality in the distribution of oral disease. Finally, while higher inequality in the United States may partially be explained by its weaker welfare state, our findings suggest the need for more upstream public health interventions in both countries to address the sociopolitical determinants of oral health.
CONFLICT OF INTEREST
Dr. Carlos Quiñonez receives remuneration from Green Shield Canada for consulting services around dental care‐related issues. All the other authors have no conflict of interest to declare.
ACKNOWLEDGMENTS
This research was supported through the generous funding of the Canadian Dental Protective Association and Green Shield Canada.
Chari M, Ravaghi V, Sabbah W, Gomaa N, Singhal S, Quiñonez C. Comparing the magnitude of oral health inequality over time in Canada and the United States. J Public Health Dent. 2022;82:453–460. 10.1111/jphd.12486
REFERENCES
- 1. Peres MA, Luzzi L, Peres KG, Sabbah W, Antunes JL, Do LG. Income‐related inequalities in inadequate dentition over time in Australia, Brazil and USA adults. Community Dent Oral Epidemiol. 2015;43(3):217–25. [DOI] [PubMed] [Google Scholar]
- 2. Farmer J, McLeod L, Siddiqi A, Ravaghi V, Quiñonez C. Towards an understanding of the structural determinants of oral health inequalities: A comparative analysis between Canada and the United States. SSM Popul Health. 2016;2:226–36. [DOI] [PMC free article] [PubMed] [Google Scholar]
- 3. Sanders AE, Slade GD, John MT, Steele JG, Suominen‐Taipale AL, Lahti S, et al. A cross‐national comparison of income gradients in oral health quality of life in four welfare states: application of the Korpi and Palme typology. J J Epidemiol Community Health. 2009;63(7):569–74. [DOI] [PMC free article] [PubMed] [Google Scholar]
- 4. Guarnizo‐Herreño CC, Tsakos G, Sheiham A, Watt RG. Oral health and welfare state regimes: a cross‐national analysis of European countries. Eur J Oral Sci. 2013;121(3 Pt 1):169–75. [DOI] [PMC free article] [PubMed] [Google Scholar]
- 5. Guarnizo‐Herreño CC, Watt RG, Pikhart H, Sheiham A, Tsakos G. Socioeconomic inequalities in oral health in different European welfare state regimes. J Epidemiol Community Health. 2013;67(9):728–35. [DOI] [PubMed] [Google Scholar]
- 6. Neumann Garbin D, Quiñonez C. A comparative analysis of oral health care systems in the United States, United Kingdom, France, Canada, and Brazil. NCOHR Work Pap Ser. 2014;1(2):1–18. [Google Scholar]
- 7. Blank RM, Hanratty MJ. Responding to need: A compatison of Social Safety Nets in Canada and the United States. In: Card D, Freeman RB, editors. Small differences that matter: labor markets and income maintenance in Canada and the United States. National Bureau of Economic Research. Chicago: University of Chicago Press; 1993. p. 191–232. [Google Scholar]
- 8. Elani HW, Harper S, Allison PJ, Bedos C, Kaufman JS. Socio‐economic inequalities and oral health in Canada and the United States. J Dent Res. 2012;91(9):865–70. [DOI] [PubMed] [Google Scholar]
- 9. Mackenbach JP, Kunst AE. Measuring the magnitude of socio‐economic inequalities in health: An overview of available measures illustrated with two examples from Europe. Soc Sci Med. 1997;44(6):757–71. [DOI] [PubMed] [Google Scholar]
- 10. OECD 2020. Health spending (indicator) OECD Data [Internet]. [cited 2020 Jan 22]. Available from: https://data.oecd.org/healthres/health-spending.htm
- 11. OECD 2020. Social Spending (Indicator). OECD Data [Internet]. [cited 2020 Jan 22]. Available from: https://data.oecd.org/socialexp/social-spending.htm
- 12. OECD 2020. Income inequality (indicator). OECD Data [Internet]. [cited 2020 Jan 22]. Available from: https://data.oecd.org/socialexp/social-spending.htm
- 13. Sgan‐Cohen HD, Evans RW, Whelton H, Villena RS, MacDougall M, Williams DM. IADR global oral health inequalities research agenda (IADR‐GOHIRA®): A call to action. J Dent Res. 2013;92(3):209–11. [DOI] [PubMed] [Google Scholar]
- 14. Canada. Nutrition Canada . Department of National Health and Welfare. Nutrition: a national priority; a report to the Dept. of National Health and Welfare; 1973.
- 15. Health Canada . Report on the Findings of the Oral Health Component of the Canadian Health Measures Survey 2007–2009. Ottawa, ON; 2010.
- 16. U.S. Department of Health & Human Services . National Health and Nutrition Examination Survey I (2007‐2008) [Internet]. The Centers for Disease Control and Prevention; 2009. [cited 2020 Jan 22]. Available from: https://wwwn.cdc.gov/nchs/nhanes/ContinuousNhanes/Default.aspx?BeginYear=2007
- 17. World Health Organisation . Handbook on health inequality monitoring: with a special focus on low‐ and middle‐income countries. Geneva: WHO Press; 2013. [Google Scholar]
- 18. Ravaghi V, Farmer J, Quiñonez C. Persistent but narrowing oral health care inequalities in Canada from 2001 through 2016. J Am Dent Assoc. 2020;151:349–357.e1. [DOI] [PubMed] [Google Scholar]
- 19. Vujicic M. Time to rethink dental “insurance”. J Am Dent Assoc. 2016;147(11):907–10. [DOI] [PubMed] [Google Scholar]
- 20. Leake JL. Why do we need an oral health care policy in Canada? J Can Dent Assoc. 2006;72(4):317. [PubMed] [Google Scholar]
- 21. Hart JT. The inverse care law. Lancet. 1971;297(7696):405–12. [DOI] [PubMed] [Google Scholar]
- 22. Bernabé E, Sheiham A. Tooth loss in the United Kingdom ‐ Trends in social inequalities: An age‐period‐and‐cohort analysis. PLoS One. 2014;9(8):e104808. [DOI] [PMC free article] [PubMed] [Google Scholar]
- 23. Victora CG, Vaughan JP, Barros FC, Silva AC, Tomasi E. Explaining trends in inequities: Evidence from Brazilian child health studies. Lancet. 2000;356(9235):1093–8. [DOI] [PubMed] [Google Scholar]
- 24. Rogers EM. Diffusion of innovations. 5th ed. New York: The Free Press; 2003. [Google Scholar]
- 25. Marmot M, Bell R. Social determinants and dental health. Adv Dent Res. 2011;23(2):201–6. [DOI] [PubMed] [Google Scholar]
- 26. Doorslaer E, Masseria C. Income‐related inequality in the use of medical care in 21 OECD countries. OECD Health Working Papers Paris: OECD; 2004. Available from: https://www.oecd.org/els/health-systems/31743034.pd
- 27. Bastos JL, Celeste RK, Paradies YC. Racial Inequalities in Oral Health. J Dent Res. 2018;97(8):878–86. [DOI] [PubMed] [Google Scholar]
- 28. Bleich SN, Jarlenski MP, Bell CN, LaVeist TA. Health inequalities: trends, progress, and policy. Annu Rev Public Health. 2012;33:7–40. [DOI] [PMC free article] [PubMed] [Google Scholar]