

Abstract
Background
Flow cytometry (FCM) aids the diagnosis and prognostic stratification of patients with suspected or confirmed myelodysplastic syndrome (MDS). Over the past few years, significant progress has been made in the FCM field concerning technical issues (including software and hardware) and pre‐analytical procedures.
Methods
Recommendations are made based on the data and expert discussions generated from 13 yearly meetings of the European LeukemiaNet international MDS Flow working group.
Results
We report here on the experiences and recommendations concerning (1) the optimal methods of sample processing and handling, (2) antibody panels and fluorochromes, and (3) current hardware technologies.
Conclusions
These recommendations will support and facilitate the appropriate application of FCM assays in the diagnostic workup of MDS patients. Further standardization and harmonization will be required to integrate FCM in MDS diagnostic evaluations in daily practice.
Keywords: ELN, flow cytometry, MDS, pre‐analytic issues
1. INTRODUCTION
Flow cytometric immunophenotyping allows the identification, enumeration, and characterization of hematopoietic cells of distinct cell lineages and their differentiation stages in the bone marrow (BM) and peripheral blood (PB). For these reasons, flow cytometry (FCM) is uniquely placed to aid in diagnosing and prognosticating patients with suspected or confirmed myelodysplastic syndrome (MDS). Over the last decade, numerous publications have addressed immunophenotypic abnormalities in MDS patients. However, implementation of FCM into routine diagnostic activities remains limited due to the lack of a universal consensus on sample types, processing, staining, and data analysis, interpretation and reporting. At the European Leukemia Net (ELN) group meeting on MDS diagnostics in 2006 (Valent, et al., 2007b), it was concluded that there was no generally accepted consensus on uniformly used standard protocols and techniques, and that multicenter projects to standardize and harmonize methodologies and reagents were required. To fulfill this need, the International Myelodysplastic Syndromes Flow Cytometry working group of the ELN (ELN iMDS Flow WG) was convened in 2008 and at that time published the first recommendations (Valent et al., 2010; Valent, et al., 2017c). Since 2008, significant progress has been made in FCM with respect to technical issues (including software and hardware) and pre‐analytical procedures. Additional diagnostic standards and criteria for MDS diagnosis have been proposed and include FCM (Valent et al., 2010; Valent, et al., 2017c).
The purpose of this manuscript is to discuss and provide updates on (1) the optimal methods for sample processing and handling; (2) antibody panels and fluorochromes; and (3) current hardware technologies. Recommendations are made based on the data and expert discussions generated from 13 yearly meetings of the ELN iMDS Flow WG between 2008 and 2020.
2. SAMPLES
2.1. Source of samples
For FCM analysis of patients with cytopenias and possible MDS, BM is the required sample source. The BM sample should be of high quality with representation of precursor cells, and hemodilution should be prevented as much as possible. Therefore, the BM sample for FCM should preferably be the first aspirate pull and should be between 2 and 3 ml. If this is not possible or larger volumes are needed, it is recommended to reposition the aspiration needle or to perform a separate puncture. It is recommended to estimate the potential contamination with PB, for example, the presence of >90% mature (CD10+) neutrophils or high numbers of T‐cells in case of neutropenia in a BM sample are indicative of significant hemodilution (Aldawood et al., 2015; Brooimans et al., 2009; Delgado et al., 2017; Loken et al., 2009; Nombela‐Arrieta & Manz, 2017; Pont et al., 2018).
Analysis of BM samples allows detailed evaluation of the myeloid precursor cells and multiple maturation stages of the three major cell lineages, namely the granulocytic, monocytic, and erythroid lineage. In addition, less frequent cell types such as B‐cell precursors, basophils, mast cells, eosinophils, and dendritic cells can be analyzed simultaneously. Megakaryocytic cells remain challenging to assess by FCM, due to their large size, low frequency, fragility, and nonspecific binding of platelets to other cell types. Consequently, their analysis is not yet recommended in the routine diagnostic workup of MDS. For the latter lineage evaluation of PB platelets may be feasible (Sandes et al., 2012), but we do not recommend this analysis yet since limited data are available.
Although BM is the preferred sample source, several studies indicate that PB samples may also provide clinically useful information in suspected MDS patients. The antigens CD10, CD11b, CD13, and CD16 may be abnormally expressed on PB neutrophils and may discriminate MDS patients from non‐MDS patients with sensitivities between 73%–93% and specificities of 90%–100% (Aires et al., 2018; Cherian et al., 2005a; Cherian et al., 2005b; Rashidi et al., 2012). While these findings are promising, they have not been widely adopted and are not part of our current recommendations.
2.2. Anticoagulant
It is recommended that samples for FCM MDS analysis are aspirated into tubes with heparin as an anticoagulant. Samples may also be collected in EDTA tubes since there will generally be no significant differences between these two anticoagulants. However, EDTA may influence the expression of specific antigens such as CD10, CD11b, CD16, and CD64, especially when samples are not processed immediately (Elghetany & Davis, 2005; Karai et al., 2018; Stachurski et al., 2008).
3. PROCESSING OF SAMPLES
3.1. Processing time
Ideally, samples should be processed within 24 h. If this is not possible, for example, in a setting of centralized analysis for a multicenter trial, samples should be stored and/or shipped at ambient conditions; storage/shipment at 4°C should be avoided (Alhan et al., 2016). It is well recognized that sample processing within 36 h or even up to 72 h, will be acceptable. Samples processed at later time points may still be evaluable, but extra controls should be included to evaluate the quality of the sample (e.g., check scatter characteristics, percentage of dead cells, expression patterns on normal cells). Each center performing FCM analysis should evaluate analyte stability as part of the validation process (confirm sample integrity and antigen stability).
3.2. Lysis versus no‐lysis
3.2.1. Analysis of white blood cells
FCM analysis in patients with MDS currently focuses on white blood cells (WBC) and nucleated red blood cells (NRBC). Due to the high number of mature erythrocytes present in BM samples, the WBCs are usually analyzed after RBC lysis. Lysis of the mature RBC population before antibody staining of the WBC is recommended for two main reasons. Firstly, bulk‐lysis permits the assessment of identical cell suspensions in the separate aliquots of different analysis tubes, thereby facilitating the comparison between tubes. Secondly, this approach allows the use of a fixed cell concentration for antibody incubation. Bulk‐lysis has not been shown to affect the fluorescent signals of the antibodies, if well titrated (Kalina, et al., 2012), does not result in selective loss of cell populations, and does not result in increased levels of debris and/or doublets (Flores‐Montero et al., 2017; Theunissen, et al., 2017). Bulk‐lysis is especially recommended in childhood MDS, in which about 50% of patients have refractory cytopenia of childhood (RCC), frequently with hypocellular BM (Aalbers et al., 2013; Aalbers et al., 2015). For lysis of the nonnucleated RBCs, ammonium chloride (either homemade or commercially available) can be used. Other (commercial) lysing solutions may be used after parallel testing and comparison. Within the EuroFlow protocol, erythrocyte lysis is performed after the antibody incubation phase. This results in the lowest cell loss, and the presence of a fixative prevents the decrease in MFI during the period between staining and data acquisition (Kalina, et al., 2012).
Alternatively, it is possible to adopt a Lysis‐no‐Wash method. With such procedures, aliquots of 50 to 100 μl of whole BM or PB are incubated with the antibody cocktail of each tube. After incubation at room temperature or at 4°C in the dark (because of the light sensitivity of fluorochromes), mature RBCs are lysed and the sample is immediately processed for acquisition by the flow cytometer, without any washing in between (Mathis et al., 2013).
3.2.2. Analysis of immature red blood cells
FCM analysis of MDS patients involves not only the granulocytic and monocytic lineages but also analysis of the erythroid cell compartment, which provides additional valuable information (Cremers, et al., 2017; Mathis et al., 2013; Westers, et al., 2017). However, because of the RBC lysis and centrifugation steps, some erythropoietic precursors (EP) may be destroyed as well. Consequently, the percentages of EP by FCM may differ from those obtained by cytological assessment. Previous publications have reported that lysis also alters the light scatter characteristics of EP resulting in smaller, more homogeneous cells compared with erythroid cells obtained by density sedimentation using Ficoll (Machherndl‐Spandl et al., 2013; Wangen et al., 2014). EP morphology was also found to be affected by lysis (Mathis et al., 2013). Of note, the proportion of erythropoiesis detected in non‐lysed BM by routine FCM panels showed better agreement with cytomorphology than data obtained from lysed BM samples (Violidaki et al., 2020). The proportion of myeloid blasts (measured by the frequencies of the CD34+ and CD117+ compartment) can thus be falsely elevated in the lysed BM due in part to the loss of the EP (Figure 1). Most of the abnormalities detected in the erythroid compartment of MDS samples are seen in both lysed and non‐lysed BM and therefore both approaches can be applied. Nevertheless, direct comparison in the same BM sample stained with the same antibody combinations with and without lysis had demonstrated significantly lower MFI and CV values of CD71, CD36, and CD117 in EP when lysis was performed (Violidaki, et al.). Therefore, using non‐lysed whole samples (optionally diluted in phosphate‐buffered saline [PBS]) with an adequate gating strategy thus seems a reasonable and feasible option for an accurate assessment of the erythroid compartment in suspected MDS. Of note, it is recommended to assign one fluorescence channel to a nuclear dye (e.g., DRAQ5), allowing the exclusion of nonnucleated elements, that is mature erythrocytes, by gating during acquisition.
FIGURE 1.
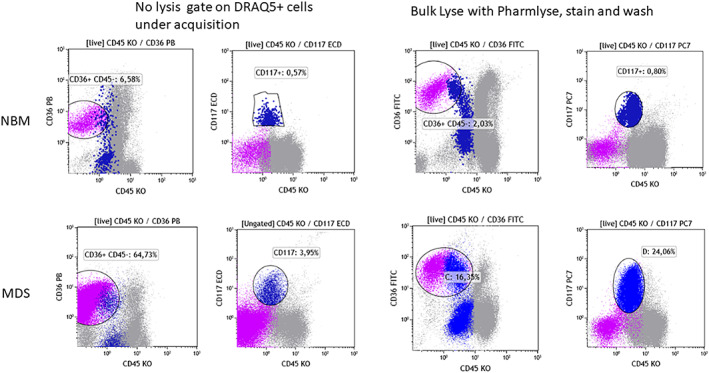
Impact of lysis on the erythroid compartment (CD36 + CD45−, violet dots) and on the frequency of immature myeloid cells (CD117+, dark blue dots). Upper row: Left two plots to show a normal BM sample processed without lysis. Cells were stained with a panel containing CD36 PB, CD45KO, and CD117 ECD. DRAQ5 was added after the staining and the acquisition gate was set on DRAQ5 positive cells. Right two plots: A part of the sample was subjected to bulk lysis (with NH4Cl‐based lysis buffer) and stained with a panel containing CD36FITC, CD45KO, and CD117PC7. Lower row: A BM sample from an MDS patient processed in a similar way [Color figure can be viewed at wileyonlinelibrary.com]
3.2.3. Impact of dead cells
Due to the pre‐analytical processing and depending on the type of lysis used, the viability of some cell subsets may be affected, resulting in an increase of the dead‐cell fraction (debris). The bulk‐lysis protocol developed by EuroFlow did not result in increased percentages of debris or doublets, although cell viability was not explicitly investigated (Flores‐Montero et al., 2017; Theunissen, et al., 2017). Some dead cells may nonspecifically bind monoclonal antibodies and/or the fluorochrome conjugate, resulting in higher background staining. The optimal way to assess only viable nucleated cells is to use a nuclear viability dye, such as 7AAD or DRAQ7 (Shenkin et al., 2007). This also allows exclusion of erythroid cells that have lost their nucleus. Alternatively, amine‐staining dyes have recently been investigated; they bind cell membrane‐bound amines that are highly increased on dead cells. The amine‐staining dyes thereby allow only to examine the live cell population for analysis (Perfetto et al., 2006). At this moment, we do not recommend the addition of viability dyes for the analysis of leukocytes, but this issue will be evaluated and discussed within future ELN iMDS Flow WG meetings.
4. PANEL
Various groups have published recommendations on panel design and have been proscriptive in stipulating antigen and fluorochrome combinations (Lacombe et al., 2016; van Dongen, et al., 2012). While our guidelines have not been devised that way, it is critical that when individuals or groups of laboratories implement panels, extensive validation, verification, and optimization steps are required to ensure that antigenic patterns are consistent in normal BM samples and appropriate cytopenic controls. Confirmation of staining using positive and negative controls is insufficient as the intensity and maturation patterns are critical (Figure 2). Unless there is an unavoidable reason for locally developed panels to be tested, we recommend a fully validated and published combination be used.
FIGURE 2.
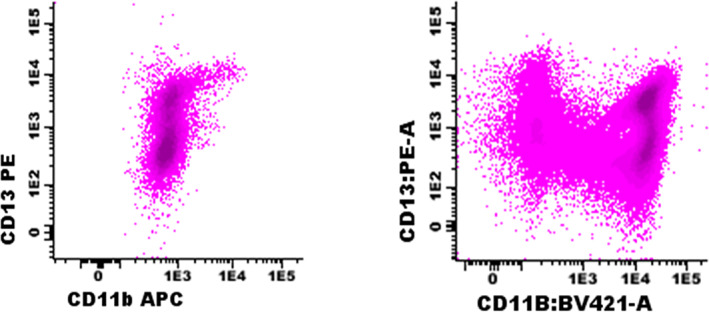
Example of CD13 versus CD11b demonstrating granulocytic maturation in a BM aspirate tested with suboptimal antibody combinations (left panel; CD11b clone D12, APC) and a validated panel (right panel; CD11b clone 10.1, BV421). Cells were gated based on CD45‐SSC and resulting granulocytic cells are shown in the plots. In the right plot, variable expression of CD11b can be observed, with the highest CD11b expression on the most mature granulocytes. In contrast, in the left plot, the staining is too weak and does not allow separation of CD11b‐negative and CD11b‐positive cells. Since APC is a bright fluorochrome, this weak staining more likely is related to the applied clone or to an inappropriate antibody titer [Color figure can be viewed at wileyonlinelibrary.com]
Antibodies that are informative of dysplastic features are summarized in Table 1, and their diagnostic value is explained in detail in a separate paper in this issue of Clinical Cytometry. These antibodies are combined in FCM panels that produce a maximum of information about differentiation of specific subsets for example CD34/CD117/HLA‐DR, CD13/CD11b/CD16, and CD105/CD71/CD36 for myeloid progenitor, neutrophilic and erythroid maturation, respectively. CD45 should be included as a minimum backbone in every tube. Increasing the number of recurring (backbone) markers in every tube facilitates more accurate gating procedures upon analysis of the cellular compartments of the BM (van Dongen, et al., 2012). The exact composition of the antibody panel may depend on local guidelines, available equipment, core facilities, and resources. Therefore, we provide general FCM guidelines but do not propose strict recommendations for specific antibodies and fluorochromes. Nevertheless, we recommend using at least eight‐color panels to allow optimal gating strategies and evaluation of all relevant cell populations. Various fluorochrome‐antibody conjugates can be used, but the general principles for panel design and antibody titration should be taken into account. Examples of two well‐validated and commonly used panels for evaluation of MDS patients are shown in Tables 2 and 3 (Porwit & Rajab, 2015; van Dongen, et al., 2012). All antibodies used should undergo quality control and internal validation testing before its first use, to ensure comparable fluorescence intensities between antibody lots and over time.
TABLE 1.
Recommended antibodies for FCM analysis of various cell types
| Cell subset | Backbone markers | Recommended markers | Optional |
|---|---|---|---|
| Myeloid progenitor | CD45, CD34, CD117, HLA‐DR | CD13, CD33, CD10, CD11b, CD15, CD38, CD7, CD56 | TdT, CD5, CD19, CD25, CD133 |
| Lymphoid progenitor | CD45, CD34 | HLA‐DR, CD10, CD19 | CD22 |
| Granulocyte | CD45, CD117 | HLA‐DR, CD13, CD33, CD11b, CD16, CD10, CD15, CD14, CD64, CD56 | CD34, CD5, CD7 |
| Monocyte | CD45 | HLA‐DR, CD13, CD33, CD11b, CD14, CD34, CD36, CD64, CD16, CD56, CD117 | CD2, MDC8 (Slan), CD300e |
| Erythroid | CD45, CD34, CD117 | HLA‐DR, CD36, CD71, CD105, CD13, CD33 | CD235a |
| Optional cell subsets for analysis: | |||
| Basophil | CD45 | CD123, HLA‐DR | CD203c |
| Mast cell | CD117 | CD45, HLA‐DR | CD2, CD25 |
| Dendritic cell | CD45, CD34, CD117 | HLA‐DR, CD123 | CD11c CD1c, CD141, CD303 |
TABLE 2.
Example of eight‐color FCM panel for analysis of MDS patients: EuroFlow (van Dongen, et al., 2012)
| PB | PO | FITC | PE | PerCP Cy5.5 | PC7 | APC | APC H7 | Aim | |
|---|---|---|---|---|---|---|---|---|---|
| 1 | HLADR | CD45 | CD16 | CD13 | CD34 | CD117 | CD11b | CD10 | Focused on granulocytic lineage |
| 2 | HLADR | CD45 | CD35 | CD64 | CD34 | CD117 | IREM2 | CD14 | Focused on monocytic lineage |
| 3 | HLADR | CD45 | CD36 | CD105 | CD34 | CD117 | CD33 | CD71 | Focused on erythroid lineage |
| 4 | HLADR | CD45 | TdT | CD56 | CD34 | CD117 | CD7 | CD19 | Aberrant expression of lymphoid markers |
Abbreviations: APC, allophycocyanin; APC‐H7, allophycocyanin‐Hilite; FITC, fluorescein isothiocyanate; PB, Pacific Blue; PC7, phycoerythrin cyanin 7; PE, phycoerythrin; PerCP‐Cy5.5, phycoerythrin cyanin 5.5; PO, Pacific Orange.
TABLE 3.
Example of 10‐color FCM panel for analysis of MDS patients: Canada (Porwit & Rajab, 2015)
| FITC | PE | ECD | PC5.5 | PC7 | APC | APC‐F700 | APC‐F750 | PB | KO | ||
|---|---|---|---|---|---|---|---|---|---|---|---|
| 1 a | CD4/Kappa | CD8/Lambda | CD3/CD14 | CD33 | CD20/CD56 | CD34 | CD19 | CD10 | CD5 | CD45 | |
| 2 | CD65 | CD13 | CD14 | CD33 | CD34 | CD117 | CD7 | CD11b | CD16 | CD45 | |
| 3 | CD36 | CD64 | CD56 | CD33 | CD34 | CD123 | CD19 | CD38 | HLA‐DR | CD45 | |
| 4 | CD71 | CD11c | CD4 | CD33 | CD34 | CD2 | CD10 | CD235a | CD15 | CD45 | |
Note: Tube 1 is meant for screening, tube 2–4 for more detailed MDS analyses.
Abbreviations: APC, allophycocyanin; ECD, phycoerythrin‐Texas red‐X; FITC, fluorescein isothiocyanate; KO, Krome Orange; PB, Pacific Blue; PC5.5, phycoerythrin cyanin 5.5; PC7, phycoerythrin cyanin 7; PE, phycoerythrin.
Screening tube.
Notably, the markers recommended only identify those that have been validated in a multicenter setting. Several studies have introduced markers that may be of additive value, either as a single marker, in combination with a diagnostic mini‐panel or in combination with other markers (Alayed et al., 2020; Della Porta et al., 2012; Mestrum et al., 2021; Shameli et al., 2020).
5. FIXATION OF SAMPLES
For samples processed with the stain‐lyse‐wash method, we recommended to fix the cells after staining and washing in order to stabilize cell membranes, prevent possible dissociation of antibodies and reduce biohazard (Lanier & Warner, 1981). Washed cells should be suspended in fixation buffer (0.5% paraformaldehyde [PFA] in PBS [pH 7.4] is recommended) and preferably be acquired within 1 h. If unavoidable, they can be kept at 4°C in the dark, up to 24 h.
6. FLOW CYTOMETER INSTRUMENT SET‐UP
MDS assays require appropriate instrument settings, similar to other FCM assays for hematological malignancies. Each cytometer should be set up and calibrated according to the supplier's recommendation, generally including setup beads. It is recommended to set up the instrument further using either the EuroFlow approach or the Harmonemia approach (Kalina, et al., 2012; Lacombe et al., 2016). Both approaches use specific fluorescence targets to generate highly comparable data between different cytometers and between different laboratories. Some current cytometers allow the exchange of assays including information about instrument set‐up, allowing the cytometer to automatically set itself up so that highly comparable data can be obtained. A strict daily quality assessment should be performed according to the supplier's recommendation.
The stability of the cytometer's performance over time is essential for MDS analysis. This is because many parameters in the FCM MDS score depend on measuring relatively discrete changes that rely on preset reference ranges and ratios. For example, overexpression of CD117 on myeloid progenitors may be defined based on the populations' CD117 median fluorescent intensity crossing a preset threshold. Thresholds and ratios are based on previous analyses of normal, reactive, and pathological BM control samples. Hence, stable longitudinal performance is essential, and when changes occur in cytometer output for any reason, re‐verification of the preset reference ranges is required. Compensation settings can potentially be challenging due to the simultaneous analysis of several cell subsets with different autofluorescence and compensation requirements. While compensation may require updating at regular intervals, the analysis strategy used should be locked down.
7. DATA ACQUISITION
After processing and staining the sample, the cells should be acquired as soon as possible, preferably within 1 h of completing the staining procedure (Alhan et al., 2016; Kalina, et al., 2012). If cells cannot be measured immediately, they should be stored at 4°C in darkness (see the section on fixation).
In addition to fluorescence channels, forward scatter (FSC) and side scatter (SSC), it is recommended to include FSC‐Height to exclude cell doublets and to include the time parameter to check and ensure the stability of sample acquisition/flow.
In order to have reliable analysis of rare cell populations, a minimum of 100,000 WBCs should be acquired per tube with a minimum of 250 CD34+ cells. For samples processed according to lyse‐no‐wash methods (e.g., for evaluation of monocytes in PB) or stain‐no wash methods (e.g., evaluation of erythroid lineage) appropriate gates should be set and sufficient cells should be acquired in order to perform reliable analysis (e.g., 10,000 monocytes or 100,000 erythroid cells).
Obviously, the final data are dependent on sample processing, antibody panel, and instrument settings. Figure 3 shows an example of FCM data of granulocytes and their precursors in normal BM samples obtained in three different laboratories, showing similarities and differences in the FCM results. As indicated before, it is most critical that the same assay is being applied within a laboratory and that this assay has well been validated using appropriate controls.
FIGURE 3.
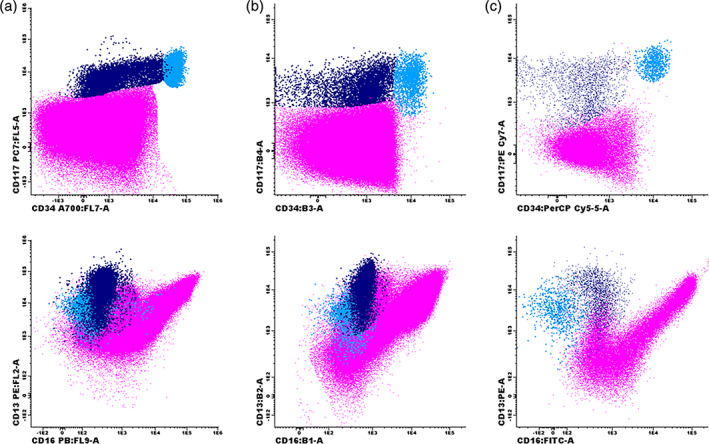
Example of granulocytic maturation in normal bone marrow samples stained and processed according to different protocols. (a) Lyse‐wash‐stain‐wash‐fix‐acquire on Navios protocol, labeling CD56‐FITC/CD13‐PE/CD14‐ECD/CD10‐PC5.5/CD117‐PC7/CD11b‐APC/CD34‐A700/CD33‐A750/CD16‐PB/CD45‐KO. (b) Lyse‐wash‐stain‐wash‐acquire on FACS Canto protocol, labeling CD45‐V500c/HLADR‐BV421/CD16‐FITC/CD13‐PE/CD34‐PerCP‐Cy5.5/CD117‐PC7/CD33‐APC/CD11b‐APCCy7. (c) Stain‐lyse‐wash‐acquire on FACS Canto protocol, labeling CD45‐PO/HLADR‐PB/CD16‐FITC/CD13‐PE/ CD34‐PerCP‐Cy5.5//CD117‐PC7/CD11b‐APC/CD10‐APCH7. CD34+/CD117+ myeloid progenitors are shown in light blue; promyelocytes (CD34‐/CD117+/CD13+) are shown in dark blue; granulocytes are shown in purple [Color figure can be viewed at wileyonlinelibrary.com]
8. PRE‐ANALYTICAL ISSUES RELATED TO SPECIFIC CELL POPULATIONS
In addition to the general pre‐analytical recommendations and considerations reported above, there are some explicit technical and pre‐analytical recommendations for specific cell populations.
8.1. Granulocytes
The most commonly encountered problem encountered when analyzing maturing myeloid cells is hemodilution. This results in a right shift, towards the more mature neutrophilic cells (CD16++/CD11b++/CD13++/CD15++). Furthermore, a processing time longer than 24 h can account for changes of antigen expression, for example CD16 or CD11b, and scatter properties of cells due to aged BM specimen (Alhan et al., 2016; Loken et al., 2008; Loken & Wells, 2008). Aged cells present with a clearly lower CD11b and a slightly lower CD16 expression intensity. In addition to affecting marker expression, a delay in the time between staining and acquisition causes an increase in the sideward scatter (SSC) signal of neutrophils, and storage of stained samples at 4°C further enhances this effect (Alhan et al., 2016).
8.2. Monocytes
FCM characterization of monocytic maturation and aberrant antigen expression is of particular value as the assessment of promonocytes by cytomorphology can be challenging (possible minor differences between promonocytes and atypical mature monocytes or blast cells). When performing FCM assessment of the monocyte lineage special attention should be paid to autofluorescence as this is more pronounced in this lineage. The most common abnormal antigen expression seen on the monocyte lineage is CD56 (see separate paper on our multicenter study in this issue of Clinical Cytometry). It is critical that each laboratory establishes its own cutoff levels for the increased autofluorescence detected. Furthermore, it is well established that monocytes (also granulocytes and myeloid progenitor cells) can upregulate CD56 following treatment and that CD56 may also be increased during infection. Therefore, caution should be exercised when assessing such immunophenotypic abnormalities, particularly in posttreatment samples.
For the identification of patients with possible CMML, the “monocyte assay” can be used to analyze monocyte subsets based on the expression of CD14 and CD16 (Selimoglu‐Buet, et al., 2015). For this assay, fresh whole blood samples collected in EDTA should be used, with a volume of 200 μl to ensure the acquisition of at least 10,000 events of classical monocytes. Samples should be processed immediately following a lyse‐no‐wash approach, since washing steps may lead to lower CD16 staining, likely due to the weak affinity of the antibody, which may hamper appropriate gating of the classical monocytes population (see Figure 4 for illustrative case).
FIGURE 4.
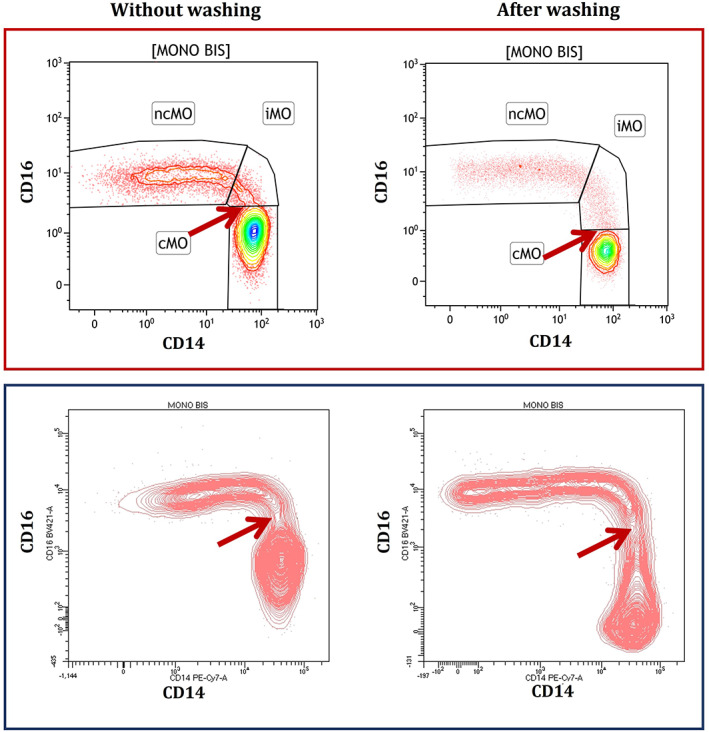
Example of the same sample from a healthy blood donor analyzed without (left panels) or with (right panels) washing procedure on two different flow cytometers from different manufacturers (upper and lower panel) [Color figure can be viewed at wileyonlinelibrary.com]
8.3. Erythroid cells
As previously described, sample preparation is important for the analysis of the erythroid lineage. Our multicenter study (Westers, et al., 2017) demonstrated that erythroid parameters obtained from lysed BM samples could contribute to the evaluation of dysplasia in suspected MDS. These markers concerned the coefficient of variance (CV) of the expression of CD36 and CD71 (both increased in MDS), the expression of CD71 (decreased), and the percentage of CD117+ erythroid precursors (decreased or increased). The application of these markers in a separate cohort confirmed their validity in the FCM analysis of MDS (Cremers, et al., 2017). Analysis of non‐lysed BM revealed differences in subset distribution, expression levels, and CV values. Yet, identified markers in the non‐lysed setting remain informative for MDS‐associated dysplasia. Validated reference values must be applied to the sample preparation method used in that respective laboratory.
8.4. Rare cell types
In addition to the major cell lineages studied in MDS, rare myeloid cells may be examined by FCM as well, including basophils, eosinophils, and mast cells (Valent, Horny, et al., 2007; Valent, Orazi, Steensma, et al., 2017). These cells are analyzed, depending on clinical, histopathological, cytogenetic, and molecular data (Valent, Horny, et al., 2007; Valent, Sotlar, Blatt, et al., 2017). For example, in patients with a known mast cell disease, elevated tryptase, or an identified KIT mutation, mast cells have to be examined in order to exclude or confirm the presence of a concomitant systemic mastocytosis (SM‐MDS) (Valent, Akin, et al., 2007; Valent, Akin, Hartmann, et al., 2017; Valent, Akin, & Metcalfe, 2017). For mast cell analysis, it is of utmost importance that the BM aspirate sample is of optimal quality and that the cells are analyzed within 12 h (Valent, Akin, et al., 2007). Aberrant expression of CD2, CD25, and/or CD30 on mast cells is a minor diagnostic criterion of SM and if present, suggests a diagnosis of SM (Valent, Akin, et al., 2007; Valent, Akin, Hartmann, et al., 2017; Valent, Akin, & Metcalfe, 2017). In patients with suspected concomitant mast cell leukemia (MCL), the same markers can be applied (Valent, Akin, et al., 2007; Valent, Akin, Hartmann, et al., 2017; Valent, Akin, & Metcalfe, 2017; Valent et al., 2014). Differential diagnoses are myelomastocytic leukemia (MML) (Valent et al., 2014) and basophilic leukemia (Valent, Sotlar, Blatt, et al., 2017). Both conditions may be detected in advanced MDS but are usually not seen in low‐risk MDS. In patients with MML, mast cells account for at least 10% of all cells in the BM or PB smear (Valent et al., 2014). However, in contrast to MCL, SM criteria are not fulfilled (e.g. KIT D816V mutation is not detected) and mast cells usually stain negative for CD2, CD25, and CD30 (Valent et al., 2014). Basophilic leukemia may present as acute or chronic secondary basophilic leukemia in MDS (Valent, Sotlar, Blatt, et al., 2017). In contrast to mast cells, basophils usually display high levels of CD203c and low levels of CD117 (Valent, Sotlar, Blatt, et al., 2017). It is also worth noting that basophils are sometimes elevated in patients with high‐risk MDS even if no basophilic leukemia can be detected (basophils account for less than 40%). Basophilia is of prognostic significance in these cases, and the same holds true for eosinophilia (Matsushima et al., 2003; Valent, Sotlar, Blatt, et al., 2017; Wimazal et al., 2010). Therefore, FCM can also be clinically helpful to determine the numbers (percentages) of basophils and/or eosinophils in BM samples, for example, when a dry tap was obtained. Another indication for eosinophil immunophenotyping is suspected eosinophilic leukemia or a myeloid neoplasm with eosinophilia and rearranged PDGFR or FGFR.
9. HARDWARE
The number of lasers and detectors, the setup of the filters, and digital or analog data processing will affect the number of antibodies and the types of fluorochromes that can be assessed simultaneously and will significantly impact the fluorescence patterns obtained. Several original and seminal papers pioneering FCM MDS analysis and scoring date back to the period before multi‐laser and multicolor cytometers were used in routine diagnostic laboratories (Ogata et al., 2002; Stetler‐Stevenson et al., 2001; van de Loosdrecht et al., 2008; van Lochem et al., 2004; Wells et al., 2003). Since multicolor FCM has been applied, more detailed identification of antigen expression and maturation patterns on strict antigen‐defined cell subsets has become possible. For example, defining the monocyte population in a BM from immature CD117 + HLA‐DR++ cells to mature CD14 + CD300e + cells and also tracking aberrancies and difference‐from‐normal patterns, probably requires more than six antigens per analysis tube to ensure the purity of the population studied (van Dongen, et al., 2012). The current recommended score (see accompanying analytical paper) is based on data derived from 6 to ≥8 color studies.
Technologies are now available that allow for a much higher number of antigens to be studied simultaneously. This includes mass and spectral cytometry. However, their application in the context of myelodysplasia is still minimal. One study that used mass cytometry was recently published and highlighted potential new useful parameters that need further investigation (Behbehani et al., 2020). Whether the diagnostic or prognostic power of FCM will increase by “deep immunophenotyping” approaches has yet to be demonstrated. The hematopoietic cell immunophenotype is known to differ between clonal and nonclonal cytopenias. An increased number of antigens may improve the diagnostic and prognostic contribution of FCM if robust evaluation studies are carried out. However, no matter how much data are available, its clinical usefulness relies on the ability to translate this research into practicable service delivery. Therefore, multiparameter software solutions for both current and future hardware and panels are required (Costa et al., 2006; Lhermitte et al., 2018; Pedreira, et al., 2008; Pedreira, Costa, Arroyo, et al., 2008; Saeys et al., 2016; Van Gassen et al., 2015; Van Gassen et al., 2016); these will be discussed in more detail in the accompanying manuscript on the analytical issues.
10. CONCLUSIONS
FCM can contribute to the diagnosis and prognostication of MDS patients. To obtain meaningful and comparable inter‐laboratory data, pre‐analytical sample handling is critical. We recommend a lyse‐stain‐wash‐fix protocol for analyzing leukocytes; different protocols are still being used for analyzing erythroid cells. Unfortunately, there is still no standardized protocol that is generally adopted and there are no strict minimal criteria for FCM analysis in MDS. This may partly be due to the rapid technological progress in the field (ability to detect an increasing number of parameters simultaneously) and the complexity of quantitative analysis of the FCM data by current software approaches. Novel software tools will further facilitate and improve the analyses of MDS data and will likely contribute to more common and standardized data sets. The pre‐analytical recommendations provided by our network remain the basis for current and future FCM MDS assays and should contribute to improved and implementable laboratory diagnostics for MDS patients. Further standardization and harmonization will be essential to implementing FCM in routine diagnostic evaluations in MDS, a major focus of our ELN iMDS Flow WG.
AUTHOR CONTRIBUTIONS
All persons listed as coauthors contributed to preconference and post‐conference discussions and actively participated in the Standardization Conferences. All coauthors contributed equally by discussing criteria, standards and recommendations at the Working Conference: 14th/2nd virtual annual ELN MDS Flow Working Conference April 30, 2021; 13th/1st virtual meeting November 6, 2020; 12th ELN MDS Flow Working Conference October 31–November 2, 2019, Nijmegen, Netherlands; 11th Annual meeting November 1–3, 2018, Munich, Germany; 10th Annual meeting, November 2–4, 2017, Lund, Sweden; 9th Annual meeting, October 27–29, 2016, Paris, France; 8th Annual meeting October 29–31, 2015, Athens, Greece. In addition, all persons listed as coauthors provided essential input by drafting parts of the manuscript and approving the document's final version.
ACKNOWLEDGMENTS
Peter Valent was supported by the Austrian Science Fund, grant F4704‐B20. Nicolas Chapuis and Michaela Fontenay were supported by the European Union's Horizon 2020 research and innovation program under grant agreement No. 634789.
van der Velden, V. H. J. , Preijers, F. , Johansson, U. , Westers, T. M. , Dunlop, A. , Porwit, A. , Béné, M. C. , Valent, P. , te Marvelde, J. , Wagner‐Ballon, O. , Oelschlaegel, U. , Saft, L. , Kordasti, S. , Ireland, R. , Cremers, E. , Alhan, C. , Duetz, C. , Hobo, W. , Chapuis, N. , Fontenay, M. , Bettelheim, P. , Eidenshink‐Brodersen, L. , Font, P. , Loken, M. R. , Matarraz, S. , Ogata, K. , Orfao, A. , Psarra, K. , Subirá, D. , Wells, D. A. , Della Porta, M. G. , Burbury, K. , Bellos, F. , Weiß, E. , Kern, W. , & van de Loosdrecht, A. (2023). Flow cytometric analysis of myelodysplasia: Pre‐analytical and technical issues—Recommendations from the European LeukemiaNet . Cytometry Part B: Clinical Cytometry, 104(1), 15–26. 10.1002/cyto.b.22046
Funding information Austrian Science Fund, Grant/Award Number: F4704‐B20; Horizon 2020 Framework Programme, Grant/Award Number: 634789
REFERENCES
- Aalbers, A. M. , van den Heuvel‐Eibrink, M. M. , Baumann, I. , Dworzak, M. , Hasle, H. , Locatelli, F. , De Moerloose, B. , Schmugge, M. , Mejstrikova, E. , Novakova, M. , Zecca, M. , Zwaan, C. M. , Te Marvelde, J. G. , Langerak, A. W. , van Dongen, J. J. , Pieters, R. , Niemeyer, C. M. , & van der Velden, V. H. (2015). Bone marrow immunophenotyping by flow cytometry in refractory cytopenia of childhood. Haematologica, 100, 315–323. [DOI] [PMC free article] [PubMed] [Google Scholar]
- Aalbers, A. M. , van den Heuvel‐Eibrink, M. M. , de Haas, V. , Te Marvelde, J. G. , de Jong, A. X. , van der Burg, M. , Dworzak, M. , Hasle, H. , Locatelli, F. , De Moerloose, B. , Schmugge, M. , Stary, J. , Zecca, M. , Zwaan, C. M. , van de Loosdrecht, A. A. , van Dongen, J. J. , Niemeyer, C. M. , & van der Velden, V. H. (2013). Applicability of a reproducible flow cytometry scoring system in the diagnosis of refractory cytopenia of childhood. Leukemia, 27, 1923–1925. [DOI] [PubMed] [Google Scholar]
- Aires, A. , Teixeira, M. D. A. , Lau, C. , Moreira, C. , Spinola, A. , Mota, A. , Freitas, I. , Coutinho, J. , & Lima, M. (2018). A pilot study on the usefulness of peripheral blood flow cytometry for the diagnosis of lower risk myelodysplastic syndromes: The "MDS thermometer". BMC Hematology, 18, 6. [DOI] [PMC free article] [PubMed] [Google Scholar]
- Alayed, K. , Meyerson, J. B. , Osei, E. S. , Blidaru, G. , Schlegelmilch, J. , Johnson, M. , & Meyerson, H. J. (2020). CD177 enhances the detection of Myelodysplastic syndrome by flow Cytometry. American Journal of Clinical Pathology, 153, 554–565. [DOI] [PubMed] [Google Scholar]
- Aldawood, A. M. , Kinkade, Z. , Rosado, F. G. , Esan, O. A. , Gibson, L. F. , & Vos, J. A. (2015). A novel method to assess bone marrow purity is useful in determining blast percentage by flow Cytometry in acute myeloid leukemia and Myelodysplasia. Annals of Hematology & Oncology, 2, 1038. [PMC free article] [PubMed] [Google Scholar]
- Alhan, C. , Westers, T. M. , Cremers, E. M. , Cali, C. , Ossenkoppele, G. J. , & van de Loosdrecht, A. A. (2016). Application of flow cytometry for myelodysplastic syndromes: Pitfalls and technical considerations. Cytometry. Part B, Clinical Cytometry, 90, 358–367. [DOI] [PubMed] [Google Scholar]
- Behbehani, G. K. , Finck, R. , Samusik, N. , Sridhar, K. , Fantl, W. J. , Greenberg, P. L. , & Nolan, G. P. (2020). Profiling myelodysplastic syndromes by mass cytometry demonstrates abnormal progenitor cell phenotype and differentiation. Cytometry. Part B, Clinical Cytometry, 98, 131–145. [DOI] [PMC free article] [PubMed] [Google Scholar]
- Brooimans, R. A. , Kraan, J. , van Putten, W. , Cornelissen, J. J. , Lowenberg, B. , & Gratama, J. W. (2009). Flow cytometric differential of leukocyte populations in normal bone marrow: Influence of peripheral blood contamination. Cytometry. Part B, Clinical Cytometry, 76, 18–26. [DOI] [PubMed] [Google Scholar]
- Cherian, S. , Moore, J. , Bantly, A. , Vergilio, J. A. , Klein, P. , Luger, S. , & Bagg, A. (2005a). Flow‐cytometric analysis of peripheral blood neutrophils: A simple, objective, independent and potentially clinically useful assay to facilitate the diagnosis of myelodysplastic syndromes. American Journal of Hematology, 79, 243–245. [DOI] [PubMed] [Google Scholar]
- Cherian, S. , Moore, J. , Bantly, A. , Vergilio, J. A. , Klein, P. , Luger, S. , & Bagg, A. (2005b). Peripheral blood MDS score: A new flow cytometric tool for the diagnosis of myelodysplastic syndromes. Cytometry. Part B, Clinical Cytometry, 64, 9–17. [DOI] [PubMed] [Google Scholar]
- Costa, E. S. , Arroyo, M. E. , Pedreira, C. E. , Garcia‐Marcos, M. A. , Tabernero, M. D. , Almeida, J. , & Orfao, A. (2006). A new automated flow cytometry data analysis approach for the diagnostic screening of neoplastic B‐cell disorders in peripheral blood samples with absolute lymphocytosis. Leukemia, 20, 1221–1230. [DOI] [PubMed] [Google Scholar]
- Cremers, E. M. , Westers, T. M. , Alhan, C. , Cali, C. , Visser‐Wisselaar, H. A. , Chitu, D. A. , van der Velden, V. H. , Te Marvelde, J. G. , Klein, S. K. , Muus, P. , Vellenga, E. , de Greef, G. E. , Legdeur, M. C. , Wijermans, P. W. , Stevens‐Kroef, M. J. , Silva‐Coelho, P. D. , Jansen, J. H. , Ossenkoppele, G. J. , van de Loosdrecht, A. A. , & group AsobotHs . (2017). Implementation of erythroid lineage analysis by flow cytometry in diagnostic models for myelodysplastic syndromes. Haematologica, 102, 320–326. [DOI] [PMC free article] [PubMed] [Google Scholar]
- Delgado, J. A. , Guillen‐Grima, F. , Moreno, C. , Panizo, C. , Perez‐Robles, C. , Mata, J. J. , Moreno, L. , Arana, P. , Chocarro, S. , & Merino, J. (2017). A simple flow‐cytometry method to evaluate peripheral blood contamination of bone marrow aspirates. Journal of Immunological Methods, 442, 54–58. [DOI] [PubMed] [Google Scholar]
- Della Porta, M. G. , Picone, C. , Pascutto, C. , Malcovati, L. , Tamura, H. , Handa, H. , Czader, M. , Freeman, S. , Vyas, P. , Porwit, A. , Saft, L. , Westers, T. M. , Alhan, C. , Cali, C. , van de Loosdrecht, A. A. , & Ogata, K. (2012). Multicenter validation of a reproducible flow cytometric score for the diagnosis of low‐grade myelodysplastic syndromes: Results of a European LeukemiaNET study. Haematologica, 97, 1209–1217. [DOI] [PMC free article] [PubMed] [Google Scholar]
- Elghetany, M. T. , & Davis, B. H. (2005). Impact of preanalytical variables on granulocytic surface antigen expression: A review. Cytometry. Part B, Clinical Cytometry, 65, 1–5. [DOI] [PubMed] [Google Scholar]
- Flores‐Montero, J. , Flores, L. S. , Paiva, B. , Puig, N. , Garcia‐Sanchez, O. , Bottcher, S. , van der Velden, V. H. , Perez‐Moran, J. J. , Vidriales, M. B. , Garcia‐Sanz, R. , Jimenez, C. , Gonzalez, M. , Martinez‐Lopez, J. , Mateos, A. C. , Grigore, G. E. , Fluxa, R. , Pontes, R. , Caetano, J. , Sedek, L. , … Orfao, A. (2017). Next generation flow (NGF) for highly sensitive and standardized detection of minimal residual disease in multiple myeloma. Leukemia, 31, 2094–2103. [DOI] [PMC free article] [PubMed] [Google Scholar]
- Kalina, T. , Flores‐Montero, J. , van der Velden, V. H. , Martin‐Ayuso, M. , Bottcher, S. , Ritgen, M. , Almeida, J. , Lhermitte, L. , Asnafi, V. , Mendonca, A. , de Tute, R. , Cullen, M. , Sedek, L. , Vidriales, M. B. , Perez, J. J. , te Marvelde, J. G. , Mejstrikova, E. , Hrusak, O. , Szczepanski, T. , … EuroFlow C . (2012). EuroFlow standardization of flow cytometer instrument settings and immunophenotyping protocols. Leukemia, 26, 1986–2010. [DOI] [PMC free article] [PubMed] [Google Scholar]
- Karai, B. , Miltenyi, Z. , Gergely, L. , Szaraz‐Szeles, M. , Kappelmayer, J. , & Hevessy, Z. (2018). The impact of delayed sample handling and type of anticoagulant on the interpretation of dysplastic signs detected by flow cytometry. Biochemia Medica, 28, 20704. [DOI] [PMC free article] [PubMed] [Google Scholar]
- Lacombe, F. , Bernal, E. , Bloxham, D. , Couzens, S. , Porta, M. G. , Johansson, U. , Kern, W. , Macey, M. , Matthes, T. , Morilla, R. , Paiva, A. , Palacio, C. , Preijers, F. , Ratei, R. , Siitonen, S. , Allou, K. , Porwit, A. , & Bene, M. C. (2016). Harmonemia: A universal strategy for flow cytometry immunophenotyping‐a European LeukemiaNet WP10 study. Leukemia, 30, 1769–1772. [DOI] [PubMed] [Google Scholar]
- Lanier, L. L. , & Warner, N. L. (1981). Paraformaldehyde fixation of hematopoietic cells for quantitative flow cytometry (FACS) analysis. Journal of Immunological Methods, 47, 25–30. [DOI] [PubMed] [Google Scholar]
- Lhermitte, L. , Mejstrikova, E. , van der Sluijs‐Gelling, A. J. , Grigore, G. E. , Sedek, L. , Bras, A. E. , Gaipa, G. , Sobral da Costa, E. , Novakova, M. , Sonneveld, E. , Buracchi, C. , de Sa Bacelar, T. , Te Marvelde, J. G. , Trinquand, A. , Asnafi, V. , Szczepanski, T. , Matarraz, S. , Lopez, A. , Vidriales, B. , … van der VHJ, V. (2018). Automated database‐guided expert‐supervised orientation for immunophenotypic diagnosis and classification of acute leukemia. Leukemia, 32, 874–881. [DOI] [PMC free article] [PubMed] [Google Scholar]
- Loken, M. R. , Chu, S. C. , Fritschle, W. , Kalnoski, M. , & Wells, D. A. (2009). Normalization of bone marrow aspirates for hemodilution in flow cytometric analyses. Cytometry. Part B, Clinical Cytometry, 76, 27–36. [DOI] [PubMed] [Google Scholar]
- Loken, M. R. , van de Loosdrecht, A. , Ogata, K. , Orfao, A. , & Wells, D. A. (2008). Flow cytometry in myelodysplastic syndromes: Report from a working conference. Leukemia Research, 32, 5–17. [DOI] [PubMed] [Google Scholar]
- Loken, M. R. , & Wells, D. A. (2008). The role of flow cytometry in myelodysplastic syndromes. Journal of the National Comprehensive Cancer Network, 6, 935–941. [DOI] [PubMed] [Google Scholar]
- Machherndl‐Spandl, S. , Suessner, S. , Danzer, M. , Proell, J. , Gabriel, C. , Lauf, J. , Sylie, R. , Klein, H. U. , Bene, M. C. , Weltermann, A. , & Bettelheim, P. (2013). Molecular pathways of early CD105‐positive erythroid cells as compared with CD34‐positive common precursor cells by flow cytometric cell‐sorting and gene expression profiling. Blood Cancer Journal, 3, e100. [DOI] [PMC free article] [PubMed] [Google Scholar]
- Mathis, S. , Chapuis, N. , Debord, C. , Rouquette, A. , Radford‐Weiss, I. , Park, S. , Dreyfus, F. , Lacombe, C. , Bene, M. C. , Kosmider, O. , Fontenay, M. , & Bardet, V. (2013). Flow cytometric detection of dyserythropoiesis: A sensitive and powerful diagnostic tool for myelodysplastic syndromes. Leukemia, 27, 1981–1987. [DOI] [PubMed] [Google Scholar]
- Matsushima, T. , Handa, H. , Yokohama, A. , Nagasaki, J. , Koiso, H. , Kin, Y. , Tanaka, Y. , Sakura, T. , Tsukamoto, N. , Karasawa, M. , Itoh, K. , Hirabayashi, H. , Sawamura, M. , Shinonome, S. , Shimano, S. , Miyawaki, S. , Nojima, Y. , & Murakami, H. (2003). Prevalence and clinical characteristics of myelodysplastic syndrome with bone marrow eosinophilia or basophilia. Blood, 101, 3386–3390. [DOI] [PubMed] [Google Scholar]
- Mestrum, S. G. C. , Hopman, A. H. N. , FCS, R. , & MPG, L. (2021). The potential of proliferative and apoptotic parameters in clinical flow cytometry of myeloid malignancies. Blood Advances, 5, 2040–2052. [DOI] [PMC free article] [PubMed] [Google Scholar]
- Nombela‐Arrieta, C. , & Manz, M. G. (2017). Quantification and three‐dimensional microanatomical organization of the bone marrow. Blood Advances, 1, 407–416. [DOI] [PMC free article] [PubMed] [Google Scholar]
- Ogata, K. , Nakamura, K. , Yokose, N. , Tamura, H. , Tachibana, M. , Taniguchi, O. , Iwakiri, R. , Hayashi, T. , Sakamaki, H. , Murai, Y. , Tohyama, K. , Tomoyasu, S. , Nonaka, Y. , Mori, M. , Dan, K. , & Yoshida, Y. (2002). Clinical significance of phenotypic features of blasts in patients with myelodysplastic syndrome. Blood, 100, 3887–3896. [DOI] [PubMed] [Google Scholar]
- Pedreira, C. E. , Costa, E. S. , Arroyo, M. E. , Almeida, J. , & Orfao, A. (2008). A multidimensional classification approach for the automated analysis of flow cytometry data. IEEE Transactions on Biomedical Engineering, 55, 1155–1162. [DOI] [PubMed] [Google Scholar]
- Pedreira, C. E. , Costa, E. S. , Barrena, S. , Lecrevisse, Q. , Almeida, J. , van Dongen, J. J. , Orfao, A. , & EuroFlow C . (2008). Generation of flow cytometry data files with a potentially infinite number of dimensions. Cytometry. Part A, 73, 834–846. [DOI] [PubMed] [Google Scholar]
- Perfetto, S. P. , Ambrozak, D. , Nguyen, R. , Chattopadhyay, P. , & Roederer, M. (2006). Quality assurance for polychromatic flow cytometry. Nature Protocols, 1, 1522–1530. [DOI] [PubMed] [Google Scholar]
- Pont, J. , Souvignet, A. , Campos, L. , Plesa, A. , Bulabois, B. , Pernollet, M. , Raskovalova, T. , Dumestre‐Perard, C. , Cesbron, J. Y. , & Jacob, M. C. (2018). Accurate quantification of fourteen normal bone marrow cell subsets in infants to the elderly by flow cytometry. Cytometry. Part B, Clinical Cytometry, 94, 627–636. [DOI] [PubMed] [Google Scholar]
- Porwit, A. , & Rajab, A. (2015). Flow cytometry immunophenotyping in integrated diagnostics of patients with newly diagnosed cytopenia: One tube 10‐color 14‐antibody screening panel and 3‐tube extensive panel for detection of MDS‐related features. International Journal of Laboratory Hematology, 37(Suppl 1), 133–143. [DOI] [PubMed] [Google Scholar]
- Rashidi, H. H. , Xu, X. , Wang, H. Y. , Shafi, N. Q. , Rameshkumar, K. , Messer, K. , Smith, B. R. , & Rose, M. G. (2012). Utility of peripheral blood flow cytometry in differentiating low grade versus high grade myelodysplastic syndromes (MDS) and in the evaluation of cytopenias. International Journal of Clinical and Experimental Pathology, 5, 224–230. [PMC free article] [PubMed] [Google Scholar]
- Saeys, Y. , Van Gassen, S. , & Lambrecht, B. N. (2016). Computational flow cytometry: Helping to make sense of high‐dimensional immunology data. Nature Reviews. Immunology, 16, 449–462. [DOI] [PubMed] [Google Scholar]
- Sandes, A. F. , Yamamoto, M. , Matarraz, S. , Chauffaille Mde, L. , Quijano, S. , Lopez, A. , Oguro, T. , Kimura, E. Y. , & Orfao, A. (2012). Altered immunophenotypic features of peripheral blood platelets in myelodysplastic syndromes. Haematologica, 97, 895–902. [DOI] [PMC free article] [PubMed] [Google Scholar]
- Selimoglu‐Buet, D. , Wagner‐Ballon, O. , Saada, V. , Bardet, V. , Itzykson, R. , Bencheikh, L. , Morabito, M. , Met, E. , Debord, C. , Benayoun, E. , Nloga, A. M. , Fenaux, P. , Braun, T. , Willekens, C. , Quesnel, B. , Ades, L. , Fontenay, M. , Rameau, P. , Droin, N. , … Francophone Myelodysplasia G . (2015). Characteristic repartition of monocyte subsets as a diagnostic signature of chronic myelomonocytic leukemia. Blood, 125, 3618–3626. [DOI] [PMC free article] [PubMed] [Google Scholar]
- Shameli, A. , Dharmani‐Khan, P. , Luider, J. , Auer, I. , & Shabani‐Rad, M. T. (2020). Exploring blast composition in myelodysplastic syndromes and myelodysplastic/myeloproliferative neoplasms: CD45RA and CD371 improve diagnostic value of flow cytometry through assessment of myeloblast heterogeneity and stem cell aberrancy. Cytometry. Part B, Clinical Cytometry, 100, 574–589. [DOI] [PMC free article] [PubMed] [Google Scholar]
- Shenkin, M. , Babu, R. , & Maiese, R. (2007). Accurate assessment of cell count and viability with a flow cytometer. Cytometry. Part B, Clinical Cytometry, 72, 427–432. [DOI] [PubMed] [Google Scholar]
- Stachurski, D. , Smith, B. R. , Pozdnyakova, O. , Andersen, M. , Xiao, Z. , Raza, A. , Woda, B. A. , & Wang, S. A. (2008). Flow cytometric analysis of myelomonocytic cells by a pattern recognition approach is sensitive and specific in diagnosing myelodysplastic syndrome and related marrow diseases: Emphasis on a global evaluation and recognition of diagnostic pitfalls. Leukemia Research, 32, 215–224. [DOI] [PubMed] [Google Scholar]
- Stetler‐Stevenson, M. , Arthur, D. C. , Jabbour, N. , Xie, X. Y. , Molldrem, J. , Barrett, A. J. , Venzon, D. , & Rick, M. E. (2001). Diagnostic utility of flow cytometric immunophenotyping in myelodysplastic syndrome. Blood, 98, 979–987. [DOI] [PubMed] [Google Scholar]
- Theunissen, P. , Mejstrikova, E. , Sedek, L. , van der Sluijs‐Gelling, A. J. , Gaipa, G. , Bartels, M. , Sobral da Costa, E. , Kotrova, M. , Novakova, M. , Sonneveld, E. , Buracchi, C. , Bonaccorso, P. , Oliveira, E. , Te Marvelde, J. G. , Szczepanski, T. , Lhermitte, L. , Hrusak, O. , Lecrevisse, Q. , Grigore, G. E. , … EuroFlow C . (2017). Standardized flow cytometry for highly sensitive MRD measurements in B‐cell acute lymphoblastic leukemia. Blood, 129, 347–357. [DOI] [PMC free article] [PubMed] [Google Scholar]
- Valent, P. , Akin, C. , Escribano, L. , Fodinger, M. , Hartmann, K. , Brockow, K. , Castells, M. , Sperr, W. R. , Kluin‐Nelemans, H. C. , Hamdy, N. A. , Lortholary, O. , Robyn, J. , van Doormaal, J. , Sotlar, K. , Hauswirth, A. W. , Arock, M. , Hermine, O. , Hellmann, A. , Triggiani, M. , … Metcalfe, D. D. (2007). Standards and standardization in mastocytosis: Consensus statements on diagnostics, treatment recommendations and response criteria. European Journal of Clinical Investigation, 37, 435–453. [DOI] [PubMed] [Google Scholar]
- Valent, P. , Akin, C. , Hartmann, K. , Nilsson, G. , Reiter, A. , Hermine, O. , Sotlar, K. , Sperr, W. R. , Escribano, L. , George, T. I. , Kluin‐Nelemans, H. C. , Ustun, C. , Triggiani, M. , Brockow, K. , Gotlib, J. , Orfao, A. , Schwartz, L. B. , Broesby‐Olsen, S. , Bindslev‐Jensen, C. , … Metcalfe, D. D. (2017). Advances in the classification and treatment of Mastocytosis: Current status and outlook toward the future. Cancer Research, 77, 1261–1270. [DOI] [PMC free article] [PubMed] [Google Scholar]
- Valent, P. , Akin, C. , & Metcalfe, D. D. (2017). Mastocytosis: 2016 updated WHO classification and novel emerging treatment concepts. Blood, 129, 1420–1427. [DOI] [PMC free article] [PubMed] [Google Scholar]
- Valent, P. , Horny, H. P. , Bennett, J. M. , Fonatsch, C. , Germing, U. , Greenberg, P. , Haferlach, T. , Haase, D. , Kolb, H. J. , Krieger, O. , Loken, M. , van de Loosdrecht, A. , Ogata, K. , Orfao, A. , Pfeilstocker, M. , Ruter, B. , Sperr, W. R. , Stauder, R. , & Wells, D. A. (2007). Definitions and standards in the diagnosis and treatment of the myelodysplastic syndromes: Consensus statements and report from a working conference. Leukemia Research, 31, 727–736. [DOI] [PubMed] [Google Scholar]
- Valent, P. , Orazi, A. , Busche, G. , Schmitt‐Graff, A. , George, T. I. , Sotlar, K. , Streubel, B. , Beham‐Schmid, C. , Cerny‐Reiterer, S. , Krieger, O. , van de Loosdrecht, A. , Kern, W. , Ogata, K. , Wimazal, F. , Varkonyi, J. , Sperr, W. R. , Werner, M. , Kreipe, H. , & Horny, H. P. (2010). Standards and impact of hematopathology in myelodysplastic syndromes (MDS). Oncotarget, 1, 483–496. [DOI] [PMC free article] [PubMed] [Google Scholar]
- Valent, P. , Orazi, A. , Steensma, D. P. , Ebert, B. L. , Haase, D. , Malcovati, L. , van de Loosdrecht, A. A. , Haferlach, T. , Westers, T. M. , Wells, D. A. , Giagounidis, A. , Loken, M. , Orfao, A. , Lubbert, M. , Ganser, A. , Hofmann, W. K. , Ogata, K. , Schanz, J. , Bene, M. C. , … Bennett, J. M. (2017). Proposed minimal diagnostic criteria for myelodysplastic syndromes (MDS) and potential pre‐MDS conditions. Oncotarget, 8, 73483–73500. [DOI] [PMC free article] [PubMed] [Google Scholar]
- Valent, P. , Sotlar, K. , Blatt, K. , Hartmann, K. , Reiter, A. , Sadovnik, I. , Sperr, W. R. , Bettelheim, P. , Akin, C. , Bauer, K. , George, T. I. , Hadzijusufovic, E. , Wolf, D. , Gotlib, J. , Mahon, F. X. , Metcalfe, D. D. , Horny, H. P. , & Arock, M. (2017). Proposed diagnostic criteria and classification of basophilic leukemias and related disorders. Leukemia, 31, 788–797. [DOI] [PMC free article] [PubMed] [Google Scholar]
- Valent, P. , Sotlar, K. , Sperr, W. R. , Escribano, L. , Yavuz, S. , Reiter, A. , George, T. I. , Kluin‐Nelemans, H. C. , Hermine, O. , Butterfield, J. H. , Hagglund, H. , Ustun, C. , Hornick, J. L. , Triggiani, M. , Radia, D. , Akin, C. , Hartmann, K. , Gotlib, J. , Schwartz, L. B. , … Horny, H. P. (2014). Refined diagnostic criteria and classification of mast cell leukemia (MCL) and myelomastocytic leukemia (MML): A consensus proposal. Annals of Oncology, 25, 1691–1700. [DOI] [PMC free article] [PubMed] [Google Scholar]
- van de Loosdrecht, A. A. , Westers, T. M. , Westra, A. H. , Drager, A. M. , van der Velden, V. H. , & Ossenkoppele, G. J. (2008). Identification of distinct prognostic subgroups in low‐ and intermediate‐1‐risk myelodysplastic syndromes by flow cytometry. Blood, 111, 1067–1077. [DOI] [PubMed] [Google Scholar]
- van Dongen, J. J. , Lhermitte, L. , Bottcher, S. , Almeida, J. , van der Velden, V. H. , Flores‐Montero, J. , Rawstron, A. , Asnafi, V. , Lecrevisse, Q. , Lucio, P. , Mejstrikova, E. , Szczepanski, T. , Kalina, T. , de Tute, R. , Bruggemann, M. , Sedek, L. , Cullen, M. , Langerak, A. W. , Mendonca, A. , … EuroFlow C . (2012). EuroFlow antibody panels for standardized n‐dimensional flow cytometric immunophenotyping of normal, reactive and malignant leukocytes. Leukemia, 26, 1908–1975. [DOI] [PMC free article] [PubMed] [Google Scholar]
- Van Gassen, S. , Callebaut, B. , Van Helden, M. J. , Lambrecht, B. N. , Demeester, P. , Dhaene, T. , & Saeys, Y. (2015). FlowSOM: Using self‐organizing maps for visualization and interpretation of cytometry data. Cytometry. Part A, 87, 636–645. [DOI] [PubMed] [Google Scholar]
- Van Gassen, S. , Vens, C. , Dhaene, T. , Lambrecht, B. N. , & Saeys, Y. (2016). FloReMi: Flow density survival regression using minimal feature redundancy. Cytometry. Part A, 89, 22–29. [DOI] [PubMed] [Google Scholar]
- van Lochem, E. G. , van der Velden, V. H. , Wind, H. K. , te Marvelde, J. G. , Westerdaal, N. A. , & van Dongen, J. J. (2004). Immunophenotypic differentiation patterns of normal hematopoiesis in human bone marrow: Reference patterns for age‐related changes and disease‐induced shifts. Cytometry. Part B, Clinical Cytometry, 60, 1–13. [DOI] [PubMed] [Google Scholar]
- Violidaki, D. , Axler, O. , Jafari, K. , Bild, F. , Nilsson, L. , Mazur, J. , Ehinger, M. , & Porwit, A. (2020). Analysis of erythroid maturation in the non‐lysed bone marrow with help of radar‐plots facilitates detection of flow cytometric aberrations in myelodysplastic syndromes. Cytometry Part B: Clinical Cytometry, 98, 399–411. [DOI] [PubMed] [Google Scholar]
- Wangen, J. R. , Eidenschink Brodersen, L. , Stolk, T. T. , Wells, D. A. , & Loken, M. R. (2014). Assessment of normal erythropoiesis by flow cytometry: Important considerations for specimen preparation. International Journal of Laboratory Hematology, 36, 184–196. [DOI] [PubMed] [Google Scholar]
- Wells, D. A. , Benesch, M. , Loken, M. R. , Vallejo, C. , Myerson, D. , Leisenring, W. M. , & Deeg, H. J. (2003). Myeloid and monocytic dyspoiesis as determined by flow cytometric scoring in myelodysplastic syndrome correlates with the IPSS and with outcome after hematopoietic stem cell transplantation. Blood, 102, 394–403. [DOI] [PubMed] [Google Scholar]
- Westers, T. M. , Cremers, E. M. , Oelschlaegel, U. , Johansson, U. , Bettelheim, P. , Matarraz, S. , Orfao, A. , Moshaver, B. , Brodersen, L. E. , Loken, M. R. , Wells, D. A. , Subira, D. , Cullen, M. , Te Marvelde, J. G. , van der Velden, V. H. , Preijers, F. W. , Chu, S. C. , Feuillard, J. , Guerin, E. , … Group IMW . (2017). Immunophenotypic analysis of erythroid dysplasia in myelodysplastic syndromes. A report from the IMDSFlow working group. Haematologica, 102, 308–319. [DOI] [PMC free article] [PubMed] [Google Scholar]
- Wimazal, F. , Germing, U. , Kundi, M. , Noesslinger, T. , Blum, S. , Geissler, P. , Baumgartner, C. , Pfeilstoecker, M. , Valent, P. , & Sperr, W. R. (2010). Evaluation of the prognostic significance of eosinophilia and basophilia in a larger cohort of patients with myelodysplastic syndromes. Cancer, 116, 2372–2381. [DOI] [PubMed] [Google Scholar]