

Abstract
Background:
Surgery for older Americans is increasingly being performed at Ambulatory Surgery Centers (ASCs) rather than Hospital Outpatient Departments (HOPDs), while rates of multimorbidity have increased.
Objective:
To determine if there are differential outcomes in older patients undergoing surgical procedures at ASCs versus HOPDs.
Research Design:
Matched cohort study
Subjects:
30,958 Medicare patients treated in 2018 and 2019 at an ASC undergoing herniorrhaphy, cholecystectomy, or open breast procedures, matched to similar HOPD patients and another 32,702 matched pairs undergoing higher-risk procedures.
Measures:
7 and 30-day revisit and complications.
Results:
For the same procedures, HOPD patients displayed higher baseline predicted risk of 30-day revisits than ASC patients (13.09% versus 8.47%, P<0.0001), suggesting the presence of considerable selection on the part of surgeons. In matched Medicare patients with or without multimorbidity, we observed worse outcomes in HOPD patients: 30-day revisit rates were 8.1% in HOPD patients versus 6.2% in ASC patients (P<0.0001), and complication rates were 41.3% versus 28.8%, P<0.0001. Similar patterns were also found for 7-day outcomes, and in higher- risk procedures examined in a secondary analysis. Similar patterns were also observed when analyzing patients with and without multimorbidity separately.
Conclusions:
The rates of revisits and complications for ASC patients were far lower than for closely matched HOPD patients. The observed initial baseline risk in HOPD patients was much higher than the baseline risk for the same procedures performed at the ASC, suggesting that surgeons are appropriately selecting their riskier patients to be treated at the HOPD rather than the ASC.
Keywords: Ambulatory Surgery, Medicare, Outcomes, Quality of Care, Safety
INTRODUCTION
Surgery for older Americans is increasingly being performed at Ambulatory Surgery Centers (ASCs),1–3 while the number of older patients with multimorbidity has been steadily increasing.4–9 We ask whether there are differential outcomes in older patients with or without multimorbidity undergoing commonly performed surgical procedures at ASCs (herniorrhaphy, cholecystectomy, or open breast procedures) versus those same procedures performed at a Hospital Outpatient Department (HOPD) setting. We will also examine another more heterogeneous group of higher-risk procedures that are also commonly performed at ASCs and HOPDs.
Of course, we expect surgeons, and anesthesia providers, to carefully select one location versus another because, in the ASC, patients do not have immediate access to certain forms of care that only a hospital can provide.10,11 Patient comorbidity is an important determinant of the risk of complications during and after a surgical procedure, and location of care could influence the ability to rescue patients and ensure that a complication does not result in a hospitalization or death.
The optimal location for surgical care has important policy implications. The Centers for Medicare and Medicaid Services (CMS) provides payment in the outpatient setting once a procedure is removed from the in-patient only list. Separately, CMS determines if surgical procedures should be included in the ASC list based upon consideration of safety for the average Medicare patient. There are strong financial incentives related to avoiding the hospital, especially if the surgeon is a part owner of the ASC, or if the ASC allows surgeons to be more efficient.2,12–17 Complicating the incentive structure further is the fact that Medicare pays a higher facility fee for the HOPD setting than it does for the ASC setting (acknowledging the difference in overhead between the two settings).15,18–20 Therefore, one basic question that we answer is whether the current process of selecting patients for ASCs or HOPDs exhibits an appropriate balance of concern for patient risk.
After analyzing selection by matching only on procedure, we next address our primary analysis, matching older Medicare patients on many clinical variables beyond procedure. We match patients undergoing surgery at HOPDs to patients undergoing surgery at ASCs (where patients undergoing surgery at the ASC represent our “treated” or “focal” population). We will examine outcomes of 30 and 7-day post-operative revisits (Emergency Department visits or hospital admissions within 30 days), as well as complications. We will also report outcome differences in patients defined as having multimorbidity21, and those without multimorbidity, where a patient is defined as having multimorbidity if they have specific clusters of comorbidities that double the risk of death (see below).
In short, the question we ask is whether it is safe for older patients with or without multimorbidity to undergo routine surgery at ASCs versus HOPDs. In so doing, we also hope to shed new light on the current selection process being utilized by surgeons when choosing between ASC and HOPD settings.
METHODS
This research study was approved by the Children’s Hospital of Philadelphia Institutional Review Board.
Patient Population
We used the CMS Virtual Research Data Center to obtain patient beneficiary summary files and administrative claims for fee-for-service Medicare beneficiaries. In the primary analysis, we analyzed patients aged 66 years and older who underwent very common, non-trivial procedures performed at ASCs (herniorrhaphy, cholecystectomy or breast procedures, see complete list of CPT codes in Supplemental Digital Content 1, Section 1, eTable 1). We excluded patients if they lacked fee-for-service Medicare claims one year prior to inclusion; or if they did not have complete enrollment in Medicare Parts A and B; or if they were enrolled in a health maintenance organization plan at any point during the same time-period. A secondary analysis examined a heterogeneous set of common higher-risk procedures including minor amputations, vascular access procedures, humerus repairs, spinal procedures, limb revascularizations, prostate procedures, and tonsil and adenoid procedures (see Supplemental Digital Content 1, Section 1, eTable 2).
Definitions
Determination of Initial Procedure Location
In order to compare outcomes in patients initially treated at ASCs to those at HOPDs, we started by examining the first chronological surgeon bill in a patient’s history. For the primary study, we required at least one CPT procedure code for a study procedure and a relevant principal diagnosis for that surgery. We assigned patients to the ASC group if: (1) the surgeon bill had a procedure code for the surgery and the relevant principal diagnosis with the place of service designated as ASC, or: (2) there existed a facility bill from an ASC with procedure code for the surgery or the relevant principal diagnosis within a 3-day window from the date on the surgeon bill for that beneficiary. If the surgery had not been assigned to an ASC using the above criteria, then patients were assigned to have received initial surgery at the HOPD using parallel logic. We describe our algorithm to determine the initial procedure location in more detail in Supplemental Digital Content 1, Section 2.
Defining Multimorbidity:
In our previous work21 we defined a patient to have multimorbidity if that patient had at least one cluster of several comorbid conditions (which we called “Qualifying Comorbidity Sets” or “QCSs”) that had been confidently identified as at least doubling the odds of 30-day mortality compared to a typical patient. For the present study, we slightly updated these definitions for a patient population containing a mix of ICD-10 and ICD-9CM codes. Also, we allowed the need for certain durable medical equipment – for instance, home oxygen or wheelchair use – to be selected as a component of a comorbidity cluster that defined multimorbidity. Importantly, claims from an ASC record different information than do claims from an HOPD; so, to keep the available information content the same between ASC and HOPD cases, we only used information available prior to the index procedure, and we noted comorbid conditions recorded up to 3 years prior to surgery. As in our previous work, for constructing the clusters of comorbidities (QCSs) that define multimorbidity, we excluded several groups of patients that were extremely high-risk (patients with Alzheimer’s Disease and Related Dementias (ADRD), or age above 90 years, or with Metastatic Cancers). For the slightly updated definition of multimorbidity used for ASC analyses, we also treat separately patients having these extremely high-risk characteristics, but we did include and analyze these groups when reporting outcomes in our matched analyses. Details are provided in the Supplemental Digital Content 1, Section 3, eTable 3.
Defining Outcomes
The primary outcome was a revisit within 30 days after the procedure. Revisits were defined as an emergency department visit or hospital admission. No deaths occurred in patients who did not also have a revisit. We also examined 7-day revisits and 30 and 7-day post-operative complications. Complications were defined on a procedure-specific basis and details are provided in Supplemental Digital Content 1, Section 4, eTables 4 and 5.
Statistical Methods
Matching Methodology
Optimal matching22 of HOPD patients (control patients) to ASC patients (the “treated” or “focal” patients) was implemented using the NETFLOW procedure in SAS.23 For the primary outcomes analysis of selection patterns across ASC and HOPD settings, we matched only on the surgical procedure, as described in Table 1 and detailed in Supplemental Digital Content 1, Section 5, eTable 6. For the primary comparison of outcomes, we also matched on the procedure but further matched for an estimated risk of revisit, risk of death, presence of a multimorbidity QCS, presence of ADRD or Metastatic Cancers or age ≥90, for a total of 169 risk factors as documented in Table 2 and in full detail in Supplemental Digital Content 1, Section 5, eTable 7. Similar selection tables for higher-risk procedures are shown in Supplemental Digital Content 1, Section 5, eTables 8 and 9. Finally, for higher-risk procedures, we report parallel tables to Table 2 in Supplemental Digital Content 1, Section 5, eTables 10 and 11.
Table 1:
Comparison of all ASC and HOPD patients undergoing Herniorrhaphy, Cholecystectomy, and Breast procedures, exactly matched only on procedure type.
| Variable | All ASC Patients | Procedure Matched HOPD Patients | Difference (HOPD - ASC) | % Increase (HOPD vs ASC) | Risk Ratio or ratio of means | p-value ASC versus HOPD |
|---|---|---|---|---|---|---|
| Number of Patients | 30,958 | 30,958 | ||||
| Demographics | ||||||
| Sex (% male) | 64.9 | 65.0 | 0.1 | 0.2 | 1.0017 | 0.7875 |
| Age, years (mean) | 73.7 | 82.0 | 8.2 | 11.2 | 1.1117 | 0.0000 |
| Age ≥80 years (%) | 14.9 | 66.6 | 51.7 | 347.5 | 4.4751 | 0.0000 |
| Race - White (%) | 89.4 | 92.0 | 2.7 | 3.0 | 1.0297 | 0.0000 |
| Race - Black (%) | 3.5 | 5.4 | 2.0 | 56.6 | 1.5665 | 0.0000 |
| Race - Other (%) | 7.2 | 2.6 | −4.6 | −64.3 | 0.3570 | 0.0000 |
| Procedures a | ||||||
| Herniorrhaphy (%) | 64.6 | 64.6 | 0.0 | 0.0 | 1.0000 | 1.0000 |
| Cholecystectomy (%) | 23.7 | 23.7 | 0.0 | 0.0 | 1.0000 | 1.0000 |
| Breast Procedure (%) | 11.8 | 11.8 | 0.0 | 0.0 | 1.0000 | 1.0000 |
| Predicted Risk on Admission: | ||||||
| Probability: 30-day Death (%) | 0.27 | 0.79 | 0.52 | 192.6 | 2.9259 | 0.0000 |
| Probability: 30-day Revisit (%) | 8.47 | 13.09 | 4.62 | 54.5 | 1.5455 | 0.0000 |
| Patient in Highest Risk Death Tertile (%) | 10.5 | 36.9 | 26.4 | 251.6 | 3.5162 | 0.0000 |
| Propensity for being at ASC (%) | 12.9 | 8.7 | −4.2 | −32.5 | 0.6752 | 0.0000 |
| Number of Comorbidities (mean) | 4.8 | 7.4 | 2.6 | 53.6 | 1.5357 | 0.0000 |
| Any Patient with Multimorbidity (%) | 10.9 | 29.9 | 19.0 | 174.0 | 2.7399 | 0.0000 |
| Selected Comorbidities sorted by frequency b | ||||||
| Lipid Metabolism Disorders (%) | 80.3 | 87.2 | 6.9 | 8.6 | 1.0859 | 0.0000 |
| Hypertension (%) | 73.9 | 88.7 | 14.8 | 20.0 | 1.2001 | 0.0000 |
| Endocrine and Metabolic Disorders (%) | 34.3 | 43.6 | 9.3 | 26.9 | 1.2694 | 0.0000 |
| Coronary Artery Disease (%) | 26.3 | 46.2 | 19.8 | 75.3 | 1.7528 | 0.0000 |
| Vascular Diseases (%) | 25.0 | 46.8 | 21.7 | 86.8 | 1.8678 | 0.0000 |
| Cerebrovascular Disease (%) | 18.2 | 32.8 | 14.6 | 80.6 | 1.8057 | 0.0000 |
| Cardiac Arrhythmias (%) | 16.5 | 35.3 | 18.7 | 113.1 | 2.1312 | 0.0000 |
| Chronic Pulmonary Disease (%) | 15.9 | 29.5 | 13.6 | 85.5 | 1.8546 | 0.0000 |
| Diabetes with Complications (%) | 13.8 | 21.5 | 7.8 | 56.3 | 1.5632 | 0.0000 |
| Rheumatoid Arthritis and Inflammatory Connective Tissue Disease (%) | 12.1 | 16.4 | 4.3 | 35.5 | 1.3554 | 0.0000 |
| Asthma (%) | 11.2 | 13.2 | 2.0 | 17.9 | 1.1791 | 0.0000 |
| Diabetes without Complication (%) | 10.9 | 13.8 | 2.9 | 26.5 | 1.2651 | 0.0000 |
| Heart Failure (%) | 10.5 | 27.9 | 17.4 | 165.7 | 2.6565 | 0.0000 |
| Thrombocytopenia & Other Hem. Dis (%) | 10.5 | 18.3 | 7.9 | 75.2 | 1.7524 | 0.0000 |
| Chr. Kid. Dis. Stage 1–3 & Nephritis (%) | 10.2 | 16.6 | 6.3 | 61.7 | 1.6172 | 0.0000 |
| Angina Pectoris (%) | 5.4 | 9.0 | 3.6 | 67.0 | 1.6704 | 0.0000 |
| Acute Renal Failure (%) | 5.0 | 11.6 | 6.6 | 132.4 | 2.3240 | 0.0000 |
| Alzheimer’s Disease and Related Dementias (%) | 4.9 | 12.7 | 7.8 | 160.4 | 2.6037 | 0.0000 |
| Morbid Obesity (%) | 4.1 | 4.6 | 0.5 | 10.9 | 1.1090 | 0.0066 |
Note: Finer breakdowns of balance within categories are provided in Supplemental Digital Content 1, eTable 6.
Complete list in Supplemental Digital Content 1, eTable 6.
Table 2:
Balance Table for Primary Analysis for Herniorrhaphy, Cholecystectomy and Breast Procedures
| Variable | All ASC Patients | Matched HOPD Patients | All HOPD Patients | Std. Diff Before Match | Std. Diff After Match |
|---|---|---|---|---|---|
| Number of Patients | 30,958 | 30,958 | 261,321 | N/A | N/A |
| Demographics | |||||
| Sex (% male) | 64.9 | 65.0 | 61.4 | 0.0731 | −0.0011 |
| Age (mean) | 73.7 | 73.8 | 74.9 | −0.2012 | −0.0066 |
| Age 80+ (%) | 14.9 | 15.2 | 21.6 | −0.1736 | −0.0078 |
| Race - White (%) | 89.4 | 89.3 | 88.9 | 0.0149 | 0.0029 |
| Race - Black (%) | 3.5 | 4.0 | 4.8 | −0.0659 | −0.0247 |
| Race - Other (%) | 7.2 | 6.8 | 6.3 | 0.0337 | 0.0160 |
| Procedures a | |||||
| Herniorrhaphy (%) | 64.6 | 64.6 | 52.3 | 0.2516 | 0.0000 |
| Cholecystectomy (%) | 23.7 | 23.7 | 39.0 | −0.3355 | 0.0000 |
| Breast Procedure (%) | 11.8 | 11.8 | 8.7 | 0.1006 | 0.0000 |
| Predicted Risk on Admission | |||||
| Probability: 30-day Death (%) | 0.27 | 0.27 | 0.54 | −0.2601 | −0.0016 |
| Probability: 30-day Revisit (%) | 8.47 | 8.45 | 11.03 | −0.4745 | 0.0041 |
| Patient in Highest Risk Death Tertile (%) | 10.5 | 10.5 | 23.4 | −0.3507 | 0.0000 |
| Propensity for being at ASC (%) | 12.9 | 12.8 | 10.3 | 0.5362 | 0.0177 |
| Number of Comorbidities (mean) | 4.8 | 4.8 | 6.1 | −0.3391 | 0.0091 |
| Any Patient with Multimorbidity (%) | 10.9 | 10.9 | 21.1 | −0.2802 | 0.0000 |
| Selected Comorbidities sorted by frequency b | |||||
| Lipid Metabolism Disorders (%) | 80.3 | 80.6 | 82.2 | −0.0495 | −0.0082 |
| Hypertension (%) | 73.9 | 74.8 | 81.0 | −0.1696 | −0.0212 |
| Endocrine and Metabolic Disorders (%) | 34.3 | 35.9 | 36.9 | −0.0529 | −0.0334 |
| Coronary Artery Disease (%) | 26.3 | 27.3 | 35.0 | −0.1890 | −0.0219 |
| Vascular Diseases (%) | 25.0 | 26.2 | 33.6 | −0.1889 | −0.0252 |
| Cerebrovascular Disease (%) | 18.2 | 18.4 | 22.9 | −0.1161 | −0.0047 |
| Cardiac Arrhythmias (%) | 16.5 | 17.3 | 23.6 | −0.1778 | −0.0198 |
| Chronic Pulmonary Disease (%) | 15.9 | 16.8 | 23.5 | −0.1919 | −0.0233 |
| Diabetes with Complications (%) | 13.8 | 14.4 | 19.7 | −0.1583 | −0.0169 |
| Rheumatoid Arthritis and Inflammatory Connective Tissue Disease (%) | 12.1 | 10.9 | 13.6 | −0.0459 | 0.0352 |
| Asthma (%) | 11.2 | 10.2 | 12.8 | −0.0506 | 0.0292 |
| Diabetes without Complication (%) | 10.9 | 10.5 | 11.8 | −0.0263 | 0.0143 |
| Heart Failure (%) | 10.5 | 9.8 | 19.1 | −0.2436 | 0.0206 |
| Thrombocytopenia & Other Hem. Dis (%) | 10.5 | 9.3 | 12.9 | −0.0748 | 0.0375 |
| Chr. Kid. Dis. Stage 1–3 & Nephritis (%) | 10.2 | 9.8 | 12.1 | −0.0594 | 0.0127 |
| Angina Pectoris (%) | 5.4 | 4.9 | 7.0 | −0.0676 | 0.0210 |
| Acute Renal Failure (%) | 5.0 | 4.7 | 8.8 | −0.1498 | 0.0128 |
| Alzheimer’s Disease and Related Dementias (%) | 4.9 | 4.9 | 7.8 | −0.1190 | 0.0001 |
| Morbid Obesity (%) | 4.1 | 4.1 | 7.0 | −0.1251 | 0.0013 |
Note: Finer breakdowns of balance within categories are provided in the Supplemental Digital Content 1, eTable 7. All categories succeeded in obtaining after match standardized differences below 0.1 SDs.
Complete list in Supplemental Digital Content 1, eTable 7.
Matching was completed prior to viewing outcomes.24 We aimed to attain standardized differences in covariate means below 0.1 SDs after matching, a more stringent criterion than the traditional standard of below 0.2.25,26
Selection Analysis
We expected surgeons to be selective about which of their patients receive surgery at an ASC rather than an HOPD, and we wanted to describe that selection. In one special analysis, for the very limited purpose of depicting the degree of patient selection into ASCs versus HOPDs, we matched HOPD to ASC patients exactly, and only, on the procedure. We could then observe, for example, how the baseline risk of the patient differed between ASC and HOPD patients, even though, patient by patient, their procedures were the same. The baseline risk probability was estimated from a model fit to out-of-sample data (see Supplemental Digital Content 1, Section 6, eTables 12 and 13).
Comparing Outcomes
The outcome was a binary indicator of revisits in matched pairs of ASC and HOPD patients. We used methods for the difference in rates for paired binary data.27
RESULTS
Quantifying Patient Selection
As expected, surgeons (along with anesthesia providers) exercised caution when selecting patients for surgery at an ASC. Given two patients undergoing the same surgical procedure, one at an ASC, and the other at an HOPD, the patient at the ASC was likely to have far fewer prior health problems. We see this clearly in Table 1 which describes the preliminary match that controlled for the procedure and nothing else. For instance, 14.9% of ASC patients were older than 80 years versus 66.6% of the procedure matched HOPD patients. The model-based estimate of baseline risk of death within 30-days was 0.27% for ASC patients but was three times higher at 0.79% for HOPD patients. The same was true of multimorbidity: 10.9% of ASC patients had multimorbidity, but 29.9% of HOPD patients had multimorbidity, when matching for the procedure alone. For more, see Table 1; for a complete list, see Supplemental Digital Content 1, Section 5, eTable 6. Similar results are seen for higher- risk procedures in Supplemental Digital Content 1, Section 5, eTable 8 and a more detailed version in Supplemental Digital Content 1, Section 5, eTable 9. The natural expectation that surgeons would exercise caution when selecting patients for the ASC is amply confirmed for the procedures we examined. Subsequent matches remove this caution to the extent that it is visible in Medicare claims data: the naturally healthier ASC patients will be matched to comparable, and therefore unusually healthy, HOPD patients to compare the performance of ASCs and HOPDs on similar patients.
Quality of the Matches in the Primary Analysis
There were 30,958 patients who underwent either herniorrhaphy, cholecystectomy, or breast procedures at ASCs in our primary analysis, and 261,321 patients who underwent the same procedures at HOPDs, of which 30,958 were matched to the focal ASC population. As seen in Table 2, we found excellent matches for the ASC patients. We exact matched on procedure grouping while also achieving very close matches on patient demographics and comorbidities. All comorbidity and demographics variables had absolute standardized differences within 0.1 SDs, usually considerably smaller. For example, 19.1% of all HOPD patients before matching had a history of heart failure, versus 10.5% of ASC patients. However, the HOPD group had a 9.8% rate after matching, which was only different by 0.02 SDs (an expanded list of the balance of patient variables is provided in the Supplemental Digital Content 1, Section 5, eTable 7). Similarly, our matching quality was excellent for the higher-risk procedures in our secondary analysis; this balance table is provided in Supplemental Digital Content 1, Section 5, eTables 10 and 11.
Comparing Outcomes at the ASC versus the HOPD for Herniorrhaphy, Cholecystectomy, and Breast Procedures
Revisits
Even after extensive matching for patient risk factors, we found that patients treated at the ASC had lower revisit rates when combining all three procedures compared to their matched control patients at the HOPD. Among patients undergoing the same surgical procedure with similar comorbidities and other risk factors, the combined 30-day revisit rate was 6.2% for ASC patients versus 8.1% for matched HOPD patients (P < 0.0001) (Table 3), see Figure 1a. When examining procedures separately, patients who underwent herniorrhaphy or cholecystectomy had lower 30-day revisit rates at the ASC compared to HOPD, while no significant difference was seen in the breast procedures.
Table 3.
Herniorrhaphy, Cholecystectomy, and Breast Procedures: 30-day and 7-day revisit and complication rates in matched pairs of ASC versus HOPD patients, with comparison by multimorbidity status
| Subgroup | N Pairs | ASC (%) | HOPD (%) | Difference in rates (%) | 95% CI | ASC (%) | HOPD (%) | Difference in rates (%) | 95% CI |
|---|---|---|---|---|---|---|---|---|---|
| 30-day revisit rates | 7-day revisit rates | ||||||||
| All patients | 30,958 | 6.2 | 8.1 | −1.9f | (−2.3, −1.5) | 3.4 | 4.9 | −1.6f | (−1.9, −1.3) |
| By procedure type | |||||||||
| Herniorrhaphy | 19,991 | 5.3 | 7.7 | −2.4f | (−2.9, −1.9) | 3.1 | 4.8 | −1.8f | (−2.2, −1.4) |
| Cholecystectomy | 7,325 | 9.1 | 10.8 | −1.7e | (−2.7, −0.7) | 5.1 | 6.9 | −1.7f | (−2.5, −1.0) |
| Breast | 3,642 | 5.0 | 4.6 | 0.4 | (−0.6, 1.4) | 1.5 | 1.7 | −0.2 | (−0.8, 0.4) |
| By Multimorbidity Status | |||||||||
| With Multimorbidity | 3,382 | 11.3 | 13.7 | −2.5c | (−4.0, −0.9) | 5.5 | 8.0 | −2.5f | (−3.7, −1.3) |
| Without Multimorbidity | 27,576 | 5.5 | 7.4 | −1.8f | (−2.2, −1.4) | 3.1 | 4.6 | −1.5f | (−1.8, −1.2) |
| 30-day complication rates | 7-day complication rates | ||||||||
| All patients | 30,958 | 28.8 | 41.3 | −12.5f | (−13.3, −11.8) | 24.2 | 36.7 | −12.4f | (−13.1, −11.7) |
| By procedure type | |||||||||
| Herniorrhaphy | 19,991 | 29.2 | 44.4 | −15.2f | (−16.1, −14.2) | 25.3 | 40.4 | −15.1f | (−16.0, −14.1) |
| Cholecystectomy | 7,325 | 28.9 | 38.3 | −9.4f | (−10.9, −7.9) | 23.2 | 32.5 | −9.3f | (−10.7, −7.8) |
| Breast | 3,642 | 26.2 | 30.7 | −4.6f | (−6.6, −2.5) | 20.2 | 24.4 | −4.3f | (−6.2, −2.4) |
| By Multimorbidity status | |||||||||
| With Multimorbidity | 3,382 | 37.1 | 53.0 | −15.9f | (−18.2, −13.5) | 29.3 | 45.2 | −15.8f | (−18.1, −13.6) |
| Without Multimorbidity | 27,576 | 27.8 | 39.9 | −12.1f | (−12.9, −11.4) | 23.6 | 35.6 | −12.0f | (−12.8, −11.3) |
Schema for p-values:
P < 0.05,
P < .01,
P < 0.005,
P < 0.001,
P < 0.0005,
P < 0.0001.
Figure 1:
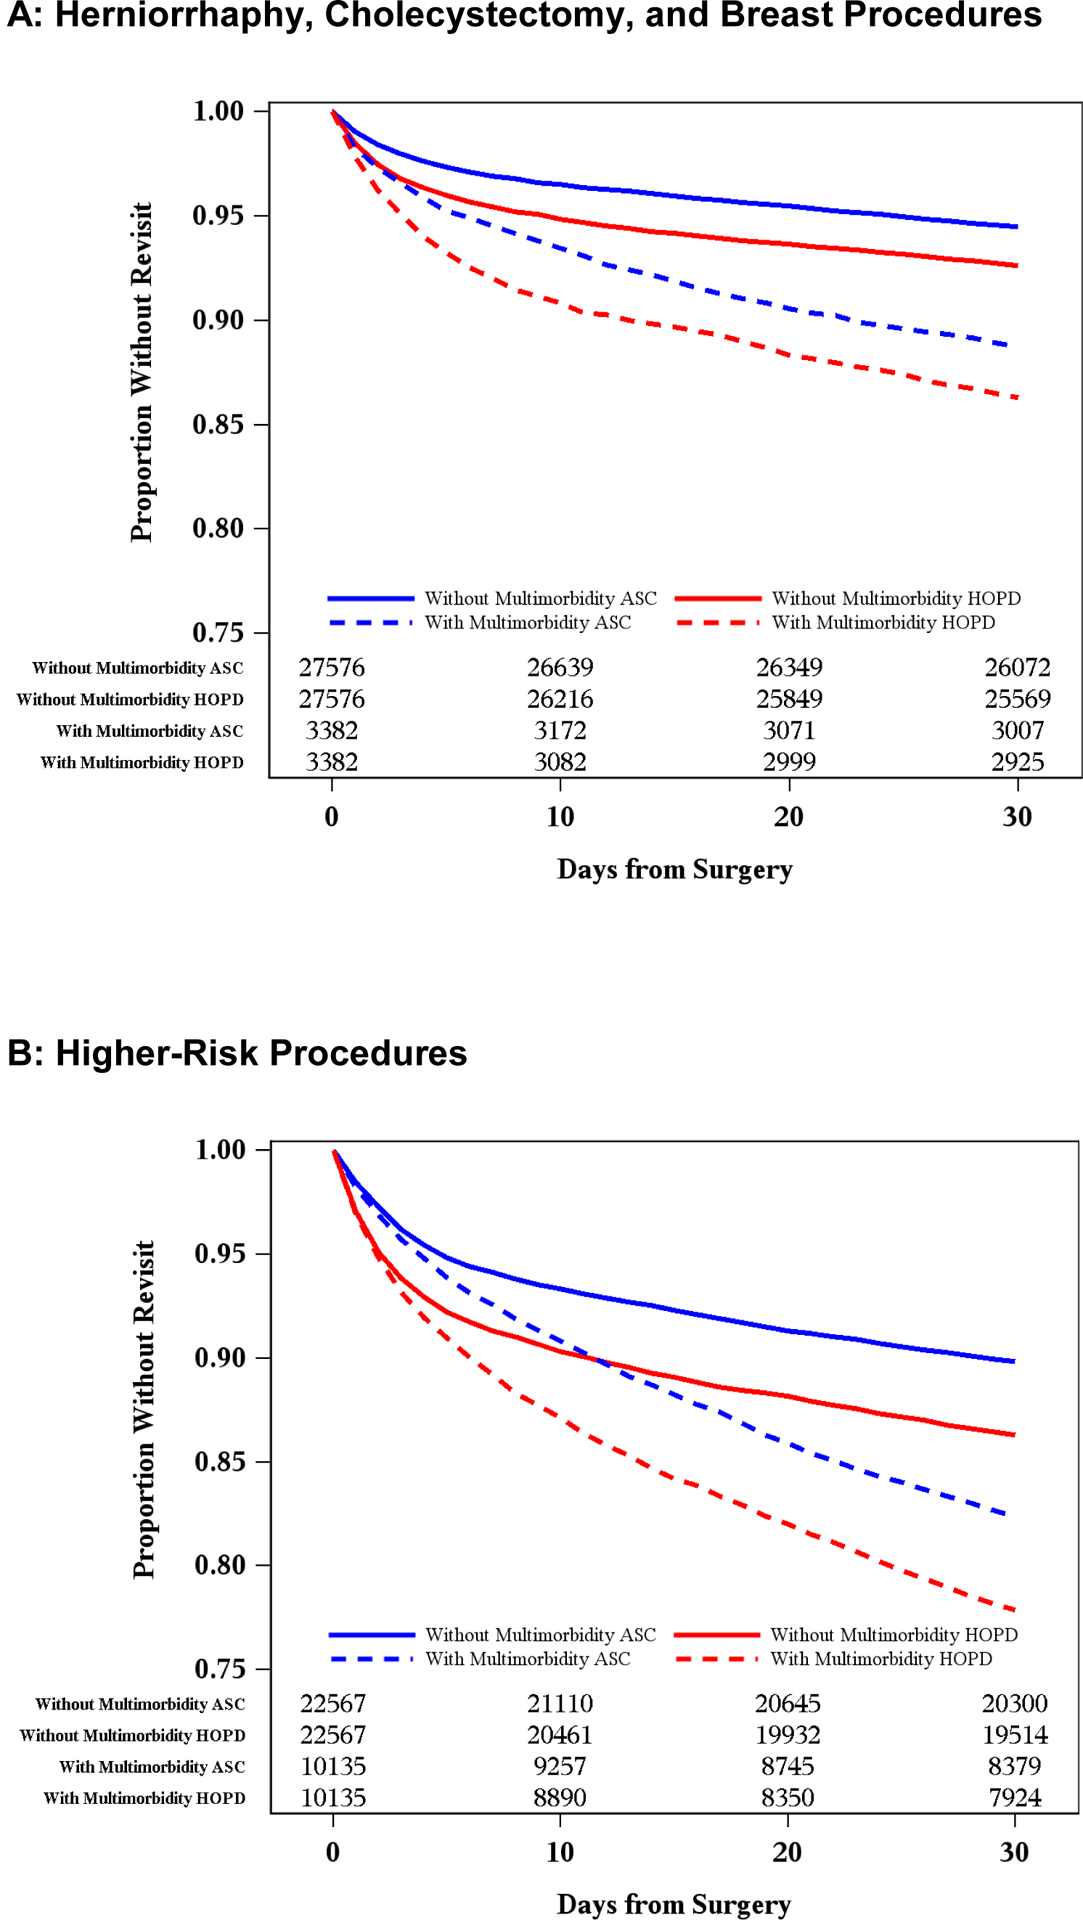
Kaplan-Meier plots of revisit events after surgery at ASC versus HOPD locations by multimorbidity status in: (Figure 1A) Herniorrhaphy, Cholecystectomy, and Breast Procedures, and (Figure 1B) Higher-Risk Procedures.
Matched patients with multimorbidity had an 11.3% rate of 30-day revisits at the ASC versus 13.7% at the HOPD (P < 0.005) and patients without multimorbidity also displayed better outcomes at the ASC than in the HOPD settings (5.5% versus 7.4%, P < 0.0001). Seven-day results followed the same pattern.
Complications
Among patients undergoing the same surgical procedure with similar comorbidities and other risk factors, the combined 30-day complication rate was 28.8% for ASC patients versus 41.3% for matched HOPD patients (P < 0.0001) (Table 3). When examining procedures separately, patients who underwent herniorrhaphy, cholecystectomy, or breast procedures each had significantly lower 30-day complication rates at the ASC compared to the HOPD.
Matched patients with multimorbidity had a 37.1% rate of 30-day complications at ASCs compared to 53.0% at HOPDs (P < 0.0001) (Table 3). Patients without multimorbidity also displayed better outcomes at ASCs versus HOPDs (27.8% versus 39.9%, P < 0.0001). Seven-day results again followed the same pattern.
Comparing Outcomes at ASCs versus HOPDs for Higher-Risk Procedures
Revisits
We performed a secondary analysis to assess whether similar findings were present for higher-risk procedures compared to what we observed for the common, routine procedures examined in our primary analysis. The results for these higher-risk procedures were very similar (Table 4). Among patients undergoing the same surgical procedure with similar comorbidities and other risk factors, the combined 30-day revisit rate was 12.5% for ASC patients versus 16.3% for matched HOPD patients (P < 0.0001) (Figure 1b). When examining procedures separately, all procedures except lower limb revascularization had significantly lower 30-day revisit rates at ASCs compared to HOPDs.
Table 4.
Higher-Risk Procedures: 30-day and 7-day revisit and complication rates in matched pairs of ASC versus HOPD patients, with comparison by multimorbidity status”
| Subgroup | N Pairs | ASC (%) | HOPD (%) | Difference in rates (%) | 95% CI | ASC (%) | HOPD (%) | Difference in rates (%) | 95% CI |
|---|---|---|---|---|---|---|---|---|---|
| 30-day revisit rates | 7-day revisit rates | ||||||||
| All patients | 32,702 | 12.5 | 16.3 | −3.8f | (−4.3, −3.3) | 6.4 | 9.4 | −3.0f | (−3.4, −2.6) |
| By procedure type | |||||||||
| Minor Amputation | 7,456 | 10.0 | 13.4 | −3.5f | (−4.5, −2.5) | 3.3 | 5.4 | −2.1f | (−2.7, −1.4) |
| Humerus Repair | 835 | 9.5 | 14.6 | −5.2d | (−8.2, −2.1) | 5.5 | 9.5 | −4.0c | (−6.5, −1.4) |
| Lower limb revascularization | 333 | 18.6 | 18.6 | 0.0 | (−6.4, 6.4) | 6.9 | 5.7 | 1.2 | (−2.7, 5.1) |
| Prostate | 10,952 | 15.4 | 18.3 | −2.8f | (−3.8, −1.8) | 9.1 | 11.1 | −2.0f | (−2.8, −1.2) |
| Spinal/Laminectomy | 10,464 | 9.5 | 14.8 | −5.3f | (−6.2, −4.4) | 5.4 | 10.2 | −4.8f | (−5.5, −4.1) |
| Tonsils and Adenoids | 616 | 12.5 | 15.9 | −3.4 | (−7.4, 0.6) | 7.3 | 8.4 | −1.1 | (−4.2, 1.9) |
| Vascular access | 2,046 | 21.5 | 24.3 | −2.9a | (−5.5, −0.3) | 7.6 | 11.1 | −3.5e | (−5.3, −1.7) |
| By Multimorbidity Status | |||||||||
| With Multimorbidity | 10,135 | 17.6 | 22.1 | −4.5f | (−5.6, −3.4) | 7.4 | 10.8 | −3.4f | (−4.2, −2.6) |
| Without Multimorbidity | 22,567 | 10.2 | 13.7 | −3.5f | (−4.1, −2.9) | 5.9 | 8.7 | −2.8f | (−3.3, −2.3) |
| 30-day complication rates | 7-day complication rates | ||||||||
| All patients | 32,702 | 55.4 | 64.1 | −8.8f | (−9.5, −8.8) | 47.4 | 56.9 | −9.4f | (−10.2, −8.7) |
| By procedure type | |||||||||
| Minor Amputation | 7,456 | 49.5 | 57.8 | −8.4f | (−9.9, −6.9) | 42.5 | 50.4 | −7.9f | (−9.5, −6.4) |
| Humerus Repair | 835 | 76.8 | 72.7 | 4.1 | (−0.2, 8.4) | 75.6 | 70.1 | 5.5a | (1.2, 9.9) |
| Lower limb revascularization | 333 | 40.5 | 56.5 | −15.9f | (−23.6, −8.3) | 28.2 | 45.0 | −16.8f | (−24.2, −9.4) |
| Prostate | 10,952 | 65.3 | 77.8 | −12.6f | (−13.8, −11.4) | 54.9 | 70.5 | −15.6f | (−16.9, −14.4) |
| Spinal/Laminectomy | 10,464 | 49.2 | 55.7 | −6.4f | (−7.8, −5.1) | 43.7 | 49.7 | −6.0f | (−7.4, −4.7) |
| Tonsils and Adenoids | 616 | 28.9 | 36.4 | −7.5c | (−12.7, −2.2) | 20.8 | 26.6 | −5.8a | (−10.6, −1.1) |
| Vascular access | 2,046 | 56.7 | 63.0 | −6.3f | (−9.1, −3.4) | 43.9 | 49.5 | −5.5f | (−8.3, −2.7) |
| By Multimorbidity status | |||||||||
| With Multimorbidity | 10,135 | 60.6 | 70.2 | −9.6f | (−10.8, −8.3) | 50.6 | 60.7 | −10.0f | (−11.3, −8.7) |
| Without Multimorbidity | 22,567 | 53.0 | 61.4 | −8.4f | (−9.3, −7.5) | 46.0 | 55.2 | −9.2f | (−10.1, −8.3) |
Schema for p-values:
P < 0.05,
P < .01,
P < 0.005,
P < 0.001,
P < 0.0005,
P < 0.0001
Matched patients with multimorbidity had a 17.6% rate of 30-day revisits at the ASC versus 22.1% at the HOPD (P < 0.0001) and patients without multimorbidity also displayed lower revisits at the ASC than the HOPD settings (10.2% versus 13.7%, P < 0.0001) (Table 4). Seven-day results followed the same pattern.
Complications
Among patients undergoing the same higher-risk surgical procedure with similar comorbidities and other risk factors, the combined 30-day complication rate was 55.4% for ASC patients versus 64.1% for matched HOPD patients (P < 0.0001) (Table 4). When examining procedures separately, all procedures displayed significantly lower 30-day complication rates at the ASC compared to the HOPD, except humerus repair. Seven-day results generally were similar.
Matched patients with multimorbidity had a 60.6% rate of 30-day complications at the ASC versus 70.2% at the HOPD (P < 0.0001) and patients without multimorbidity also displayed better outcomes at the ASC than the HOPD settings (53.0% versus 61.4%, P < 0.0001). Seven-day results followed the same pattern.
Stability Analyses
Under the hypothesis that surgeons who exlusively operate in either the ASC or HOPD environment may show less selection than those that operate at both environments, we examined whether surgeons who, for a specific procedure, operated at the ASC exclusively, or the HOPD exclusively, may have different results as compared to those surgeons who practiced at both environments (“splitters”). The most common combination comprising 22,570 matched pairs in our primary analysis (out of 30,958 pairs) was that of the ASC splitter surgeon and the HOPD surgeon exclusively operating at the HOPD. The differential mortality between the ASC and HOPD was −2.1% which was not statistically different from the overal primary result of −1.9% (P = 0.12). There were 3,082 pairs where both surgeons exclusively operated at one environment, which showed a difference of −0.8%, which was still not significantly different from our overall results (P < 08). There were 4,774 pairs where both surgeons were splitters, allowing for the most selection. The difference between ASC and HOPD revisit rates was −1.8%, again no different from the overall results (P = 0.79). When comparing the pairs where both surgeons were not splitters to the pairs where both surgeons were splitters, we again found no significant differences (P < 0.25). Similar results were found for the secondary higher-risk procedures and for the 7-day results. See Appendix eTable 14.
We also examined whether the type of anesthesia billed as “MAC” (Monitored Anesthesia Care) versus non-MAC influenced our results. Overall, 93.58% of patients in our study had non-MAC anesthesia (by design, we wanted less trivial procedures). We examined the 87.31% of matched pairs in our study where both the ASC and HOPD matched patients had non-MAC anesthesia bills, and found the revisit rates difference was −2.0% (not different from the overall results in our primary analysis, P < 0.37). Similar results were found for the secondary higher-risk procedures and for the 7-day results. See Appendix eTable 15.
DISCUSSION
Our expectation that surgeons would exercise careful judgement by selecting comparatively healthy patients for routine surgery at ASCs over HOPDs was confirmed by our preliminary analysis that solely matched for procedure. Next, in our primary analysis, when we made extensive adjustments for patient comorbidities and other risk factors, comparing ASC patients (who were at baseline much healthier) to unusually healthy HOPD patients through matching, outcomes were still better at ASCs. While it is conceivable that ASCs provide a better or safer location for healthy older patients to undergo surgery, a more plausible explanation is that the careful selection by surgeons of patients for ASCs extends beyond the factors recorded in Medicare claims, and hence beyond the risk adjustments that we made. Never-the-less, the detailed matching approach we have taken provides no indication that current practices of patient selection for surgery at ASCs are harming patients.
There have been multiple studies examining ASC quality28,29 with recent30,31 and earlier work examining differences in outcomes between ASC and HOPD settings.32,33 However, most previous work has not taken advantage of the newer methods using multivariate matching34 and new, more rigorous, definitions of multimorbidity when comparing outcomes in HOPD to ASC treated patients,21 in order to more carefully control for selection.
Proper patient selection is considered essential for ensuring the safety of procedures performed in the ASC setting.35–37 Prior studies have linked satisfactory outcomes at ASCs to appropriate patient selection. For example, Qin et al. examined outcomes of non-arthroplasty shoulder surgery and found more adverse events and readmissions among the HOPD patients after matching the two cohorts,10 suggesting that proper patient selection was taking place in ASCs. Memtsoudis et al. found better outcomes at freestanding facilities versus hospital-based facilities when examining unexpected disposition after ambulatory knee and shoulder surgery, naming patient selection among the factors that likely contributed to their finding.38 Klein et al. also considered patient selection to influence outcomes of total hip arthroplasty at an ASC.39
We found that both patients with and without multimorbidity had better outcomes at ASCs relative to HOPDs, likely due to appropriate selection by surgeons. We therefore believe that, with proper selection, certain older patients with multimorbidity can safely undergo surgery at ASCs – and might even benefit from surgery outside of the hospital setting. We believe it is crucial that surgeons and patients retain the ability to determine the optimal operative location based upon patient risk factors.
There are factors beyond proper patient selection that may also explain the superior outcomes we observed at ASCs versus HOPDs. Greater specialization40 or experience of the surgeon and lower infection rates at the ASC versus the HOPD11 have all been suggested.
Limitations of this study include the fact that we utilized claims-based data in order to achieve very large sample sizes, but in so doing may not fully identify frail patients not picked up in claims alone. A further limitation was that our data only included patients in the Fee-for-Service Medicare system.
Finally – and most critically – our study provides insight into the current state of affairs. However, our findings may not predict what would happen to outcomes if decisions on the part of the surgeon regarding patient selection changed, or if rules implemented by state licensures for performing surgery at ASCs were liberalized to allow for riskier patients or more difficult procedures. Notably, expansion of the Medicare-approved list of procedures at ASCs is expected to continue.41 In the future, an increasingly complex and broader range of procedures offered by ASCs, with subsequent reduced specialization of these surgical centers,40 may negatively affect health outcomes. That said, our study did see better outcomes at ASCs for both the common, routine procedures we studied – herniorrhaphy, cholecystectomy, and breast procedures – as well as the higher-risk procedures. Should changes in operative patterns at ASCs occur over time, we believe it would be prudent to repeat similar matched analyses to assess whether patients selected for surgery at ASCs continue to be lower risk and whether outcome differentials remain favorable at ASCs as compared to HOPDs.
Supplementary Material
Supplemental Digital Content 1. Additional details and supporting documents for the ASC and HOPD study.docx
Funding Source:
This research was supported by the Agency for Healthcare Research and Quality [R01-HS026897]; Principal Investigator, Jeffrey H. Silber, MD, PhD
Footnotes
Conflicts of Interest: The authors have no conflicts of interest to disclose.
REFERENCES
- 1.Chaturvedi R, Patel K, Burton BN, et al. Geriatric patients undergoing outpatient surgery in the United States: a retrospective cohort analysis on the rates of hospital admission and complications. Cureus. 2021;13:e20607. [DOI] [PMC free article] [PubMed] [Google Scholar]
- 2.Hollenbeck BK, Dunn RL, Suskind AM, et al. Ambulatory surgery centers and outpatient procedure use among Medicare beneficiaries. Med Care. 2014;52:926–931. [DOI] [PMC free article] [PubMed] [Google Scholar]
- 3.Hollenbeck BK, Hollingsworth JM, Dunn RL, et al. Ambulatory surgery center market share and rates of outpatient surgery in the elderly. Surg Innov. 2010;17:340–345. [DOI] [PubMed] [Google Scholar]
- 4.Fabbri E, Zoli M, Gonzalez-Freire M, et al. Aging and multimorbidity: new tasks, priorities, and frontiers for integrated gerontological and clinical research. J Am Med Dir Assoc. 2015;16:640–647. [DOI] [PMC free article] [PubMed] [Google Scholar]
- 5.King DE, Xiang J, Pilkerton CS. Multimorbidity trends in United States adults, 1988–2014. J Am Board Fam Med. 2018;31:503–513. [DOI] [PMC free article] [PubMed] [Google Scholar]
- 6.Pefoyo AJ, Bronskill SE, Gruneir A, et al. The increasing burden and complexity of multimorbidity. BMC Public Health. 2015;15:415. [DOI] [PMC free article] [PubMed] [Google Scholar]
- 7.Sinnige J, Korevaar JC, Westert GP, et al. Multimorbidity patterns in a primary care population aged 55 years and over. Fam Pract. 2015;32:505–513. [DOI] [PMC free article] [PubMed] [Google Scholar]
- 8.Ofori-Asenso R, Chin KL, Curtis AJ, et al. Recent patterns of multimorbidity among older adults in high-income countries. Popul Health Manag. 2019;22:127–137. [DOI] [PubMed] [Google Scholar]
- 9.Ihemelandu C, Zheng C, Hall E, et al. Multimorbidity and access to major cancer surgery at high-volume hospitals in a regionalized era. Am J Surg. 2016;211:697–702. [DOI] [PMC free article] [PubMed] [Google Scholar]
- 10.Qin C, Curtis DM, Reider B, et al. Orthopaedic shoulder surgery in the Ambulatory surgical Center: safety and outcomes. Arthroscopy. 2019;35:2545–2550 e2541. [DOI] [PubMed] [Google Scholar]
- 11.Plancher KD, Petterson SC. Editorial Commentary: Is this the beginning of the end for hospital-based outpatient surgery centers? The wake-up call. Arthroscopy. 2019;35:2551–2552. [DOI] [PubMed] [Google Scholar]
- 12.Mitchell JM. Effect of physician ownership of specialty hospitals and ambulatory surgery centers on frequency of use of outpatient orthopedic surgery. Arch Surg. 2010;145:732–738. [DOI] [PubMed] [Google Scholar]
- 13.Hollingsworth JM, Ye Z, Strope SA, et al. Physician-ownership of ambulatory surgery centers linked to higher volume of surgeries. Health Aff (Millwood). 2010;29:683–689. [DOI] [PubMed] [Google Scholar]
- 14.Witiw CD, Wilson JR, Fehlings MG, et al. Ambulatory surgical centers: improving quality of operative spine care? Global Spine J. 2020;10:29S–35S. [DOI] [PMC free article] [PubMed] [Google Scholar]
- 15.MedPac. Chapter 5: Ambulatory surgical center services. March 2021. Available at: https://www.medpac.gov/wp-content/uploads/import_data/scrape_files/docs/default-source/reports/mar21_medpac_report_to_the_congress_sec.pdf. Accessed: February 8, 2022.
- 16.Hollingsworth JM, Oerline MK, Ellimoottil C, et al. Effects of the Medicare Modernization Act on spending for outpatient surgery. Health Serv Res. 2018;53 Suppl 1:2858–2869. [DOI] [PMC free article] [PubMed] [Google Scholar]
- 17.Hollenbeck BK, Dunn RL, Suskind AM, et al. Ambulatory surgery centers and their intended effects on outpatient surgery. Health Serv Res. 2015;50:1491–1507. [DOI] [PMC free article] [PubMed] [Google Scholar]
- 18.Makanji HS, Bilolikar VK, Goyal DKC, et al. Ambulatory surgery center payment models: current trends and future directions. J Spine Surg. 2019;5:S191–S194. [DOI] [PMC free article] [PubMed] [Google Scholar]
- 19.O’Neill SM, Frencher SK, Pellegrini CA, et al. Should your health care system invest in an ambulatory surgery center? A decision-making framework. Bull Am Coll Surg. 2017;102:12–23.28925173 [Google Scholar]
- 20.Nabi J, Kaplan RS. The CMS new rule on ambulatory surgical centers earns only partial credit. Health Aff Blog. June 2, 2021. DOI: 10.1377/hblog20210527.32226. [DOI] [Google Scholar]
- 21.Silber JH, Reiter JG, Rosenbaum PR, et al. Defining multimorbidity in older surgical patients. Med Care. 2018;56:701–710. [DOI] [PMC free article] [PubMed] [Google Scholar]
- 22.Rosenbaum P Optimal matching for observational studies. J Am Stat Assoc. 1989;84:1024–1032. [Google Scholar]
- 23.SAS Institute. Version 9.4 of the Statistical Analytic Software System for UNIX. Cary, NC: SAS Institute, Inc.; 2013. [Google Scholar]
- 24.Rubin DB. For objective causal inference, design trumps analysis. Ann Appl Stat. 2008;2:808–840. [Google Scholar]
- 25.Rosenbaum PR, Rubin DB. Constructing a control group using multivariate matched sampling methods that incorporate the propensity score. Am Stat. 1985;39:33–38. [Google Scholar]
- 26.Cochran WG, Rubin DB. Controlling bias in observational studies: A review. Sankhya Ser A. 1973;35:417–446. [Google Scholar]
- 27.Fleiss JL, Levin B, Paik MC. Chapter 13. The Analysis of Data from Matched Samples. Section 13.1. Matched Pairs: Dichotomous Outcome. In: Statistical Methods for Rates and Proportions. 3rd ed. New York: John Wiley & Sons; 2003:374–496. [Google Scholar]
- 28.Davis KK, Mahishi V, Singal R, et al. Quality improvement in ambulatory surgery centers: a major national effort aimed at reducing infections and other surgical complications. J Clin Med Res. 2019;11:7–14. [DOI] [PMC free article] [PubMed] [Google Scholar]
- 29.Rakover J, Little K, Scoville R, et al. Implementing daily management systems to support sustained quality improvement in ambulatory surgery centers. AORN J. 2020;111:415–422. [DOI] [PubMed] [Google Scholar]
- 30.Carey K, Morgan JR, Lin MY, et al. Patient outcomes following total joint replacement surgery: a comparison of hospitals and ambulatory surgery centers. J Arthroplasty. 2020;35:7–11. [DOI] [PMC free article] [PubMed] [Google Scholar]
- 31.Ohsfeldt RL, Li P, Schneider JE, et al. Outcomes of surgeries performed in physician offices compared with ambulatory surgery centers and hospital outpatient departments in Florida. Health Serv Insights. 2017;10:1178632917701025. [DOI] [PMC free article] [PubMed] [Google Scholar]
- 32.Fleisher LA, Pasternak LR, Herbert R, et al. Inpatient hospital admission and death after outpatient surgery in elderly patients: Importance of patient and system characteristics and location of care. Arch Surg. 2004;139:67–72. [DOI] [PubMed] [Google Scholar]
- 33.Chukmaitov AS, Menachemi N, Brown LS, et al. A comparative study of quality outcomes in freestanding ambulatory surgery centers and hospital-based outpatient departments: 1997–2004. Health Serv Res. 2008;43:1485–1504. [DOI] [PMC free article] [PubMed] [Google Scholar]
- 34.Rosenbaum PR. Modern algorithms for matching in observational studies. Annu Rev Stat Appl. 2020;7:143–176. [Google Scholar]
- 35.Vaishnav AS, McAnany SJ. Future endeavors in ambulatory spine surgery. J Spine Surg. 2019;5:S139–S146. [DOI] [PMC free article] [PubMed] [Google Scholar]
- 36.Sah AP, DeCook CA, Della Valle CJ, et al. Outpatient joint replacement: practical guidelines for your program based on evidence, success, and failures. Instr Course Lect. 2020;69:167–182. [PubMed] [Google Scholar]
- 37.Rozell JC, Ast MP, Jiranek WA, et al. Outpatient total joint arthroplasty: the new reality. J Arthroplasty. 2021;36:S33–S39. [DOI] [PubMed] [Google Scholar]
- 38.Memtsoudis SG, Ma Y, Swamidoss CP, et al. Factors influencing unexpected disposition after orthopedic ambulatory surgery. J Clin Anesth. 2012;24:89–95. [DOI] [PMC free article] [PubMed] [Google Scholar]
- 39.Klein GR, Posner JM, Levine HB, et al. Same day total hip arthroplasty performed at an Ambulatory Surgical Center: 90-day complication rate on 549 patients. J Arthroplasty. 2017;32:1103–1106. [DOI] [PubMed] [Google Scholar]
- 40.Munnich EL, Parente ST. Returns to specialization: evidence from the outpatient surgery market. J Health Econ. 2018;57:147–167. [DOI] [PubMed] [Google Scholar]
- 41.Tanna N, Gibstein AR, Boll A, et al. Joint-venture ambulatory surgery centers: the perfect partnership. Plast Reconstr Surg. 2021;148:1149–1156. [DOI] [PubMed] [Google Scholar]
Associated Data
This section collects any data citations, data availability statements, or supplementary materials included in this article.
Supplementary Materials
Supplemental Digital Content 1. Additional details and supporting documents for the ASC and HOPD study.docx