

Summary
Background
Every minute, six indigenous Africans develop new strokes. Patient-level and system-level contributors to early stroke fatality in this region are yet to be delineated. We aimed to identify and quantify the contributions of patient-level and system-level determinants of inpatient stroke fatality across 16 hospitals in Ghana and Nigeria.
Methods
The Stroke Investigative Research and Educational Network (SIREN) is a multicentre study involving 16 sites in Ghana and Nigeria. Cases include adults (aged ≥18 years) with clinical and radiological evidence of an acute stroke. Data on stroke services and resources available at each study site were collected and analysed as system-level factors. A host of demographic and clinical variables of cases were analysed as patient-level factors. A mixed effect log-binomial model including both patient-level and system-level covariates was fitted. Results are presented as adjusted risk ratios (aRRs) with respective 95% CIs.
Findings
Overall, 814 (21·8%) of the 3739 patients admitted with stroke died as inpatients: 476 (18·1%) of 2635 with ischaemic stroke and 338 (30·6%) of 1104 with intracerebral haemorrhage. The variability in the odds of stroke fatality that could be attributed to the system-level factors across study sites assessed using model intracluster correlation coefficient was substantial at 7·3% (above a 5% threshold). Stroke units were available at only five of 16 centres. The aRRs of six patient-level factors associated with stroke fatality were: low vegetable consumption, 1·19 (95% CI 1·07–1·33); systolic blood pressure, 1·02 (1·01–1·04) for each 10 mm Hg rise; stroke lesion volume more than 30 cm3, 1·48 (1·22–1·79); National Institutes of Health Stroke Scale (NIHSS) score, 1·20 (1·13–1·26) for each 5-unit rise; elevated intracranial pressure, 1·75 (1·31–2·33); and aspiration pneumonia, 1·79 (1·16–2·77).
Interpretation
Studies are needed to assess the efficacy of interventions targeting patient-level factors such as aspiration pneumonia in reducing acute stroke fatality in this region. Policy directives to improve stroke unit access are warranted.
Funding
US National Institutes of Health.
Introduction
Every minute, six indigenous Africans develop new strokes.1 This grim statistic is unfolding in a century in which improvements in acute stroke care are unparalleled compared with any time in modern history. In sub-Saharan Africa, up to 40% of patients die within 30 days of stroke, and 84% are dead within 3 years of a stroke diagnosis.1–4 On average, stroke affects an indigenous African approximately 15 years younger than comparator populations in high-income countries.5,6 For a medical disorder with well established modifiable risk factors,5–8 and effective treatment modalities, the high rates of post-stroke mortality on the African continent are unacceptable. The poor outcomes of stroke in Africa are due to several factors, including inadequate health infrastructure, non-existent care pathways, a shortage of neurologists to coordinate stroke care, and a lack of awareness of stroke symptoms among patients and even clinicians.9
Improving outcomes of acute stroke admissions across Africa is an urgent imperative. First, a clear understanding of the patient-related predictors of acute stroke fatality is needed to help tailor management algorithms to avert stroke deaths. Second, an appraisal of system-related factors such as stroke services availability within hospitals is also required to help identify gaps for resource allocation for optimal stroke care. Third, a focused and concerted engagement with policy makers by patient advocate groups, researchers, and clinicians is required to provide the needed framework to reverse the dire outcomes of stroke in the region. Previous studies on stroke fatality in Africa have been limited by being single-centre studies, lack of detailed phenotypic characterisation of stroke, and lack of data on stroke service indicators. We therefore sought to assess the determinants of acute stroke fatality by presenting data on patient-level and system-level factors across 16 large hospitals in Ghana and Nigeria serving an estimated population of 18 million inhabitants. Our primary focus was to identify and quantify the baseline determinants of stroke fatality overall, with subanalysis stratified by sex, age, and stroke type.
Methods
Study design and participants
The Stroke Investigative Research and Educational Networks (SIREN) study is a multicentre study involving 16 medical centres in Ghana and Nigeria. Ghana has five tertiary medical centres in total, of which two (40%) participated in the study, while Nigeria has 54 tertiary medical centres, of which 13 (24%) participated in the study (in addition to one secondary centre). Although SIREN was a case-control study, both cases and controls were followed up and covariates measured at 3-month, 9-month, and 12-month intervals. Patients with acute stroke (cases) were all enrolled on admission and monitored until death or discharge alive from the hospital. Hence, stroke fatality is our outcome measure in this cohort study. The current analysis focuses mainly on assessing which baseline characteristics of patients with stroke were associated with fatality outcome at hospitalisation, without interest in the longitudinal analyses of results at multiple points in time. In brief, the current analysis is a prospective cohort study of all stroke cases admitted to the study hospitals; fatality, the study outcome (but not study covariates), was monitored daily until death or discharge from the hospital. A detailed protocol has been previously published and a summary provided below.10 For the STROBE checklist see appendix 4 (pp 3–8).
Stroke cases were consenting (in unconscious or aphasic patients, consent from next of kin was obtained) adults aged 18 years or older. To be eligible for enrolment, patients must have presented to hospital within 8 days of symptom onset (or within 8 days of when they were last seen without deficit), and had neuroimaging confirmation (CT scan or MRI) within 10 days of symptom onset. Patients with stroke were recruited from hospitals to ensure rapid and accurate phenotyping. Controls were stroke-free community-based adults (aged ≥18 years) from different localities in Nigeria and Ghana who were matched to cases for age (plus or minus 5 years), sex, and ethnicity.10 Ethical approval was obtained from all study sites and written informed consent was obtained from all participants (or their next of kin).10
Data collection
Basic demographic, socioeconomic, lifestyle (including cigarette smoking and alcohol use), physical activity, dietary, psychosocial stress, and depression information was obtained by self-report using questionnaires administered by research assistants. Blood samples for glycated haemoglobin (HbA1c), and early morning samples after overnight fast in cases (post-acute phase when fasting is feasible) for measurement of fasting lipid panel (total cholesterol, HDL cholesterol, LDL cholesterol, and triglycerides) and fasting glucose, were obtained following a uniform standard operating procedure across all study sites. We assessed stroke severity using the National Institutes of Health Stroke Scale (NIHSS). All stroke cases were followed up until discharge from hospital or death during hospitalisation.
Definition of risk factors and outcome measures
Diabetes was defined using either a history of diabetes, use of medications for diabetes, an elevated HBA1c (≥6·5%), or a fasting blood glucose concentration of 7·0 mmol/L or higher taken after 7 days for stroke cases due to stress-induced transient rise in plasma glucose.11
For hypertension, the average of three blood pressure measurements was obtained at baseline and daily for 7 days or until death.12 Hypertension was defined as a blood pressure of 140/90 mm Hg or higher at 72 h after stroke, a history of hypertension, or use of antihypertensive drugs before stroke or more than 72 h after stroke.
Dyslipidaemia was defined as either a fasting total cholesterol of 5·2 mmol/L or higher, LDL cholesterol of 3·4 mmol/L or higher, HDL cholesterol of 1·03 mmol/L or lower, or triglycerides of 1·7 mmol/L or higher in accordance with National Cholesterol Education Program guidelines,13 or use of a statin before stroke onset.
Cardiac disease was defined on the basis of either a history, clinical examination and electrocardiogram, or echocardiographic evidence of cardiac arrhythmias (mainly atrial fibrillation or flutter, heart failure, cardiomyopathy, or valvular heart diseases).
Individuals with a waist-to-hip ratio of 0·90 for men and 0·85 for women or a BMI ≥30 kg/m2 were classified as obese using WHO cutoffs.14 Individuals were classified as physically active if they were regularly involved in moderate exercise (walking or cycling) or strenuous exercise (jogging, farming, and carrying water long distances) for 4 h or more per week.12
For dietary history, the regularity of consumption of food items such as green leafy vegetables, meat, fish, nuts, sugar, and other local staple food items, and addition of salt at the table, was classified as daily, weekly, at least once monthly, and none in a month, based on self-report.
For alcohol use, participants were categorised as current users (users of any form of alcoholic drinks) or never or former drinkers, based on self-report. We dichotomised alcohol intake as low (1–3 drinks per day for men and 1–2 drinks per day for women) and high if consumption exceeded these sex-specific cutoffs.12 For smoking status, participants were defined as current smokers (individuals who smoked any tobacco in the past 12 months), former smokers (stopped for >12 months), or never smokers.
Regarding psychosocial factors, psychosocial stress was assessed by self-report of stress at home or work or life events in the 2 weeks before stroke; depression was assessed by asking about the presence of depressed mood in the 4 weeks before stroke.12
Family history of cardiocerebrovascular disease was defined on the basis of self-reported history of any of hypertension, diabetes, stroke, or cardiac disease in a participant’s father, mother, sibling, or second-degree relative.
Neuroradiological markers of raised intracranial pressure (ICP) were mid-line shift and intracranial herniations including subfalcine, transtentorial, and tonsillar herniations. Infarct or haematoma volume was calculated using the ABC/2 method, whereby A is the largest diameter of the lesion on the CT slice with the largest lesion area (selected by eye), B is the diameter perpendicular to A, and C is the total number of CT slices containing the lesion multiplied by slice thickness.
Aspiration pneumonia was defined as a chest infection occurring after stroke onset.
Evaluation of stroke services and resources at study sites
We used a questionnaire to gather data on the availability of 23 stroke services and resources in 2019. These included the availability of CT or MRI scans, angiography, electrocardiography, echocardiography, carotid doppler ultrasonography, stroke unit, intravenous thrombolysis, mechanical thrombectomy, and neurosurgical decompression therapy for severe strokes. Other services assessed included the availability of physiotherapy, occupational therapy, and speech therapy for post-stroke rehabilitation. Medications assessed for availability included antihypertensives, insulin and oral hypoglycaemics, antiplatelets, anticoagulants, statins, and mannitol. A site facility score was created by adding up the number of stroke services and resource items available per site out of the 23 items assessed.
Statistical analysis
The χ2 test was used to assess bivariate associations between stroke mortality (case fatality) and clusters of potential baseline determinants (patients’ demographic factors, clinical and laboratory characteristics, cardiovascular risk factors, neuroradiological correlates, stroke aetiologies, treatments instituted during admission, and documented complications). All patient-level covariates were baseline characteristics with no frequent missing data. Due to the site clustering in mortality risks, a mixed effect log-binomial model with random intercept was implemented to investigate whether the site-level characteristics such as having a stroke unit on site influences mortality among patients with stroke. We assessed the proportion of the total variance in mortality that is attributable to the sites using the intraclass correlation coefficient (ICC) as a function of the site-level and the patient-level variances. A value of ICC greater than 5% was considered substantial and confirmatory of the need to conduct a mixed model with random intercept.15,16
Using the mixed effect log-binomial model in STATA version 17, the analysis was carried out in three steps or models. Model I, the first step, was a null model with only the random intercept (and no explanatory variables), allowing for detection of a possible site dimension to mortality in patients with stroke. Model II was an adjusted analysis and included only the patient-level characteristics to examine the extent to which site-level differences in mortality are explained by the patient-level characteristics. The final step (Model III) consisted of both the patient-level and the site-level covariates and was an adjusted analysis. Covariates for all adjusted models (Models II and III) were carefully selected on the basis of a literature search, our clinical understanding of stroke mortality risk, and empirical evidence from our data (significant associations observed in bivariate analyses after Bonferroni adjustment). The adjusted models included selected covariates depending on whether or not they were confirmed confounders in the bivariate analysis and whether or not they improved the model fit or increased the standard error of the parameter estimate of the primary exposure (stroke unit). The numerical covariates in our study (blood pressure, duration of stroke symptoms before presentation at the hospital, and NIHSS score) have been previously shown to be linearly associated with the hazard rate of case fatality rate of stroke in selected studies among indigenous Africans.17,18 Results are presented as adjusted risk ratios (aRRs) with respective 95% CIs. In our interpretation, we focused on aRR more than 1·05 or less than 0·95, to avoid differences that might not be clinically relevant, except for systolic blood pressure, which has a wide range of values over which increments might increase risk of stroke fatality.
The corrected Akaike information criterion (CAIC) and the Bayesian information criterion (BIC) were used for model fit assessment; a lower value of the CAIC and the BIC indicated a better model fit. Patient-level factors were retained in all analyses carried out on the overall sample and stratified by sex, age, and primary stroke type.
Role of the funding source
The funders of the study had no role in study design, data collection, data analysis, data interpretation, or writing of the report.
Results
Table 1 shows the stroke services and resources available across the 16 study sites and site scores out of the 23 items assessed. All the study sites had 12 of 23 items, namely a CT scan machine; electrocardiography; a neurologist, cardiologist, and physiotherapist; and antihypertensives, oral hypoglycaemics, insulin, antiplatelets, anticoagulants, statins, and mannitol. However, only five (31·3%) of the 16 sites had a stroke unit, an organised in-hospital facility staffed by a multidisciplinary team, with at least six beds devoted to the care of patients with stroke. None of the sites provided modern reperfusion therapies, namely intravenous thrombolysis and mechanical thrombectomy services.
Table 1:
Stroke services and resources available at study sites with stroke fatality data
| Location | Stroke unit | MRI scan | Angiography | Carotid doppler | Echocardiography | Holter | Speech therapy | OT | IVT | MT | NSD | Total site score* | Study participants enrolled |
Case fatality at site |
|||||
|---|---|---|---|---|---|---|---|---|---|---|---|---|---|---|---|---|---|---|---|
| Overall (n=3739) | Ischaemic stroke (n=2635) | Intracerebral haemorrhage (n=1104) | Overall (n=814) | Ischaemic stroke (n=476) | Intracerebral haemorrhage (n=338) | ||||||||||||||
|
| |||||||||||||||||||
| 1. Korle-Bu Teaching Hospital, Accra, Ghana | Lower Belt of Ghana | Yes | Yes | Yes | Yes | Yes | Yes | Yes | Yes | No | No | No | 20 | 534 (14·3%) | 328 (12·4%) | 206 (18·7%) | 70 (13·1%) | 28 (8·5%) | 42 (20·4%) |
| 2. Komfo Anokye Teaching Hospital, Kumasi, Ghana | Middle Belt of Ghana | Yes | Yes | Yes | Yes | Yes | Yes | Yes | Yes | No | No | No | 20 | 687 (18·4%) | 415 (15·7%) | 272 (24·6%) | 182 (26·5%%) | 102 (24·6%) | 80 (29·4%) |
| 3. University College Hospital, Ibadan, Nigeria | Southwestern Nigeria | No | Yes | Yes | Yes | Yes | Yes | Yes | Yes | No | No | Yes | 20 | 405 (10·8%) | 255 (9·7%) | 150 (13·6%) | 206 (50·9%) | 118 (46·3%) | 88 (58·7% |
| 4. University of Ilorin Teaching Hospital, Ilorin, Nigeria | Middle Belt of Nigeria | Yes | Yes | Yes | Yes | Yes | Yes | No | No | No | No | No | 19 | 350 (9·4%) | 258 (9·8%) | 92 (8·3%) | 71 (27·5%) | 37 (14·3%) | 34 (37·0%) |
| 5. Obafemi Awolowo University Teaching Hospital, Ile-Ife, Nigeria | Southwestern Nigeria | No | Yes | Yes | Yes | Yes | Yes | Yes | Yes | No | No | Yes | 20 | 202 (5·4%) | 140 (5·3%) | 62 (5·6%) | 23 (11·4%) | 12 (8·6%) | 11 (17·7%) |
| 6. Ahmadu Bello University, Zaria, Nigeria | Northern Nigeria | Yes | Yes | Yes | Yes | Yes | No | Yes | Yes | No | No | No | 19 | 523 (14·0%) | 460 (17·5%) | 63 (5·7%) | 72 (13·8%) | 56 (12·2%) | 16 (25·4%) |
| 7. Aminu Kano Teaching Hospital, Kano, Nigeria | Northwestern Nigeria | No | Yes | Yes | Yes | Yes | Yes | No | No | No | No | No | 17 | 267 (7·1%) | 199 (7·6%) | 68 (6·2%) | 20 (7·4%) | 13 (6·5%) | 7 (10·3%) |
| 8. Jos University Teaching Hospital Jos, Nigeria | Northern Nigeria | No | No | No | No | Yes | No | Yes | Yes | No | No | Yes | 17 | 123 (3·3%) | 83 (3·1%) | 40 (3·6%) | 16 (13·8%) | 12 (14·5%) | 4 (10·0%) |
| 9. Blossom Medical Center, Ibadan, Nigeria | Southwestern Nigeria | Yes | Yes | Yes | Yes | Yes | Yes | Yes | Yes | No | No | Yes | 21 | 16 (0·4%) | 16 (0·6%) | 0 | 0 | 0 | 0 |
| 10. Federal Medical Center, Abeokuta, Nigeria | Southwestern Nigeria | No | Yes | Yes | Yes | Yes | Yes | Yes | Yes | No | No | Yes | 20 | 224 (6·0%) | 165 (6·3%) | 59 (5·3%) | 70 (31·3%) | 44 (26·7%) | 26 (44·1%) |
| 11. Sacred Heart Hospital, Abeokuta, Nigeria | Southwestern Nigeria | No | No | No | No | No | Yes | Yes | No | No | No | No | 14 | 133 (3·6%) | 100 (3·8%) | 33 (3·0%) | 24 (18·0%) | 17 (17·0%) | 7 (21·2%) |
| 12. Federal Medical Center, Umuahia, Nigeria | South South Nigeria | No | Yes | No | Yes | Yes | No | Yes | Yes | No | No | No | 17 | 31 (0·8%) | 23 (0·9%) | 8 (0·7%) | 8 (25·8%) | 5 (21·7%) | 3 (37·5%) |
| 13. Ladoke Akintola University of Technology Hospital, Ogbomosho, Nigeria | Southwestern Nigeria | No | Yes | No | Yes | Yes | No | Yes | Yes | No | No | No | 17 | 11 (0·3%) | 9 (0·3%) | 2 (0·3%) | 5 (45·5%) | 4 (44·4%) | 1 (50·0%) |
| 14. Delta State University Teaching Hospital, Oghara, Nigeria | South South Nigeria | No | Yes | No | Yes | Yes | No | Yes | Yes | No | No | No | 17 | 91 (2·4%) | 67 (2·5%) | 24 (2·2%) | 24 (26·4%) | 12 (17·9%) | 12 (50·0%) |
| 15. Federal Teaching Hospital Ido-Ekiti, Nigeria | Southwestern Nigeria | No | Yes | Yes | Yes | Yes | Yes | No | Yes | No | No | Yes | 19 | 58 (1·6%) | 44 (1·7%) | 14 (1·3%) | 4 (6·9%) | 2 (4·5%) | 2 (14·3%) |
| 16. Federal Medical Center, Owo, Nigeria | Southwestern Nigeria | No | Yes | No | Yes | Yes | Yes | No | Yes | No | No | No | 17 | 84 (2·2%) | 73 (2·8%) | 11 (1·0%) | 19 (22·6%) | 14 (19·1%) | 5 (45·5%) |
| Total† | ·· | ·· | ·· | ·· | ·· | ·· | ·· | ·· | ·· | ·· | ·· | ·· | 3739 | 2635 (70·0%) | 1104 (30·0%) | 814 (21·8%) | 476 (18·2%) | 338 (30·2%) | |
All facilities were tertiary level centres, except Blossom Medical Center, Ibadan, Nigeria, which was a secondary level centre. All sites had CT scan machines, electrocardiography machines, a neurologist, cardiologist, and physiotherapist (personnel), and the following medications: antihypertensives, oral hypoglycaemics, insulin, antiplatelets, anticoagulants, statins, and mannitol (not shown in the table). OT=occupational therapy. IVT=intravenous thrombolytic therapy. MT=mechanical thrombectomy. NSD=neurosurgical decompression.
Out of 23 items.
The denominator for all percentages in the Total row is 3739 (the total number of study participants).
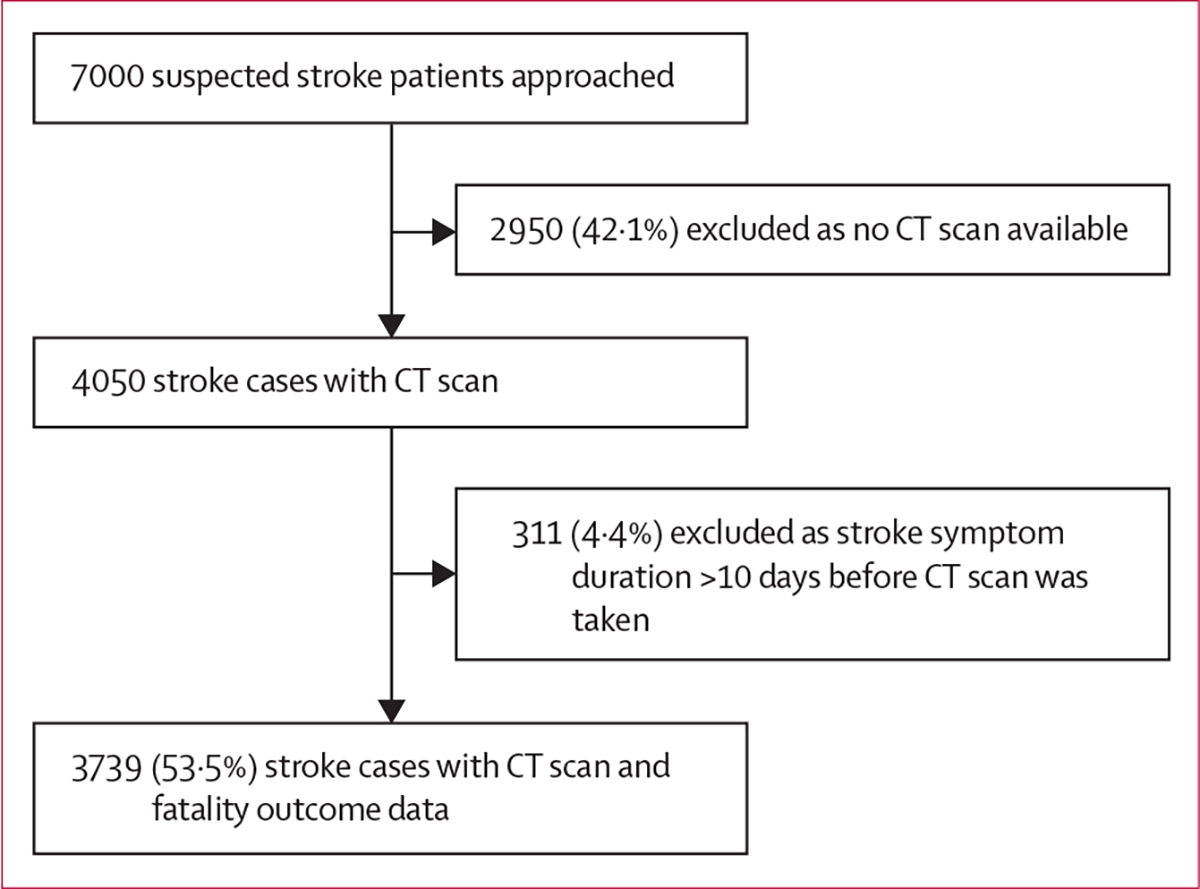
We approached 7000 clinically suspected stroke cases and enrolled 3739 patients with stroke between 2014 and 2019 across 16 study sites (figure). Overall, 814 (21·8%) died as inpatients; table 1 shows a breakdown of stroke case fatality per site, by stroke type.
Figure: Flow chart for stroke cases included in the analysis.
The mean age of those who died was 60·9 years (SD 15·1) versus 59·5 years (14·1) for those who survived. Approximately 42% of study participants had altered level of consciousness at presentation. Information on demographic and self-reported lifestyle behaviours was obtained by proxy in 2870 (76·8%) study participants, such as children of participants (31·6%), a spouse (23·2%), next of kin (18·0%), caregiver (3·6%), or friend (0·3%). The demographic features of stroke cases such as sex, location of residence, monthly income, and primary occupation were comparable between those alive at discharge and those who died, although there was a trend for a lower proportion of those who died to have attained tertiary education (table 2). Fatality was significantly higher among those with intracerebral haemorrhage (338 [30·6%] of 1104) compared with ischaemic stroke (476 [18·1%] of 2635). Those who died were more likely than those alive at discharge to have documented stroke-related complications such as raised ICP (41·5% vs 11·7%), aspiration pneumonia (41·0% vs 10·4%), deep venous thrombosis (8·6% vs 2·2%), cardiac arrhythmias (8·1% vs 1·8%), and decubitus ulcers (8·2% vs 2·8%; table 2). Bivariate analysis for ischaemic stroke and intracerebral haemorrhage is shown in appendix 4 (pp 9–15).
Table 2:
Comparison of characteristics of patients with stroke in Ghana and Nigeria by fatality status
| Alive at discharge (n=2925) | Died (n=814) | p value | |
|---|---|---|---|
|
| |||
| Demographic characteristics | |||
| Sex | |||
| Male | 1640 (56·1%) | 464 (57·0%) | 0·61 |
| Female | 1285 (43·9%) | 350 (43·0%) | ·· |
| Age, years | 59·5 (14·1) | 60·9 (15·1) | 0·0001 |
| Monthly income >US$100 | 1609 (55·0%) | 429 (52·7%) | 0·25 |
| Educational status | |||
| None or primary | 1125 (38·5%) | 305 (37·5%) | 0·03 |
| Secondary | 817 (27·9%) | 264 (32·4%) | ·· |
| Tertiary or higher | 974 (33·3%) | 243 (29·9%) | ·· |
| Location of domicile | |||
| Urban | 1783 (61·0%) | 518 (63·6%) | 0·41 |
| Semi-urban | 864 (29·5%) | 223 (27·4%) | ·· |
| Rural | 266 (9·1%) | 72 (8·8%) | ·· |
| Country | |||
| Nigeria | 1954 (66·8%) | 559 (68·7%) | 0·32 |
| Ghana | 971 (33·2%) | 255 (31·3%) | ·· |
| Primary occupation | |||
| Highly skilled, skilled, or semi-skilled | 1151 (39·4%) | 345 (42·4%) | 0·10 |
| Manual | 656 (22·4%) | 191 (23·5%) | ·· |
| Retired | 535 (18·3%) | 156 (19·2%) | ·· |
| Unemployed | 149 (5·1%) | 38 (4·7%) | ·· |
| Other | 264 (9·0%) | 51 (6·3%) | ·· |
| Vascular risk factors | |||
| Hypertension | 2797 (95·6%) | 786 (96·6%) | 0·13 |
| Diabetes | 1125 (38·5%) | 296 (36·4%) | 0·28 |
| Dyslipidaemia | 2467 (84·3%) | 635 (78·0%) | <0·0001 |
| Tobacco use (any use) | 277 (9·5%) | 74 (9·1%) | 0·70 |
| Alcohol use (current use) | 926 (31·7%) | 261 (32·1%) | 0·84 |
| Waist-to-hip ratio | 0·94 (0·1) | 0·94 (0·1) | 0·0031 |
| Waist-to-hip ratio raised | 2268 (77·5%) | 646 (79·4%) | 0·10 |
| Waist-to-hip ratio by thirds | |||
| ≤0·90 | 729 (24·9%) | 186 (22·9%) | 0·48 |
| 0·91–0·96 | 1007 (34·4%) | 292 (35·9%) | ·· |
| ≥0·97 | 1014 (34·7%) | 283 (34·8%) | ·· |
| Cardiac disease, any | 351 (12·0%) | 77 (9·5%) | 0·047 |
| Stress | 537 (18·4%) | 135 (16·6%) | 0·26 |
| Depression | 214 (7·3%) | 52 (6·4%) | 0·41 |
| Adding salt at the table | 196 (6·7%) | 63 (7·7%) | 0·26 |
| Low consumption of green leafy vegetables | 658 (22·5%) | 312 (38·3%) | <0·0001 |
| Meat consumption | 2034 (69·5%) | 547 (67·2%) | 0·69 |
| Family history of stroke | 473 (16·2%) | 87 (10·7%) | <0·0001 |
| Clinical characteristics at presentation | |||
| Headache | 1206 (41·2%) | 362 (44·5%) | 0·038 |
| Vomiting | 521 (17·8%) | 232 (28·5%) | <0·0001 |
| Disturbed consciousness | 1052 (36·0%) | 520 (63·9%) | <0·0001 |
| Seizure | 254 (8·7%) | 115 (14·1%) | <0·0001 |
| Focal neurologic deficit | 1906 (65·2%) | 19·4 (2·4%) | <0·0001 |
| Previous stroke | 281 (9·6%) | 76 (9·3%) | 0·82 |
| Blood pressure at presentation | |||
| Systolic | 156·1 (29·5) | 166·5 (34·3) | <0·0001 |
| Diastolic | 94·2 (17·6) | 105·2 (17·7) | 0·0040 |
| Laboratory characteristics | |||
| Haematocrit (%) | 27·9 (7·4) | 27·8 (3·8) | 0·39 |
| Mean corpuscular volume, fL | 83·2 (20·1) | 82·3 (8·8) | 0·45 |
| Platelets, ×103/μL | 350·9 (72·8) | 206·6 (87·6) | 0·20 |
| HDL cholesterol, mg/dL | 47·6 (19·3) | 47·6 (19·9) | 0·55 |
| LDL cholesterol, mg/dL | 120·8 (51·7) | 118·3 (49·6) | 0·07 |
| Total cholesterol, mg/dL | 190·5 (57·5) | 188·7 (57·5) | 0·22 |
| Triglycerides, mg/dL | 123·5 (82·4) | 129·5 (77·4) | 0·52 |
| Serum creatinine, mg/dL | 1·8 (8·7) | 1·9 (3·3) | 0·91 |
| Random blood glucose at admission, mg/dL | 116·0 (49·1) | 126·9 (55·5) | 0·0088 |
| Urea, mg/dL | 42·0 (118·3) | 52·3 (51·9) | 0·092 |
| Neuroradiological correlates | |||
| Stroke type | |||
| Ischaemic | 2159 (73·8%) | 476 (58·5%) | <0·0001 |
| Intracerebral haemorrhage | 766 (26·2%) | 338 (41·5%) | ·· |
| Volume of lesion, cm3 | |||
| <10 | 1476 (50·5%) | 270 (33·2%) | <0·0001 |
| 10–30 | 478 (16·3%) | 151 (18·6%) | ·· |
| >30 | 365 (12·5%) | 238 (29·2%) | ·· |
| Location of lesion | |||
| Haemorrhagic stroke | |||
| Lobar | 164 (5·6%) | 61 (7·5%) | 0·14 |
| Non-lobar | 546 (18·7%) | 260 (31·9%) | ·· |
| Stroke aetiology | |||
| Ischaemic stroke | |||
| TOAST classification | |||
| Large vessel atherosclerosis | 583 (19·9%) | 163 (20·0%) | <0·0001 |
| Small-vessel occlusion or lacunar | 637 (21·7%) | 94 (11·5%) | ·· |
| Cardioembolic | 126 (4·3%) | 29 (3·6%) | ·· |
| Other | 817 (27·9%) | 190 (23·3%) | ·· |
| OCSP classification | |||
| Total anterior circulation infarct | 227 (7·8%) | 88 (10·8%) | <0·0001 |
| Partial anterior circulation infarct | 577 (19·7%) | 126 (15·5%) | ·· |
| Posterior circulation infarct | 189 (6·5%) | 36 (4·4%) | ·· |
| Lacunar infarct | 741 (25·3%) | 134 (16·5%) | ·· |
| Haemorrhagic stroke | |||
| SMASH-U aetiological classes | |||
| Structural | 23 (0·8%) | 13 (1·6%) | 0·62 |
| Medication-associated | 3 (0·1%) | 2 (0·2%) | ·· |
| Amyloid angiopathy | 7 (0·2%) | 5 (0·6%) | ·· |
| Systemic diseases | 4 (0·1%) | 0 (0·0%) | ·· |
| Hypertension | 555 (19·0%) | 237 (29·1%) | ·· |
| Undetermined | 17 (0·6%) | 6 (0·7%) | ·· |
| Stroke severity indicators | |||
| NIHSS score | 12·3 (9·6) | 24·7 (12·4) | <0·0001 |
| Stroke Levity Scale | 6·7 (4·3) | 3·3 (2·9) | <0·0001 |
| Modified Rankin score | 3·7 (1·2) | 4·6 (0·8) | <0·0001 |
| Use of vascular preventive medicines before stroke | |||
| Antihypertensives | 1469 (50·2%) | 360 (44·2%) | 0·0045 |
| Antiplatelets | 471 (16·1%) | 65 (8·0%) | <0·0001 |
| Statins | 188 (6·4%) | 29 (3·6%) | 0·0021 |
| Antidiabetics | 373 (12·8%) | 92 (11·3%) | 0·28 |
| Anticoagulants | 27 (0·9%) | 15 (1·8%) | 0·027 |
| Hypouricosuric medications | 12 (0·4%) | 3 (0·4%) | 0·87 |
| Medical treatments instituted on admission | |||
| Antiplatelets | 1585 (54·2%) | 283 (34·8%) | <0·0001 |
| Anticoagulant after stroke | 328 (11·2%) | 102 (12·5%) | 0·30 |
| Heparin | 121 (4·1%) | 41 (5·0%) | 0·27 |
| Warfarin | 63 (2·2%) | 30 (3·7%) | 0·013 |
| Dabigatran | 34 (1·2%) | 8 (1·0%) | 0·67 |
| Rivaroxaban | 50 (1·7%) | 8 (1·0%) | 0·14 |
| Other | 60 (2·1%) | 15 (1·8%) | 0·71 |
| Cerebral decompression with osmotic therapy | 1121 (38·3%) | 471 (57·9%) | <0·0001 |
| Antihypertensives | 2443 (83·5%) | 634 (77·9%) | 0·0043 |
| Antioxidants | 1022 (34·9%) | 207 (25·4%) | <0·0001 |
| Insulin | 293 (10·0%) | 103 (12·7%) | 0·034 |
| Oral hypoglycaemic agents | 517 (17·7%) | 119 (14·6%) | 0·071 |
| Statins | 1547 (52·9%) | 297 (36·5%) | <0·0001 |
| Physiotherapy | 2036 (69·6%) | 527 (64·7%) | 0·0034 |
| Anti-embolism stockings | 585 (20·0%) | 284 (34·9%) | <0·0001 |
| Speech therapy | 318 (10·9%) | 59 (7·2%) | 0·0018 |
| Documented complications | |||
| Raised intracranial pressure | 343 (11·7%) | 338 (41·5%) | <0·0001 |
| Aspiration pneumonia | 303 (10·4%) | 334 (41·0%) | <0·0001 |
| Deep venous thrombosis | 64 (2·2%) | 70 (8·6%) | <0·0001 |
| Pulmonary thromboembolism | 16 (0·5%) | 12 (1·5%) | 0·0032 |
| Arrhythmias | 54 (1·8%) | 66 (8·1%) | <0·0001 |
| Seizure disorder | 130 (4·4%) | 99 (12·2%) | <0·0001 |
| Urinary tract infection | 188 (6·4%) | 64 (7·9%) | 0·052 |
| Decubitus ulcers | 82 (2·8%) | 67 (8·2%) | <0·0001 |
| Depression | 200 (6·8%) | 24 (2·9%) | <0·0001 |
| Dementia | 31 (1·1%) | 7 (0·9%) | 0·73 |
| Parkinsonism | 26 (0·9%) | 4 (0·5%) | 0·32 |
| Duration of symptoms and admission | |||
| Duration of stroke symptoms before presentation, days | 1·0 (0·0–4·0) | 1·0 (0·0–3·0) | <0·0001 |
| Duration of admission, days | 11·0 (7·0–19·0) | 8·0 (5·0–16·0) | <0·0001 |
| Health facilities | |||
| Stroke unit | |||
| Not available | 1210 (41·4%) | 419 (51·5%) | <0·0001 |
| Available | 1715 (58·6%) | 395 (48·5%) | ·· |
Data are n (%), mean (SD), or median (IQR). TOAST=Trial of ORG 10172 in Acute Stroke Treatment. OCSP=Oxfordshire Community Stroke Project. NIHSS=National Institutes of Health Stroke Scale.
Regarding determinants of stroke fatality, the nested regression models using non-automated forward stepwise procedures showed no multicollinearity among covariates included in the regression analyses (appendix 4 p 16). The results of the random intercept model or the null model for stroke mortality (Model I) in table 3 show there is significant variation in the risk of stroke fatality across sites (contextual random variance=0·26, p=0·023). Also, the variability in the risk of stroke fatality that could be attributed to sites (ICC=7·33%) is considered substantial. The results of the multilevel model with only the individual-level factors (Model II) show that six factors were associated with inpatient stroke fatality, namely low consumption of green leafy vegetables (aRR 1·19 [95% CI 1·07–1·33]), systolic blood pressure at presentation (aRR 1·02 [1·01–1·04] for each 10 mm Hg increase), lesion volume more than 30 cm3 (aRR 1·48 [1·22–1·79]), higher NIHSS score (aRR 1·20 [1·13–1·26] for each 5-unit rise), raised ICP (aRR 1·75 [1·31–2·33]), and aspiration pneumonia (aRR 1·79 [1·16–2·77]). We emphasise a relative risk of at least 1·02 for each 10 mm Hg rise in systolic blood pressure obtained from our regression analysis, given the wide range of systolic blood pressure over which increments can increase risk of stroke fatality. These six factors remained significantly associated with stroke fatality in the adjusted analysis of the individual-level and site-level characteristics (Model III) but availability of a stroke unit at the study site was not associated with fatality (aRR 1·08 [0·55–2·11]).
Table 3:
Determinants of stroke fatality in Ghana and Nigeria
| Null model (Model I) | Model with patient-level variables (Model II) | Model with patient-level and site-level variables (Model III) | |
|---|---|---|---|
|
| |||
| Stroke type | |||
| Ischaemic stroke (ref) | ·· | 1 | 1 |
| Intracerebral haemorrhage | ·· | 0·92 (0·78–1·08) | 0·92 (0·78–1·088) |
| Vascular risk factors | |||
| Dyslipidaemia | ·· | 0·83 (0·67–1·02) | 0·83 (0·67–1·02) |
| Low consumption of green leafy vegetables | ·· | 1·19 (1·07–1·33) | 1·20 (1·07–1·33) |
| Family history of stroke | ·· | 0·80 (0·65–1·00) | 0·81 (0·65–1·00) |
| Systolic blood pressure at presentation, each 10 mm Hg rise | ·· | 1·02 (1·01–1·04) | 1·02 (1·01–1·04) |
| Lesion volume, cm3 | |||
| <10 (ref) | ·· | 1 | 1 |
| 10–30 | ·· | 1·29 (1·12–1·49) | 1·29 (1·12–1·50) |
| >30 | ·· | 1·48 (1·22–1·79) | 1·48 (1·22–1·79) |
| Measure of stroke severity | |||
| NIHSS score, each 5-unit rise | ·· | 1·20 (1·13–1·26) | 1·20 (1·13–1·26) |
| Documented complications | |||
| Raised intracranial pressure | ·· | 1·75 (1·31–2·33) | 1·75 (1·31–2·33) |
| Aspiration pneumonia | ·· | 1·79 (1·16–2·77) | 1·80 (1·17–2·76) |
| Deep venous thrombosis | ·· | 1·23 (0·82–1·85) | 1·23 (0·82–1·85) |
| Arrhythmias | ·· | 0·97 (0·61–1·55) | 0·97 (0·60–1·55) |
| Seizure disorder | ·· | 1·22 (0·91–1·63) | 1·22 (0·90–1·65) |
| Decubitus ulcers | ·· | 1·19 (0·85–1·67) | 1·19 (0·85–1·68) |
| Duration of stroke symptoms before presentation | ·· | 0·99 (0·99–1·00) | 0·99 (0·99–1·00) |
| Stroke unit | ·· | ·· | 1·08 (0·55–2·11) |
| Intercept | 0·18 (0·13–0·24)* | 0·03 (0·01–0·05) | 0·03 (0·02–0·05) |
| Random effect | |||
| Contextual random variance (SE) | 0·26 (0·10) | 0·29 (0·12) | 0·29 (0·11) |
| ICC | 7·33% | 8·10% | 8·11% |
| Model fit statistics | |||
| CAIC | 3928·88 | 1753·49 | 1753·44 |
| BIC | 3941·33 | 1838·06 | 1838·00 |
Data are adjusted risk ratio (95% CI) unless otherwise stated. NIHSS=National Institutes of Health Stroke Scale. SE=standard error. ICC=intraclass correlation coefficient. CAIC=Corrected Akaike information criterion. BIC=Bayesian information criterion.
p<0·001.
Six factors were independently associated with ischaemic stroke fatality, namely low consumption of green leafy vegetables, infarct volume more than 30 cm3, higher NIHSS score, use of antiplatelet therapy (protective association), raised ICP, and aspiration pneumonia (table 4). For intracerebral haemorrhage, volume of haemorrhage, NIHSS score, raised ICP, aspiration pneumonia, depression (protective association), and duration of stroke symptoms before presentation were six factors associated with fatality (table 5). By sex, we found six factors were independently associated with stroke fatality among men and four factors among women (appendix 4 pp 17–18). Among those younger than 50 years, we found that family history of stroke (protective association), stroke severity, raised ICP, deep venous thrombosis, and decubitus ulcers were associated with fatality (appendix 4 pp 19–20). Dyslipidaemia, low consumption of green leafy vegetables, higher admission systolic blood pressure, larger lesion volume, stroke severity, raised ICP, and aspiration pneumonia were associated with fatality among those aged 50 years or older.
Table 4:
Determinants of stroke fatality in Ghana and Nigeria stratified by stroke type (ischaemic stroke)
| Null model (Model I) | Model with patient-level variables (Model II) | Model with patient-level and site-level variables (Model III) | |
|---|---|---|---|
|
| |||
| Vascular risk factors | |||
| Low consumption of green leafy vegetables | ·· | 1·37 (1·08–1·73)* | 1·38 (1·09–1·74)* |
| Systolic blood pressure at presentation, each 10 mm Hg rise | ·· | 1·01 (0·96–1·05) | 1·00 (0·96–1·05) |
| Lesion volume, cm3 | |||
| <10 (ref) | ·· | ·· | ·· |
| 10–30 | ·· | 1·14 (0·81–1·60) | 1·60 (0·82–1·62) |
| >30 | ·· | 1·45 (1·03–2·02)† | 1·46 (1·05–2·02)† |
| TOAST classification | |||
| Large vessel atherosclerosis | ·· | ·· | ·· |
| Small-vessel occlusion or lacunar | ·· | 0·96 (0·79–1·18) | 0·98 (0·81–1·19) |
| Cardioembolic | ·· | 0·82 (0·79–1·18) | 0·83 (0·66–1·05) |
| Other | ·· | 0·94 (0·75–1·17) | 0·94 (0·75–1·18) |
| Measure of stroke severity | |||
| NIHSS, each 5-unit rise | ·· | 1·23 (1·16–1·30)‡ | 1·23 (1·16–1·30)‡ |
| Use of vascular preventive medicines before stroke | |||
| Antiplatelets | ·· | 0·90 (0·67–1·22) | 0·90 (0·67–1·21) |
| Medical treatments instituted on admission | |||
| Antiplatelets | ·· | 0·72 (0·58–0·88)* | 0·72 (0·58–0·88)* |
| Antihypertensives | ·· | 0·86 (0·57–1·29) | 0·87 (0·58–1·29) |
| Antioxidants | ·· | 0·76 (0·56–1·04) | 0·73 (0·51–1·05) |
| Statins | ·· | 0·95 (0·83–1·09) | 0·98 (0·85–1·12) |
| Anti-embolism stockings | ·· | 1·16 (0·88–1·53) | 1·16 (0·87–1·55) |
| Documented complications | |||
| Raised intracranial pressure | ·· | 1·64 (1·30–2·07)‡ | 1·63 (1·28–2·08)‡ |
| Aspiration pneumonia | ·· | 2·01 (1·27–3·18)* | 2·05 (1·30–3·23)* |
| Deep venous thrombosis | ·· | 1·06 (0·62–1·81) | 1·06 (0·63–1·79) |
| Pulmonary thromboembolism | ·· | 1·27 (0·65–2·48) | 1·29 (0·66–2·51) |
| Arrhythmias | ·· | 1·02 (0·58–1·77) | 1·02 (0·58–1·78) |
| Seizure disorder | ·· | 0·93 (0·60–1·44) | 0·94 (0·60–1·48) |
| Urinary tract infection | ·· | 1·09 (0·788–1·51) | 1·09 (0·78–1·53) |
| Decubitus ulcers | ·· | 1·23 (0·72–2·10) | 1·22 (0·72–2·08) |
| Stroke unit | ·· | ·· | 1·47 (0·78–2·79) |
| Intercept | 0·15 (0·11–0·20)‡ | 0·05 (0·02–0·11)‡ | 0·04 (0·01–0·09)‡ |
| Random effect | |||
| Contextual random variance (SE) | 0·29 (0·11) | 0·23 (0·13) | 0·19 (0·15) |
| ICC | 8·10% | 6·54% | 5·46% |
| Model fit statistics | |||
| CAIC | 2463·53 | 1053·56 | 1052·23 |
| BIC | 2475·29 | 1132·50 | 1131·17 |
Data are adjusted risk ratio (95% CI) unless otherwise stated. TOAST=Trial of ORG 10172 in Acute Stroke Treatment. NIHSS=National Institutes of Health Stroke Scale. SE=standard error. ICC=intraclass correlation coefficient. CAIC=Corrected Akaike information criterion. BIC=Bayesian information criterion.
p<0·01.
p<0·05.
p<0·001.
Table 5:
Determinants of stroke fatality in Ghana and Nigeria stratified by stroke type (haemorrhagic stroke)
| Null model (Model I) | Model with patient-level variables (Model II) | Model with patient-level and site-level variables (Model III) | |
|---|---|---|---|
|
| |||
| Established risk factors | |||
| Low consumption of green leafy vegetables | ·· | 1·22 (0·86–1·73) | 1·28 (0·95–1·71) |
| Lesion volume, cm3 | |||
| <10 (ref) | ·· | ·· | ·· |
| 10–30 | ·· | 1·30 (0·95–1·77) | 1·30 (0·93–1·81) |
| >30 | ·· | 1·60 (1·16–2·23)* | 1·59 (1·16–2·20)* |
| Measure of stroke severity | |||
| NIHSS, each 5-unit rise | ·· | 1·13 (1·08–1·18)† | 1·12 (1·08–1·15) |
| Medical treatments instituted on admission | |||
| Cerebral decompression with osmotic therapy | ·· | 1·05 (0·75–1·46) | 1·05 (0·76–1·46) |
| Documented complications | |||
| Raised intracranial pressure | ·· | 1·78 (1·37–2·32)† | 1·79 (1·38–2·33)† |
| Aspiration pneumonia | ·· | 1·75 (1·29–2·37)† | 1·78 (1·31–2·41)† |
| Deep venous thrombosis | ·· | 1·29 (0·82–2·05) | 1·31 (0·85–2·03) |
| Arrhythmias | ·· | 0·91 (0·71–1·15) | 0·93 (0·64–1·34) |
| Seizure disorder | ·· | 1·21 (0·97–1·52) | 1·22 (0·95–1·56) |
| Depression | ·· | 0·47 (0·22–0·98)‡ | 0·47 (0·21–1·03) |
| Duration of stroke symptoms before presentation | ·· | 0·99 (0·99–0·99)* | 0·99 (0·99–0·99)* |
| Stroke unit | ·· | ·· | 1·12 (0·70–1·79) |
| Intercept | 0·27 (0·20–0·36)† | 0·06 (0·04–0·10)† | 0·06 (0·05–0·08)† |
| Random effect | |||
| Contextual random variance (SE) | 0·19 (0·83) | 0·04 (0·10) | ·· |
| ICC | 5·46% | 1·20% | ·· |
| Model fit statistics | |||
| CAIC | 1440·72 | 740·12 | 740·00 |
| BIC | 1450·74 | 789·68 | 789·56 |
Data are adjusted risk ratio (95% CI) unless otherwise stated. NIHSS=National Institutes of Health Stroke Scale. SE=standard error. ICC=intraclass correlation coefficient. CAIC=Corrected Akaike information criterion. BIC=Bayesian information criterion.
p<0·01.
p<0·001.
p<0·05.
Discussion
Approximately 22% of patients admitted into 16 hospitals in the SIREN study died of stroke and its complications as inpatients. This case fatality rate agrees closely with that from recently published meta-analytic data involving 34 362 indigenous Africans, where the 1-month pooled case fatality rate was 24·1% (95% CI 21·5–27·0).19 The case fatality rate from ischaemic stroke in our study was 18·1% (16·6–19·6), which is higher when compared with the worldwide 1-month case fatality of 13·5% (12·3–14·7) reported by Zhang and colleagues in 2020.20 The high case fatality from intracerebral haemorrhage of 30·6% (27·9–33·4) is comparable with existing data from low-income and middle-income countries on the basis of evidence from the Global Burden of Diseases, Injuries, and Risk Factors Study.21 These data should be interpreted with a caveat of potential referral bias whereby more severe cases of stroke are referred to the SIREN study sites.
There was homogeneity in study site characteristics, with respect to availability of skilled health personnel such as neurologists and cardiologists, investigative capabilities (CT or MRI scanners, cardiology work-up), and cardiovascular medications for stroke management. Almost 94% of study hospitals were tertiary medical centres. Yet, the lack of acute reperfusion interventions such as thrombolysis and mechanical thrombectomy was pervasive across sites. Furthermore, only five (31%) of the 16 sites had stroke units and 38% had neurosurgical decompressive services available on site. Stroke services and resources available at hospital sites explained up to 7·3% of the variability in the risk of stroke fatality. We acknowledge that patient-level characteristics across sites might also increase this variability, as shown in Model III, but theoretically, Model I does not capture this patient-level variability. Nevertheless, we found that the availability of stroke units per se did not mitigate fatality although it was significant in bivariate analysis. The INTERSTROKE investigators found that having access to a stroke unit irrespective of the economic level of a country was associated with improved survival without severe dependency.22 These differences might reflect the inadequacy of bed capacity and lack of infrastructure and equipment in our stroke units to meet the high burden of stroke admissions. Perhaps functional outcomes or long-term case fatality would better capture the benefit of stroke units in the context of Africa.
Among a host of patient-level factors assessed, six factors were independently associated with stroke fatality, namely low vegetable consumption, high systolic blood pressure at presentation, larger lesion volumes, raised ICP, stroke severity, and aspiration pneumonia. As a premorbid factor, low consumption of vegetables increased risk of stroke fatality by 19% (95% CI 7–33). Vegetable consumption is thought to mediate protective cardiovascular effects mainly via antioxidant and blood pressure-lowering mechanisms.23,24 In concert, higher systolic blood pressure at presentation increased fatality, with each 10 mm Hg rise associated with a 2% (1–4) higher risk of inpatient death. Although blood pressure elevation after a stroke might be reactionary to maintain cerebral perfusion pressure, excessive surges in blood pressure are deleterious and promote extensive cerebral oedema.25 Accordingly, larger stroke lesion volumes incrementally increased stroke fatality by 29% (12–49) for lesions measuring 10–30 cm3 and by 48% (22–79) for lesions larger than 30 cm3. In particular, lesions larger than 30 cm3 were associated with higher fatality risk in all subgroup analyses except those younger than 50 years. A raised ICP was associated with stroke fatality across all subgroups in sensitivity analyses. With limited access to neurosurgical decompressive intervention, the presence of raised ICP following a stroke in our settings is ominous. Furthermore, we observed that each 5-unit rise in the NIHSS score was associated with 20% (13–26) higher relative risk of fatality overall, an association which persisted among stroke types. Previous studies have demonstrated a very strong discriminative, graded near-linear relationship between first recorded NIHSS and higher 30-day mortality risk for ischaemic strokes.26 In addition, other studies have now posited that the NIHSS score is an independent predictor for prognosticating outcomes of intracerebral haemorrhage as our study affirms.27
In addition to the aforementioned factors, we identified six more factors associated with stroke fatality in specific subgroups, including antiplatelet use among patients with ischaemic stroke (protective; table 4), earlier time to presentation to hospital among patients with intracerebral haemorrhage (protective; table 5), family history of stroke (protective among males and those younger than 50 years), deep venous thrombosis and decubitus ulcers (adversely associated among those younger than 50 years), and dyslipidaemia (protective among those 50 years or older; appendix 4 pp 17–18). The use of antiplatelet therapy was associated with a 28% (95% CI 12–42) lower relative risk of fatality among those with ischaemic stroke in consonance with the INTERSTROKE study, in which there was a 39% (12–72) improvement in survival on antiplatelet therapy irrespective of other patient and service attributes.22
Our study has important clinical and policy implications. The high prevalence of severe strokes and intracerebral haemorrhage necessitates investments in developing and strengthening emergency services to transport patients for urgent care. Setting up stroke units is now a necessity in all regional capitals and possibly district hospitals to provide emergency assessment and care for stroke patients. The excess deaths due to aspiration pneumonia, elevated blood pressure, and decubitus ulcers might be amenable to enacting appropriate protocols for screening for dysphagia after stroke, management of hypertension, and optimising nursing care.28
The following limitations are worth noting. First, we only included patients who underwent a head CT scan within 10 days to determine the stroke type to be eligible for inclusion into our study. Thus, patients with clinically suspected strokes who died before neuroimaging or those who presented after 10 days of symptom onset were excluded. Secondly, 15 of the 16 study sites included were either referral or tertiary medical centres, which does not reflect the experiences at lower cadres of health-care delivery in Ghana and Nigeria. Thirdly, study sites were not randomly selected within the two countries. Fourthly, we had no data on the fraction of all stroke patients who died before reaching hospital. Due to these four reasons, the findings have limited generalisability. System-level factors were included in our models as an aggregate score assuming that each factor carried an equal weight. In addition, details of staff strength and functionality of equipment of stroke units were not assessed. Assessment of raised ICP using either direct ICP monitoring or indirect markers such as papilloedema would have improved upon the accuracy of evaluation of ICP as a factor associated with stroke fatality. These limitations notwithstanding, this is one of the largest and most comprehensive efforts at delineating the patient-level and system-level factors associated with acute stroke fatality in Africa.
Active engagement between advocacy groups such as patient support groups, care providers, and policy makers is required to align emergency stroke care needs and policy priorities of health ministries in Africa. These are some of the core mandates of the African Stroke Organization.29,30 Implementation studies are particularly needed to critically assess the barriers and facilitators of stroke service provision gaps in Africa to produce workable solutions.
In conclusion, six patient characteristics—namely low vegetable consumption, high systolic blood pressure at presentation, larger lesion volumes, raised ICP, stroke severity, and aspiration pneumonia—are associated with stroke fatality among west Africans. Stroke services and resources such as stroke units were scarce. Development of local, context-attuned protocols for screening and management of aspiration pneumonia, blood pressure, and ICP, along with establishment of stroke units, might substantially reduce stroke fatality in this region. Clinical trials assessing the effects of interventions targeting patient-level determinants of acute stroke fatality in Africa are eagerly awaited.
Supplementary Material
Research in context.
Evidence before this study
Early mortality after stroke in sub-Saharan African countries is unacceptably high. Single-centre studies with limited sample sizes in the region have focused on patient-level determinants of case fatality without contemporaneous evaluation of system-level factors. Consequently, patient-level and system-level contributors to early stroke mortality in this region are yet to be delineated. We performed a literature search of articles in English published between Jan 1, 1990, and Jan 1, 2022, on multicentre studies assessing patient-level and system-level factors associated with stroke fatality in Africa. Our search identified the INTERSTROKE study which had representation from African hospitals. Data from 108 hospitals with 12 300 patients with stroke in the INTERSTROKE observational study showed that patients from resource-limited countries had more severe strokes and intracerebral haemorrhages, poorer access to stroke services, and used fewer investigations and treatment than resource-replete countries. However, there was a smaller representation of indigenous African patients and hospitals in INTERSTROKE compared with our study.
Added value of this study
Overall, 22% of patients with stroke died on admission, with a lower case fatality among ischaemic strokes at 18·1% compared with 30·6% for intracerebral haemorrhage. We found that availability of stroke services and resources across 16 large hospitals contributed to 7·3% of the variability in stroke mortality. Stroke units, an evidence-based stroke service intervention, were available only at five of 16 participating centres. Six patient-level factors—namely low vegetable consumption, elevated systolic blood pressure at presentation, larger lesion volumes, raised intracranial pressure, stroke severity, and aspiration pneumonia—independently predicted early fatality.
Implications of all the available evidence
A mix of patient characteristics and system-level barriers in 16 hospitals in west Africa provide potential actionable points to address the high stroke fatality across hospitals in Africa. Development of local, context-attuned protocols for screening and management of swallowing abnormalities and blood pressure management, along with establishment of stroke units, are urgent priorities in this region.
Acknowledgments
This study and the investigators are supported by the National Institutes of Health NIH/NINDS Stroke Investigative Research and Educational Network (SIREN U54HG007479), Systematic Investigation of Blacks with Stroke (SIBS Genomics R01NS107900), SIBS Gen Gen (R01NS107900-02S1), ARISES (R01NS115944-01), H3Africa CVD Supplement (3U24HG009780-03S5), CaNVAS (1R01NS114045-01), Sub-Saharan Africa Conference on Stroke (SSACS) 1R13NS115395-01A1, Training Africans to Lead and Execute Neurological Trials & Studies (TALENTS) D43TW012030, and ELSI grant 1U01HG010273.
Footnotes
Declaration of interests
We declare no competing interests.
For the Twi translation of the abstract see Online for appendix 1
For the Yoruba translation of the abstract see Online for appendix 2
For the Hausa translation of the abstract see Online for appendix 3
Contributor Information
Fred S Sarfo, Department of Medicine, Kwame Nkrumah University of Science and Technology, Kumasi, Ghana.
Onoja M Akpa, Department of Epidemiology and Medical Statistics, College of Medicine, University of Ibadan, Ibadan, Nigeria; Preventive Cardiology Research Unit, Institute of Cardiovascular Diseases, College of Medicine, University of Ibadan, Ibadan, Nigeria.
Bruce Ovbiagele, Weill Institute for Neurosciences, School of Medicine, University of California San Francisco, San Francisco, CA, USA.
Albert Akpalu, Department of Medicine, University of Ghana Medical School, Accra, Ghana.
Kolawole Wahab, Department of Medicine, University of Ilorin Teaching Hospital, Ilorin, Nigeria.
Reginald Obiako, Department of Medicine, Ahmadu Bello University, Zaria, Nigeria.
Morenikeji Komolafe, Department of Medicine, Obafemi Awolowo University Teaching Hospital, Ile-Ife, Nigeria.
Lukman Owolabi, Department of Medicine, Aminu Kano Teaching Hospital, Kano, Nigeria.
Godwin Ogbole, Department of Radiology, University of Ibadan, Ibadan, Nigeria.
Adekunle Fakunle, Department of Medicine, University of Ibadan, Ibadan, Nigeria; Department of Public Health, Osun State University, Osogbo, Nigeria.
Akinkunmi Paul Okekunle, Department of Epidemiology and Medical Statistics, College of Medicine, University of Ibadan, Ibadan, Nigeria; Department of Food and Nutrition, College of Human Ecology, Seoul National University, Seoul, South Korea.
Osahon J Asowata, Department of Epidemiology and Medical Statistics, College of Medicine, University of Ibadan, Ibadan, Nigeria.
Benedict Calys-Tagoe, Department of Medicine, University of Ghana Medical School, Accra, Ghana.
Ezinne O Uvere, Department of Medicine, University of Ibadan, Ibadan, Nigeria.
Taofeek Sanni, Federal Teaching Hospital, Ido-Ekiti Ado-Ekiti, Nigeria.
Samuel Olowookere, Department of Medicine, Obafemi Awolowo University Teaching Hospital, Ile-Ife, Nigeria.
Philip Ibinaiye, Department of Medicine, Ahmadu Bello University, Zaria, Nigeria.
Joshua O Akinyemi, Department of Epidemiology and Medical Statistics, College of Medicine, University of Ibadan, Ibadan, Nigeria.
Oyedunni Arulogun, College of Medicine, University of Ibadan, Ibadan, Nigeria.
Carolyn Jenkins, Medical University of South Carolina, Charleston, SC, USA.
Daniel T Lackland, Medical University of South Carolina, Charleston, SC, USA.
Hemant K Tiwari, University of Alabama at Birmingham, Birmingham, AL, USA.
Suleiman Y Isah, Department of Medicine, Aminu Kano Teaching Hospital, Kano, Nigeria.
Sani A Abubakar, Department of Medicine, Ahmadu Bello University, Zaria, Nigeria.
Adebayo Oladimeji, University College Hospital, Ibadan, Nigeria.
Philip Adebayo, Aga Khan University, Dar es Salaam, Tanzania.
Josephine Akpalu, Department of Medicine, University of Ghana Medical School, Accra, Ghana.
Ugochukwu Onyeonoro, Jos University Teaching Hospital, Jos, Nigeri.
James A Ogunmodede, Department of Medicine, University of Ilorin Teaching Hospital, Ilorin, Nigeria.
Cynthia Akisanya, Federal Medical Centre, Abeokuta, Nigeria.
Yaw Mensah, Korle Bu Teaching Hospital, Accra, Ghana.
Olalekan I Oyinloye, Department of Medicine, University of Ilorin Teaching Hospital, Ilorin, Nigeria.
Lambert Appiah, Komfo Anokye Teaching Hospital, Kumasi, Ghana.
Atinuke M Agunloye, Department of Radiology, University of Ibadan, Ibadan, Nigeria; College of Medicine, University of Ibadan, Ibadan, Nigeria.
Godwin O Osaigbovo, Jos University Teaching Hospital, Jos, Nigeri.
Abiodun M Adeoye, Department of Medicine, University of Ibadan, Ibadan, Nigeria; University College Hospital, Ibadan, Nigeria.
Osimhiarherhuo Ohifemen Adeleye, Federal Medical Centre, Abeokuta, Nigeria.
Ruth Y Laryea, Department of Medicine, University of Ghana Medical School, Accra, Ghana.
Taiwo Olunuga, Federal Medical Centre, Abeokuta, Nigeria.
Okechukwu S Ogah, Department of Medicine, University of Ibadan, Ibadan, Nigeria.
Wisdom Oguike, Department of Medicine, Ahmadu Bello University, Zaria, Nigeria.
Mayowa Ogunronbi, Federal Medical Centre, Abeokuta, Nigeria.
Wasiu Adeniyi, Federal Medical Centre, Abeokuta, Nigeria.
Obiabo Y Olugbo, Delta State University/Delta State University Teaching Hospital, Oghara, Nigeria.
Abiodun H Bello, Department of Medicine, University of Ilorin Teaching Hospital, Ilorin, Nigeria.
Luqman Ogunjimi, Department of Pharmacology and Therapeutics, Olabisi Onabanjo University, Abeokuta, Nigeria.
Samuel Diala, Department of Medicine, University of Ibadan, Ibadan, Nigeria.
Hamisu A Dambatta, Department of Medicine, Aminu Kano Teaching Hospital, Kano, Nigeria.
Arti Singh, Department of Medicine, Kwame Nkrumah University of Science and Technology, Kumasi, Ghana.
Sheila Adamu, Komfo Anokye Teaching Hospital, Kumasi, Ghana.
Vida Obese, Komfo Anokye Teaching Hospital, Kumasi, Ghana.
Nathaniel Adusei, Department of Medicine, Kwame Nkrumah University of Science and Technology, Kumasi, Ghana.
Dorcas Owusu, Department of Medicine, Kwame Nkrumah University of Science and Technology, Kumasi, Ghana.
Michael Ampofo, Komfo Anokye Teaching Hospital, Kumasi, Ghana.
Raelle Tagge, Department of Epidemiology and Medical Statistics, College of Medicine, University of Ibadan, Ibadan, Nigeria.
Bimbo Fawale, Department of Medicine, Obafemi Awolowo University Teaching Hospital, Ile-Ife, Nigeria.
Joseph Yaria, Department of Medicine, University of Ibadan, Ibadan, Nigeria.
Rufus O Akinyemi, University College Hospital, Ibadan, Nigeria; Federal Medical Centre, Abeokuta, Nigeria; Center for Genomic and Precision Medicine, College of Medicine, University of Ibadan, Ibadan, Nigeria.
Mayowa O Owolabi, Department of Medicine, University of Ibadan, Ibadan, Nigeria; University College Hospital, Ibadan, Nigeria; Center for Genomic and Precision Medicine, College of Medicine, University of Ibadan, Ibadan, Nigeria; Lebanese American University, Beirut, Lebanon; Blossom Center for Neurorehabilitation, Ibadan, Nigeria.
Data sharing
Participant level de-identified data are available from the study’s Principal Investigator, MOO, and will be shared with investigators upon request via email to the corresponding author.
References
- 1.Owolabi MO, Akarolo-Anthony S, Akinyemi R, et al. The burden of stroke in Africa: a glance at the present and a glimpse into the future. Cardiovasc J S Afr 2015; 26 (suppl 1): S27–38. [DOI] [PMC free article] [PubMed] [Google Scholar]
- 2.Ezejimofor MC, Uthman OA, Maduka O, et al. Stroke survivors in Nigeria: a door-to-door prevalence survey from the Niger Delta region. J Neurol Sci 2017; 372: 262–69. [DOI] [PubMed] [Google Scholar]
- 3.Sarfo FS, Awuah DO, Nkyi C, Akassi J, Opare-Sem OK, Ovbiagele B. Recent patterns and predictors of neurological mortality among hospitalized patients in Central Ghana. J Neurol Sci 2016; 363: 217–24. [DOI] [PubMed] [Google Scholar]
- 4.Walker RW, Jusabani A, Aris E, et al. Post-stroke case fatality within an incident population in rural Tanzania. J Neurol Neurosurg Psychiatry 2011; 82: 1001–05. [DOI] [PubMed] [Google Scholar]
- 5.Feigin VL, Forouzanfar MH, Krishnamurthi R, et al. Global and regional burden of stroke during 1990–2010: findings from the Global Burden of Disease Study 2010. Lancet 2014; 383: 245–54. [DOI] [PMC free article] [PubMed] [Google Scholar]
- 6.Feigin VL, Krishnamurthi RV, Parmar P, et al. Update on the global burden of ischemic and hemorrhagic stroke in 1990–2013: the GBD 2013 study. Neuroepidemiology 2015; 45: 161–76. [DOI] [PMC free article] [PubMed] [Google Scholar]
- 7.Owolabi MO, Sarfo F, Akinyemi R, et al. Dominant modifiable risk factors for stroke in Ghana and Nigeria (SIREN): a case-control study. Lancet Glob Health 2018; 6: e436–46. [DOI] [PMC free article] [PubMed] [Google Scholar]
- 8.O’Donnell MJ, Chin SL, Rangarajan S, et al. Global and regional effects of potentially modifiable risk factors associated with acute stroke in 32 countries (INTERSTROKE): a case-control study. Lancet 2016; 388: 761–75. [DOI] [PubMed] [Google Scholar]
- 9.Owolabi MO, Thrift AG, Martins S, et al. The state of stroke services across the globe: report of World Stroke Organization–World Health Organization surveys. Int J Stroke 2021; 16: 889–901. [DOI] [PMC free article] [PubMed] [Google Scholar]
- 10.Akpalu A, Sarfo FS, Ovbiagele B, et al. Phenotyping stroke in sub-Saharan Africa: Stroke Investigative Research and Education Network (SIREN) phenomics protocol. Neuroepidemiology 2015; 45: 73–82. [DOI] [PMC free article] [PubMed] [Google Scholar]
- 11.Alberti KG, Zimmet PZ. Definition, diagnosis and classification of diabetes mellitus and its complications. Part 1: diagnosis and classification of diabetes mellitus provisional report of a WHO consultation. Diabet Med 1998; 15: 539–53. [DOI] [PubMed] [Google Scholar]
- 12.O’Donnell MJ, Chin SL, Rangarajan S, et al. Global and regional effects of potentially modifiable risk factors associated with acute stroke in 32 countries (INTERSTROKE): a case-control study. Lancet 2016; 388: 761–75. [DOI] [PubMed] [Google Scholar]
- 13.National Cholesterol Education Program (NCEP) Expert Panel on Detection, Evaluation, and Treatment of High Blood Cholesterol in Adults (Adult Treatment Panel III). Third report of the National Cholesterol Education Program (NCEP) Expert Panel on Detection, Evaluation, and Treatment of High Cholesterol in Adults (Adult Treatment Panel III) final report. Circulation 2002; 106: 3143–421. [PubMed] [Google Scholar]
- 14.WHO. Waist circumference and waist-hip ratio: report of a WHO expert consultation. Geneva: World Health Organization, 2008. http://www.who.int/nutrition/publications/obesity/WHO_report_waistcircumference_and_waisthip_ratio/en/ (accessed Dec 12, 2021). [Google Scholar]
- 15.Hedeker D. Multilevel models for ordinal and nominal variables. In: Leeuw J, Meijer E, eds. Handbook of multilevel analysis. New York, NY: Springer, 2008: 237–74. [Google Scholar]
- 16.Hayes AF. A Primer on multilevel modelling. Hum Commun Res 2006; 32: 385–410. [Google Scholar]
- 17.Ayehu GW, Yitbarek GY, Jemere T, et al. Case fatality rate and its determinants among admitted stroke patients in public referral hospitals, Northwest, Ethiopia: a prospective cohort study. PLoS One 2022; 17: e0273947. [DOI] [PMC free article] [PubMed] [Google Scholar]
- 18.Nkoke C, Lekoubou A, Balti E, Kengne AP. Stroke mortality and its determinants in a resource-limited setting: a prospective cohort study in Yaounde, Cameroon. J Neurol Sci 2015; 358: 113–17. [DOI] [PubMed] [Google Scholar]
- 19.Adoukonou T, Kossi O, Fotso Mefo P, et al. Stroke case fatality in sub-Saharan Africa: Systematic review and meta-analysis. Int J Stroke 2021; 16: 902–16. [DOI] [PubMed] [Google Scholar]
- 20.Zhang R, Wang Y, Fang J, Yu M, Wang Y, Liu G. Worldwide 1-month case fatality of ischemic stroke and the temporal trend. Stroke Vasc Neurol 2020; 5: e000371. [DOI] [PMC free article] [PubMed] [Google Scholar]
- 21.Krishnamurthi RV, Moran AE, Forouzanfar MH, et al. The global burden of hemorrhagic stroke: a summary of findings from the GBD 2010 study. Glob Heart 2014; 9: 101–06. [DOI] [PubMed] [Google Scholar]
- 22.Langhorne P, O’Donnell MJ, Chin SL, et al. Practice patterns and outcomes after stroke across countries at different economic levels (INTERSTROKE): an international observational study. Lancet 2018; 391: 2019–27. [DOI] [PubMed] [Google Scholar]
- 23.Hu D, Huang J, Wang Y, Zhang D, Qu Y. Fruits and vegetables consumption and risk of stroke: a meta-analysis of prospective cohort studies. Stroke 2014; 45: 1613–19. [DOI] [PubMed] [Google Scholar]
- 24.Sauvaget C, Nagano J, Allen N, Kodama K. Vegetable and fruit intake and stroke mortality in the Hiroshima/Nagasaki Life Span Study. Stroke 2003; 34: 2355–60. [DOI] [PubMed] [Google Scholar]
- 25.Leonardi-Bee J, Bath PM, Phillips SJ, Sandercock PA. Blood pressure and clinical outcomes in the International Stroke Trial. Stroke 2002; 33: 1315–20. [DOI] [PubMed] [Google Scholar]
- 26.Fonarow GC, Saver JL, Smith EE, et al. Relationship of National Institutes of Health Stroke Scale to 30-day mortality in Medicare beneficiaries with acute ischemic stroke. J Am Heart Assoc 2012; 1: 42–50. [DOI] [PMC free article] [PubMed] [Google Scholar]
- 27.Cheung RT, Zou LY. Use of the original, modified, or new intracerebral hemorrhage score to predict mortality and morbidity after intracerebral hemorrhage. Stroke 2003; 34: 1717–22. [DOI] [PubMed] [Google Scholar]
- 28.Prust ML, Saylor D, Zimba S, et al. Inpatient management of acute stroke of unknown type in resource-limited settings. Stroke 2022; 53: e108–17. [DOI] [PMC free article] [PubMed] [Google Scholar]
- 29.Akinyemi RO, Ovbiagele B, Adeniji OA, et al. Stroke in Africa: profile, progress, prospects and priorities. Nat Rev Neurol 2021; 17: 634–56. [DOI] [PMC free article] [PubMed] [Google Scholar]
- 30.Akinyemi R, Sarfo F, Abd-Allah F, et al. Conceptual framework for establishing the African Stroke Organization. Int J Stroke 2021; 16: 93–99. [DOI] [PMC free article] [PubMed] [Google Scholar]
Associated Data
This section collects any data citations, data availability statements, or supplementary materials included in this article.
Supplementary Materials
Data Availability Statement
Participant level de-identified data are available from the study’s Principal Investigator, MOO, and will be shared with investigators upon request via email to the corresponding author.