

Abstract
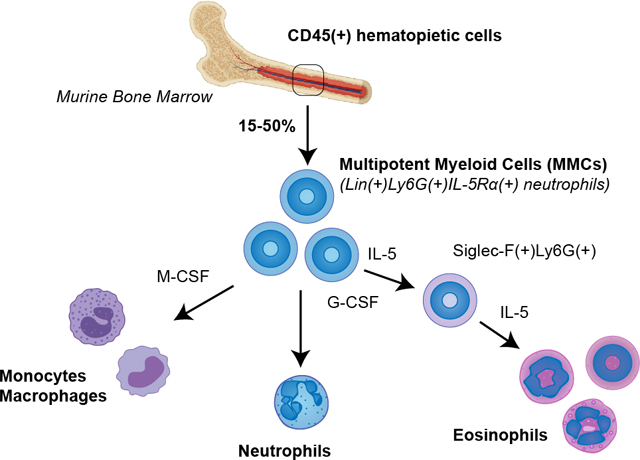
Bone marrow is a hematopoietic site harboring multiple populations of myeloid cells in different stages of differentiation. Murine bone marrow eosinophils are traditionally identified by Siglec-F(+) staining using flow cytometry, while neutrophils are characterized by Ly6G(+) expression. However, using flow cytometry to characterize bone marrow hematopoietic cells in wild type mice, we found substantial gray areas in identification of these cells. Siglec-F(+) mature eosinophil population constituted only a minority of bone marrow Lin(+)CD45(+) pool (5%). A substantial population of Siglec-F(−) cells was double positive for neutrophil marker Ly6G and eosinophil lineage marker, IL-5Rα. This granulocyte population with mixed neutrophil and eosinophil characteristics is typically attributable to neutrophil pool based on neutral granule staining and expression of Ly6G and myeloid peroxidase. It is distinct from Lineage(−) myeloid progenitors or Siglec-F(+)Ly6G(+) maturing eosinophil precursors, and can be accurately identified by Lineage(+) staining and positive expression of markers IL-5Rα and Ly6G. At 15–50% of all CD45(+) hematopoietic cells in adult mice (percentage varies by sex and age), this is a surprisingly dominant population, which increases with age in both male and female mice. RNA-seq characterization of these cells revealed a complex immune profile and the capacity to secrete constituents of the extracellular matrix. When sorted from bone marrow, these resident cells had neutrophilic phenotype but readily acquired all characteristics of eosinophils when cultured with G-CSF or IL-5, including expression of Siglec-F and granular proteins (Epx, Mbp). Surprisingly, these cells were also able to differentiate into Ly6C(+) monocytes when cultured with M-CSF. Herein described is the discovery of an unexpected hematopietic flexibility of a dominant population of multipotent myeloid cells, typically categorized as neutrophils, but with the previously unknown plasticity to contribute to mature pools of eosinophils and monocytes.
Keywords: bone marrow, neutrophils, eosinophils, monocytes, macrophages, flow cytometry, transcription factors, hematopoiesis, heterogeneity, plasticity, homeostasis
Graphical Abstract
INTRODUCTION
Effector leukocytes are thought to develop and mature in the bone marrow as distinct lineages. During inflammation, terminally differentiated granulocytes and other myeloid cells are released into the vasculature where they can be recruited into a target tissue by a variety of mediators. Recently, new evidence came to light that there are heterogeneous populations of granulocytes with substantial potential for functional and phenotypic plasticity [1–4]. For instance, functionally distinct populations of eosinophils regulate glucose homeostasis in adipose tissue [5], assist in thymocyte development in the thymus [6] and play morphogenetic roles in the mammary gland, uterus, and lung [7–9]. These cells may also have a role within the marrow itself, as eosinophils were shown to maintain bone marrow plasma cells in homeostasis [10]. The identification and characterization of such heterogeneous granulocyte populations from tissues typically requires flow cytometry-assisted sorting approaches and the use of well-established markers. Siglec-F is one of the key markers widely used for identifying murine eosinophils [3, 11]. Accordingly, the bone marrow resident eosinophil population is currently described as Siglec-F(+) and constitutes about 5% of CD45(+) cells [12, 13]. As a collateral observation in studying heterogeneity of eosinophils in wild type naïve mouse bone marrow, we found a substantial population of cells negative for Siglec-F but positive for IL-5Rα, a marker suggestive of eosinophils. These cells also expressed Ly6G, a marker used in neutrophil identification. Previous studies have reported the presence of IL-5Ra on neutrophils and have shown that in the presence of IL-5, neutrophil activity is suppressed [14]. We further determined that this was a Lineage(+) population distinct from Lineage(−) EoPs (eosinophil progenitors) and Siglec-F(+)IL-5Rα(+) or previously reported Siglec-F(+)Ly6G(+) EoPre (eosinophil precursors). Sorting and RNA-seq characterization of these cells revealed a diverse immune profile with shared neutrophil and eosinophil characteristics and the capacity to secrete extracellular matrix. Puzzled by their complex profile, we sorted these neutrophil-like cells and performed tracking studies to examine their potential for plasticity in response to treatment with cytokines IL-5, G-CSF and M-CSF. We found that, in response to IL-5, these cells adopted a mature Siglec-F(+) eosinophil phenotype, red granular staining, and assumed functions typical for mature effector eosinophils. Furthermore, following stimulation with M-CSF, these same cells became Ly6C positive and developed monocytic/macrophage phenotype. Herein described is the discovery and characterization of an underappreciated ability of bone marrow Ly6G(+) IL-5Rα(+) neutrophil population to act as multipotent myeloid cells (which we will refer to as MMCs throughout the manuscript) by retaining plasticity to contribute to eosinophil and monocyte lineages.
MATERIALS AND METHODS
Mice
All experiments were performed with wild type BALBc/J mice (Jackson Labs, Bar Harbor, ME) or genetically modified mice housed in barrier conditions. NJ1638 (IL-5 transgenic) and iPHIL (inducible eosinophil-deficient) mice were a kind gift of Dr. James Lee (Mayo Clinic Arizona, AZ). Mice of both sexes were examined and further sub-categorized based on age cutoffs: 1 month (young, pre-puberty), 3 months (adult, post-puberty) and >8 months (aged). ΔdblGATA (C.129S1(B6)-Gata1tm6Sho/J) mice were purchased from the Jackson Laboratory. Transgenic UBI-GFP mice (Jackson Laboratory) were used to perform lineage tracing studies.
In vivo asthma model
Mice were sensitized by intraperitoneal injections (200 μl) of 50 μg OVA grade V (Sigma-Aldrich) in aluminum potassium sulfate (alum) saline solution (Sigma-Aldrich) on days 0 and 7. Following sensitization, 50 μl of OVA grade VI (1mg/ml) was administered by intranasal inhalation on days 15, 17, and 19. On day 20, mouse lungs and bone marrow were harvested for flow cytometric analysis.
Flow cytometry
Whole bone marrow was harvested from femur and tibia bones and filtered into a single cell suspension using an 80 micron nylon mesh (Component Supply Company, Sparta, TN). Cell concentration and viability was determined using Countess II system (ThermoFisher). Three million cells were used for all downstream flow cytometry staining applications. Cells were first incubated in 500 μL 1x PBS containing 0.25 uL of Zombie Live/Dead dye (Biolegend, San Diego, CA) in the dark at room temperature for 20 minutes. Following wash with 1mL of 1x PBS, cells were centrifuged and resuspended in 0.75μL/50μL of mouse FC block (BD Pharmingen, San Jose, CA) and incubated at 4ºC for 15 minutes. Antibody cocktail was added directly to blocked samples and incubated for 30 minutes at 4ºC. All centrifugation steps were carried out at 300g for 5 minutes in a swing bucket centrifuge. The following panel of antibodies and dyes were used to characterize resident bone marrow eosinophils: (1) Zombie Live/Dead Fixable Viability Dye (Biolegend/Aqua/0.25 μL); (2) CD45 (clone 30-F11/BD Biosciences/PE/0.3 μL); (3) Siglec-F (clone E50–2440/BD Biosciences/APC-Cy7/1 μL); (4) Ly6G (clone 1A8/Biolegend/Alexa Fluor 700/0.2 μL); (5) CD125 (IL-5Rα) (clone T21/BD Biosciences/Alexa Fluor 488/0.5 μL). To confirm detection of IL-5Rα, we performed additional IL-5Rα antibody staining (clone REA343/Miltenyi Biotec/PE/5 μL); (6) Lineage antibody mix (CD11b [clone M1/70], Ter119 [clone TER119], CD3 [clone 17A2], CD4 [clone RM4–5], CD8a [clone 53–6.7], CD19 [clone 6D5], B220 [clone RA3–6B2]) (Biolegend/PerCP-Cy5.5/0.3 μL each); (7) Ly6C (clone HK1.4/eBiosciences/eFluor450.0.1 μL). Cells were then fixed with 2% paraformaldehyde in 1xPBS and stored at 4ºC until acquisition. Samples were acquired on a BD LSRII flow cytometer (BD Biosciences). Bead compensation (OneComp;eBioscience, San Diego, CA, and ArC; Molecular Probe beads, Eugene, OR), gating, and data analysis were performed using FlowJo v.10 (TreeStar, Inc, Ashland, OR).
Cell sorting
The FACS sorting cocktail panel of antibodies and dyes were: (1) Zombie Live/Dead Fixable Viability Dye (Biolegend/Aqua/0.25 μL); (2) CD45 (clone 30-F11/BD Biosciences/PE/0.3 μL); (3) CD11c (clone N418/Biolegend/PE-Cy7/0.1 μL); (4) Siglec-F (clone E50–2440/BD Biosciences/Alexa Fluor 647/0.1 μL); (5) Ly6G (clone 1A8/Biolegend/Alexa Fluor 700/0.2 μL). CD125 (IL-5Rα) antibody was excluded to prevent any potential blocking of the receptor. Stained cells were resuspended in 300uL of media before sorting. Samples were sorted on a BD FacsAria III (BD Biosciences) into complete media with a typical yield of 3×10⁵ cells per 3×10⁶ stained. Sorted cells were either cultured, used for cytospin imaging, or lysed in RLT buffer (Qiagen) for immediate RNA extraction. Cells were also sorted using EasySep Mouse Neutrophil Enrichment Kit (Stemcell Technologies), EasySep Mouse PE positive selection kit II in conjunction with PE conjugated anti-murine Ly6G antibody (clone 1A8/Biolegend/PE/0.2 μL) and EasySep Magnet (Stemcell Technologies) in order to obtain a greater number of Ly6G(+) cells for longer cell cultures. EasySep sorting was performed according the manufacturer’s instructions.
Cytospin preparation and assessment of eosinophil morphology
Between 25,000 and 50,000 sorted cells were stained with initial fixation/staining in Wright Geimsa solution (EMD Millipore, Burlington, MA) for 2 minutes, incubated in Eosin Xanthene dye for 3 minutes, and dipped twice in Hematoxylin/Blue/Azure (Electron Microscopy Science). Nuclear morphology and eosin granule staining were visualized on a Nikon DS-Ri2 camera microscope (Nikon, Melville, NY) using a 100x objective.
Eosinophil culture
Conventional bone marrow derived eosinophils (mcEos) were cultured for 4 days in SCF and FLT3 (100 ng/ml each) followed by IL-5 (10 ng/ml) until day 14 according to the established murine bone marrow culture protocol [15]. The cytokine treatment timeline and stages of eosinophil development in this culture are also described in the study by Doan et al. [16]. For FACS-sorted eosinophil culture targeted for RNA-seq analysis, cells were sorted directly into complete media and 50,000–100,000 cells were plated onto a 48-well tissue culture plate in 1 ml of media per well per sample. Sorted MMC cultures included a control group, in which cells were plated in media, and an IL-5 treatment group, in which cells were treated with 10 ng/ml of recombinant IL-5 (Peprotech 200–05). Cells were left in treatment overnight and RNA was subsequently extracted. For flow cytometry and protein level analysis, cells sorted using EasySep were plated at 0.5–1 million cells per well in 1 ml of media onto a 24 well plate. Cells were treated with 50 ng/ml of recombinant IL-5 for the first 3 days of culture. Following this, another 10 ng/ml of IL-5 was added without changing media and cultured until day 6. Cells were then prepared for flow cytometry or lysed for Western Blot analysis using RIPA buffer (Sigma) with added protease inhibitors (Cell Signaling Technology). For the specific tracing of MMC cells in ex vivo bone marrow stromal cultures, Ly6G(+)IL-5Ra(+) cells were sorted from UBI-GFP (fluorescent reporter) murine bone marrow. Simultaneously, bone marrow cell suspensions were prepared from age and sex matched wild type mice. MMCs positive for GFP were transferred to the corresponding wild type marrow homogenates. Cells were plated in 6 well plates at 3 million wild type homogenate cells with 800,000 GFP(+) sorted cells per well. These cultures were treated with either recombinant IL-5, G-CSF, or M-CSF (all from Peprotech) at 50 ng/ml for 3 days, at which point another 10 ng/ml was given without media change, and GFP(+) cells analyzed by flow cytometry at various time points. To examine cell population changes in cultures with inducible eosinophil depletion, we cultured bone marrow suspensions from 4 month old female iPHIL mice. We tested 3 conditions in iPHIL cultures: 1) 10 ng/ml IL-5; 2) 5 ng/ml of diphtheria toxin (Sigma-Aldrich D0564), which induces eosinophil depletion; and 3) IL-5 plus diphtheria toxin. These cultures were analyzed by flow cytometry on day 3, which allows for mixed detection of precursors and maturing eosinophils.
Western blots
Cell lysates from eosinophil cultures were quantified using a BCA assay and protein loading was normalized across samples. A semi-dry western blot was resolved using 4–12% Tris-Glycine gel and transferred onto 0.45 μm PVDF membranes following 100% methanol activation. The membrane was subsequently blocked using 5% non-fat milk in Tris-Buffered Saline with Tween (TBST) for 1 hour at room temperature. Antibodies were diluted in 5% non-fat milk in TBST and left to incubate overnight at 4ºC. The membranes were probed for EPX (Invitrogen, PA5–42062), MPO (Cell Signaling, 14569S), and β-actin (Cell Signaling Technology, 3700S). Secondary antibodies were from Li-Cor Technologies (IRDye 800CW, 926–32210; IRDye 680LT, 926–68021). Membranes were imaged using the Li-Cor Odyssey CLx system.
RNA extraction
Cells were lysed with RLT Buffer from Qiagen RNeasy Plus Mini kit (Qiagen). Cell lysates were stored at −80°C until RNA was extracted. RNA extraction was performed using Qiagen RNeasy mini kit (Qiagen) according to the manufacturer’s protocol. Quality RNA was able to be obtained from between 300,000 to 1,000,000 cells using this method. For samples with fewer than 300,000 cells, RNA was extracted using the Arcturus PicoPure RNA Isolation Kit (ThermoFisher 12204–01) according to manufacturer’s protocol, including the optional RNase Free DNase treatment (Qiagen 79254) for removal of genomic DNA. RNA quality and quantity were measured using Agilent 4200 Tapestation using high Sensitivity RNA ScreenTape System (Agilent Technologies). Only preparations with RIN > 7 were used for subsequent RNA-seq.
RNA-seq sequencing and statistical analysis
SMART-Seq v4 Ultra Low Input RNA Kit (Takara Bio USA, Inc) was used for full-length cDNA synthesis and Nextera XT DNA sample preparation kit (Illumina Inc) was used for library preparation. DNA libraries were sequenced on an Illumina NextSeq 500 instrument (Illumina Inc) with a target read depth of approximate 40–50 million aligned reads per sample with 85–90% mapping efficiency. The pool was denatured and diluted, resulting in a 2.5 pM DNA solution. PhiX control was spiked at 1% and the pool was sequenced by 1×75 cycles using NextSeq 500 High Output v3 reagent kit (Illumina Inc). The resulting FASTQ files were mapped against murine mm10 genome using STAR alignment software. Counts for each sample aligned were generated using htSeq-counts. The counts generated were then analyzed using DeSeq2. Samples were normalized across comparisons and all gene reads were organized according to significance by FDR-adjusted p-values and fold change in normalized counts. Volcano plots were plotted using R. Genes were plotted according to log2fold changes and negative logarithmic value of the corresponding adjusted p values. To generate heatmaps, the normalized counts generated by DeSeq2 were standardized according to their respective means and standard deviations. Heatmaps were then generated using the R package pheatmap. For flow cytometry data, either ANOVA followed by Tukey post hoc pairwise comparisons or two-way ANOVA (to assess sexual dimorphism) were used to address statistical differences between groups (SYSTAT 11, Systat Software, Inc, San Jose, CA). Alpha level used for significance cutoffs was 0.05. All data are presented as the means ± SEM.
RESULTS AND DISCUSSION
Bone marrow resident eosinophils are conventionally described as Siglec-F(+) cells [3, 12, 13] and only make up a small minority of the total CD45(+) cells while the majority of cells, up to 50%, are Ly6G(+) cells with neutrophilic phenotype. This study was driven by the finding that in naïve wild type mice, nearly all Siglec-F(−)Ly6G(+) cells express IL-5Rα receptor (Figure 1A). Cell surface expression of this marker was confirmed by staining with two different clones of IL-5Rα antibody (Supplementary Figure 1). Further examination of these Ly6G(+)IL-5Rα(+) cells determined that they were also Lineage(+), precluding the possibility that these cells are earlier progenitors (Figure 1A). Although such phenotypes were previously categorized as neutrophils despite their IL5-Rα positive staining [14], we aimed to explore whether IL-5 receptor expression was indicative of a potential to promote differentiation into eosinophilic phenotype. When sorted, Siglec-F(+) bone marrow eosinophils (Eos) exhibit distinct granularity and red staining characteristic of mature eosinophils, while Ly6G(+)IL-5Rα(+) cells lack distinct staining but exhibit “donut-like” nuclear morphology typical to both murine neutrophils and eosinophils (Figure 1B). For the remainder of this article, we shall continue to refer to this Siglec-F(−) cell population as MMCs (“multipotent myeloid cells”) to reflect their inherent myeloid lineage plasticity and Siglec-F(+) population within the bone marrow as Eos (“mature eosinophils”). For clarity, mature Siglec-F(+) eosinophils derived from conventional SCF/Flt-3+IL-5 bone marrow 14 day cultures shall be abbreviated as mcEos (“mature cultured eosinophils”) and eosinophils derived from MMCs as Neos. We found that Eos constitute ~3–5% of all CD45(+) cells in the bone marrow, which is in agreement with previous reports describing Siglec-F(+) bone marrow eosinophils [3]. In contrast, MMCs comprised 20–50% of the total hematopoietic compartment, representing nearly half of all hematopoietic cells in the bone marrow of aged mice (Figure 1C). The hematopoietic compartment of bone marrow favors myeloid over lymphoid development in aging mice and humans [17]. Therefore, MMCs may contribute significantly to granulocyte compartment expansion in aging. Noteworthy, these cells exhibited significant sexual dimorphism (Figure 1D). Before puberty (5–6 weeks of age in mice), the population of these cells was significantly greater in females. After puberty, it was the opposite, and there was no significant difference in MMCs between males and females in aged mice. Given the major life-long representation of this population (15–50% out of CD45(+) cells) in homeostasis compared to the significantly less numerous mature bone marrow Eos (5%) and blood (1%) eosinophils, it appears that these cells may act as precursors to contribute to mature eosinophil and monocyte pools. It is important to clarify that IL-5Rα(+) MMCs are completely distinct from previously described EoPs (eosinophil progenitors), which are Lineage(−)CD34(+)CD117(+)IL-5Rα(+) and constitute only a very minor population in homeostatic murine whole bone marrow (0.05% of Lineage(−)CD34(+) progenitors) [18]. They are also distinct from Siglec-F(+)Ly6G(+) eosinophil precursors.
Figure 1. Siglec-F(−) multipotent myeloid cell (MMC) and Siglec-F(+) eosinophil (Eos) populations in normal murine bone marrow.

A. Flow schematic (top to bottom) for gating MMCs from homeostatic adult murine bone marrow. Population is characterized by Lineage(+)SiglecF(−)Ly6G(+)Il5-Rα(+) marker expression (~40% of CD45(+) cells) in contrast to mature eosinophil (Eos) phenotype that is distinctly SiglecF(+) (~5% of CD45+ cells). B. Cytospin preparations of FACS-sorted Siglec-F(+) Eos and Siglec-F(−) MMCs. Eos contain distinct red-staining granules while MMCs are neutral-staining. Nuclear morphology between both populations is similar in its “donut-shape” appearance; however, MMCs have less segmented, denser nuclei. C. Population of MMCs (bordered-colored columns) is substantially larger than Eos (solid-colored columns) regardless of age or sex of mice. D. Sexual dimorphism in MMCs in different age groups. Population of MMCs is significantly larger in young females than similarly aged males but sex differences switched after puberty. There is no sexual dimorphism in MMCs in aged mice. ****, p < 0.0001 by two-way ANOVA.
We further resolved that these cells do not survive in conventional 14 day bone marrow-derived eosinophil cultures. Following the eosinophil culture protocol by Dyer et al. [15], we cultured bone marrow cell suspensions in 100 ng/ml stem cell factor (SCF)/Flt-3 for 4 days followed by 10 ng/ml of IL-5 until day 14 of culture, which typically yields >90% pure Siglec-F(+) eosinophils. Ly6G(+)IL-5Rα(+) MMCs immediately declined in these culture conditions and were absent by day 5 when newly expanded progenitors began to commit to the eosinophil lineage (Figure 2B). A brief re-emergence of this phenotype coincided with the maturation of de novo differentiated eosinophils (days 7–10 of culture). In part, this could be due to downregulation of IL-5 receptor after IL-5 treatment of culture, which is reflected in higher percentage of Ly6G(+) only stained cells (Fig. 2B). Interestingly, from day 10 of culture Ly6G(+) and Ly6G(+)Siglec-F(+) kinetics coincide, which may indicate gradual trans-differentiation of Ly6G(+) cells to eosinophils.
Figure 2. MMCs exhibit a diverse transcriptional profile and may change phenotype in bone marrow-derived cultures.

A. Flow schematic (left to right) used for FACS-sorting MMCs from wild type murine bone marrow. B. MMCs do not persist in conventional bone marrow eosinophil cultures but may adopt different phenotypes. Day 0–4 of culture: SCF+Flt3-Ligand treatment only, day 5–14: IL-5 treatment only. Total Ly6G (+) cells shown by blue line, while Ly6G(+)Siglec-F(+) shown by orange line. De novo commitment and differentiation of cultured bone marrow eosinophils (mcEos, black line) begins on day 5 with typical peak of IL-5Rα expression on day 7 and peak Siglec-F expression after day 12. Representative bone marrow culture shown. N=2–3 replicates/culture time point. N=5 experiments. C. Volcano plot of RNA-seq analysis for differential gene expression between mcEos and sorted MMCs. 8515 differentially expressed genes were found at padj < 0.05 (red dots denote significant genes). D. Profiling mcEos vs. MMC gene expression signatures in four biological function categories: cellular receptors, inflammatory mediators, ECM proteins, and CD molecules. Bar graphs compare the Log2 conversion of normalized counts of sorted mcEos (black) vs. sorted MMcs (red). For each panel, blue dashed line separates groupings of genes that represent gene signatures upregulated in MMCs (left) from signatures that are upregulated in mcEos (right). Note a greater number of genes and functional diversity of MMC profile. N=4 replicates/group. All black vs. red comparisons in all panels are significant at padj < 0.05 by FDR differential gene expression analysis, adjusting for multiple comparisons.
To further characterize these cells, we FACS-sorted MMCs from the bone marrow of normal adult mice and compared their gene expression by RNA-seq against mcEos, Siglec-F(+) eosinophils derived and sorted from 14 day bone marrow cultures (sorting gating strategy for Ly6G(+)IL-5Rα(+) cells is shown in Figure 2A). At padj<0.05, 8515 genes were differentially expressed between MMCs and mcEos (Figure 2C). To elucidate the biology of MMCs in contrast to culture-differentiated mcEos, we selected and graphed all differentially expressed genes representing: cellular receptors, inflammatory mediators (cytokines, chemokines and growth factors), CD molecules, and extracellular matrix proteins (Figure 2D). In comparison to mcEos, MMCs expressed a significantly greater number of cytokine and chemokine receptors as well as inflammatory and remodeling mediators (Figure 2D). Among them, these cells highly differentially expressed chemokine receptors Ccr2 (receptor for CCL2), Csf3r (G-CSF receptor), Cxcr1 (IL-8 receptor) and receptors for cytokines IL-2, IL-6, and IL-18, while mcEos expressed Ccr3 (Eotaxin-1 receptor), Il1rl1 (IL-33 receptor) and receptors for IL-12 and IL-27. Among CD molecules, MMCs almost exclusively expressed Cd22 (SIGLEC2, I-type lectin), Cd40 (costimulatory molecule), and Cd72 (C-type lectin). Compared to mcEos, MMCs significantly differentially expressed cytokines IL-1β, IL-15, and IL-18, chemokines Ccl2, Ccl4, Cxcl2, Cxcl9, and Cxcl12, as well as mediators of remodeling Igf1, Igfbp5 (insulin-like growth factor 1 family), and Osm (Oncostatin M). On the contrary, SIglec-F(+) mcEos expressed cytokines IL-1α, IL-4, IL-6, and IL-13, and chemokines Ccl6 and Ccl22. Interestingly, MMCs specifically expressed a significant number of extracellular matrix genes, including fibronectin, thrombospondins 1 and 4, tenascin-C, decorin, and number of collagens. Based on these profiles, it appears that unlike mcEos (whose gene signature aligns with Type 2 inflammatory response), MMCs may play critical and diverse roles in a number of immune and tissue homeostatic maintenance biological processes. Such a flexible immune repertoire shows that despite their precursor phenotype, these cells may have effector functions. This is supported by studies demonstrating that hematopoietic progenitor cells have potent effector functions during inflammation, for example, see work by Allakhverdi et al. [19]. Their expression of a large number of ECM molecules also suggests roles in bone marrow stromal tissue maintenance in homeostasis. Given such a number of potential effector functions, multipotent nature of MMCs may represent a great advantage in rapidly adapting to changes in the microenvironment (for example, switching from homeostatic to inflammatory functions).
Neutrophils in mice are commonly identified by Ly6Ghigh signal, which is widely used as a conventional flow cytometry marker [20, 21]. Our RNA-seq characterization of Ly6G(+)IL-5Rα(+) cells showed that they express markers characteristic for neutrophils (for example, G-CSF and IL-8 receptors). However, their expression of IL-5Rα, other myeloid markers and general appearance of “band stage” (precursor) neutrophils prompted us to test the hypothesis that MMCs are not locked in neutrophil phenotype and retain the flexibility to develop into eosinophils and potentially other myeloid cells. In order to trace the potential development of MMCs specifically, we sorted these cells from bone marrow of UBI-GFP fluorescent reporter mice and transferred them to bone marrow suspensions from wild type mice, which were further treated with IL-5 and monitored by flow cytometry. This allowed us to determine whether Siglec-F(+) Neos (neutrophil-derived eosinophils) were derived directly from MMCs or differentiated de novo from hematopoietic stem cells in bone marrow suspensions. Tracking GFP(+) MMCs, we observed a highly significant upregulation of Siglec-F (mature eosinophil marker) by these cells after 3 days (and increasing by day 5) of IL-5 culture (Figure 3A). Moreover, cytospin preparations of these cells demonstrated that Neos developed the granularity and red staining typical for mature eosinophils (Figure 3A). Additionally, we FACS-sorted MMCs directly from wild type adult bone marrow and cultured 100% pure MMC isolates in 50 ng/ml of IL-5 for 24 hours. RNA-seq analysis of MMCs treated with IL-5 showed that IL-5 readily fulfilled the eosinophil maturation program of these cells, evidenced by the significant upregulation of conventional markers of mature eosinophils: Epx (eosinophil peroxidase), Prg2 (major basic protein), Siglec-F (eosinophil marker), and Ccr3 (eotaxin receptor) (Figure 3B). Furthermore, we profiled genes belonging to the biological process “DNA-binding transcription factor activity” (GO: 0003700) to demonstrate changes in the transcriptional programs of MMCs triggered by exposure to IL-5 (Figure 3B). Among transcription factors of IL-5-induced Neos (MMCs converted to eosinophils), we identified Ikzf2 (Helios) and Stat5b, previously described as part of homeostatic eosinophil development [22, 23]. Additional results and markers from this RNA-seq analysis can be found in Supplementary Figure 2.
Figure 3. MMCs exhibit all characteristics of neutrophils but retain the ability to differentiate to eosinophils and monocytes.

A. Specific tracing of GFP(+) MMCs from UBI-GFP mice in wild type ex vivo bone marrow IL-5 cultures. N=3–4 replicates/mouse for tracing studies. The experiment was repeated in at least 3 independent donor mouse pairs. B. RNA-seq analysis of FACS-sorted MMCs vs. FACS-sorted MMCs that were treated overnight with 10 ng/ml IL-5. Most highly significantly upregulated genes in MMCs+IL-5 group represented canonical mature eosinophil gene signature (Epx, Prg2, Prg3, Ear1,2,6, Serpinb2, and Alox15), as indicated on volcano plot. Heatmap shows upregulation of eosinophil associated transcription factors such as IKZF2 and Stat5b. All comparisons are statistically significant at padj < 0.05, adjusting for multiple comparisons. C. Flow cytometry analysis of GFP(+) MMCs sorted from UBI-GFP mice and traced in ex vivo bone marrow cultured homogenates from wild type counterparts. Controls represent cultures without IL-5 stimulation. D. Western Blot analysis of MMCs sorted directly from wild type bone marrow (D0 Control), MMCs cultured for 5 days in IL-5, or MMCs cultured for an equal amount of time in G-CSF. Cytospin preparations on the right demonstrate morphology of resulting cells (DiffQuick Stain). E. Line charts show the differentiation of Neos (MMC-derived eosinophils) (Ly6G(−)Siglec-F(+)SSChgh/SSCint), Ly6G(+)Siglec-F(+) eosinophils, and monocytes (Ly6C(+)Ly6G(−)Siglec-F(−) from GFP-tracked MMCs cultured in IL-5, G-CSF and M-CSF, correspondingly. Flow cytometry contour plots show dominant phenotypes of differentiating cells at their peak days. Cytospins show their corresponding morphology. *, p < 0.05; ****, p < 0.0001 by ANOVA/Tukey analysis. All experiments were repeated 3–4 times.
Interestingly, further experimentation showed that IL-5 was not necessary for the differentiation of MMCs into an eosinophil phenotype. In our UBI-GFP tracing cultures, we found significant upregulation of Siglec-F on GFP(+) MMCs cultured in wild type bone marrow suspensions in the absence of IL-5 as soon as after 3 days of culture (“Control” treatment in Figure 3C). However, by day 5, IL-5 was necessary to promote the terminal maturation of Neos, evidenced by the more granular, high side scatter phenotype of Neos cultured with IL-5 compared to lower side scatter phenotype of control cells (Figure 3C). We further validated our findings at the protein level. Western Blot analysis of MMCs directly isolated from normal bone marrow demonstrated the constitutive presence of myeloperoxidase (MPO) and lack of eosinophil peroxidase (EPX), which is typical for neutrophils. However, the same cells acquired EPX and downregulated MPO after culture with IL-5 (Figure 3D). Interestingly, similarly to spontaneous acquisition of Siglec-F in absence of IL-5, culturing MMCs in G-CSF (as per neutrophil culture protocol) resulted in the upregulation of EPX and loss of MPO, although G-CSF promoted the distinct highly polymorphonuclear morphology typical for mature neutrophils (Figure 3D). These results support the conclusion that MMCs within bone marrow could be homeostatically driven by such factors as GM-CSF (known to be sufficient to promote eosinophil development), but also responsive to amplification signals by inflammatory cytokines such as IL-5.
Additionally, we examined changes in the MMC population in the lung and bone marrow during an inflammatory response in a standard ovalbumin murine asthma model (Supplementary Figure 3). We found that after three antigen challenges, there was a significant decrease in the MMC population in both the lung and bone marrow compartments. This may indicate that tissue MMCs within the lung are being replaced by recruited cells. Likewise, within the bone marrow, these cells could be leaving into circulation in response to the allergic stimulus. A more intriguing possibility is that these cells become locally activated within tissue microenvironment [16] and undergo complete maturation to different myeloid phenotypes. A dramatic reduction in the MMC bone marrow population in IL-5 transgenic mice (NJ1638), but with a proportional increase in mature Siglec-F(+) Eos, seems to further support this notion (Supplementary Figure 4). Further work is necessary to resolve the contribution of MMCs to homeostatic vs. inflammatory tissue processes.
Previous studies have demonstrated the potential for neutrophil plasticity, by showing that G-CSF mobilized band neutrophils can transdifferentiate into monocytes under inflammatory conditions [24]. Another study by Mack et al. [25] elegantly brought to attention gray areas in eosinophil and neutrophil lineage development, showing that Trib1 deletion in developing granulocytes results in cells with mixed neutrophilic and eosinophilic properties. In order to further probe plasticity potential of MMCs, we repeated our UBI-GFP reporter experiment by treating sorted MMCs with either IL-5, G-CSF or M-CSF recombinant cytokines (Figure 3E). By tracking GFP(+) MMCs, we showed that treatment with IL-5 resulted in 40–45% (out of all GFP cells) and another 15–20% being SSC(intermediate)Ly6G(−)Siglec-F(+) Neos by day 8 of culture (conversion to 55–65% of eosinophilic cells in total). Cytospin images confirmed this phenotype as eosinophilic by showing red eosin-positive staining of these cells. Interestingly, G-CSF treatment resulted in a sharp increase of Ly6G(+)Siglec-F(+) cells to approximately 40% out of all GFP positive cells by day 3, although was not sufficient to induce mature Neo phenotype. Cytospin images of these cells showed the familiar “donut-like” morphology associated with neutrophils but not the characteristic red staining associated with neutrophils. A recent study by Limkar et al. [26] showed that Ly6G expression of eosinophils associates with their development. Our study further suggests the possibility that these Siglec-F(+)Ly6G(+) eosinophils may have neutrophilic origins. Even more intriguingly, G-CSF promoted development of Ly6C(+) phenotype by day 8, while Ly6G(+)Siglec-F(+) cells gradually declined. When treated with M-CSF, MMCs assumed predominantly Ly6C(+)Ly6G(−)Siglec-F(−) monocytic phenotype (up to 40% of all GFP cells by day 5). Cytospins confirmed dominant presence of monocytes/macrophages in this culture. In summary, although typically described as neutrophils [14] given their expression of neutrophil markers and neutral staining, Ly6G(+)IL-5Rα(+) bone marrow MMCs maintain a degree of plasticity with the potential to transdifferentiate into eosinophils and monocytes/macrophages.
We found that in bone marrow of ΔdblGATA mice, there was a significant reduction of MMCs, in particular due to the downregulation of IL-5Rα (Supplementary Figure 5). GATA-1 and GATA-2 are promoters characteristic for eosinophil lineage development. Persistence of Ly6G(+) cells in ΔdblGATA mice suggests that MMCs are not within classically defined eosinophil lineage; however, GATA promoters may be necessary to sustain IL-5Rα expression on these cells. MMC population was present in control C57BL6 mice (Supplementary Figure 6). We further examined the development of MMCs in eosinophil bone marrow-derived cultures prepared from iPHIL mice, where eosinophil depletion is driven by diphtheria toxin (DT) expression under eosinophil peroxidase (EPO) promoter. MMCs were not affected by the DT treatment of eosinophil cultures from iPHIL mice (Supplementary Figure 5). On the contrary, DT treatment prevented the development of Siglec-F(+) mcEos in these cultures (Supplementary Figure 5). The EPO promoter is active only during the eosinophil granular formation checkpoint in maturing eosinophil precursors (PreEos), which further suggests that MMCs are not sensitive to strategies targeting eosinophil lineage.
In summary, our results demonstrate that substantial proportion of bone marrow myeloid cells are characterized by neutrophilic phenotype at baseline, but persist in a lineage-committed but flexible precursor state. At approximately 15–50% of all hematopoietic cells in normal bone marrow, such hematopoietic flexibility at the myeloid precursor level bears remarkable biological potential, as these cells may exhibit necessary and rapid functional plasticity at the forefront of tissue-specific or systemic inflammatory response.
Supplementary Material
Supplementary Figure 1. Additional IL-5Rα antibody staining (clone REA343/Miltenyi Biotec/PE/5 μL) to confirm detection of IL-5Rα. Both clones equally detect IL-5Rα expression on MMCs.
Supplementary Figure 2. Complete RNA-seq analysis from Fig. 3B. Heatmaps show hierarchical clustering of gene signatures of MMCs and MMCs+IL-5 associated with biological process “DNA-binding transcription factor activity” (GO: 0003700) (on the left) and “signaling receptor activity” (GO: 0038023) (on the right). Bar graphs show mRNA transcript levels of IL5-Rα and Ly6G for these cells with and without IL-5 treatment.
Supplementary Figure 4. MMC population dynamics in IL-5 transgenic mice. A. In vivo constitutive exposure to IL-5 in NJ1638 mice diminishes MMC population in bone marrow but proportionally increases Eos. On the right, cytospin differential staining preparations of wild type whole bone marrow and IL-5 transgenic NJ1638 whole bone marrow cell suspensions. Note that in comparison to wild type bone marrow, NJ1638 bone marrow contains predominantly mature eosinophils with distinct red granular staining. N=3–5 mice/group. ****, p < 0.0001 by ANOVA/Tukey analysis. B. IL-5 transgenic NJ1638 bone marrow culture continuously maintains high levels of Eos and diminished levels of MMCs. N=2 replicates/time point/group, 2 experimental repeats.
Supplementary Figure 3. Dynamics of MMC population in the lung and bone marrow in a mouse model of asthma.
Supplementary Figure 6. Baseline levels of MMCs in wild type C57BL/6 murine bone marrow.
Supplementary Figure 5. A. Flow cytometry analysis of MMC population in bone marrow of wild type and dblGATA mouse counterparts. B. Flow cytometry analysis of MMCs and Siglec-F(+) mcEos in bone marrow-derived IL-5 eosinophil cultures from iPHILs (diphtheria toxin-inducible eosinophil knockout mice). N=3–5 mice/group in mouse experiments. *, p < 0.05; ****, p < 0.0001 by ANOVA/Tukey analysis. All experiments were repeated 3–4 times
ACKNOWLEDGEMENTS
This work was supported by the National Institutes of Health (NIH/NIAID) grant R01AI127783 to Dr. Sergejs Berdnikovs. Additionally, this study was supported by the Ernest S. Bazley Foundation.
Footnotes
CONFLICTS OF INTEREST
The authors declare that they have no conflicts of interest.
REFERENCES
- 1.Lee JJ, Jacobsen EA, McGarry MP, Schleimer RP, Lee NA (2010) Eosinophils in health and disease: the LIAR hypothesis. Clin Exp Allergy 40, 563–75. [DOI] [PMC free article] [PubMed] [Google Scholar]
- 2.Percopo CM, Brenner TA, Ma M, Kraemer LS, Hakeem RM, Lee JJ, Rosenberg HF (2017) SiglecF+Gr1hi eosinophils are a distinct subpopulation within the lungs of allergen-challenged mice. J Leukoc Biol 101, 321–328. [DOI] [PMC free article] [PubMed] [Google Scholar]
- 3.Weller PF and Spencer LA (2017) Functions of tissue-resident eosinophils. Nat Rev Immunol 17, 746–760. [DOI] [PMC free article] [PubMed] [Google Scholar]
- 4.Abdala Valencia H, Loffredo LF, Misharin AV, Berdnikovs S. (2016) Phenotypic plasticity and targeting of Siglec-F(high) CD11c(low) eosinophils to the airway in a murine model of asthma. Allergy 71, 267–71. [DOI] [PubMed] [Google Scholar]
- 5.Wu D, Molofsky AB, Liang HE, Ricardo-Gonzalez RR, Jouihan HA, Bando JK, Chawla A, Locksley RM (2011) Eosinophils sustain adipose alternatively activated macrophages associated with glucose homeostasis. Science 332, 243–7. [DOI] [PMC free article] [PubMed] [Google Scholar]
- 6.Throsby M, Herbelin A, Pleau JM, Dardenne M. (2000) CD11c+ eosinophils in the murine thymus: developmental regulation and recruitment upon MHC class I-restricted thymocyte deletion. J Immunol 165, 1965–75. [DOI] [PubMed] [Google Scholar]
- 7.Vicetti Miguel RD, Quispe Calla NE, Dixon D, Foster RA, Gambotto A, Pavelko SD, Hall-Stoodley L, Cherpes TL (2017) IL-4-secreting eosinophils promote endometrial stromal cell proliferation and prevent Chlamydia-induced upper genital tract damage. Proc Natl Acad Sci U S A 114, E6892–E6901. [DOI] [PMC free article] [PubMed] [Google Scholar]
- 8.Takeda K, Shiraishi Y, Ashino S, Han J, Jia Y, Wang M, Lee NA, Lee JJ, Gelfand EW (2015) Eosinophils contribute to the resolution of lung-allergic responses following repeated allergen challenge. J Allergy Clin Immunol 135, 451–60. [DOI] [PMC free article] [PubMed] [Google Scholar]
- 9.Gouon-Evans V, Rothenberg ME, Pollard JW (2000) Postnatal mammary gland development requires macrophages and eosinophils. Development 127, 2269–82. [DOI] [PubMed] [Google Scholar]
- 10.Chu VT, Frohlich A, Steinhauser G, Scheel T, Roch T, Fillatreau S, Lee JJ, Lohning M, Berek C. (2011) Eosinophils are required for the maintenance of plasma cells in the bone marrow. Nat Immunol 12, 151–9. [DOI] [PubMed] [Google Scholar]
- 11.Stevens WW, Kim TS, Pujanauski LM, Hao X, Braciale TJ (2007) Detection and quantitation of eosinophils in the murine respiratory tract by flow cytometry. J Immunol Methods 327, 63–74. [DOI] [PMC free article] [PubMed] [Google Scholar]
- 12.Zhang JQ, Biedermann B, Nitschke L, Crocker PR (2004) The murine inhibitory receptor mSiglec-E is expressed broadly on cells of the innate immune system whereas mSiglec-F is restricted to eosinophils. Eur J Immunol 34, 1175–84. [DOI] [PubMed] [Google Scholar]
- 13.Bettigole SE, Lis R, Adoro S, Lee AH, Spencer LA, Weller PF, GlMMCher LH (2015) The transcription factor XBP1 is selectively required for eosinophil differentiation. Nat Immunol 16, 829–37. [DOI] [PMC free article] [PubMed] [Google Scholar]
- 14.Gorski SA, Lawrence MG, Hinkelman A, Spano MM, Steinke JW, Borish L, Teague WG, Braciale TJ (2019) Expression of IL-5 receptor alpha by murine and human lung neutrophils. PLoS One 14, e0221113. [DOI] [PMC free article] [PubMed] [Google Scholar]
- 15.Dyer KD, Moser JM, Czapiga M, Siegel SJ, Percopo CM, Rosenberg HF (2008) Functionally competent eosinophils differentiated ex vivo in high purity from normal mouse bone marrow. J Immunol 181, 4004–9. [DOI] [PMC free article] [PubMed] [Google Scholar]
- 16.Doan TC, Jeong BM, Coden ME, Loffredo LF, Bhattacharyya S, Chiarella SE, Varga J, Abdala-Valencia H, Berdnikovs S. (2018) Matrix protein tenascin-C expands and reversibly blocks maturation of murine eosinophil progenitors. J Allergy Clin Immunol 142, 695–698 e4. [DOI] [PMC free article] [PubMed] [Google Scholar]
- 17.Pang WW, Price EA, Sahoo D, Beerman I, Maloney WJ, Rossi DJ, Schrier SL, Weissman IL (2011) Human bone marrow hematopoietic stem cells are increased in frequency and myeloid-biased with age. Proc Natl Acad Sci U S A 108, 20012–7. [DOI] [PMC free article] [PubMed] [Google Scholar]
- 18.Schollaert KL, Stephens MR, Gray JK, Fulkerson PC (2014) Generation of eosinophils from cryopreserved murine bone marrow cells. PLoS One 9, e116141. [DOI] [PMC free article] [PubMed] [Google Scholar]
- 19.Allakhverdi Z, Comeau MR, Smith DE, Toy D, Endam LM, Desrosiers M, Liu YJ, Howie KJ, Denburg JA, Gauvreau GM, Delespesse G. (2009) CD34+ hemopoietic progenitor cells are potent effectors of allergic inflammation. J Allergy Clin Immunol 123, 472–8. [DOI] [PubMed] [Google Scholar]
- 20.Deniset JF, Surewaard BG, Lee WY, Kubes P. (2017) Splenic Ly6G(high) mature and Ly6G(int) immature neutrophils contribute to eradication of S. pneumoniae. J Exp Med 214, 1333–1350. [DOI] [PMC free article] [PubMed] [Google Scholar]
- 21.Lee PY, Wang JX, Parisini E, Dascher CC, Nigrovic PA (2013) Ly6 family proteins in neutrophil biology. J Leukoc Biol 94, 585–94. [DOI] [PubMed] [Google Scholar]
- 22.Bouffi C, Kartashov AV, Schollaert KL, Chen X, Bacon WC, Weirauch MT, Barski A, Fulkerson PC (2015) Transcription Factor Repertoire of Homeostatic Eosinophilopoiesis. J Immunol 195, 2683–95. [DOI] [PMC free article] [PubMed] [Google Scholar]
- 23.Caldenhoven E, van Dijk TB, Tijmensen A, Raaijmakers JA, Lammers JW, Koenderman L, de Groot RP (1998) Differential activation of functionally distinct STAT5 proteins by IL-5 and GM-CSF during eosinophil and neutrophil differentiation from human CD34+ hematopoietic stem cells. Stem Cells 16, 397–403. [DOI] [PubMed] [Google Scholar]
- 24.Koffel R, Meshcheryakova A, Warszawska J, Hennig A, Wagner K, Jorgl A, Gubi D, Moser D, Hladik A, Hoffmann U, Fischer MB, van den Berg W, Koenders M, Scheinecker C, Gesslbauer B, Knapp S, Strobl H. (2014) Monocytic cell differentiation from band-stage neutrophils under inflammatory conditions via MKK6 activation. Blood 124, 2713–24. [DOI] [PMC free article] [PubMed] [Google Scholar]
- 25.Mack EA, Stein SJ, Rome KS, Xu L, Wertheim GB, Melo RCN, Pear WS (2019) Trib1 regulates eosinophil lineage commitment and identity by restraining the neutrophil program. Blood 133, 2413–2426. [DOI] [PMC free article] [PubMed] [Google Scholar]
- 26.Limkar AR, Mai E, Sek AC, Percopo CM, Rosenberg HF (2020) Frontline Science: Cytokine-mediated developmental phenotype of mouse eosinophils: IL-5-associated expression of the Ly6G/Gr1 surface Ag. J Leukoc Biol 107, 367–377. [DOI] [PMC free article] [PubMed] [Google Scholar]
Associated Data
This section collects any data citations, data availability statements, or supplementary materials included in this article.
Supplementary Materials
Supplementary Figure 1. Additional IL-5Rα antibody staining (clone REA343/Miltenyi Biotec/PE/5 μL) to confirm detection of IL-5Rα. Both clones equally detect IL-5Rα expression on MMCs.
Supplementary Figure 2. Complete RNA-seq analysis from Fig. 3B. Heatmaps show hierarchical clustering of gene signatures of MMCs and MMCs+IL-5 associated with biological process “DNA-binding transcription factor activity” (GO: 0003700) (on the left) and “signaling receptor activity” (GO: 0038023) (on the right). Bar graphs show mRNA transcript levels of IL5-Rα and Ly6G for these cells with and without IL-5 treatment.
Supplementary Figure 4. MMC population dynamics in IL-5 transgenic mice. A. In vivo constitutive exposure to IL-5 in NJ1638 mice diminishes MMC population in bone marrow but proportionally increases Eos. On the right, cytospin differential staining preparations of wild type whole bone marrow and IL-5 transgenic NJ1638 whole bone marrow cell suspensions. Note that in comparison to wild type bone marrow, NJ1638 bone marrow contains predominantly mature eosinophils with distinct red granular staining. N=3–5 mice/group. ****, p < 0.0001 by ANOVA/Tukey analysis. B. IL-5 transgenic NJ1638 bone marrow culture continuously maintains high levels of Eos and diminished levels of MMCs. N=2 replicates/time point/group, 2 experimental repeats.
Supplementary Figure 3. Dynamics of MMC population in the lung and bone marrow in a mouse model of asthma.
Supplementary Figure 6. Baseline levels of MMCs in wild type C57BL/6 murine bone marrow.
Supplementary Figure 5. A. Flow cytometry analysis of MMC population in bone marrow of wild type and dblGATA mouse counterparts. B. Flow cytometry analysis of MMCs and Siglec-F(+) mcEos in bone marrow-derived IL-5 eosinophil cultures from iPHILs (diphtheria toxin-inducible eosinophil knockout mice). N=3–5 mice/group in mouse experiments. *, p < 0.05; ****, p < 0.0001 by ANOVA/Tukey analysis. All experiments were repeated 3–4 times