

Key Points
Question
Do individuals diagnosed with cancer during pregnancy or 1-year postpartum (pregnancy-associated cancer) have higher risks of mortality compared with those diagnosed with cancer remote from pregnancy?
Findings
In this retrospective cohort study of 24 307 premenopausal women with cancer, was a higher risk of death due to pregnancy-associated cancer than there was from cancer remote from pregnancy; however, these results varied across cancer sites.
Meaning
The findings of this study suggest that pregnancy-associated cancers may have increased risk of mortality, though not all cancer sites present the same risk.
This retrospective cohort study assesses mortality and survival in premenopausal women with pregnancy-associated cancers, with a particular focus on cancers other than those of the breast.
Abstract
Importance
Outcomes among patients with pregnancy-associated cancers (diagnosed during pregnancy or 1-year postpartum) other than breast cancer have received relatively little research attention. High-quality data from additional cancer sites are needed to inform the care of this unique group of patients.
Objective
To assess mortality and survival in premenopausal women with pregnancy-associated cancers, with a particular focus on cancers other than those of the breast.
Design, Setting, and Participants
This population-based retrospective cohort study included premenopausal women (aged 18-50 years) living in 3 Canadian provinces (Alberta, British Columbia, and Ontario) diagnosed with cancer between January 1, 2003, and December 31, 2016, with follow-up until December 31, 2017, or date of death. Data analysis occurred in 2021 and 2022.
Exposures
Participants were categorized as being diagnosed with cancer during pregnancy (from conception to delivery), during the postpartum period (up to 1 year after delivery), or during a time that was remote from pregnancy.
Main Outcomes and Measures
Outcomes were overall survival at 1 and 5 years and time from diagnosis to death due to any cause. Cox proportional hazard models were used to estimate mortality adjusted hazard ratios (aHRs) with 95% confidence intervals (CIs), adjusting for age at cancer diagnosis, cancer stage, cancer site, and days from diagnosis to first treatment. Meta-analysis was used to pool results across all 3 provinces.
Results
During the study period there were 1014, 3074, and 20 219 participants diagnosed with cancer during pregnancy, postpartum, and periods remote from pregnancy, respectively. One-year survival was similar across the 3 groups, but 5-year survival was lower among those diagnosed with cancer during pregnancy or postpartum. Overall, there was a greater risk of death due to pregnancy-associated cancer among those diagnosed during pregnancy (aHR, 1.79; 95% CI, 1.51-2.13) and postpartum (aHR, 1.49; 95% CI, 1.33-1.67); however, these results varied across cancer sites. Increased hazard of mortality was observed for breast (aHR, 2.01; 95% CI, 1.58-2.56), ovarian (aHR, 2.60; 95% CI, 1.12-6.03), and stomach (aHR, 10.37; 95% CI, 3.56-30.24) cancers diagnosed during pregnancy, and brain (aHR, 2.75; 95% CI, 1.28-5.90), breast (aHR, 1.61; 95% CI, 1.32-1.95), and melanoma (aHR, 1.84; 95% CI, 1.02-3.30) cancers diagnosed postpartum.
Conclusions and Relevance
This population-based cohort study found that pregnancy-associated cancers had increased overall 5-year mortality, though not all cancer sites presented the same risk.
Introduction
Cancer is the second leading cause of death in premenopausal women, with pregnancy-associated cancer (ie, cancer diagnosed during pregnancy and 1-year postpartum) estimated to occur once in every 1000 pregnancies.1,2 Multiple studies across Australia, Europe, and North America have observed an increase in the incidence of pregnancy-associated cancer over time.2,3,4,5,6 This rise may be attributable, in part, to increases in delayed childbearing, improvements in diagnostic testing, awareness of genetic risk factors and subsequent screening, and expansion of population-based screening programs.2 Pregnancy-associated cancers are overwhelmingly diagnosed in the postpartum period, with only 25% diagnosed during pregnancy.7 This timing of diagnosis could be attributable to an increase in health care encounters in the antenatal and postnatal periods, or possibly due to physician hesitancy in performing potentially harmful diagnostic tests during pregnancy, resulting in delayed diagnosis.7
Pregnancy-associated breast cancers have been well established as having an increased mortality compared with breast cancers diagnosed outside of pregnancy or postpartum.8 However, evidence on long-term health outcomes following diagnosis of cancer other than breast cancer is limited. One possible explanation for poorer survival associated with pregnancy-associated breast cancer is that hormonal changes in pregnancy, delivery, and lactation enhance the growth of malignant cells, producing a more aggressive and advanced disease at time of diagnosis.2,9,10 Diagnostic delay may also play a role because common physiologic changes during pregnancy and postpartum may mimic early physical symptoms of cancer. The lack of research on cancers other than breast cancer precludes an evidence-based discussion between physicians and affected individuals about prognosis and treatment options. Our objectives were to (1) determine long-term mortality in premenopausal women with pregnancy-associated cancers compared with premenopausal women diagnosed with cancer remote from pregnancy, overall and stratified by cancer type, and (2) to assess 1- and 5-year survival rates of those affected.
Methods
This study received ethics approval from the health research ethics board of Alberta–Cancer Committee (HREBA.CC-17-0588) and from the University of British Columbia, BC Cancer Research ethics board (H18-03424). A waiver of written informed consent was granted to access deidentified data. This study followed the Strengthening the Reporting of Observational Studies in Epidemiology (STROBE) reporting guidelines.
Study Setting and Sample
The study was conducted using administrative data from 3 of Canada’s most populous provinces: Alberta (population 4.4 million), British Columbia (BC) (population 5.7 million), and Ontario (14.6 million).
Data Sources
Data from Alberta were obtained from Alberta Health Services and stored on a secure network. Data from BC and Ontario were accessed through Population Data BC and the Institute for Clinical and Evaluative Sciences (ICES), respectively using secure online portals.
Deterministic linkage based on personal health number, sex, and date of birth was used to link data from cancer registries to other administrative data holdings in each province. The cancer registries in Alberta, BC,11 and Ontario were used to identify cancers occurring in premenopausal women. These registries collect detailed information on virtually all new cancer cases, including cancer type, cancer stage, diagnosis date, initial treatment, and deaths, occurring in their respective provinces. The Alberta Perinatal Health Program and Perinatal Services BC12 databases were used to identify livebirths and stillbirths occurring after 20 weeks’ gestation, and obstetrical outcomes. These databases collect information on maternal and newborn health status and delivery characteristics, including gestational age at delivery, mode of delivery, obstetric interventions, and birth weight. Pregnancies in Ontario were identified in the Discharge Abstract Database (DAD), which contains information on all hospitalizations; approximately 98% of deliveries in Canada occur in a hospital.13
The Canadian Institute for Health Information DAD14 and the National Ambulatory Care Reporting System15 were used to identify hospitalizations and emergency department visits, respectively, for all provinces. These databases collect information on patient characteristics, admission and discharge dates, and up to 26 diagnostic and procedure codes associated with each hospitalization or emergency department visit.16,17 Diagnoses were coded using the Canadian Coding Standards for the International Statistical Classification of Diseases and Related Health Problems (ICD-10-CA), while procedures were coded using the Canadian Classification of Health Interventions (CCI).18,19 The Alberta Physician Claims database, BC Medical Services Plan database,20 and the Ontario Health Insurance Plan databases identified all outpatient physician claims submitted for fee-for-service billings. These data were coded by physicians in their offices and contain information on the date of the visit, diagnosis, and procedure codes. Linked data from Vital Statistics21 for each province were used to determine date of death, if applicable. Participants were diagnosed with cancer between January 1, 2003, and December 31, 2016, with follow-up until December 31, 2017, or date of death. Data analysis occurred in 2021 and 2022.
Exposure
Data were obtained for premenopausal adult women (aged 18-50 years at the time of diagnosis) diagnosed with cancer between January 1, 2003, and December 31, 2016. Follow-up continued until death or December 31, 2017. Participants had from 1 to 14 years of follow-up based on their date of diagnosis and death. Stage 0 cancers (in situ), nonmelanoma skin cancers, squamous intraepithelial neoplasia grade 3, and high-grade squamous intraepithelial lesions of the cervix were excluded. Because we were unable to distinguish between voluntary and involuntary childlessness, and all-cause mortality rates are known to be higher among infertile women,22 this study was further restricted to individuals who had a pregnancy during the study period. Eligible participants were categorized into 3 groups: (1) those diagnosed with cancer during pregnancy, from the date of conception to the date of birth, (2) those diagnosed with cancer during the postpartum period, defined as the 365 days after delivery, and (3) those with a cancer diagnosis remote from pregnancy. In individuals with multiple primary cancers, only the first primary cancer diagnosis was considered.
Outcomes
Outcomes were overall survival at 1 and 5 years and time from cancer diagnosis to death due to any cause. All-cause mortality was ascertained from the respective cancer registries that collaborate with Vital Statistics to assess all-cause and cancer-specific mortality.
Covariates
Covariates in the study included age at cancer diagnosis, cancer stage, cancer site, and days from diagnosis to first treatment. Cancer stage was categorized as stage 1, 2, 3, 4, or unknown (either unstageable or not staged) according to the American Joint Committee on Cancer (AJCC) Cancer Staging Manuals (Sixth Edition: 2003-2009, Seventh Edition: 2010-2017). Cancer sites were categorized according to the International Classification of Diseases for Oncology, third edition (ICD-O-3). Initial treatment dates and modalities (chemotherapy, radiotherapy, surgery) in Alberta were ascertained by the Alberta Cancer Registry. In Ontario and BC treatment data were determined using a validated algorithm for provincial cancer registry data.23 Individuals were considered treated if they received a treatment within 1 month before diagnosis to 6 months after diagnosis.24 For individuals diagnosed during pregnancy, treatment was considered until 6 months after delivery, to allow for individuals who waited until the postpartum period to initiate treatment for their cancer.
Statistical Analyses
Descriptive characteristics were computed using frequencies and percentages. Descriptive characteristics of pregnancies were not reported for those diagnosed remote from pregnancy because these individuals could have had multiple pregnancies within the study period. One- and 5-year survival rates were estimated as percentages with 95% confidence intervals (CIs). Kaplan-Meier curves were used to examine overall mortality. Log-rank tests were used to determine if crude mortality differed in relation to timing of diagnosis relative to pregnancy. Cox proportional hazard models were used to estimate crude and adjusted hazard ratios (aHRs) for all-cause mortality comparing individuals diagnosed with cancer during pregnancy and/or postpartum with individuals diagnosed with cancer remote from pregnancy (SAS statistical software, version 9.4; SAS Institute, Inc) as a reference group. Models were adjusted for age at cancer diagnosis, cancer stage, cancer site, and days to first treatment. For individuals who did not receive any treatment within 6 months of diagnosis (either because they were treated later or they were never treated), we assigned a value of 180 days from diagnosis to first treatment. Individuals were censored at date of death (outcome) or the end of the study period. Two models were run: the first considered any pregnancy-associated cancer (cancer diagnosed in either pregnancy or postpartum) as the exposed group; the second stratified exposure by diagnosis time (pregnancy or postpartum). Data on cancer stage are known to be biased because stage was only collected for certain types of cancer (primarily breast, cervix, colorectal, and lung) in some provinces; additionally, some cancer types (ie, lymphoma, leukemia) are not stageable. As such, a sensitivity analysis was also performed in which the same models were run, but any cancers without data on stage were excluded. Because there were no missing data on covariates other than cancer stage (as described above), a complete case analysis was used for all analyses.
Due to restrictions on data transfer between provinces, we used a distributed network approach whereby analyses were conducted separately using data from each province and the results pooled, when possible, using random effects meta-analysis for proportions and hazard ratios (HRs) (Stata statistical software, version 14; STATA).25,26 Weights were applied in all meta-analyses to account for the different population sizes between provinces. The Cochran Q test was used to estimate the degree of between-province heterogeneity in effect estimates, and to assess the appropriateness of generating a single pooled effect estimate for each exposure-outcome model.27 This approach has been shown to yield comparable effect estimates to those seen when individual-level data are available for sharing.28,29
Results
In this study, there were 24 307 eligible participants, of whom 1014 were diagnosed with cancer during their pregnancy, 3074 diagnosed postpartum, and 20 219 diagnosed remote from pregnancy (Figure 1). The mean age at diagnosis was 31.9 years for those diagnosed during pregnancy, 32.6 years for those diagnosed postpartum, and 36.5 years for those diagnosed remote from pregnancy (Table 1). Mean gestational age at delivery was approximately 2 weeks earlier in those diagnosed in pregnancy compared with those diagnosed postpartum (37 weeks vs 38.5 weeks), with a preterm birth rate of 32% vs 10%, respectively. The proportion of participants living in rural areas was similar across each group. Most cancers in each group did not have data on stage at diagnosis. Breast cancer was the most common type of cancer in those diagnosed during pregnancy (26.0%) and those diagnosed remote from pregnancy (30.0%), whereas thyroid cancer was the most common cancer site in those diagnosed postpartum (24.0%). Descriptive statistics stratified by province are presented in eTable 1 in Supplement 1.
Figure 1. Flow Diagram of Study Inclusion.
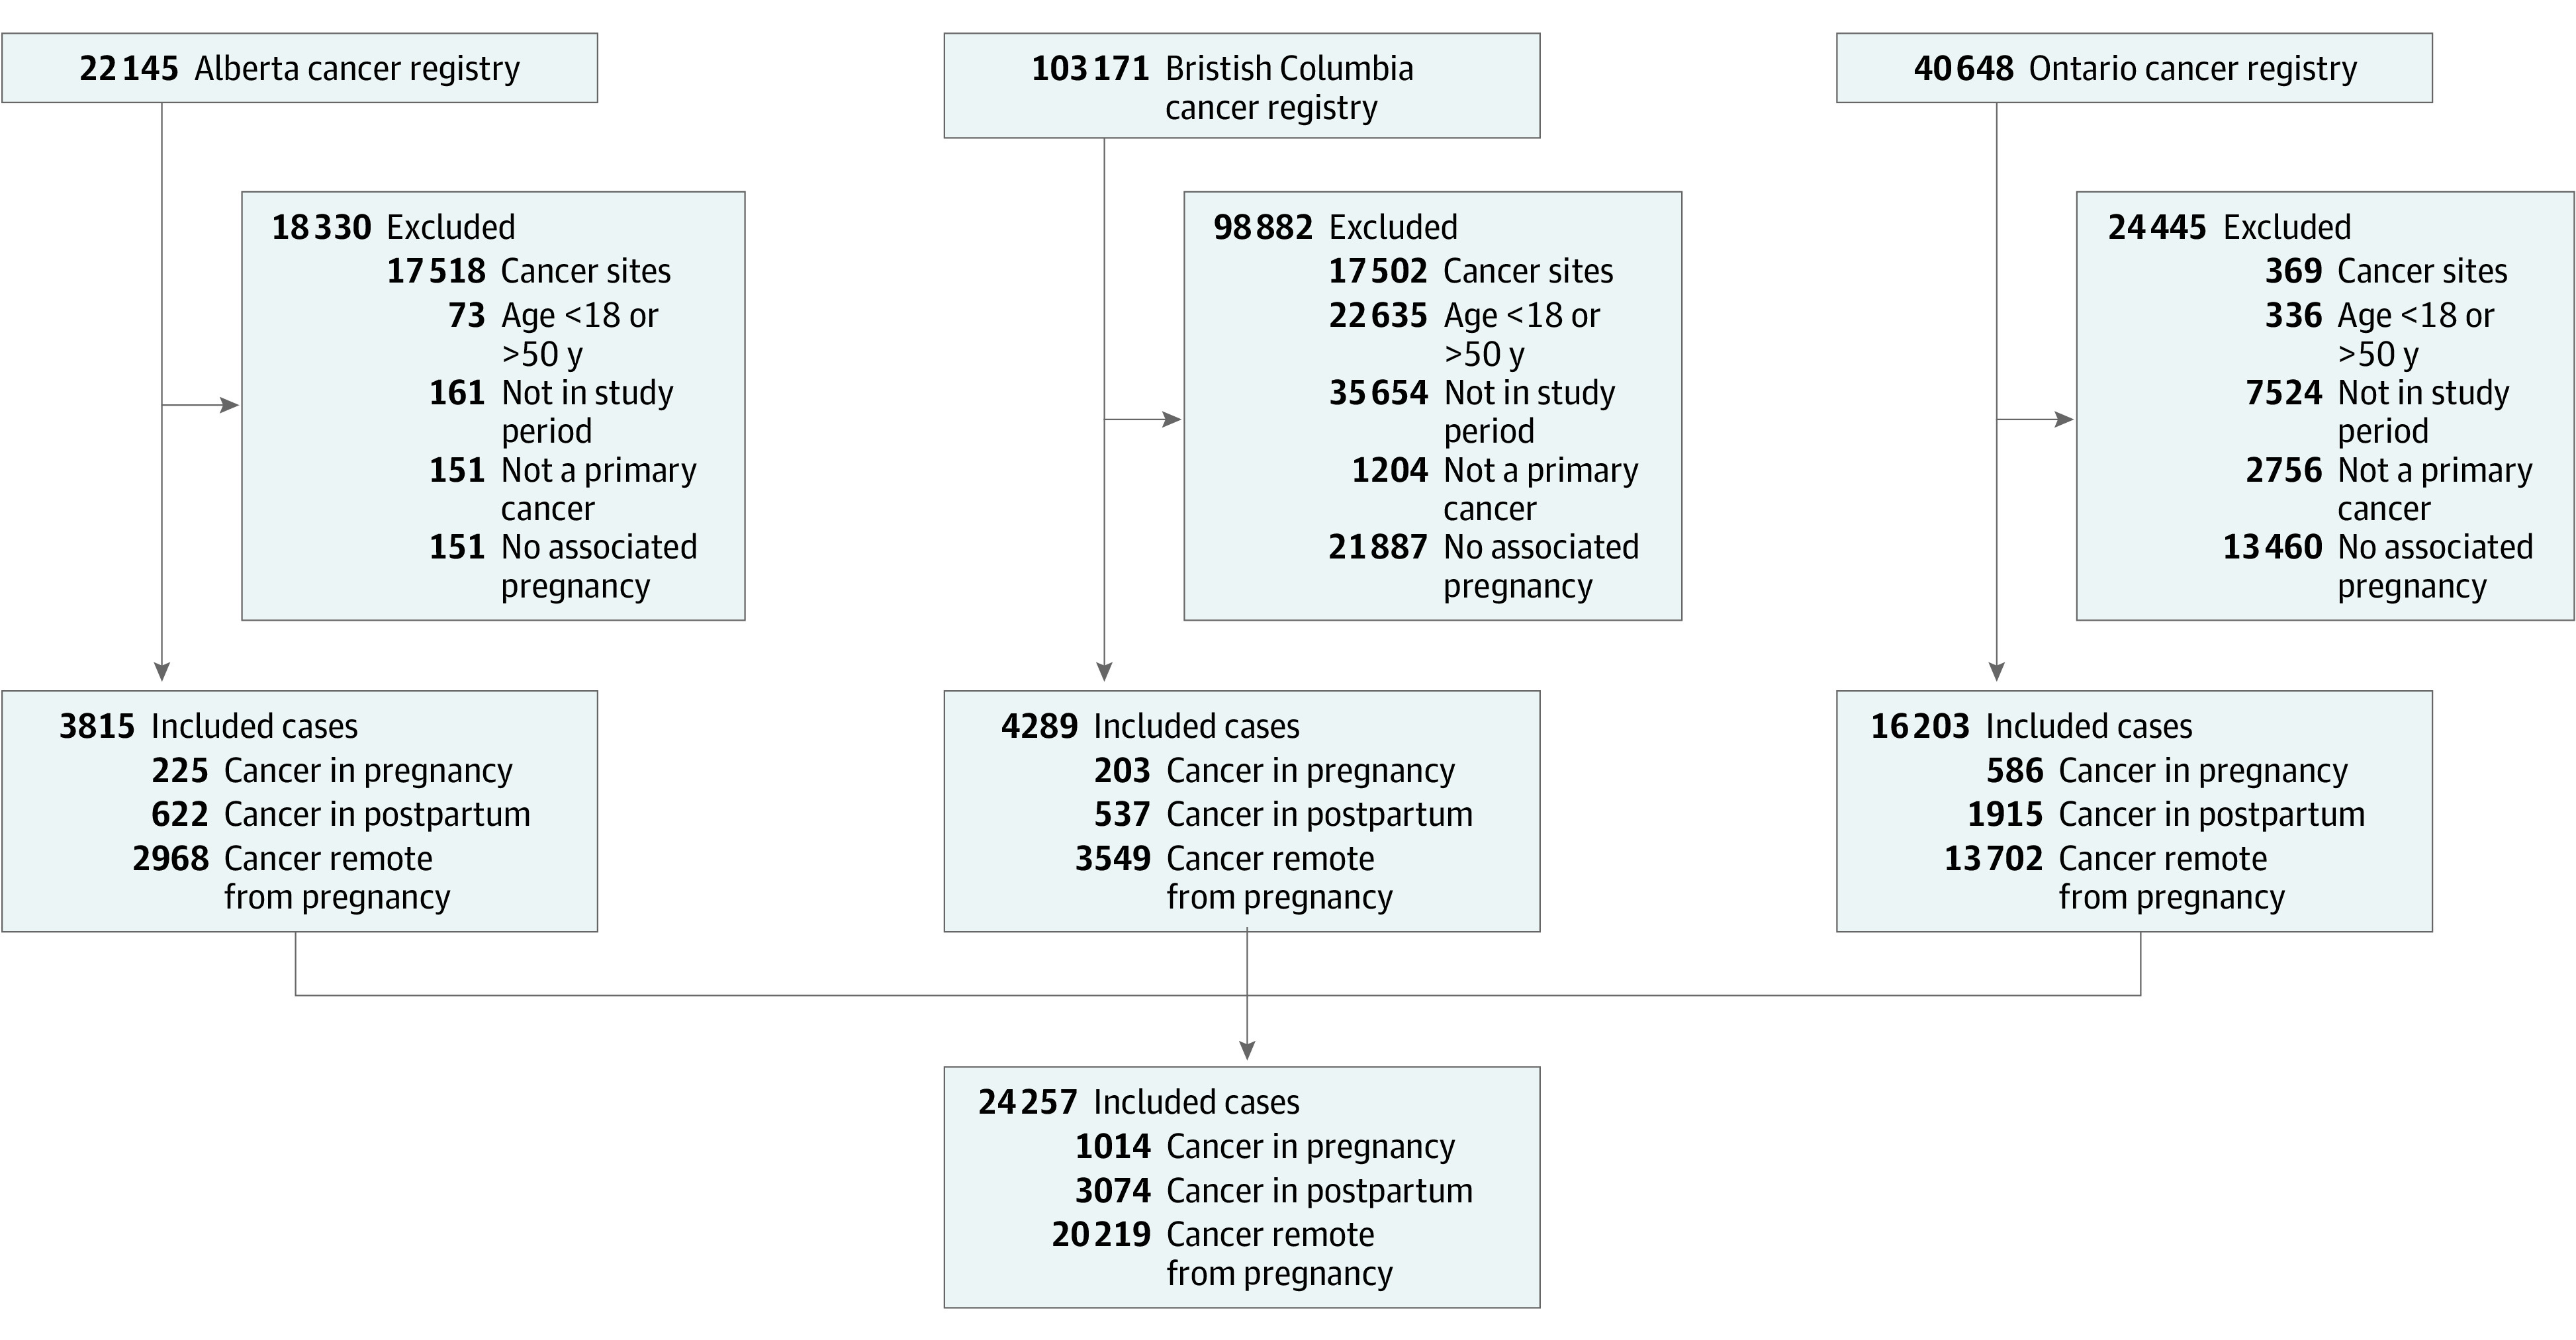
The study flow diagram indicates the number of premenopausal women with cancer diagnosed during pregnancy, postpartum, and remote from pregnancy in each province and collectively.
Table 1. Pooled Baseline Characteristics of Cohorts From Alberta, British Columbia, and Ontario, Canada.
| Characteristic | Patients with cancer, No. (%) | ||
|---|---|---|---|
| Pregnancy (n = 1014) | Postpartum (n = 3074) | Remote from pregnancy (n = 20 219) | |
| Age at diagnosis, mean (SD), y | 31.9 (5.0) | 32.6 (5.0) | 36.5 (6.6) |
| Gestational age at delivery, mean (SD), wk | 37.0 (3.4) | 38.5 (2.3) | NAa |
| Preterm birth, <37 weeks | 324 (32.0) | 292 (10.0) | NAa |
| Birth weight, mean (SD), g | 3002 (768) | 3342 (596) | NAa |
| Parityb | |||
| Primiparous | 175 (41.0) | 457 (39.0) | NAa |
| Multiparous | 252 (59.0) | 692 (60.0) | NAa |
| Rural residence | 91 (9.0) | 281 (10.0) | 1747 (10.0) |
| Most common cancer sites | |||
| Breast | 261 (26.0) | 574 (18.0) | 6205 (30.0) |
| Thyroid | 187 (18.0) | 845 (24.0) | 4675 (19.0) |
| Melanoma of skin | 141 (14.0) | 307 (11.0) | 1678 (9.0 ) |
| Cervix | 56 (5.0) | 354 (13.0) | 1361 (8.0) |
| Cancer stage (all cancers) | |||
| 1 | 197 (19.0) | 766 (24.0) | 5203 (25.0) |
| 2 | 132 (12.0) | 299 (9.0) | 3204 (15.0) |
| 3 | 97 (9.0) | 247 (8.0) | 1971 (9.0 ) |
| 4 | 39 (4.0) | 152 (5.0) | 851 (4.0) |
| Missing/unknown/not staged | 549 (55.0) | 1610 (54.0) | 8990 (46.0) |
| Cancer stage (breast cancer) | |||
| 1 | 25 (9.0) | 71 (12.0) | 1676 (27.0) |
| 2 | 84 (32.0) | 193 (32.0) | 2530 (41.0) |
| 3 | 61 (23.0) | 125 (21.0) | 1208 (18.0) |
| 4 | 24 (10.0) | 55 (9.0) | 230 (4.0) |
| Missing/unknown/not staged | 67 (22.0) | 130 (24.0) | 561 (10.0) |
| Initial treatment type | |||
| Chemotherapy | 137 (13.0 ) | 374 (13.0) | 2503 (13.0) |
| Radiotherapy | 27 (2.0) | 104 (3.0) | 555 (3.0) |
| Surgery | 567 (53.0) | 1952 (58.0) | 12510 (59.0) |
| No treatment or treatment outside defined time period | 242 (25.0) | 547 (20.0) | 4178 (20.0) |
| Time from diagnosis to initial treatment, mean (SD), d | |||
| All cancers | 58.4 (77.6) | 29.6 (35.8) | 30.6 (35.4) |
| Breast | 31.8 (41.3) | 32.7 (28.1) | 35.2 (25.8) |
| Cervix | 64.0 (96.4) | 22.7 (46.9) | 32.3 (44.5) |
| Melanoma of skin | 13.4 (52.6) | 16.0 (31.7) | 30.4 (33.0) |
| Thyroid | 117.5 (99.9) | 28.1 (42.2) | 23.2 (40.7) |
Abbreviation: NA, not applicable.
Descriptive statistics for pregnancies only reported for cancers diagnosed during pregnancy or postpartum.
Only reported in Alberta and British Columbia.
Pooled 1- and 5-year survival rates for pregnancy-associated cancers are presented in Table 2, and Kaplan-Meier survival curves are presented in Figure 2. For all cancer sites, 1-year survival was similar across the groups; however, 5-year survival was decreased in those diagnosed in either pregnancy or postpartum (88%; 95% CI, 87%-89%), pregnancy alone (87%; 95% CI, 84%-89%), and postpartum alone (89%; 95% CI 88%-90%), compared with those diagnosed remote from pregnancy (93%; 95% CI, 92%-93%). For breast cancers, both 1- and 5-year survival were lower for any pregnancy-associated cancers compared with cancers diagnosed remote from pregnancy. Survival rates stratified by province are presented in eTable 2 in Supplement 1.
Table 2. Pooled 1- and 5-Year Survival Rates for Pregnancy-Associated Cancers in Alberta, British Columbia, and Ontario, Canada.
| Time period of cancer diagnosis relative to pregnancy, cancer site | 1-y survival | 5-y survival | ||
|---|---|---|---|---|
| No./total No. | % (95% CI) | No./total No. | % (95% CI) | |
| Cancer | ||||
| All sites | ||||
| Remote from pregnancy and postpartum | 19 758/20 219 | 98 (98-98) | 9647/10 442 | 93 (92-93) |
| Any pregnancy-associated cancer | 3942/4088 | 96 (96-97) | 2638/2990 | 88 (87-89) |
| Diagnosed during pregnancy | 984/1014 | 97 (96-98) | 690/795 | 87 (84-89) |
| Diagnosed postpartum | 2958/3074 | 96 (96-97) | 1950/2195 | 89 (88-90) |
| Stomach | ||||
| Remote from pregnancy and postpartum | 32/45 | 73 (60-85) | 14/31 | 33 (16-49) |
| Any pregnancy-associated cancer | NRa | NRa | NRa | NRa |
| Diagnosed during pregnancy | NRa | NRa | NRa | NRa |
| Diagnosed postpartum | NRa | NRa | NRa | NRa |
| Brain | ||||
| Remote from pregnancy and postpartum | 336/362 | 93 (90-96) | 165/213 | 80 (67-94) |
| Any pregnancy-associated cancer | 95/102 | 93 (88-98) | 53/81 | 66 (55-76) |
| Diagnosed during pregnancy | 21/21 | 100 | NRa | NRa |
| Diagnosed postpartum | 74/81 | 91 (84-98) | NRa | NRa |
| Colon | ||||
| Remote from pregnancy and postpartum | 566/601 | 93 (88-98) | 213/260 | 82 (77-87) |
| Any pregnancy-associated cancer | 102/109 | 94 (89-98) | 47/67 | 68 (41-95) |
| Diagnosed during pregnancy | NRa | NRa | NRa | NRa |
| Diagnosed postpartum | NRa | NRa | NRa | NRa |
| Breast | ||||
| Remote from pregnancy and postpartum | 6149/6205 | 99 (99-100) | 2406/2682 | 90 (89-91) |
| Any pregnancy-associated cancer | 804/835 | 96 (95-98) | 477/607 | 79 (75-82) |
| Diagnosed during pregnancy | 250/261 | 97 (95-99) | 155/205 | 76 (70-82) |
| Diagnosed postpartum | 551/574 | 96 (95-98) | 322/402 | 80 (77-84) |
| Cervical | ||||
| Remote from pregnancy and postpartum | 1331/1361 | 98 (97-99) | 689/743 | 93 (91-95) |
| Any pregnancy-associated cancer | 402/410 | 98 (97-99) | 290/311 | 94 (91-96) |
| Diagnosed during pregnancy | NRa | NRa | NRa | NRa |
| Diagnosed postpartum | NRa | NRa | NRa | NRa |
| Ovarian | ||||
| Remote from pregnancy and postpartum | 587/603 | 98 (96-100) | 309/330 | 95 (91-98) |
| Any pregnancy-associated cancer | NRa | NRa | 108/119 | 91 (86-96) |
| Diagnosed during pregnancy | NRa | NRa | NRa | NRa |
| Diagnosed postpartum | NRa | NRa | NRa | NRa |
| Melanoma skin | ||||
| Remote from pregnancy and postpartum | 1670/1678 | 99 (99-100) | 971/996 | 98 (97-99) |
| Any pregnancy-associated cancer | NRa | NRa | 319/332 | 97 (94-100) |
| Diagnosed during pregnancy | NRa | NRa | NRa | NRa |
| Diagnosed postpartum | NRa | NRa | NRa | NRa |
Abbreviation: NR, not reported.
Cannot report due to small sample size or to prevent residual disclosure.
Figure 2. Kaplan-Meier Survival Curves Stratified by Timing of Cancer Diagnosis .
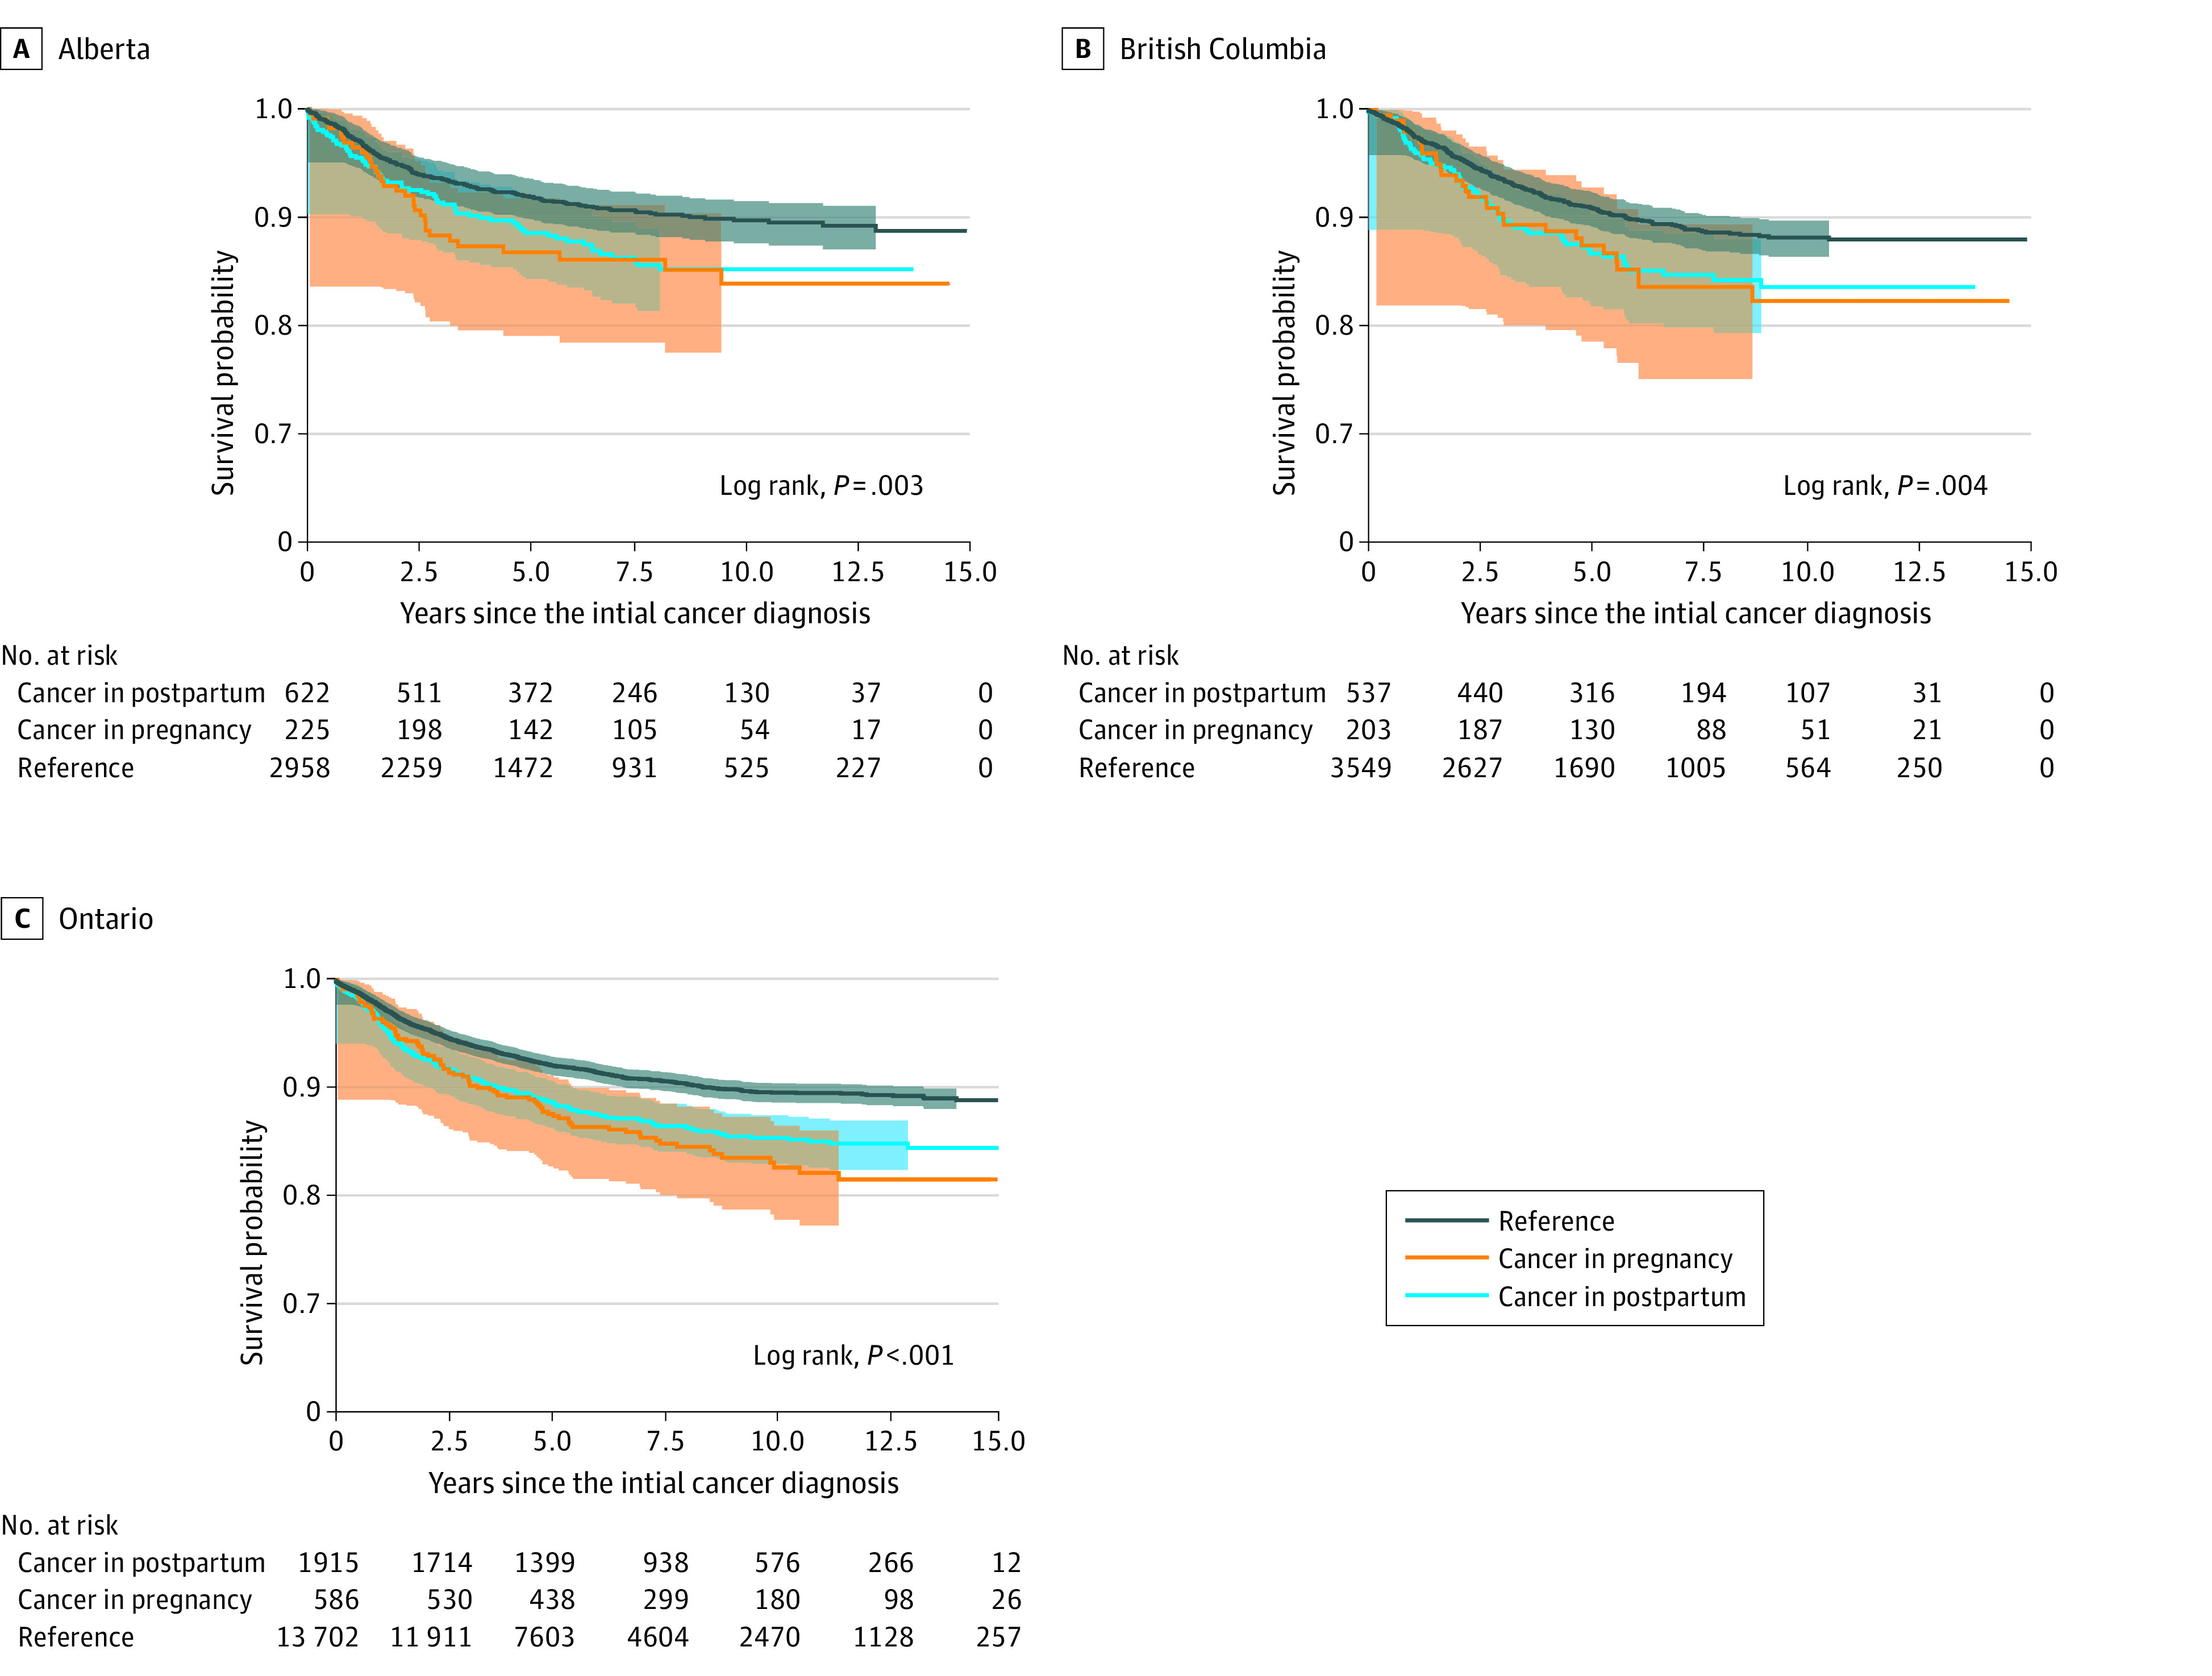
Kaplan-Meier survival curves illustrate differential survival over time based on the timing of cancer diagnosis relative to pregnancy in (A) Alberta; (B) British Columbia; and (C), Ontario, Canada.
eTable 3 in Supplement 1 presents the pooled crude and aHRs for all-cause mortality following pregnancy-associated cancer, using cancer diagnosed remote from pregnancy as the referent. The mean (SD) duration of follow-up was 6.3 (3.8) years, and 2230 participants (9%) died during follow-up. Overall, those diagnosed with cancer either during pregnancy or postpartum had an increased mortality (aHR, 1.57; 95% CI, 1.42-1.74) after adjusting for age at diagnosis, stage at diagnosis, cancer site, and days to first treatment. Mortality remained significantly elevated when comparing pregnancy (aHR, 1.79; 95% CI, 1.51-2.13) and postpartum (aHR, 1.49; 95% CI, 1.33-1.67) cancers separately compared with cancers diagnosed remote from pregnancy. These associations persisted over some, but not all, types of cancer. Increased hazards of mortality were observed for breast (aHR, 2.01; 95% CI, 1.58-2.56), ovarian (aHR, 2.60; 95% CI, 1.12-6.03), and stomach (aHR, 10.37; 95% CI, 3.56-30.24) cancers diagnosed during pregnancy, and brain (aHR, 2.75; 95% CI, 1.28-5.90), breast (aHR, 1.61; 95% CI, 1.32-1.95), and melanoma skin (aHR, 1.84; 95% CI, 1.02-3.30) cancers diagnosed postpartum. When analyses were stratified by cancer site and restricted to staged cancers only, point estimates were generally similar to estimates obtained from using staged and nonstaged cancers. Crude and aHRs for mortality stratified by province are presented in eTable 4 in Supplement 1.
Discussion
In this 13-year cohort study of pregnancy-associated cancers in 3 Canadian provinces, we found that the risk of mortality was increased in those with any pregnancy-associated cancer after adjusting for age at diagnosis, stage at diagnosis, cancer site, and days to first treatment. When examining pregnancy and postpartum cancer diagnoses separately, individuals diagnosed during pregnancy appeared to have elevated mortality, though this association was not consistent across all cancer sites. One-year survival was generally comparable between all groups, whereas 5-year survival was reduced in individuals with any pregnancy-associated cancer.
Results of this study are consistent with previous research indicating elevated mortality among individuals diagnosed with breast cancer during pregnancy and postpartum, whereas mortality for other less common forms of cancer are not universally increased.8 In a meta-analysis of 76 studies of pregnancy-associated breast cancer, affected individuals had increased all-cause mortality (pooled HR, 1.45; 95% CI, 1.30-1.63), recurrence (HR, 1.39; 95% CI, 1.25-1.54), and cause-specific mortality (HR, 1.40; 95% CI, 1.17-1.68).8 There is inconsistent evidence about survival and cancer recurrence for those diagnosed with non–breast cancer malignant abnormalities during pregnancy or postpartum period. A recent Swedish study30 used nationwide registry with more than 5 decades of data to study all pregnancy-associated cancers. In addition to pregnancy-associated breast cancers, reduced survival was identified for cancer of the upper digestive tract diagnosed during pregnancy (HR, 3.08; 95% CI, 1.78-5.36), colon cancer diagnosed postpartum (HR, 1.42; 95% CI, 1.02-1.99), and uterine cancer diagnosed postpartum (HR, 8.51; 95% CI, 2.76-26.2). Survival was not statistically significantly different for those diagnosed with cervical cancer or cutaneous malignant melanoma in either pregnancy or postpartum. Although this study had one of the largest sample sizes to date (5079 cases diagnosed during pregnancy or in the first year postpartum), it was unable to account for stage at diagnosis, which may explain discrepancies in survival.31,32
There are several potential risk factors for increased mortality of patients with pregnancy-associated cancer. Delays in cancer treatment initiation have been shown to increase risk of death in the general population,24 but have not been uniformly demonstrated in pregnant and postpartum persons with cancer. In a recent study of pregnancy-associated breast cancers in Sweden, time to treatment after symptom development was indeed shorter in those diagnosed during pregnancy.33 In the current study, mean time to first treatment was prolonged only in people diagnosed in pregnancy, not postpartum. Perhaps more relevant is a delayed time to diagnosis, which has been well demonstrated in pregnancy-associated breast cancers, wherein symptoms of cancer (eg, painless breast lump) may be misinterpreted as physiological changes as a result of pregnancy or postpartum (eg, breast engorgement, nipple discharge, clogged ducts).34 This delay may be partially responsible for continued increased risk in the postpartum period, as observed in this study and others.
Strengths and Limitations
Previous studies on this subject have been limited by small sample sizes and lack of detailed cancer diagnosis data (eg, cancer stage). Survival is dependent on not only cancer site, but also the stage at diagnosis. Although our study did have data on stage, they were not available for all cancer sites. In the Alberta Cancer Registry, cancers of the eyes, brain, or other central nervous system did not have information on stage, and only 60% of cancers in the bones and connective tissue had cancer stage; similar deficiencies were in the Ontario Cancer Registry with an addition of three quarters of urinary tract, hematopoietic, and reticuloendothelial cancers being with information on stage. Finally, in BC, only breast, lung, colorectal, and cervical cancers had information on stage. Results from our sensitivity analysis restricted to cancers where stage information was available were generally similar to the overall results that adjusted for stage. Because this study relied exclusively on administrative data, there are potential confounding factors that we were unable to account for in our study including body mass index, race and ethnicity, oral contraceptive use, socioeconomic status, and other prognostic factors that may influence survival. Similarly, we were unable to evaluate other important long-term health outcomes such as cancer recurrence, which is not routinely captured in cancer registries, and has been shown to have low sensitivity when captured by hospital discharge data.35,36,37 Despite pooling results across 3 provinces, analyses of rarer cancer sites were likely underpowered to detect relevant associations.
Conclusions
This population-based cohort study found that pregnancy-associated cancers had an overall increased mortality compared with cancer occurring remotely form pregnancy, and death rates varied greatly depending on cancer site and timing of diagnosis (pregnancy vs postpartum). More research on each cancer site is required to provide robust evidence to guide counselling and clinical care of affected patients.
eTable 1a. Descriptive characteristics of provincial study cohorts: Alberta
eTable 1b. Descriptive characteristics of provincial study cohorts: British Columbia
eTable 1c. Descriptive characteristics of provincial study cohorts: Ontario
eTable 2a. One- and five-year survival rates for pregnancy-associated cancers: Alberta
eTable 2b. One- and five-year survival rates for pregnancy-associated cancers: British Columbia
eTable 2c. One- and five-year survival rates for pregnancy-associated cancers: British Columbia
eTable 3. Pooled crude and adjusted hazard ratios (HR) for mortality in pregnancy-associated cancers in Alberta, British Columbia, and Ontario, Canada
eTable 4a. Provincial crude and adjusted hazard ratios (HR) for mortality in pregnancy-associated cancers: Alberta
eTable 4b. Provincial crude and adjusted hazard ratios (HR) for mortality in pregnancy-associated cancers: British Columbia
eTable 4c. Provincial crude and adjusted hazard ratios (HR) for mortality in pregnancy-associated cancers: Ontario
Data Sharing Statement
References
- 1.Rimes S, Gano J, Milbourne A. Care of the pregnant patient with cancer. Oncology (Williston Park). 2008;22(8)(Suppl Nurse Ed):13-22. [PubMed] [Google Scholar]
- 2.Lee YY, Roberts CL, Dobbins T, et al. Incidence and outcomes of pregnancy-associated cancer in Australia, 1994-2008: a population-based linkage study. BJOG. 2012;119(13):1572-1582. doi: 10.1111/j.1471-0528.2012.03475.x [DOI] [PMC free article] [PubMed] [Google Scholar]
- 3.Eibye S, Kjær SK, Mellemkjær L. Incidence of pregnancy-associated cancer in Denmark, 1977-2006. Obstet Gynecol. 2013;122(3):608-617. doi: 10.1097/AOG.0b013e3182a057a2 [DOI] [PubMed] [Google Scholar]
- 4.Stensheim H, Møller B, van Dijk T, Fosså SD. Cause-specific survival for women diagnosed with cancer during pregnancy or lactation: a registry-based cohort study. J Clin Oncol. 2009;27(1):45-51. doi: 10.1200/JCO.2008.17.4110 [DOI] [PubMed] [Google Scholar]
- 5.Metcalfe A, Cairncross ZF, Friedenreich CM, et al. Incidence of pregnancy-associated cancer in two Canadian provinces: a population-based study. Int J Environ Res Public Health. 2021;18(6):3100. doi: 10.3390/ijerph18063100 [DOI] [PMC free article] [PubMed] [Google Scholar]
- 6.Cottreau CM, Dashevsky I, Andrade SE, et al. Pregnancy-associated cancer: a US population-based study. J Womens Health (Larchmt). 2019;28(2):250-257. doi: 10.1089/jwh.2018.6962 [DOI] [PMC free article] [PubMed] [Google Scholar]
- 7.Dalmartello M, Negri E, La Vecchia C, et al. Frequency of pregnancy-associated cancer: a systematic review of population-based studies. Cancers (Basel). 2020;12(6):1356. doi: 10.3390/cancers12061356 [DOI] [PMC free article] [PubMed] [Google Scholar]
- 8.Shao C, Yu Z, Xiao J, et al. Prognosis of pregnancy-associated breast cancer: a meta-analysis. BMC Cancer. 2020;20(1):1-15. doi: 10.1186/s12885-020-07248-8 [DOI] [PMC free article] [PubMed] [Google Scholar]
- 9.Dodds L, Fell DB, Joseph KS, et al. Relationship of time since childbirth and other pregnancy factors to premenopausal breast cancer prognosis. Obstet Gynecol. 2008;111(5):1167-1173. doi: 10.1097/AOG.0b013e31816fd778 [DOI] [PubMed] [Google Scholar]
- 10.Puckridge PJ, Saunders CM, Ives AD, Semmens JB. Breast cancer and pregnancy: a diagnostic and management dilemma. ANZ J Surg. 2003;73(7):500-503. doi: 10.1046/j.1445-1433.2002.02566.x [DOI] [PubMed] [Google Scholar]
- 11.BC Cancer Registry Data . (2020). V2. Population Data BC [publisher]. Data Extract. BC Cancer (2019). Accessed July 14, 2023. https://www.popdata.bc.ca/data.
- 12.Perinatal Services BC [creator) (2020): British Columbia Perinatal Data Registry. Population Data BC [publisher]. Data Extract. PBSC (2019). Accessed July 14, 2023. http://www.perinatalservicesbc.ca/health-professionals/data-surveillance/perinatal-data-registry.
- 13.Table 13-10-0429-01 Live births and fetal deaths (stillbirths), by place of birth (hospital and non-hospital). Statistics Canada; 2021. Accessed July 14, 2023. https://www150.statcan.gc.ca/t1/tbl1/en/tv.action?pid=1310042901
- 14.Canadian Institute for Health Information [creator] (2019): Discharge Abstract Database (Hospital Separations). V2. Population Data BC [publisher]. Data Extract. MOH (2019). Accessed July 14, 2023. https://www.popdata.bc.ca/data.
- 15.Canadian Institute for Health Information . (2020): National Ambulatory Care Reporting System. V2. Population Data BC [publisher]. Data Extract. MOH (2019). Accessed July 14, 2023. https://www.popdata.bc.ca/data.
- 16.Data quality documentation, discharge abstract database - current-year information, 2016-2017. Ottawa, ON2017. Accessed July 14, 2023. http://www.cihi.ca/sites/default/files/document/current-year_information_dad_2016-2017-en-web.pdf
- 17.Data quality documentation, national ambulatory care reporting system - current-year information, 2016-2017. Ottawa, ON2017. Accessed July 14, 2023. http://www.cihi.ca/sites/default/files/document/nacrs_dataquality_2016_2017_en.pdf
- 18.International Statistical Classification of Diseases and Related Health Problems . 10th Revision. Canadian Institute for Health Information; 2009. [Google Scholar]
- 19.Canadian Classification of Health Interventions. Canadian Institute for Health Information; 2009. [Google Scholar]
- 20.British Columbia Ministry of Health [creator] (2020): Consolidation File (MSP Registration and Premium Billing). V2. Population Data BC [publisher]. Data Extract. MOH (2019). Accessed July 14, 2023. https://www.popdata.bc.ca/data.
- 21.British Columbia Minstry of Health [creator] (2019): Vital Events Deaths. V2. Population Data BC [publisher]. Data Extract. MOH (2019). Accessed July 14, 2023. https://www.popdata.bc.ca/data.
- 22.Murugappan G, Li S, Alvero RJ, Luke B, Eisenberg ML. Association between infertility and all-cause mortality: analysis of US claims data. Am J Obstet Gynecol . 2021;225(1):57 e51-57 e11. [DOI] [PMC free article] [PubMed] [Google Scholar]
- 23.Lix LM, Smith M, Pitz M, et al. Cancer data linkage in Manitoba: expanding the infrastructure for research. Manitoba Centre for Health Policy, College of Medicine, Faculty of Health; 2016. [Google Scholar]
- 24.Khorana AA, Tullio K, Elson P, et al. Time to initial cancer treatment in the United States and association with survival over time: an observational study. PLoS One. 2019;14(3):e0213209. doi: 10.1371/journal.pone.0213209 [DOI] [PMC free article] [PubMed] [Google Scholar]
- 25.Gini R, Schuemie M, Brown J, et al. Data extraction and management in networks of observational health care databases for scientific research: a comparison of EU-ADR, OMOP, Mini-Sentinel and MATRICE Strategies. EGEMS (Wash DC). 2016;4(1):1189. doi: 10.13063/2327-9214.1189 [DOI] [PMC free article] [PubMed] [Google Scholar]
- 26.Harris RJ, Bradburn MJ, Deeks JJ, Harbord RM, Altman DG, Sterne JAC. Metan: fixed and random-effects meta-analysis. Stata J. 2008;8(1):3-28. doi: 10.1177/1536867X0800800102 [DOI] [Google Scholar]
- 27.Higgins JP, Thompson SG. Quantifying heterogeneity in a meta-analysis. Stat Med. 2002;21(11):1539-1558. doi: 10.1002/sim.1186 [DOI] [PubMed] [Google Scholar]
- 28.Toh S, Gagne JJ, Rassen JA, Fireman BH, Kulldorff M, Brown JS. Confounding adjustment in comparative effectiveness research conducted within distributed research networks. Med Care. 2013;51(8)(suppl 3):S4-S10. doi: 10.1097/MLR.0b013e31829b1bb1 [DOI] [PubMed] [Google Scholar]
- 29.Toh S, Reichman ME, Houstoun M, et al. Multivariable confounding adjustment in distributed data networks without sharing of patient-level data. Pharmacoepidemiol Drug Saf. 2013;22(11):1171-1177. doi: 10.1002/pds.3483 [DOI] [PubMed] [Google Scholar]
- 30.Johansson ALV, Fredriksson I, Mellemkjaer L, et al. Cancer survival in women diagnosed with pregnancy-associated cancer: An overview using nationwide registry data in Sweden 1970-2018. Eur J Cancer. 2021;155:106-115. doi: 10.1016/j.ejca.2021.07.008 [DOI] [PubMed] [Google Scholar]
- 31.Byrom L, Olsen C, Knight L, Khosrotehrani K, Green AC. Increased mortality for pregnancy-associated melanoma: systematic review and meta-analysis. J Eur Acad Dermatol Venereol. 2015;29(8):1457-1466. doi: 10.1111/jdv.12972 [DOI] [PubMed] [Google Scholar]
- 32.Kyrgidis A, Lallas A, Moscarella E, Longo C, Alfano R, Argenziano G. Does pregnancy influence melanoma prognosis? a meta-analysis. Melanoma Res. 2017;27(4):289-299. doi: 10.1097/CMR.0000000000000334 [DOI] [PubMed] [Google Scholar]
- 33.Johansson ALV, Weibull CE, Fredriksson I, Lambe M. Diagnostic pathways and management in women with pregnancy-associated breast cancer (PABC): no evidence of treatment delays following a first healthcare contact. Breast Cancer Res Treat. 2019;174(2):489-503. doi: 10.1007/s10549-018-05083-x [DOI] [PMC free article] [PubMed] [Google Scholar]
- 34.Amant F, Loibl S, Neven P, Van Calsteren K. Breast cancer in pregnancy. Lancet. 2012;379(9815):570-579. doi: 10.1016/S0140-6736(11)61092-1 [DOI] [PubMed] [Google Scholar]
- 35.Cairncross ZF, Nelson G, Shack L, Metcalfe A. Validation in Alberta of an administrative data algorithm to identify cancer recurrence. Curr Oncol. 2020;27(3):e343-e346. doi: 10.3747/co.27.5861 [DOI] [PMC free article] [PubMed] [Google Scholar]
- 36.In H, Bilimoria KY, Stewart AK, et al. Cancer recurrence: an important but missing variable in national cancer registries. Ann Surg Oncol. 2014;21(5):1520-1529. doi: 10.1245/s10434-014-3516-x [DOI] [PubMed] [Google Scholar]
- 37.Warren JL, Yabroff KR. Challenges and opportunities in measuring cancer recurrence in the United States. J Natl Cancer Inst. 2015;107(8):djv134. doi: 10.1093/jnci/djv134 [DOI] [PMC free article] [PubMed] [Google Scholar]
Associated Data
This section collects any data citations, data availability statements, or supplementary materials included in this article.
Supplementary Materials
eTable 1a. Descriptive characteristics of provincial study cohorts: Alberta
eTable 1b. Descriptive characteristics of provincial study cohorts: British Columbia
eTable 1c. Descriptive characteristics of provincial study cohorts: Ontario
eTable 2a. One- and five-year survival rates for pregnancy-associated cancers: Alberta
eTable 2b. One- and five-year survival rates for pregnancy-associated cancers: British Columbia
eTable 2c. One- and five-year survival rates for pregnancy-associated cancers: British Columbia
eTable 3. Pooled crude and adjusted hazard ratios (HR) for mortality in pregnancy-associated cancers in Alberta, British Columbia, and Ontario, Canada
eTable 4a. Provincial crude and adjusted hazard ratios (HR) for mortality in pregnancy-associated cancers: Alberta
eTable 4b. Provincial crude and adjusted hazard ratios (HR) for mortality in pregnancy-associated cancers: British Columbia
eTable 4c. Provincial crude and adjusted hazard ratios (HR) for mortality in pregnancy-associated cancers: Ontario
Data Sharing Statement