

Abstract

We have studied by means of angle-dispersive powder synchrotron X-ray diffraction the structural behavior of KCaPO4, SrKPO4, and K2Ce(PO4)2 under high pressure up to 26, 25, and 22 GPa, respectively. For KCaPO4, we have also accurately determined the crystal structure under ambient conditions, which differs from the structure previously reported. Arguments supporting our structural determination will be discussed. We have found that KCaPO4 undergoes a reversible phase transition. The onset of the transition is at 5.6 GPa. It involves a symmetry decrease. The low-pressure phase is described by space group P3̅m1 and the high-pressure phase by space group Pnma. For KSrPO4 and K2Ce(PO4)2, no evidence of phase transitions has been found up to the highest pressure covered by the experiments. For the three compounds, the linear compressibility for the different crystallographic axes and the pressure–volume equation of states are reported and compared with those of other phosphates. The three studied compounds are among the most compressible phosphates. The results of the study improve the knowledge about the high-pressure behavior of complex phosphates.
Short abstract
The present work focuses on the high-pressure behavior of complex orthophosphates; phase transitions and compressibilities are studied by X-ray diffraction.
Introduction
Inorganic phosphates show a diversity of crystal structures because of their flexibility to accommodate cations with different oxidation states and ionic radii and linkages of phosphate groups, which, in turn, favor the formation of compounds with a wide variety of chemical compositions.1 The most common phosphates are orthophosphates based on the oxianion [PO4]3–, which forms complexes with almost all the cations in the periodic table. Orthophosphates are especially important because of their key roles in biochemistry, biogeochemistry, and ecology and their economic importance for agriculture and industry as lithium-ion technology in the age of electric vehicles.2,3 Besides, they often form water-insoluble or low-leaching complexes with lanthanides and actinides, which makes them promising matrices for separation or immobilization of heavy elements from environmental or nuclear waste.4,5 Also, orthophosphates have also been of interest for several technologically relevant applications, like efficient X-ray scintillation and display materials, and for lightning and stimulated emission sources due to their wide optical band gaps and efficient absorption in the ultraviolet region.6−9 In addition to their technological relevance, the crystal chemistry of orthophosphates has also drawn significant attention for decades due to their structural diversity arising from composition and external parameters such as pressure and temperature.1,10,11 In fact, these external thermodynamic variables are known to influence the structure of orthophosphates and lead to formation of denser polymorphs, which are invariably unstable under ambient conditions. Pressure is a well-established and versatile tool in materials research, as it can modify atomic interactions and chemical bonding, leading in many different oxides to the occurrence of pressure-driven phase transitions.9−11 Multiple high-pressure (HP) studies have been performed in APO4-type phosphates,12−20 where A is a trivalent cation. These APO4-type compounds crystallizing in the zircon-type or monazite-type structures usually undergo phase transitions only at pressure beyond 20 GPa.12,13 However, compounds with more open crystal structures, like berlinite-type AlPO4 and FePO4, undergo phase transitions at relatively lower pressures, 15 and 3 GPa, respectively.14,15 Similarly, in several orthophosphates with multiple cations, phase transitions have been reported at relatively low pressure. For instance, in BaZr(PO4)2, transitions happen at 0.4 and 8 GPa16 and in Pb3(PO4)2 at 1.7 GPa.17 In contrast, K2Ce(PO4)2 undergoes a phase transition at 8.6 GPa,18 and in Ca3(PO4)2 and Sr3(PO4)2, no evidence of phase transitions was reported in studies performed up to 20 GPa.19,20 Clearly, the systematic behavior of orthophosphates under HP is extremely complex and is yet to derive any systematic trend, and hence, additional studies are needed to fully understand it.
In this work, we have investigated the HP behavior of three orthophosphates KCaPO4, KSrPO4, and K2Ce(PO4)2 by means of in situ HP powder X-ray diffraction (XRD). KCaPO4 and KSrPO4 are two of the stable phases in the K2O-Ca/SrO-P2O5 system and have been investigated for their physical properties which make them suitable for solid state lighting, white light-emitting diode applications, or radiation dosimetry.21−23 Although the composition and properties of KCaPO4 and KSrPO4 have been delineated since long, no studies on their HP behavior are available in the literature till date. The crystal structure of KCaPO4 was initially assigned to a trigonal or pseudohexagonal lattice in analogy to α-or β-K2SO4 structures.24 For KSrPO4, an orthorhombic lattice closely related to β-K2SO4 has been assigned.24−26 However, the discrepancy for the model crystal structure of KCaPO4 remained due to an admixture of high- and low-temperature phases. K2Ce(PO4)2 is a recently reported complex phosphate with uncommon Ce4+ ions.27 Owing to the stabilized Ce4+ ions, it shows catalytic properties for organic synthesis involving redox reactions,28 while the zeolitic-like structure makes it a promising material for selective separation of radioactive ions from dilute solutions.29 Temperature-dependent structural studies on K2Ce(PO4)2 indicated a first-order reconstructive monoclinic (space group P21/n) to tetragonal (space group I41/amd) structural transition at high temperature, while no transitions were observed at low temperature.30,31 The structure and stability of K2Ce(PO4)2 suggest that it can be a promising X-ray scintillator and luminescent material.27,32 Preliminarily, HP Raman spectroscopic investigation suggested a possible structural transition in K2Ce(PO4)2 at 8.6 GPa.18 A change in the slopes of pressure-dependent mode frequency or the appearance of several new Raman modes is observed at the transition. However, the crystal structure of the HP phase remained undetermined in the study. In this work, we explore the structural stability of the aforementioned compounds, and additionally, we determine their compressibility and pressure–volume equation of state (EOS). Furthermore, the crystal structure of KCaPO4 under ambient conditions has been reevaluated. Our results are compared with those of previous studies on analogous phosphates.
Methods
KCaPO4 and KSrPO4 were synthesized via a solid-state method using stoichiometric amounts of CaCO3 and SrCO3 (99.0%, Alfa Aesar) and KH2PO4 (99.0%, Loba Chemicals). A homogeneous mixture of the reactants, in the powder form, was placed in a platinum crucible and heated on a hot plate for 30 min at 450 °C. For both samples, the resulting products were homogenized and pelletized and heated again at 500 °C (12 h), 700 °C (18 h), 800 °C (18 h), and then at 850 °C (12 h) using a platinum crucible. After each treatment, the products were reground and pelletized, while the progress of the reaction was monitored by powder XRD after each heat treatment. Formation of single-phase materials was observed in both phosphates after this repeated heat treatment. The obtained KCaPO4 and KSrPO4 products were finally reground and pressed into pellets and heated again at 900 °C for 12 h. This product was used for our HP studies. K2Ce(PO4)2 was prepared by a solid state reaction of CeO2 and freshly prepared KPO3. KPO3 was prepared by decomposing KH2PO4 on a hot plate at 450 °C. The glass-like transparent KPO3 sample was finely ground and thoroughly mixed with CeO2 (99.5%, Indian Rare Earth Ltd.) in a 2:1 molar ratio and pelletized. The pellets were initially heated at 500 °C for 12 h and then at 750 °C for 12 h using a platinum crucible. The final product was characterized by powder XRD and used for HP studies.
HP angle-dispersive powder XRD experiments were carried out at the BL04-MSPD beamline in the ALBA-CELLS synchrotron33 and at the Xpress beamline at the Elettra Synchrotron Facility.34 Membrane-type diamond-anvil cells were used to apply pressure. The diameters of the culets of the diamonds were 350–500 μm. Stainless-steel 301 was used as the gasket material. The gasket was pre-indented to a thickness of 40 μm and a 150–200 μm hole. A 16:3:1 mixture of methanol, ethanol, and water was used as the pressure-transmitting medium. In the experiment performed in KCaPO4, we used the EOS of Cu to determine pressure.35 In the other two experiments, we used the ruby scale to measure pressure.36 In the three experiments, pressures were determined with an accuracy better than 0.05 GPa. KCaPO4 and KSrPO4 were measured at ALBA using a monochromatic X-ray beam with a wavelength of 0.4246 and 0.4642 Å, respectively. The size of the beam spot was 20 × 20 μm. Diffraction images were recorded using a Rayonix SX165 charge-coupled device. The detector parameters were calibrated using LaB6 as the standard. K2Ce(PO4)2 was measured at Elettra using a monochromatic X-ray beam with a wavelength of 0.4956 Å. The size of the beam spot was 80 μm in diameter. Diffraction images were recorded using a PILATUS 3S 6M detector. The detector parameters were calibrated using CeO2 as the standard. The diffraction images were integrated into intensity vs 2θ XRD patterns using the DIOPTAS program.37 Rietveld refinements and Le Bail fits were performed using the FullProf suite.38
Results and Discussion
Crystal Structure of KCaPO4
As mentioned in the Introduction, the crystal structure of KCaPO4 has been first reported by Bredig in analogy to K2SO4 structures, and a trigonal lattice with unit-cell parameters a = 5.58 Å and c = 7.60 Å (space group P3̅m1) has been assigned.23 In addition, the structure has been proposed by considering a statistical distribution of Ca2+ and K+ ions. Since the number of electrons of Ca2+ (20) and K+ (19) cations differs by only one, up to now, it has been assumed that K and Ca occupy the same sites randomly with a partial occupation of 0.5. The atomic coordinates as included in the Inorganic Crystal Structure Database (ICSD), collection code 27958, are given in Table 1. In all the following studies, the crystal structure reported by Bredig24 has been used to identify the KCaPO4 phase. However, the atomic coordinates were not accurate enough to reveal the structural arrangements of the atoms in the unit cell.
Table 1. Atomic Positions and Occupations (Occ.) in the Crystal Structure of KCaPO4 Reported in the ICSD, Structure Number 27958.
| atom | site | x | Y | Z | Occ. |
|---|---|---|---|---|---|
| O1 | 2d | 2/3 | 1/3 | 0.460 | 1 |
| O2 | 6i | 0.200 | –0.200 | 0.200 | 1 |
| Ca1 | 1a | 0 | 0 | 0 | 0.5 |
| K1 | 1a | 0 | 0 | 0 | 0.5 |
| Ca2 | 1b | 0 | 0 | 1/2 | 0.5 |
| K2 | 1b | 0 | 0 | 1/2 | 0.5 |
| Ca3 | 2d | 2/3 | 1/3 | 0.875 | 0.5 |
| K3 | 2d | 2/3 | 1/3 | 0.875 | 0.5 |
| P | 2d | 2/3 | 1/3 | 0.270 | 1 |
The structure as reported by Bredig24 is represented in Figure 1. This structure has several unusual features which suggest that it is probably not the correct crystal structure. The first one is the coordination of phosphor, which is only coordinated with one oxygen atom (P–O distance 1.44 Å), while other P–O distances are 2.85 Å. This arrangement is quite unusual for phosphates, in which the PO43– anion is generally a regular or nearly regular tetrahedron. Indeed, such PO43– is expected for K+Ca2+PO43– also. Another unexpected feature is that Ca and K could occupy randomly with equal probability the 1a site (corners of the structure) and the 1b site (center of the edges and then ran parallel to the c-axis). Notice that both sites have a very different packing density. Atoms in 1a are octahedrally coordinated with oxygen atoms with a bond distance of 2.459 Å, which is usually expected for Ca–O bonds. Atoms in 1b have a different coordination environment, being coordinated with six oxygen atoms at 2.898 Å and six equatorial oxygen atoms at 3.236 Å. Thus, it is more reasonable to expect that Ca, which has a much smaller ionic radius than K, would occupy the 1a site, and K would occupy the 1b site. On top of this, cations at 2b (Ca or K) are only linked to three oxygen atoms with a bond distance of 1.409 Å, which is also very odd. Additionally, Louer et al.(39) reported the crystal structure of a hydrated phase, KCaPO4·H2O, on a monoclinic lattice from powder XRD data. The structure is explained, as expected, by regular PO4 tetrahedra where the Ca and K are completely ordered, maintaining eight coordinated polyhedral units around them. Furthermore, the Ca atoms are connected to six oxygen atoms of four PO4 tetrahedra and additional two oxygen atoms from water molecules, while the K atoms are linked to eight oxygen atoms of four tetrahedral PO4 units. Thus, the coordination of K and Ca reported for KCaPO4 by Bredig24 needs rectification, and the described drawbacks might be due to poor data quality or refinements. Similar difference is also observed in comparison to the structure of trigonal NaBaPO4 reported by Launay et al.(25) To clarify these issues, we have measured a powder XRD pattern of KCaPO4 under ambient conditions and refined the crystal structure, which turns out to be different than the previously reported structure.
Figure 1.

Schematic view of the KCaPO4 crystal structure reported by Bredig.24 Calcium/potassium shading atoms are represented in blue/purple with 50% of occupancy. Phosphor atoms are shown in the gray color and oxygen atoms in the red color. In the figure, the unusual coordination of phosphor atoms can be seen.
For the structural assignation, we first indexed the XRD patterns using DICVOL40 and then assigned the symmetry. It is found that the space group P3̅m1 gives the best figure of merit, which agrees with the space group reported by Bredig.24 Subsequently, we determine atomics positions from Rietveld refinements, which were performed using as the starting point the known crystal structure but under the assumption that Ca atoms occupy the 1a site and K atoms occupy the 1b site, both with full occupation. In addition, they also share a 2d position as in the previously proposed crystal structure.24 Besides, the oxygen (O2) positions are assigned by rotating them by 120° in the ab-plane. Figure 2 shows the Rietveld refinement pattern of XRD data of KCaPO4. The structure that we have obtained gives better goodness-of-fit parameters than the structure currently used in the literature,23 and it is more reasonable from a crystal chemistry point of view. The goodness-of-fit parameters are wRp = 2.40%, Rp = 1.85%, R(F2) = 7.44%, and χ2 = 1.37. If the structure reported by Bredig24 was assumed, the goodness-of-fit parameters were wRp = 21.10%, Rp = 15.76%, R(F2) = 26.64%, and χ2 = 2.54. The improvement in the refinement and the fact that our reported structure is chemically more plausible support the crystal structure that we are proposing. The obtained unit-cell parameters are a = 5.4994(5) Å and c = 7.5701(7) Å. The atomic positions are reported in Table 2. A complete crystallographic information of the structures can be obtained from the Cambridge Crystallographic Data Centre (CCDC) under deposition number 2192664.
Figure 2.

XRD pattern measured in KCaPO4 under ambient conditions (λ = 0.4246 Å).
Table 2. Atomic Positions and Occupations (Occ.) of the Crystal Structure of KCaPO4 Here Determined.
| atom | site | x | y | z | Occ. |
|---|---|---|---|---|---|
| O1 | 2d | 2/3 | 1/3 | 0.4750(9) | 1 |
| O2 | 6i | –0.1948(9) | 0.1948(9) | 0.2311(9) | 1 |
| Ca1 | 1a | 0 | 0 | 0 | 1 |
| K1 | 1b | 0 | 0 | 1/2 | 1 |
| Ca2 | 2d | 2/3 | 1/3 | 0.7366(2) | 0.5 |
| K2 | 2d | 2/3 | 1/3 | 0.7366(2) | 0.5 |
| P | 2d | 2/3 | 1/3 | 0.2910(1) | 1 |
The proposed crystal structure is represented in Figure 3. It has two formula units per unit cell and is isomorphic to the structure of NaBaPO4.25 It contains chains aligned along the c-axis and composed of alternate CaO6 octahedra and KO12 dodecahedra that share triangular faces. The distorted CaO6 units share oxygen atoms with six separate PO4 tetrahedra. Each 12-fold coordination polyhedron of K is formed by 6 oxygen atoms in a similar configuration to that in the CaO6 octahedron, while additional 6 oxygen atoms are nearly coplanar and lie approximately in the equatorial plane of this cation. The remaining cations of Ca and K atoms are randomly located with a 1/2 occupation at sites of 3m symmetry, being aligned along the c-axis with P atoms. These Ca(K) cations are coordinated with seven oxygen atoms forming a hexagonal pyramid. The cations are at the center of the base of the pyramid connected to six nearly coplanar oxygen atoms, with bond distance 2.773(2) Å. The seventh oxygen atom is in the vertex of the pyramid. This bond is shorter than the other six bonds [bond distance 1.980(1) Å], and the oxygen atom is shared with a PO4 tetrahedron. On the opposite side of the vertex, there are three oxygen atoms at 3.770(2) Å from Ca(K), making a Ca(K)O10 pseudo-polyhedron. The bond distances are 2.550(2) Å in the CaO6 octahedron, 2.754(2) and 3.180(3) Å in the KO12 polyhedron, and 1.393(1) and 1.395(1) Å in the PO4 tetrahedron which is nearly regular. PO4 and Ca(K)O10 make a linear chain. These chains are the link between CaO6–KO12 units, giving three-dimensional cohesion to the crystal structure.
Figure 3.

Schematic view of the crystal structure of KCaPO4 proposed here. Calcium atoms are represented in blue, while potassium atoms are represented in purple (shading atoms represent 50% of occupancy). Phosphor atoms are in gray, and oxygen atoms are in the red color. It can be seen that in this structure, phosphor is in tetrahedral coordination.
KCaPO4 under High Pressure
In Figure 4, we present a selection of XRD patterns collected under compression up to 26 GPa. From ambient pressure (10–4 GPa) up to 4.8 GPa, the XRD patterns can be undoubtedly assigned to the low-pressure (LP) phase. In addition to the peaks from the sample, three peaks from Cu (the pressure standard) are detected. Evidence of the correct structural identification can be seen in the Rietveld refinement of the experiment carried out at 10–4 GPa (see Figure 4). When increasing the pressure to 5.6 GPa, several extra peaks appear in the XRD pattern. They can be clearly identified in the low-angle part of the XRD pattern and are denoted with asterisks in Figure 4. We consider this fact an indication of the onset of a structural phase transition. As pressure increases, the extra peaks become stronger, and the peaks of the LP phase become weaker. To highlight this phenomenon, in Figure 4, we follow with a solid line the pressure evolution of one peak of the emerging phase, which is at 2θ = 8.6° at 5.6 GPa. As this peak grows, the peak from the LP phase on its left shrinks even if it can be detected up to 12.6 GPa as a shoulder to the more intense peak (as indicated by an arrow). We have been able to identify all peaks at 13.7 GPa as due to Cu and a phase different than the LP structure. Thus, we assume that the phase transition is completed at 13.7 GPa. The phase coexistence from 5.6 to 12.6 GPa suggests that the sample undergoes a first-order phase transition.
Figure 4.
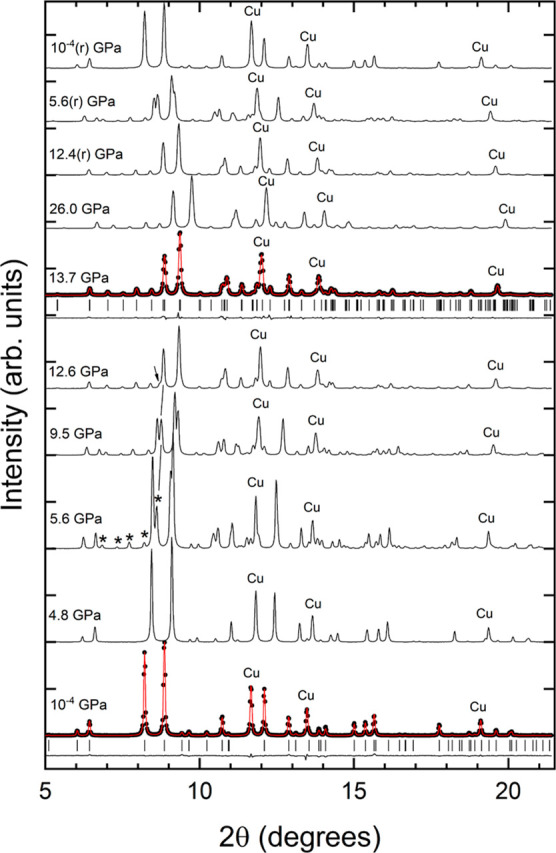
HP XRD patterns measured for KCaPO4 (λ = 0.4246 Å). At 10–4 and 13.7 GPa, experiments are shown as solid symbols, refinements as red lines, and residuals as black lines. The ticks show the position of calculated reflections. Pressures are indicated in the figure; (r) is used to identify experiments performed during pressure release. Cu peaks used for pressure determination are labeled as Cu. At 5.6 GPa, the asterisk shows emerging peaks. At 12.6 GPa, the arrows show a weak peak from the LP phase. The peak at 5.6, 9.5, and 12.6 GPa connected by solid lines is the peak discussed in the text to show the gradual transformation of the sample.
The XRD pattern measured at 13.7 GPa was indexed using DICVOL40 to determine the unit-cell parameters. From a list of the first 10 peaks (to avoid overlap with Cu peaks), the highest figures of merit have been obtained for an orthorhombic lattice with unit-cell parameters a = 6.930(1) Å, b = 5.196(1) Å, and c = 9.034(2) Å. These parameters resemble those of the orthorhombic structures of KSrPO4 [a = 7.352(2) Å, b = 5.561(1) Å, and c = 9.642(3) Å]26 and KBaPO4 [a = 7.709(4) Å, b = 5.663(4) Å, and c = 9.972(5) Å].41 Both compounds are isomorphic and described by the orthorhombic space group Pnma. According to the systematic approach proposed by Bastide, the pressure-induced transitions may occur from the structure of a given compound to that of a larger-cation-hosting compound.42,43 The presently observed unit cell is in accordance with the Bastide structural systematic approach. Thus, an isomorphic structure like KSrPO4 or KBaPO4 may be logical to consider model candidates for the HP phase of KCaPO4. A model using the unit-cell parameters from our XRD pattern observed at 13.7 GPa and atomic positions from KSrPO4 (substituting Sr for Ca) has allowed us to satisfactorily explain the complete XRD pattern. The quality of the refinement and the small residuals can be seen in Figure 4. The goodness-of-fit parameters are wRp = 3.22%, Rp = 2.85%, R(F2) = 9.27%, and χ2 = 1.93. Thus, we consider that a very probable structure for the HP phase of KCaPO4 could be obtained. The atomic positions at 13.7 GPa are given in Table 3. The complete crystallographic data can be obtained from CCDC 2192910.
Table 3. Atomic Positions and Occupations (Occ.) of the HP Crystal Structure of KCaPO4 at 13.7 GPa.
| atom | site | x | y | z | Occ. |
|---|---|---|---|---|---|
| O1 | 4c | 0.3145(9) | 1/4 | 0.0663(9) | 1 |
| O2 | 8d | 0.2921(9) | 0.0252(9) | 0.8447(9) | 1 |
| O3 | 4c | 0.5095(9) | 1/4 | 0.5883(9) | 1 |
| Ca | 4c | 0.9976(6) | 1/4 | 0.1969(6) | 1 |
| K | 4c | 0.1590(6) | 1/4 | 0.5858(6) | 1 |
| P | 4c | 0.2297(3) | 1/4 | 0.9183(3) | 1 |
The crystal structure of the HP phase is shown
in Figure 5. It contains
four formula
units per unit cell, with no fractional occupations. Interestingly, c/b ≈√3 which implies that the crystal structure
is ortho-hexagonal. Upon comparing the HP structure with the trigonal
LP structure, it can be noticed that the lattice parameter a in the orthorhombic structure is nearly equal to the lattice
parameter c in the trigonal structure. On the other
hand, b and c/ of the orthorhombic structure
are similar
to the lattice parameter a in the trigonal structure.
Thus, the structures of the transformed HP and LP phases of KCaPO4 are closely related, and they can be compared by considering
the unit cell relations, as aHP ∼ cLP, bHP ∼ aLP, and
of the orthorhombic structure
are similar
to the lattice parameter a in the trigonal structure.
Thus, the structures of the transformed HP and LP phases of KCaPO4 are closely related, and they can be compared by considering
the unit cell relations, as aHP ∼ cLP, bHP ∼ aLP, and  .
.
Figure 5.

Schematic view of the HP crystal structure of KCaPO4. Calcium atoms are represented in blue. Potassium atoms are represented in purple, phosphor atoms in gray, and oxygen atoms in the red color.
The LP and HP structures of KCaPO4 are compared in Figure 6 where we present a perspective of each structure which highlights the similitudes and differences between them. The figure also allows us to understand the mechanism behind the transition. At the transition, there is not only a change of the axial ratio (c/a in the trigonal LP phase is 1.37, and a/b in the orthorhombic HP structure is 1.32) but also important atomic displacements which involve the formation of new bonds. Also, both structures are closely related to the LT and HT polymorphs of K2SO4.44,45 Essentially, both the structures are formed by packing of the PO43– anions and K+ and Ca2+ ions. This can be visualized easily from the cation-ordered HP KCaPO4. There is a stacking of K+ and PO43– layers sandwiched between layers of Ca2+ ions. This can be also seen in Figure 6. Calcium and potassium atoms are surrounded by PO4 tetrahedra in a compact arrangement. The PO4 tetrahedron is slightly distorted with an average P–O distance of 1.452(1) Å. The movements of the ions in the LP KCaPO4 under pressure resulted in a distorted structure which, in turn, resulted in an ortho-hexagonal arrangement. This also justifies our observation of the cation-ordered structure for LP KCaPO4.
Figure 6.

Perspectives of the LP (a) and HP (b) structures of KCaPO4. Calcium atoms are represented in blue. Potassium atoms are represented in purple, phosphor atoms in gray, and oxygen atoms in the red color.
Furthermore, in the HP phase, Ca is coordinated with 9 oxygen atoms, with an average bond distance of 2.553(5) Å, and K is coordinated with 11 oxygen atoms, with an average distance of 2.732(5) Å. The movement of ions in the ab plane of the trigonal structure, which is equivalent to the bc-plane of the orthorhombic phase, is mostly brought about by the compression of the c-axis of the trigonal phase. This also results in a better packing by rendering the effective coordination for the K and Ca atoms. This is also in accordance with the reconstructive nature of the LP to HP transformation. The observed coexistence of phases and the absence of a group–subgroup relationship between the symmetries of the two phases support the fact that the phase transition is of the first order. In addition, it may be mentioned here that it is also possible that the symmetry of the LP phase is further lower where the K2 and Ca2 atoms are orderly occupied in two distinct sites with half occupancy. Additional support to this conclusion will come when discussing the pressure dependence of the unit-cell volume.
Upon further compression beyond 13.7 GPa, we did not find any evidence of additional phase transitions. All XRD patterns measured up to 26 GPa can be identified within the same HP phase of the XRD pattern measured at 13.7 GPa. Figure 4 shows that the only changes from the XRD pattern at 26 GPa and the one at 13.7 GPa are the shift toward higher angles of peaks due to the contraction of unit-cell parameters, when pressure is increased. Pressure has been decreased from 26 GPa to ambient pressure (10–4 GPa) in three steps. At 12.4 GPa, only the HP phase has been observed. At 5.6 GPa, the coexistence of the two phases was observed, and at ambient pressure, the LP phase had been recovered, with the phase transition therefore being reversible.
From measured XRD patterns, we have obtained the pressure dependence of unit-cell parameters for the LP and HP phases. The results are present in Figure 7, which shows that the unit-cell parameters follow a nearly linear dependence on pressure. As shown in the figure, at the phase transition, there is a discontinuity of the c-axis of the LP phase (which corresponds to the a-axis of the HP phase). There is also a 1.5% contraction of the unit-cell volume, which is larger than the error for volume determination. This supports the fact that the observed transition is of the first order. From the results, the linear compressibility has been determined for different axes (linear fits are shown as solid lines). In the LP phase, κa = 4.38(4) 10–3 GPa–1 and κc = 4.71(4) 10–3 GPa–1. Consequently, compression is slightly anisotropic, with the c-axis being the most compressible axis. In addition, for the HP, we have obtained κa = 2.31(8) 10–3 GPa–1, κb = 3.75(8) 10–3 GPa–1, and κc = 3.30(8) 10–3 GPa–1. Then, the HP phase has a highly anisotropic response to pressure, with the a-axis being the least compressible axis. As the a-axis of the HP phase is equivalent to the c-axis, the movement of ions might be restricted by the arrangement of ions to attain effective coordination for all. Regarding the pressure dependence of the unit-cell volume of the different structures, we have analyzed it using a third-order Birch–Murnaghan EOS.46 Fits have been carried out using EosFit7.47 The determined values for the ambient-pressure volume (V0), ambient-pressure bulk modulus (K0), and its pressure derivative (K0′) and the implied value of the second pressure derivative (K0″) are for the LP phase, V0 = 198.3(2) Å3, K0 = 49(2) GPa, K0′ = 4.03(0.28), and K0″ = −0.0796 GPa–1 and for the HP phase, V0 = 390.2(5) Å3, K0 = 50(2) GPa, K0′ = 3.97(0.33), and K0″ = −0.0769 GPa–1, respectively. The values obtained for K0′ in both fits indicate that the EOSs are compatible with a second-order EOS (B0′ = 4). The bulk moduli of both phases agree with each other within error bars. Since the values of K0 and K0′ from both phases agree within experimental uncertainties, both phases have a very similar volumetric resistance to compression.
Figure 7.

Pressure dependence of unit-cell parameters (top) and volume (bottom). Circles (squares) are the results from the low (high)-pressure phase. Solid (empty) data have been measured during compression (decompression). For the HP phase, we plot c/√3 and V/2 to facilitate comparison with the LP phase. Solid lines are the fits described in the text. Error bars are smaller than symbol size.
KSrPO4 under High Pressure
The structure of KSrPO4 is shown in Figure 8. Our study shows that this compound does not undergo any phase transition up to 25 GPa. In Figure 9, we present a selection of XRD patterns collected under compression up to 25 GPa. In this compound, all the XRD patterns can be undoubtedly assigned to the LP phase. This conclusion is supported by the Rietveld refinement of the experiment carried out at 10–4 GPa [wRp = 3.51%, Rp = 2.66%, R(F2) = 4.82%, and χ2 = 1.60] and the Le Bail fit performed at 25 GPa [wRp = 2.97%, Rp = 2.32%, R(F2) = 4.12%, and χ2 = 1.32]; see Figure 9. The above-mentioned ambient-pressure XRD patterns were affected by preferred orientations due to the small number of crystalline domains in the micron-sized X-ray beam. Such effects are the cause of change in the relative intensity of peaks with pressure increasing (see in Figure 9 XRD patterns at 8.8, 12.2, and 17.8 GPa). Above 12.2 GPa, we noticed a peak broadening, which could be caused by non-hydrostatic stresses. However, all peaks in XRD can be undoubtedly identified within the ambient-pressure phase. After the decompression, the XRD pattern measured at the lowest pressure (1.6 GPa) shows that changes in the crystal structure are reversible.
Figure 8.

Schematic view of the crystal structure of KSrPO4. Strontium atoms are represented in green, potassium atoms in purple, phosphor atoms in gray, and oxygen atoms in the red color.
Figure 9.

HP XRD patterns measured in KSrPO4 (λ = 0.4246 Å). At 10–4 and 25 GPa, experiments are shown as solid symbols, refinements as red lines, and residuals as black lines. The ticks show the position of calculated reflections. Pressures are indicated in the figure; (r) is used to identify an experiment performed after decompression.
From XRD experiments, we have determined the pressure dependence of unit-cell parameters. The results are represented in Figure 10. The unit-cell parameters follow a quadratic dependence on pressure, with a nearly linear behavior up to 10 GPa. Using results from this pressure range, we have determined the linear compressibility for each axis. For KSrPO4, we have obtained κa = 4.24(4) 10–3 GPa–1, κb = 4.80(5) 10–3 GPa–1, and κc = 4.16(2) 10–3 GPa–1. The compressibility is thus slightly anisotropic. We have found that the b-axis is the most compressible axis. By using the results obtained up to 10 GPa, we have also determined the EOS parameters for KSrPO4. Again, we used a third-order Birch–Murnaghan EOS46 and the program EosFit7.47 The ambient-pressure volume (V0), ambient-pressure bulk modulus (K0), its pressure derivative (K0′), and the implied value of the second pressure derivative (K0″) are V0 = 393.9(5) Å3, K0 = 60(2) GPa, K0′ = 7.2(5), and K0″ = −0.3195 GPa–1, respectively. Both K0 and K0′ are larger than those in KCaPO4, which indicates that KSrPO4 is less compressible than KCaPO4. Furthermore, the ratio of axial compressibility of HP-KCaPO4 and KSrPO4 suggests that the compressibility is strongly reduced in HP-KCaPO4 compared to that in KSrPO4, which might be due to more compact atomic arrangement. The experimental EOS is shown as a solid line in Figure 10. If the EOS is extrapolated to pressures higher than 10 GPa, it describes very well the results from experiments up to 17.2 GPa. However, beyond this pressure, the experiments show a decrease in the compressibility. We believe that this phenomenon is caused by non-hydrostatic stresses, which usually tends to artificially reduce the compressibility.48
Figure 10.

Pressure dependence of unit-cell parameters (top) and volume (bottom). Symbols are results from experiments. Solid (empty) data have been measured during compression (decompression). We plot c/√3 to facilitate comparison with b. Solid lines are the fits described in the text. Error bars are smaller than symbol size.
K2Ce(PO4)2 under High Pressure
The structure of K2Ce(PO4)2 obtained from this study is shown in Figure 11. Our experiments show that the ambient-pressure structure (space group P21/n) remains stable up to 21.6 GPa. In Figure 12, we report a selection of XRD patterns collected under compression. All XRD patterns can be undoubtedly assigned to the LP phase. This conclusion is supported by the Rietveld refinement of the experiment carried out at 0.1 GPa [wRp = 3.23%, Rp = 2.93%, R(F2) = 4.17%, and χ2 = 1.49] and the Le Bail fit performed at 21.6 GPa [wRp = 4.12%, Rp = 3.13%, R(F2) = 5.19%, and χ2 = 2.03]; see Figure 12. Starting at 13.8 GPa, we observed a peak broadening, which becomes more evident as pressure increases. This may be caused by non-hydrostatic stresses. However, all peaks in XRD can be assigned to the ambient-pressure phase, thus excluding the existence of a phase transition. After the decompression, the XRD pattern at the lowest measured pressure (3.4 GPa) shows that changes in the crystal structure are reversible.
Figure 11.

Schematic view of the HP crystal structure of K2Ce(PO4)2. Cerium atoms are represented in yellow, potassium atoms in purple, phosphor atoms in gray, and oxygen atoms in the red color.
Figure 12.

HP XRD patterns measured in K2Ce(PO4)2 (λ = 0.4956 Å). At 0.1 and 21.6 GPa, experiments are shown as solid symbols, refinements as red lines, and residuals as black lines. The ticks show the position of calculated reflections. Pressures are indicated in the figure; (r) is used to identify an experiment performed after decompression.
Previous Raman experiments performed under high pressure using 4:1 methanol–ethanol as pressure medium reported a phase transition starting at 8.6 GPa and being completed at 14.4 GPa.18 The existence of the phase transition was postulated to explain changes in the intensity of Raman modes and the broadening of internal modes.20 One possibility to explain this apparent discrepancy is the presence of different non-hydrostatic conditions in experiments.49 However, our pressure medium (16:3:1 methanol–ethanol–water) provides a similar high-pressure environment to 4:1 methanol–ethanol.50 A more plausible explanation would be the bridging of the sample between diamonds, which could have strongly influenced the results of high-pressure studies. In our case, we have carefully loaded the diamond-anvil cell to avoid sample bridging. The fact that peak broadening starts in our study at 13.8 GPa but in Raman experiments at 8.6 GPa suggests that sample bridging could have affected the Raman experiments. Such a phenomenon has been found to anticipate phase transitions by more than 10 GPa in oxides like ScVO4.51 Further studies are needed to understand the influence that deviatoric stresses could have on the HP behavior of K2Ce(PO4)2.
From XRD experiments, we have determined the pressure dependence of unit-cell parameters. The results are shown in Figure 13. The lattice parameters a, b, and c follow a similar dependence on pressure, with the last parameter being slightly more compressible than the other. On the other hand, the β angle increases under compression following a non-linear behavior. In the case of a monoclinic structure such as K2Ce(PO4)2, its compressibility should be analyzed by means of the eigenvalues and eigenvectors of the isothermal compressibility tensor.52 In our case, we performed this analysis using PASCAL.53 We have found that compression is anisotropic and that the maximum, intermediate, and minimum compressibilities are 5.79(9) 10–3 GPa–1, 4.22(6) 10–3 GPa–1, and 2.64(2) 10–3 GPa–1, respectively. The crystallographic directions corresponding to each of the main axes of compressibility are (0.3586, 0, 0.9335), (−0.9903, 0, 0.1388), and (0, 1, 0). By using the results obtained up to 10 GPa, we have determined the EOS parameters for K2Ce(PO4)2. We used a third-order Birch–Murnaghan EOS46 and the program EosFit7.47 The ambient-pressure volume (V0), ambient-pressure bulk modulus (K0), its pressure derivative (K0′), and the implied value of the second pressure derivative (K0″) are V0 = 705.3(1.5) Å3, K0 = 52.0(2.5) GPa, K0′ = 5.7(6), and K0″ = −0.1595 GPa–1, respectively. The obtained bulk modulus agrees with the value previously obtained from density-functional theory calculations, K0 = 49 GPa.18 The experimental EOS is represented as a solid line in Figure 13. If extrapolated to pressures higher than 10 GPa, it described well the results from experiments up to 13.8 GPa. Beyond this pressure, the experiments show a decrease in the compressibility. As it happens in KSrPO4, we consider that this is caused by non-hydrostatic stresses.31
Figure 13.

Pressure dependence of unit-cell parameters (top) and volume (bottom). The inset shows the pressure dependence of the angle β. Symbols are results from experiments. Solid (empty) data have been measured during compression (decompression). The solid line is the EOS fit described in the text. Error bars are smaller than symbol size.
Discussion
We have found that KSrPO4 and K2Ce(PO4)2 remain stable up to 26 and 21.6 GPa. In contrast, we have discovered the onset of a phase transition in KCaPO4 at 5.6 GPa. The range of stability of the first two compounds is comparable to that of the most stable orthophosphates, for instance, zircon-type,12 monazite-type,13 olivine-type,54 and whitlockite-type.19,20 The stability of these compounds is related to the fact that the increasing repulsive and steric stresses induced by pressure can be accommodated by the deformation of the outer shell of the cations and by the tilting of the cationic polyhedra, which are connected by very rigid and uncompressible PO4 tetrahedra. The case of KCaPO4 is totally different. We are confident that the existence of the phase transition under HP is inherent to the material because the three experiments were performed in the same quasi-hydrostatic environment (same pressure medium). We believe that the transition is favored by two facts: (i) the disorder of the Ca and K atoms at 2d sites, which are randomly distributed in the crystal structure, making it less stable and (ii) the presence of unusually asymmetric Ca(K)O10 polyhedra which could also trigger structural instabilities under compression. Notice, in fact, that after the phase transition, the two previously described unusual features of the LP phase of KCaPO4 disappear due to the structural reorganization triggered by the transition.
Now, we will compare the bulk modulus of the three studied orthophosphates. Given the fact that K0 and K0′ are correlated, a proper comparison can only be made by plotting K0′ versus K0, including confidence ellipses of the fits, as reported in Figure 14.55 In the figure, it can be seen that there is no overlap between the confidence ellipses and that both K0 and K0′ increase following the sequence KCaPO4 < K2Ce(PO4)2 < KSrPO4. This indicates that their compressibility decreases following the same sequence. On the other hand, the three compounds have bulk moduli comparable to those of the most compressible phosphates in nature. This can be seen in Table 4 where we compare KCaPO4, K2Ce(PO4)2, and KSrPO4 with previously studied phosphates.56−70 Only berlinite-type AlPO416 and FePO415 and SbPO467 are more compressible than the phosphates that we have studied here. Berlinite-type phosphates are more compressible because berlinite is a low-density and open structure which consists of alternating AlO4(FeO4) and PO4 tetrahedra linked with vertices and thus can easily accommodate compression. SbPO4 is highly compressible because of the presence of a lone electron pair associated with Sb, which gives the crystal structure a layered characteristic where layers are weakly bonded to each other, favoring a rapid decrease of volume under compression.
Figure 14.

K0′ versus K0. Values from the three studied compounds are included (see the legend). Confidence ellipses are shown.
Table 4. Bulk Moduli of Different Phosphates.
| compound | K0 (GPa) | K0′ | reference |
|---|---|---|---|
| KCaPO4 | 49.3(2.0) | 4.1(3) | this work |
| KSrPO4 | 60.2(2.0) | 7.3(4) | this work |
| K2Ce(PO4)2 | 52.0(2.5) | 5.7(6) | this work |
| K2Ce(PO4)2 | 49 | (18) | |
| FePO4 | 25.4(3) | 4 | (15) |
| AlPO4 | 34 | 4 | (14) |
| α-Ca3(PO4)2 | 79(2) | 4 | (56) |
| β-Ca3(PO4)2 | 81(3) | 4.8(5) | (56) |
| γ-Ca3(PO4)2 | 100(13) | 5.48(16) | (57) |
| Sr3(PO4)2 | 89(2) | 6.6(3) | (20) |
| Pb3(PO4)2 | 89(4) | 5.8(2) | (17) |
| Ca9NaMg(PO4)7 | 82(10) | 4 | (58) |
| Zn2P2O7 | 81(2) | 5.0(5) | (59) |
| Ca5(PO4)30H | 97(3) | 4 | (60) |
| NaZr2(PO4)3 | 53 | (61) | |
| BaZr(PO4)2 | 52 | 1.2 | (16) |
| Na3Fe(PO4)(CO3) | 56(1) | 3.3(1) | (62) |
| Na3Mn(PO4)(CO3) | 54(1) | 3.3(1) | (62) |
| Na3Mg(PO4)(CO3) | 60(1) | 3.9(7) | (63) |
| LiNiPO4 | 88(2) GPa | 3.5(5) | (55) |
| RbTi2(PO4)3 | 104 | (64) | |
| InPO4 | 97(6) | 7(3) | (65) |
| BiPO4 monazite | 99(2) | 5.8(3) | (66) |
| BiPO4 HT phase | 78(4) | 4 | (66) |
| CePO4 hexagonal | 83.9(7) | 3.7(3) | (67) |
| CePO4 monazite | 120(2) | 3.4(4) | (68) |
| SbPO4 | 36(3) | 6(2) | (69) |
| HoPO4 | 152(3) | 4.2(9) | (12) |
| TmPO4 | 142(1) | 5.06(4) | (12) |
| ScPO4 | 203(7) | 4 | (13) |
| LuPO4 | 184(4)–166 | 4 | (13) |
| YbPO4 | 150(5) | 4 | (13) |
| ErPO4 | 168(4) | 4 | (13) |
| YPO4 | 132–149(2)–186(5) | 4 | (13) |
| GdPO4 | 160(2) | 4 | (13) |
| EuPO4 | 159(2) | 4 | (13) |
| NdPO4 | 170(2) | 4 | (13) |
| LaPO4 | 144(2) | 4 | (13) |
| CaTh(PO4)2 | 140 | 4 | (70) |
As established from the study of different oxides,10,11 as a first approximation, the bulk modulus is mainly determined by the compressibility of the most compressible polyhedral units. In the compounds here studied, these are the coordination polyhedra of potassium. The K–O bonds are longer than 3 Å being the weakest bonds in the structures. Harlow71 has shown that K–O bond lengths compress significantly with pressure. This conclusion is supported by the fact that K2O has a bulk modulus of 39 GPa.72 Therefore, the three studied compounds are very compressible compared with most phosphates. This hypothesis is also consistent with the fact that Na3Fe(PO4)(CO3), Na3Mn(PO4)(CO3), and Na3Mg(PO4)(CO3) have bulk moduli in the range of 54–60 GPa as a consequence of the large compressibility of Na–O bonds. Based on these arguments, we can foresee that related compounds like KBaPO4 and NaBaPO4 would have bulk moduli in the range of 50–60 GPa. It has been proposed that phase-transition pressures of phosphates could be directly correlated to the bulk modulus of the material.59 The higher this parameter, the higher the transition pressure. However, this hypothesis is ruled out by the results summarized in Table 4. It is true that the less compressible phosphates (those with the largest bulk modulus), like zircon-type phosphates, are highly stable. Nevertheless, BaZr(PO4)2, with a bulk modulus of 52 GPa, identical to the bulk modulus of K2Ce(PO4)2, undergoes a phase transition at 0.4 GPa,9 while K2Ce(PO4)2 remains stable up to 22 GPa; Pb3(PO4)2 with a bulk modulus of 89 GPa, much larger than the bulk moduli of the phosphates here studied, undergoes a phase transition at 1.7 GPa, while KCaPO4, K2Ce(PO4)2, and KSrPO4 remain stable up to much higher pressures. Clearly, additional factors, besides compressibility, play a role in crystal stability of phosphates, and further studies will be needed to clarify them. To conclude, we would like to comment that from the conclusions of the present work, it could be foreseen that related materials like KBePO4 and KMgPO4 would have bulk moduli close to 50 GPa and would retain the LP structure up to similar pressures to KSrPO4.
Conclusions
In summary, we have performed HP powder XRD in KCaPO4, K2Ce(PO4)2, and KSrPO4. The ambient-pressure crystal structure of KCaPO4 has been reassigned, and an HP-induced structural phase transition is observed at 5.5 GPa. The phase transition involves a transformation from the ambient-pressure trigonal structure to an HP orthorhombic structure, which is isostructural to KSrPO4. The HP phase remains stable up to 26 GPa, and the phase transition is reversible. No phase transition has been found for K2Ce(PO4)2 and KSrPO4 up to 21.6 and 25 GPa, respectively. The pressure–volume data of the different phosphates has been analyzed using the Birch–Murnaghan EOS. The zero-pressure bulk moduli obtained show that these parameters increase following the sequence KCaPO4 < K2Ce(PO4)2 < KSrPO4. Their linear compressibilities have been also determined. The results show that KCaPO4 and KSrPO4 are slightly anisotropic and K2Ce(PO4)2 highly anisotropic. The results have been discussed in comparison with the HP behavior of other phosphates. The three studied compounds are among the most compressible phosphates.
Acknowledgments
D.E. acknowledges the financial support from the Generalitat Valenciana under grant nos. PROMETEO CIPROM/2021/075-GREENMAT and MFA/2022/007 and Spanish Ministerio de Ciencia e Innovación and Agencia Estatal de Investigación (MCIN/AEI/10.13039/501100011033) and the European Union under grant nos. PID2019-106383GB-41 and RED2018-102612-T (MALTA Consolider-Team network). This study forms part of the Advanced Materials program and is supported by MCIN with funding from European Union Next Generation EU (PRTR-C17.I1) and by the Generalitat Valenciana. D.D.A. acknowledges the PhD fellowship granted by the Generalitat Valenciana (ACIF/2020/009). E.B. would like to thank the Universitat Politècnica de València for his post-doctoral contract (PAID-10-21). The authors also thank the ALBA synchrotron light source for providing beamtimes under proposal numbers 2020074395 and 2021085226 and the MSPD-BL04 beamline and Elettra Synchrotron Facility for providing beamtime under proposal number 20215005 at the Xpress beamline.
Author Contributions
D.E. and S.N.A. conceived the project. S.N.A., R.S., and A.K.T. synthesized the samples. D.E., D.D.-A., E.B., T.M., C.P., and F.G.A. performed the experiments. D.E. and S.N.A. performed data analysis. D.E., S.N.A., E.B., A.K.T., C.P., and F.G.A. contributed to discussions, writing, and editing of the manuscript.
The authors declare no competing financial interest.
Notes
The data that support the findings of this study are available from the corresponding author upon reasonable request.
References
- Achary S. N.; Bevara S.; Tyagi A. K. Recent progress on synthesis and structural aspects of rare-earth phosphates. Coord. Chem. Rev. 2017, 340, 266–297. 10.1016/j.ccr.2017.03.006. [DOI] [Google Scholar]
- Boatner L. A.; Sales B. C.; Monazite. Radiation Waste Forms for the Future; Lutze W., Ewing R. C., Eds.; North-Holland: Amsterdam, 1988; pp 495–564. [Google Scholar]
- Harper G.; Sommerville R.; Kendrick E.; Driscoll L.; Slater P.; Stolkin R.; Walton A.; Christensen P.; Heidrich O.; Lambert S.; Abbott A.; Ryder K.; Gaines L.; Anderson P. Recycling lithium-ion batteries from electric vehicles. Nature 2019, 575, 75–86. 10.1038/s41586-019-1682-5. [DOI] [PubMed] [Google Scholar]
- Clavier N.; Dacheux N.; Podor R. Synthesis Characterization, Sintering, and Leaching of β-TUPD/Monazite Radwaste Matrices. Inorg. Chem. 2006, 45, 220–229. 10.1021/ic051607p. [DOI] [PubMed] [Google Scholar]
- Vergeer P.; Vlugt T. J. H.; Kox M. H. F.; den Hertog M. I.; van der Eerden J. P. J. M.; Meijerink A. Quantum cutting by cooperative energy transfer in YbxY1–xPO4:Tb3+. Phys. Rev. B: Condens. Matter Mater. Phys. 2005, 71, 014119. 10.1103/physrevb.71.014119. [DOI] [Google Scholar]
- Wisniewski D.; Wojtowicz A. J.; Drozdowski W.; Farmer J. M.; Boatner L. A. Rb3Lu(PO4)2:Ce and Cs3Lu(PO4)2:Ce – new promising scintillator materials. Cryst. Res. Techn. 2003, 38, 275–282. 10.1002/crat.200310031. [DOI] [Google Scholar]
- Villa E. M.; Marr C. J.; Jouffret F. J.; Alekseev E. V.; Depmeier W.; Albrecht-Schmitt T. E. Systematic Evolution from Uranyl(VI) Phosphites to Uranium(IV) Phosphates. Inorg. Chem. 2012, 51, 6548–6558. 10.1021/ic3000735. [DOI] [PubMed] [Google Scholar]
- Lakshminarayana G.; Dao T. D.; Chen K.; Sharma M.; Takeda T.; Brik M. G.; Kityk I. V.; Singh S.; Nagao T. Effect of different surfactants on structural and optical properties of Ce3+ and Tb3+ co-doped BiPO4 nanostructures. Opt. Mater. 2015, 39, 110–117. 10.1016/j.optmat.2014.11.008. [DOI] [Google Scholar]
- Lin C. C.; Xiao Z. R.; Guo G. H.; Chan T. S.; Liu R. S. Versatile Phosphate Phosphors ABPO4 in White Light-Emitting Diodes: Collocated Characteristic Analysis and Theoretical Calculations. J. Am. Chem. Soc. 2010, 132, 3020–3028. 10.1021/ja9092456. [DOI] [PubMed] [Google Scholar]
- Errandonea D.; Manjon F. J. Pressure effects on the structural and electronic properties of ABX4 scintillating crystals. Prog. Mater. Science 2008, 53, 711–773. [Google Scholar]
- Errandonea D.; Garg A. B. Recent progress on the characterization of the high-pressure behaviour of AVO4 orthovanadates. Prog. Mater. Science 2018, 97, 123–169. 10.1016/j.pmatsci.2018.04.004. [DOI] [Google Scholar]
- Gomis O.; Lavina B.; Rodríguez-Hernández P.; Muñoz A.; Errandonea R.; Errandonea D.; Bettinelli M. High-pressure structural, elastic, and thermodynamic properties of zircon-type HoPO4 and TmPO4. J. Phys.: Condens. Matter 2017, 29, 095401. 10.1088/1361-648x/aa516a. [DOI] [PubMed] [Google Scholar]
- Lacomba-Perales R.; Errandonea D.; Meng Y.; Bettinelli M. High-pressure stability and compressibility of APO4 (A = La, Nd, Eu, Gd, Er, and Y) orthophosphates: An x-ray diffraction study using synchrotron radiation. Phys. Rev. B: Condens. Matter Mater. Phys. 2010, 81, 064113. 10.1103/physrevb.81.064113. [DOI] [Google Scholar]
- Sharma S. M.; Garg N.; Sikka S. K. High pressure phase transformations in α-AlPO4: an x-ray diffraction investigation. J. Phys.: Condens. Matter 2000, 12, 6683–6692. 10.1088/0953-8984/12/30/301. [DOI] [Google Scholar]
- Bull C. L.; Ridley C. J.; Funnell N. P. C. W.; Wilson S. G.; MacLeod S. G. The distortion of two FePO4 polymorphs with high pressure. Mater. Adv. 2021, 2, 5096–5104. 10.1039/d1ma00227a. [DOI] [Google Scholar]
- Varma M.; Poswal H. K.; Velaga S. Pressure induced phase transitions in BaZr(PO4)2 studied using x-ray diffraction, Raman spectroscopy, and first principles calculations. J. Appl. Phys. 2020, 127, 135902. 10.1063/1.5144958. [DOI] [Google Scholar]
- Qin F.; Wu X.; Zhai S. M.; Qin S.; Yang K.; Chen D. L.; Li Y. C. Pressure-induced phase transition of lead phosphate Pb3(PO4)2: X-ray diffraction and XANES. Phase Transitions 2014, 87, 1255–1264. 10.1080/01411594.2014.953504. [DOI] [Google Scholar]
- Mishra K. K.; Bevara S.; Ravindran T. R.; Patwe S. J.; Gupta M. K.; Mittal R.; Krishnan R. V.; Achary S. N.; Tyagi A. K. High pressure behavior of complex phosphate K2Ce[PO4]2: Grüneisen parameter and anharmonicity properties. J. Sol. State Chem. 2018, 258, 845–853. 10.1016/j.jssc.2017.12.022. [DOI] [Google Scholar]
- Zhai S.; Wu X. X-ray diffraction study of β-Ca3(PO4)2 at high pressure. Solid State Commun. 2010, 150, 443–445. 10.1016/j.ssc.2009.12.011. [DOI] [Google Scholar]
- Zhai S.; Xue W.; Yamazaki D.; Shan S.; Ito E.; Tomioka N.; Shimojuku A.; Funakoshi K. Compressibility of strontium orthophosphate Sr3(PO4)2 at high pressure. Phys. Chem. Miner. 2011, 38, 357–361. 10.1007/s00269-010-0409-9. [DOI] [Google Scholar]
- Palan C. B.; Koparkar K. A.; Bajaj N. S.; Soni A.; Omanwar S. K. A novel high sensitivity KCaPO4:Ce3+ phosphor for radiation dosimetry. Res. Chem. Interm. 2016, 42, 7637–7649. 10.1007/s11164-016-2558-z. [DOI] [Google Scholar]
- Tsuta M.; Nakamura S.; Kato A. Micronization of KSrPO4:Eu and KBaPO4:Eu phosphor particles for white light-emitting diodes by pulsed laser ablation in liquid. Opt. Laser Techn. 2021, 135, 106725. 10.1016/j.optlastec.2020.106725. [DOI] [Google Scholar]
- Fang H.; Huang S.; Wei X.; Duan C.; Yin M.; Chen Y. Synthesis and luminescence properties of KCaPO4:Eu2+,Tb3+,Mn2+ for white-light-emitting diodes (WLED). J. Rare Earth 2015, 33, 825–829. 10.1016/s1002-0721(14)60491-9. [DOI] [Google Scholar]
- Bredig M. A. Isomorphism and allotropy in compounds of the type A2XO4. J. Phys. Chem. 1942, 46, 747–764. 10.1021/j150421a009. [DOI] [Google Scholar]
- Launay S.; Mahé P.; Quarton M. Polymorphisme et structure cristalline du monophosphate de sodium et baryum. Mat. Res. Bull. 1992, 27, 1347–1353. 10.1016/0025-5408(92)90100-e. [DOI] [Google Scholar]
- El Ammari L.; El Koumiri M.; Depmeier W.; Hesse K. F.; Elouadi B. The crystal structure of the monophosphate KSrPO4. Eur. J. Sol. State and Inorg. Chem. 1997, 34, 563–569. [Google Scholar]
- Bevara S.; Achary S. N.; Patwe S. J.; Sinha A. K.; Tyagi A. K. Preparation and crystal structure of K2Ce(PO4)2: a new complex phosphate of Ce(iv) having structure with one-dimensional channels. Dalton Trans. 2016, 45, 980–991. 10.1039/c5dt03288a. [DOI] [PubMed] [Google Scholar]
- Soni R.; Khan R.; Burange A. S.; Sahani A. J.; Bavera S.; Achary S. N.; Jayaram R. V. Catalytic application of K2Ce(PO4)2 in Knoevenagel condensation - A green protocol. J. Indian Chem. Soc. 2022, 99, 100680. 10.1016/j.jics.2022.100680. [DOI] [Google Scholar]
- Bevara S.; Giri P.; Patwe S. J.; Achary S. N.; Mishra R. K.; Kumar A.; Sinha A. K.; Kaushik C. P.; Tyagi A. K. Separation of 90Sr from nuclear waste by crystalline complex phosphates of Ce(IV) and Zr(IV). J. Envir. Chem. Engin. 2018, 6, 2248–2261. 10.1016/j.jece.2018.03.013. [DOI] [Google Scholar]
- Bevara S.; Mishra K. K.; Patwe S. J.; Ravindran T. R.; Gupta M. K.; Mittal R.; Krishna P. S. R.; Sinha A. K.; Achary S. N.; Tyagi A. K. Phase Transformation, Vibrational and Electronic Properties of K2Ce(PO4)2: A Combined Experimental and Theoretical Study. Inorg. Chem. 2017, 56, 3335–3348. 10.1021/acs.inorgchem.6b02870. [DOI] [PubMed] [Google Scholar]
- Bevara S.; Rajeswari B.; Patwe S. J.; Krishna P. S. R.; Shinde A. B.; Achary S. N.; Kadam R. M.; Tyagi A. K. Temperature dependent structural studies and phase transition behavior of K2Th(PO4)2. J. Alloys Compd. 2019, 783, 310–320. 10.1016/j.jallcom.2018.12.315. [DOI] [Google Scholar]
- Gupta S. K.; Rajeshwari B.; Achary S. N.; Tyagi A. K.; Kadam R. M. Controlling the luminescence in K2Th(PO4)2:Eu3+ by energy transfer and excitation photon: a multicolor emitting phosphor. New J. Chem. 2020, 44, 14703–14711. 10.1039/d0nj03117h. [DOI] [Google Scholar]
- Fauth F.; Peral I.; Popescu C.; Knapp M. The new Material Science Powder Diffraction beamline at ALBA Synchrotron. Powder Diffr. 2013, 28, S360–S370. 10.1017/s0885715613000900. [DOI] [Google Scholar]
- Lotti P.; Milani S.; Merlini M.; Joseph B.; Alabarse F.; Lausi A. Single-crystal diffraction at the high-pressure Indo-Italian beamline Xpress at Elettra, Trieste. J. Synch. Rad. 2020, 27, 222–229. 10.1107/s1600577519015170. [DOI] [PubMed] [Google Scholar]
- Dewaele A.; Loubeyre P.; Mezouar M. Equations of state of six metals above 94 GPa. Phys. Rev. B: Condens. Matter Mater. Phys. 2004, 70, 094112. 10.1103/physrevb.70.094112. [DOI] [Google Scholar]
- Mao H. K.; Xu J.; Bell P. M. Calibration of the ruby pressure gauge to 800 kbar under quasi-hydrostatic conditions. J. Geophys. Res. 1986, 91, 4673–4676. 10.1029/jb091ib05p04673. [DOI] [Google Scholar]
- Prescher C.; Prakapenka V. B. DIOPTAS: a program for reduction of two-dimensional X-ray diffraction data and data exploration. High Press. Res. 2015, 35, 223–230. 10.1080/08957959.2015.1059835. [DOI] [Google Scholar]
- Rodríguez-Carvajal J. Recent advances in magnetic structure determination by neutron powder diffraction. Phys. B 1993, 192, 55–59. [Google Scholar]
- Louer M.; Plevert J.; Louer D. Structure of KCaPO4·H2O from X-ray powder diffraction data. Acta Cryst. B 1988, 44, 463–467. [Google Scholar]
- Boultif A.; Louër D. Powder pattern indexing with the dichotomy method. J. Appl. Cryst. 2004, 37, 724–731. 10.1107/s0021889804014876. [DOI] [Google Scholar]
- Masse R.; Durif A. Chemical preparation and crystal structure refinement of KBaPO4 monophosphate. J. Sol. State Chem. 1987, 71, 574–576. 10.1016/0022-4596(87)90270-2. [DOI] [Google Scholar]
- Bastide J. P. Systématique simplifiée des composés ABX4 (X = O2–, F–) et evolution possible de leurs structures cristallines sous pression. J. Sol. State Chem. 1987, 71, 115–120. 10.1016/0022-4596(87)90149-6. [DOI] [Google Scholar]
- Errandonea D. High-pressure phase transitions and properties of MTO4 compounds with the monazite-type structure. Phys. Stat. Sol. B 2017, 254, 1700016. 10.1002/pssb.201700016. [DOI] [Google Scholar]
- Ojima K.; Nishihata Y.; Sawada D. A. Structure of potassium sulfate at temperatures from 296 K down to 15 K. Acta Cryst. B 1995, 51, 287–293. 10.1107/s0108768194013327. [DOI] [Google Scholar]
- McGinnety J. A. Redetermination of the structures of potassium sulphate and potassium chromate: the effect of electrostatic crystal forces upon observed bond lengths. Acta Cryst. B 1972, 28, 2845–2852. 10.1107/s0567740872007022. [DOI] [Google Scholar]
- Birch F. Finite Elastic Strain of Cubic Crystals. Phys. Rev. 1947, 71, 809–824. 10.1103/physrev.71.809. [DOI] [Google Scholar]
- Gonzalez-Platas J.; Alvaro M.; Nestola F.; Angel R. EosFit7-GUI: a new graphical user interface for equation of state calculations, analyses and teaching. J. Appl. Cryst. 2016, 49, 1377–1382. 10.1107/s1600576716008050. [DOI] [Google Scholar]
- Errandonea D.; Muñoz A.; Gonzalez-Platas J. Comment on “High-pressure x-ray diffraction study of YBO3/Eu3+, GdBO3, and EuBO3: Pressure-induced amorphization in GdBO3” [J. Appl. Phys. 115, 043507 (2014)]. J. Appl. Phys. 2014, 115, 216101. 10.1063/1.4881057. [DOI] [Google Scholar]
- Mall A. K.; Garg N.; Verma A. K.; Errandonea D.; Chitnis A. V.; Srihari V.; Gupta R. Discovery of high-pressure post-perovskite phase in HoCrO3. J. Phys. Chem. Sol. 2023, 172, 111078. 10.1016/j.jpcs.2022.111078. [DOI] [Google Scholar]
- Klotz S.; Chervin J. C.; Munsch P.; Le Marchand G. Hydrostatic limits of 11 pressure transmitting media. J. Phys. D: Appl. Phys. 2009, 42, 075413. 10.1088/0022-3727/42/7/075413. [DOI] [Google Scholar]
- Garg A. B.; Errandonea D.; Rodríguez-Hernández P.; Muñoz A. ScVO4 under non-hydrostatic compression: a new metastable polymorph. J. Phys.: Condens. Matter 2017, 29, 055401. 10.1088/1361-648x/29/5/055401. [DOI] [PubMed] [Google Scholar]
- Knight K. S. Analytical expressions to determine the isothermal compressibility tensor and the isobaric thermal expansion tensor for monoclinic crystals: Application to determine the direction of maximum compressibility in jadeite. Phys. Chem. Miner. 2010, 37, 529–533. 10.1007/s00269-009-0353-8. [DOI] [Google Scholar]
- Cliffe M. J.; Goodwin A. L. PASCal a principal axis strain calculator for thermal expansion and compressibility determination. J. Appl. Cryst. 2012, 45, 1321–1329. 10.1107/s0021889812043026. [DOI] [Google Scholar]
- Bandiello E.; Errandonea D.; Pellicer-Porres J.; Garg A. B.; Rodriguez-Hernandez P.; Muñoz A.; Martinez-Garcia D.; Rao R.; Popescu C. Effect of High Pressure on the Crystal Structure and Vibrational Properties of Olivine-Type LiNiPO4. Inorg. Chem. 2018, 57, 10265–10276. 10.1021/acs.inorgchem.8b01495. [DOI] [PubMed] [Google Scholar]
- Anzellini S.; Burakovsky L.; Turnbull R.; Bandiello E.; Errandonea D. P-V-T Equation of State of Iridium Up to 80 GPa and 3100 K. Crystals 2021, 11, 452. 10.3390/cryst11040452. [DOI] [Google Scholar]
- Scott P. R.; Crow J. A.; LeGeros R. Z.; Kruger M. B. A pressure-induced amorphous phase transition in magnesium-substituted-tricalcium phosphate. Sol. State Comm. 2011, 151, 1609–1611. 10.1016/j.ssc.2011.07.019. [DOI] [Google Scholar]
- Zhai S.; Liu X.; Shieh S. R.; Zhang L.; Ito E. Equation of State of Tricalcium Phosphate, Ca3(PO4)2, to Lower Mantle Pressures. Am. Miner. 2009, 94, 1388–1391. 10.2138/am.2009.3160. [DOI] [Google Scholar]
- Jia M.; Hu X.; Liu Y.; Jiang S.; Wu X.; Zhai S. X-ray diffraction and Raman spectra of merrillite at high pressures. High Pres. Res 2020, 40, 411–422. 10.1080/08957959.2020.1798945. [DOI] [Google Scholar]
- Shakhvorostov D.; Müser M. H.; Mosey N. J.; Song Y.; Norton P. R. Correlating cation coordination, stiffness, phase transition pressures, and smart materials behavior in metal phosphates. Phys. Rev. B: Condens. Matter Mater. Phys. 2009, 79, 094107. 10.1103/physrevb.79.094107. [DOI] [Google Scholar]
- Brunet F.; Allan D. R.; Redfern S. A. T.; Angel R. J.; Miletich R.; Reichmann H. J.; Sergent J.; Hanfland M. Compressibility and thermal expansivity of synthetic apatites, Ca5(PO4)3X with X = OH, F and Cl. Eur. J. Miner. 1999, 11, 1023–1036. 10.1127/ejm/11/6/1023. [DOI] [Google Scholar]
- Kamali K.; Ravindran T. R.; Chandra Shekar N. V.; Pandey K. K.; Sharma S. M. Pressure induced phase transformations in NaZr2(PO4)3 studied by X-ray diffraction and Raman spectroscopy. J. Sol. State Chem. 2015, 221, 285–290. 10.1016/j.jssc.2014.10.017. [DOI] [Google Scholar]
- Gao J.; Huang W.; Wu X.; Qin S. High pressure experimental studies on Na3Fe(PO4)(CO3) and Na3Mn(PO4)(CO3): Extensive pressure behaviors of carbonophosphates family. J. Phys. Chem. Solids 2018, 115, 248–253. 10.1016/j.jpcs.2017.12.046. [DOI] [Google Scholar]
- Gao J.; Huang W. F.; Wu X.; Fan D. W.; Wu Z. Y.; Xia D. G.; Qin S. Compressibility of carbonophosphate bradleyite Na3Mg(CO3)(PO4) by X-ray diffraction and Raman spectroscopy. Phys. Chem. Miner. 2015, 42, 191–201. 10.1007/s00269-014-0710-0. [DOI] [Google Scholar]
- Clavier N.; Wallez G.; Dacheux H.; Bregiroux D.; Quarton M.; Beaunier P. Synthesis Raman and Rietveld analysis of thorium diphosphate. J. Sol. State Chem. 2008, 181, 3352–3356. 10.1016/j.jssc.2008.09.013. [DOI] [Google Scholar]
- Dwivedi A.; Kaiwart R.; Varma M.; Velaga S.; Poswal H. K. High-pressure structural investigations on InPO4. J. Sol. State Chem. 2020, 282, 121065. 10.1016/j.jssc.2019.121065. [DOI] [Google Scholar]
- Errandonea D.; Gomis O.; Santamaría-Perez D.; García-Domene B.; Muñoz A.; Rodríguez-Hernández P.; Achary S. N.; Tyagi A. K.; Popescu C. Exploring the high-pressure behavior of the three known polymorphs of BiPO4: Discovery of a new polymorph. J. Appl. Phys. 2015, 117, 105902. 10.1063/1.4914407. [DOI] [Google Scholar]
- Bandiello E.; Errandonea D.; Ferrari S.; Pellicer-Porres J.; Martínez-García D.; Achary S. N.; Tyagi A. K.; Popescu C. Pressure-Induced Hexagonal to Monoclinic Phase Transition of Partially Hydrated CePO4. Inorg. Chem. 2019, 58, 4480–4490. 10.1021/acs.inorgchem.8b03648. [DOI] [PubMed] [Google Scholar]
- Huang T.; Lee J. S.; Kung J.; Lin C. M. Study of monazite under high pressure. Solid State Commun. 2010, 150, 1845–1850. 10.1016/j.ssc.2010.06.042. [DOI] [Google Scholar]
- Pereira A. L. J.; Santamaría-Pérez D.; Vilaplana R.; Errandonea D.; Popescu C.; da Silva E. L.; Sans J. A.; Rodríguez-Carvajal J.; Muñoz A.; Rodríguez-Hernández P.; Mujica A.; Radescu S. E.; Beltrán A.; Otero-de-la-Roza A.; Nalin M.; Mollar M.; Manjón F. J. Experimental and Theoretical Study of SbPO4 under Compression. Inorg. Chem. 2020, 59, 287–307. 10.1021/acs.inorgchem.9b02268. [DOI] [PubMed] [Google Scholar]
- Raison P. E.; Heathman S.; Wallez G.; Zvoriste C. E.; Bykov D.; Ménard G.; Suard E.; Popa K.; Dacheux N.; Konings R. J. M.; Caciuffo R. Structure and nuclear density distribution in the cheralite—CaTh(PO4)2: studies of its behaviour under high pressure (36 GPa). Phys. Chem. Miner. 2012, 39, 685–692. 10.1007/s00269-012-0522-z. [DOI] [Google Scholar]
- Harlow G. E. Structure refinement of a natural K-rich diopside: The effect of K on the average structure. Am. Miner. 1996, 81, 632–638. 10.2138/am-1996-5-610. [DOI] [Google Scholar]
- Moakafi M.; Khenata R.; Bouhemadou A.; Khachai H.; Amrani B.; Rached D.; Rérat M. Electronic and optical properties under pressure effect of alkali metal oxides. Eur. Phys. J. B 2008, 64, 35–42. 10.1140/epjb/e2008-00286-6. [DOI] [Google Scholar]