

Abstract
Over 2.5 million neonatal dried blood spots (DBS) are stored at the Danish National Biobank. These samples offer extraordinary possibilities for metabolomics research, including prediction of disease and understanding of underlying molecular mechanisms of disease development. Nevertheless, Danish neonatal DBS have been little explored in metabolomics studies. One question that remains underinvestigated is the long-term stability of the large number of metabolites typically assessed in untargeted metabolomics over long time periods of storage. Here, we investigate temporal trends of metabolites measured in 200 neonatal DBS collected over a time course of 10 years, using an untargeted liquid chromatography tandem mass spectrometry (LC-MS/MS) based metabolomics protocol. We found that a majority (71%) of the metabolome was stable during 10 years of storage at −20 °C. However, we found decreasing trends for lipid-related metabolites, such as glycerophosphocholines and acylcarnitines. A few metabolites, including glutathione and methionine, may be strongly influenced by storage, with changes in metabolite levels up to 0.1–0.2 standard deviation units per year. Our findings indicate that untargeted metabolomics of DBS samples, with long-term storage in biobanks, is suitable for retrospective epidemiological studies. We identify metabolites whose stability in DBS should be closely monitored in future studies of DBS samples with long-term storage.
Keywords: Neonatal metabolome, dried blood spots, metabolomics, biobank, mass spectrometry
Introduction
Newborn screening programs are an important part of the health care system in many countries, during which infants are screened for a number of treatable congenital disorders shortly after birth using dried heel prick samples.1 Apart from their crucial role in health care, biobanked neonatal dried blood spots (DBS) have the potential to become an important resource for research related to early diagnosis and detection of diseases. Over 2 million neonatal heel prick samples are stored at the Danish National Biobank at Statens Serum Institut and made accessible to researchers worldwide (https://www.danishnationalbiobank.com/). These samples derive from the population-wide screening for inborn errors of metabolism (IEM), which in Denmark has been performed since 1975. Blood for neonatal screening is usually drawn from the heel, absorbed onto filter paper, and dried for 3 h at ambient temperature before analysis and biobank storage.2 Compared to traditional whole blood sampling, DBS samples are less invasive and require less sample volume. DBS samples also have a distinct matrix paper composition and are made of whole blood, which, in conventional blood sampling, is separated into plasma or serum and blood cells and clots. Therefore, both cellular and extracellular compounds are present in DBS, offering multiple opportunities for clinical practice and research.
All of the biobanked DBS samples can be linked to Danish registry data, containing diverse health and social records, such as disease incidence, surgical procedures, age, sex, education, or ethnicity,3,4 thus providing extraordinary opportunities for research into early diagnosis and detection of diseases. LC-MS-based metabolomics studies in particular could offer unique opportunities to describe potential metabolic etiologies of various diseases. This could provide clinicians with a retrospective tool to investigate disease onset as well as providing researchers with an opportunity to conduct longitudinal cohort studies. Nevertheless, Danish neonatal DBS have been little explored in metabolomics studies. One question that remains underinvestigated is the long-term stability at −20 °C, for up to a decade or longer, of the large number of metabolites typically assessed in an untargeted metabolomics study. Long-term stability of DBS samples has been studied to a lesser extent than the corresponding liquid blood drawings, despite being a crucial aspect in order to ensure valid analytical results. DBS samples stored at ambient temperature are prone to considerable short-term changes.5 For instance, in a panel of 13 amino acids and carnitine species, storage at an ambient temperature for 5–15 years resulted in significant changes in concentrations for all metabolites except valine, ranging from 2 to 28% per year.6 In particular, acylcarnitines appear to be sensitive to degradation at ambient temperature.7 Conversely, storage at −20 °C or lower significantly reduced time-dependent metabolite changes in concentrations in a study comparing the 2-year stability of metabolites in DBS at ambient temperature, −20 °C, and −80 °C.8 However, only a few studies have studied the stability of the DBS metabolome, as measured using untargeted metabolomics. It has been shown that only a minority of the metabolome in DBS from rats were unstable during one year of storage at −20 °C.9 On the other hand, during storage times of up to five years at −20 °C, one study found considerable variation in a majority of 6000 measured metabolite features.10 Further studies, investigating longer storage times, are needed in order to confirm these findings.
In this study, we used an untargeted liquid chromatography tandem mass spectrometry (LC-MS/MS) based metabolomics protocol to identify long-term temporal trends in the untargeted metabolome in DBS samples stored at the Danish National Biobank at −20 °C from one to 10 years. By analyzing DBS samples from different individuals that are matched for factors that previously have been identified to cause major variation in the neonatal metabolome, we aim at detecting temporal trends that reflect the storage time rather than biological differences.
Material and Methods
Study Design
We retrieved a cohort of 200 neonatal DBS stored over a time period of 10 years at −20 °C (2010–2019) at the Danish National Biobank. Metabolomic profiles were acquired in December 2020, thus resulting in storage times between 1 and 10 years. Twenty neonatal DBS were retrieved for each year (10 females, 10 males). Our group previously identified gestational age,11 season, and age of the infant at dried blood spot sampling12 as major drivers of variation observed in the neonatal DBS metabolome. Furthermore, sampling protocols and transport time may vary from hospital to hospital. Therefore, to control for variation introduced by other sources than storage time, we selected DBS from children born in July, sampled at 2 days of age, and born at 40 weeks of gestation at Hvidovre Hospital, Denmark. Metadata readily accessible to us included sex, birth weight, and the mother’s age. These factors did not appear to explain major variation in the neonatal DBS in prelimininary studies12 and restricting sample selection further would have led to very few samples included in the study. Therefore, we adjusted for these additional factors in downstream statistical analyses. The study was conducted in accordance with the Declaration of Helsinki, and the protocol complies with the Danish Ethical Committee law by not being a health research project (Section 1) but a method development study not requiring ethical approval.4 The Committees on Health Research Ethics for the Capital Region of Denmark waived ethical approval for this work.
Sample Preparation
Samples were randomly distributed over three 96-well plates (batches). A large batch of DBS consisting of adult blood from a single individual was created before the sample preparation and stored at −20 °C. Aliquots (3.2-mm-diameter punches) were distributed on all plates and used as external controls (EC). Each plate consisted of two water blanks, eight EC, four paper blanks (PB, 3.2-mm-diameter punches of blank filter paper), four pooled samples (equal aliquots of all samples within a plate), and 67 samples for the second and third plate and 66 samples for the first plate. All solvents were LCMS-grade, and were purchased from Thermo Fisher Scientific (Waltham, MA, USA). DBS samples (3.2-mm-diameter punches) were punched into 96-well plates, made from polypropylen, and kept at −20 °C until extraction. The punching process was done using a Panthera-Puncher 9 from PerkinElmer at room temperature. On the day of extraction, the sample plate was removed from the freezer and kept at room temperature for 30 min. 100 μL of 80% methanol was added to each well, and the plate was then sealed with a silicone plate lid. The plate was then shaken for 45 min at 450 rpm at room temperature, and consecutively centrifuged at 4000 rpm for 30 min at 4 °C. 75 μL of extract was pipetted into a new 96-well polypropylen plate, which was then evaporated under nitrogen for 1 h at 60 L/min, at room temperature. The samples were reconstituted in 75 μL of reconstitution solution (comprised of 5% solvent B in 95% solvent A, see Metabolomics Profiling section), shaken at 600 rpm for 15 min, and then centrifuged at 3000 rpm for 10 min at 4 °C. Afterward the samples on the plate were pooled into a single well on a deep well plate, and pipetted into the four pool positions on the plate, which was then sealed with a silicone lid and centrifuged at 3000 rpm for 5 min at 4 °C. The plate was then run on the LC-MS/MS platform. All pipetting steps were performed on a Microlab STAR automated liquid handler (Hamilton Bonaduz AG, Bonaduz, Switzerland). The extraction procedure took approximately 41/2 h.
Metabolomics Profiling
All samples (including blank, pooled, and external quality control samples) were submitted to untargeted LC-MS/MS at Statens Serum Institut, Copenhagen, Denmark, in December 2020. The LC-MS/MS platform consisted of a timsTOF Pro mass spectrometer with an Apollo II ion-source for electrospray ionization (Bruker Daltonics, Billerica, MA, US) coupled to a UHPLC Elute LC system (Bruker Daltonics). The chromatographic separation system included a binary pump, an autosampler with a cooling function, and a column oven with temperature control. For infusion of the reference solution, used for external and internal mass calibration, an additional isocratic pump, Azura Pump P4.1S (Knauer, Berlin, Germany), was used. The analytical separation was performed on an Acquity HSS T3 (100 Å, 2.1 mm × 100 mm, 1.8 μm) column (Waters, Milford, MA, US). The mobile phase consisted of solvent A (99.8% water and 0.2% formic acid) and B (49.9% methanol, 49.9% acetonitrile, and 0.2% formic acid). The analysis started with 99% mobile phase A for 1.5 min, followed by a linear gradient to 95% mobile phase B over 8.5 min, and an isocratic flow at 95% mobile phase B for 2.5 min before going back to 99% mobile phase A and equilibration for 2.4 min. Total run time for each injection was 15 min, and the analysis time for a full 96-well plate was approximately 25 h. Samples were maintained at +15 °C in the autosampler; 5 μL were loaded onto the column with a flow rate of 0.4 mL/min and a column temperature of 40 °C.
Tandem mass spectrometric analysis was performed in Q-TOF mode with TIMS off and auto MS/MS using the following settings: ionization mode set to positive ionization, mass range set to 20–1000 m/z, and a spectra rate of 3 Hz. Source settings are as follows: capillary, 2500 V; nebulizer gas, 2.5 bar; dry gas flow, 8 L/min; dry gas temperature, 240 °C. Tune settings were as follows: funnel 1 RF and funnel 2 RF, 200Vpp; isCID, 0 eV; multipole RF, 60 Vpp; deflection delta, 60 V; quadrupole ion energy, 5 eV with a low mass set to 60 m/z; collision cell energy set to 7 eV with a pre pulse storage of 5 μs. Stepping was used in basic mode with a collison RF from 250 to 750 Vpp; transfer time 20–50 μs; and timing set to 50% for both. For MS/MS, only the collision energy ranged from 100% to 250% with timing set to 50% for both. Auto MS/MS was used with a predefined cycle time of 0.5 s; active exclusion was used with exclusion after three spectra and a release time set to 0.20 min. Sodium formate clusters were applied for instrument mass calibration and for internal recalibration of individual samples. A precursor exclusion list was used with an exclusion of mass range of 20–60 m/z.
Metabolomics Preprocessing
Bruker .d files were exported to the .mzML format using ProteoWizard’s MSConvert13 and subsequently preprocessed using the ion identity network workflow in MZmine14,15 (version 2.37.1.corr17.7).
Data were cropped, with a chromatogram retention time from 0.4 to 12 min retained. Mass lists were then created with MS1 intensity above 5E2 and MS2 intensity above 0 retained. The chromatogram was built through the ADAP chromatogram builder16 by using the following parameters: minimum group size of scans, 3; group intensity threshold, 5E2; minimum highest intensity, 1E3; and m/z tolerance, 0.002 m/z or 5 ppm. The chromatogram was smoothed with a filter width of 5 and further deconvoluted using the MEDIAN m/z center calculation with an m/z range for MS2 scan pairing of 0.002 Da and a retention time range for MS2 scan pairing of 0.3 min. The local minimum search algorithm was used for deconvolution with parameters set to chromatographic threshold, 85%; minimum RT range, 0.01 min; minimum relative height, 0%; minimum absolute height, 1E3; min ratio of peak top/edge, 2.2; peak duration range, 0.01–0.5 min. The peaks were deisotoped using the isotopic peak grouper function, with parameters set to m/z tolerance, 0.002 m/z or 5 ppm; retention time tolerance, 0.3 min; monotonic shape, on; maximum charge, 2; representative isotope, most intense. Peaks from all samples were aligned using the join aligner function with parameters set to m/z tolerance, 0.002 m/z or 5 ppm; retention time tolerance, 0.5 min; weight for m/z, 75%; weight for retention time, 25%. Rows were then filtered using the duplicate peak filter with the new average filter mode and m/z tolerance set to 0.001 m/z or 5 ppm and RT tolerance to 0.03 min. The metaCorrelate function was used to find correlating peak shapes with parameters set to RT tolerance, 0.1 min; min height, 1E3; noise level, 5E2; min samples in all, 2 (abs); min samples in group, 0 (abs); min %-intensity overlap, 60%; exclude estimated features (gap-filled), on. Parameters for the correlation grouping were set as follows: min data points, 5; min data points on edge, 2; measure, Pearson; min feature shape correlation, 85%. Ion identity networking parameters were set to m/z tolerance, 0.002 m/z or 5 ppm; check, one feature; min height, 1E3 with ion identity library parameters set to MS mode, positive; maximum charge, 2; maximum molecules/cluster, 2; adducts, M+H, M+Na, M+K; modifications, M-H2O, M-NH3. Further ion identity networks were added with m/z tolerance, 0.002 m/z or 5 ppm; min height, 1E3; ion identity library parameters set to MS mode, positive; maximum charge, 2; maximum molecules/cluster, 6; adducts, M+H, M+Na; modifications, M-H2O, M-2H2O, M-3H2O, M-4H2O, M-5H2O; and m/z tolerance, 0.002 m/z or 5 ppm; min height, 1E3; and annotation refinement on with parameters set to delete smaller networks, link threshold, 4; delete networks without monomer, on; and ion identity library parameters set to MS mode, positive; maximum charge, 2; maximum molecules/cluster, 2; adducts, M+H, M+Na, M+K; modifications, M-H2O, M-NH3. Finally, two feature tables were exported in .csv format: one feature table containing all extracted mass spectral features and another feature table filtered for mass spectral features with associated fragmentation spectra (MS2). An aggregated list of MS2 fragmentation spectra was exported in .mgf format and submitted to ion identity feature-based mass spectral molecular networking through the Global Natural Products Social Molecular Networking Platform (GNPS).15,17,18
Before statistical analysis, mass spectral features with a relative intensity less than 20 times the mean relative intensity of all paper blank samples were removed. Relative intensities were further batch normalized through centering by subtracting the column means (omitting NAs) of each batch and scaling by the standard deviation. Missing values were thereafter imputed using the OptSpace matrix completion algorithm implemented in the robust Aitchison open-source software DEICODE, implemented in Qiime2,19 assuming a rank of 100 for the underlying low-rank structure.20 Furthermore, we removed features present in less than 5% of the samples, resulting in a final cohort of 200 samples and 731 metabolite features. After batch normalization, no significant effect of the plate number was observed using a permutational multivariate analysis of variance21 (PERMANOVA, P = 1, Adonis R2 = 0.0032) and external controls and per plate pooled samples clustered satisfactorily in principal components space, showing good precision of our LC-MS/MS metabolomics measurements (Figure S1). Among 170 metabolite features that were present in all EC samples, 93% had a coefficient of variation (CV) < 25% and 59% had a CV < 10%.
Metabolite Identification
To annotate mass spectral features to putative chemical structures, a mass spectral molecular network was created through the GNPS Platform (http://gnps.ucsd.edu) using the ion identity feature based molecular networking workflow (https://ccms-ucsd.github.io/GNPSDocumentation/fbmn-iin/).15,17,18 The data were filtered by removing all MS/MS fragment ions within ±17 Da of the precursor m/z. MS/MS spectra were window filtered by choosing only the top six fragment ions in the ±50 Da window throughout the spectrum. The precursor ion mass tolerance was set to 0.02 Da and a MS/MS fragment ion tolerance of 0.02 Da. A network was then created where edges were filtered to have a cosine score above 0.7 and more than four matched peaks. Further, edges between two nodes were kept in the network if and only if each of the nodes appeared in each other’s respective top 10 most similar nodes. Finally, the maximum size of a molecular family was set to 100, and the lowest scoring edges were removed from molecular families until the molecular family size was below this threshold. The spectra in the network were then searched against all GNPS’ spectral libraries. The library spectra were filtered in the same manner as the input data. All matches kept between network spectra and library spectra were required to have a score above 0.7 and at least four matched peaks.
To further enhance chemical structural information within the molecular network, substructure information was incorporated into the network using the GNPS MS2LDA workflow (https://ccms-ucsd.github.io/GNPSDocumentation/ms2lda/).22−24 Furthermore, information from in silico structure annotations from Network Annotation Propagation25 and Sirius+CSI:FingerID26 were incorporated into the network using the GNPS MolNetEnhancer workflow (https://ccms-ucsd.github.io/GNPSDocumentation/molnetenhancer/).27 Chemical class annotations were performed using deep neural networks in CANOPUS28 and followed the ClassyFire chemical ontology.29
Statistical Analysis
The overall variation in the metabolite data was analyzed using principal component analysis (PCA), in R package mixOmics.30 To assess associations between principal components and storage time, we performed linear regression models. To identify metabolic features significantly associated with storage time and time at ambient temperature, we performed a linear regression analysis for each metabolite individually. All linear regression models were adjusted for sex, birth weight, and the mothers’ age. P values were adjusted for multiple hypothesis testing using the false discovery rate (FDR) method.31 Piecewise linear trends were investigated using linear splines, with two segments, using the R package lspline. To visualize temporal trends, we calculated the median for all significant metabolites (linear regression or linear splines, FDR-adjusted P value < 0.05) and subtracted the most recent sampling year (2019), which was used as a baseline. Results from linear regression models were confirmed using nonparametric correlation tests using Spearman’s ρ. Also, longitudinal trends in metabolite data were explored by multivariate statistics using the R package timeOmics.32 Briefly, longitudinal changes in metabolite levels were modeled using linear mixed model splines. By applying PCA on modeled metabolite profiles, metabolites with similar longitudinal trends could be clustered together. The optimal number of principal components was optimized by maximizing the silhouette coefficient. All statistical analyses were performed in R 4.1.1 or Python 3.7 code, and Jupyter notebooks are publicly accessible at https://github.com/SSI-Metabolomics/Temporal_SupplementaryMaterial/.
Putative Identification of Degradation Products
To identify putative degradation products, we performed a pairwise correlation analysis of all metabolite features correlating significantly with the year of sampling (Spearman’s ρ, FDR-adjusted P value < 0.05) using Pearson’s ρ. Putative degradation was then defined as two metabolite features, which (1) correlate significantly with year of sampling (Spearman’s ρ, FDR-adjusted P value < 0.05), (2) correlate negatively with each other (Pearson’s r < 0; P value < 0.05), and (3) exhibit a chemical structural relationship either through high tandem mass spectral similarity (cosine > 0.7) or shared MS2LDA substructural motifs. For visualization and chemical structural annotation, putative degradation products were identified within the mass spectral molecular network by adding edges (connecting lines) between two nodes, meeting criteria 1, 2, and 3.
Results
A total of 731 metabolites (mass spectral features with unique MS/MS fragmentation patterns) were measured and present in at least 5% of the samples. Putative annotation on the metabolite class level was conducted by combining mass spectral molecular networking (GNPS), unsupervised substructure discovery (MS2LDA), in silico annotation through network annotation propagation,25 Sirius+CSI:FingerID, MolNetEnhancer, and deep neural networks in CANOPUS. This resulted in chemical class annotation (level 3 annotation33) for 188 metabolites (25.7%). Spectral mirror plots of all metabolite annotations retrieved through GNPS with a spectral similarity score (cosine score) ≥ 0.7 are shown in Supporting Information.
To examine whether overall variation in the metabolomics data was related to storage time of DBS samples, PCA was performed. The first principal component (PC) explained 11.5% of the variation in the data set, and the cumulative explained variance of the first four PCs was 29.2% (Figure S2A). Samples with similar storage time did not cluster according to the PCs (Figure S2B), but PC2 (beta = 0.068, p = 5.5e-3), PC3 (beta = 0.090, p = 2.1e-4), and PC4 (beta = 0.12, p = 1.6e-7) were significantly (p < 0.05) negatively associated with storage time in linear regression models adjusted for sex, birth weight, and the mothers’ age (Figure S2C). The mothers’ age and birth weight did not differ between the different time points (Table S1).
We proceeded to explore the association between each individual metabolite and storage time. In linear regression models, adjusted for sex, birth weight, and age of the mother, 152 out of 731 metabolites (20.8%) were significantly (FDR-adjusted P value <0.05) associated with storage time (Figure 1A; Table S2). Out of these, 71 were inversely associated with storage time, and 81 showed a positive association. Comparing the metabolite levels after 10 years of storage with those at one year of storage, the median metabolite level was on average 0.67 standard deviations higher for metabolites with significant positive beta coefficients and 0.64 standard deviations lower for metabolites with significant negative beta coefficients (Figure 1B). The median estimated annual change among significant metabolites was 0.08 standard deviation units, and the median explained variance was 9.9%. The explained variance ranged from 3.1% (tyrosine) to 26.8% (methionine). In total, 50 of the 152 significant metabolites (32.9%) could be assigned to a metabolite class (level 3). Among the eight represented metabolite classes, four contributed with more than one metabolite, including amino acids and derivatives (N = 18), peptides (N = 17), glycerophosphocholines (N = 5), and acylcarnitines (N = 4). In total, 24 significant metabolites achieved at least a second level annotation,33 among which the strongest positive association with storage time was seen for glycerophosphocholine (beta = 0.098, p = 4.7e-5) and the strongest negative association for methionine (beta = −0.15, p = 6.3e-12) and glutathione (beta = −0.18, p = 7.7e-11). Overall, 13 classes (with at least two measured metabolites) had no metabolites significantly associated with storage. Among classes with metabolites associated with storage, the proportions of unaltered metabolites ranged from 73% (acylcarnitines) to 37% (glycerophosphocholines). For metabolites without class annotation, 81% were unaltered (Figure 1C). Neither metabolites annotated as peptides nor metabolites annotated as amino acids and derivatives did show any class-specific temporal trends. Both negative as well as positive associations were observed. On the contrary, all significant acylcarnitines showed negative associations with storage. For glycerophosphocholines, all significant lysophosphatidylcholine species were negatively associated with storage, while levels of the headgroup glycerophosphocholine were positively associated with storage (Figure 2).
Figure 1.
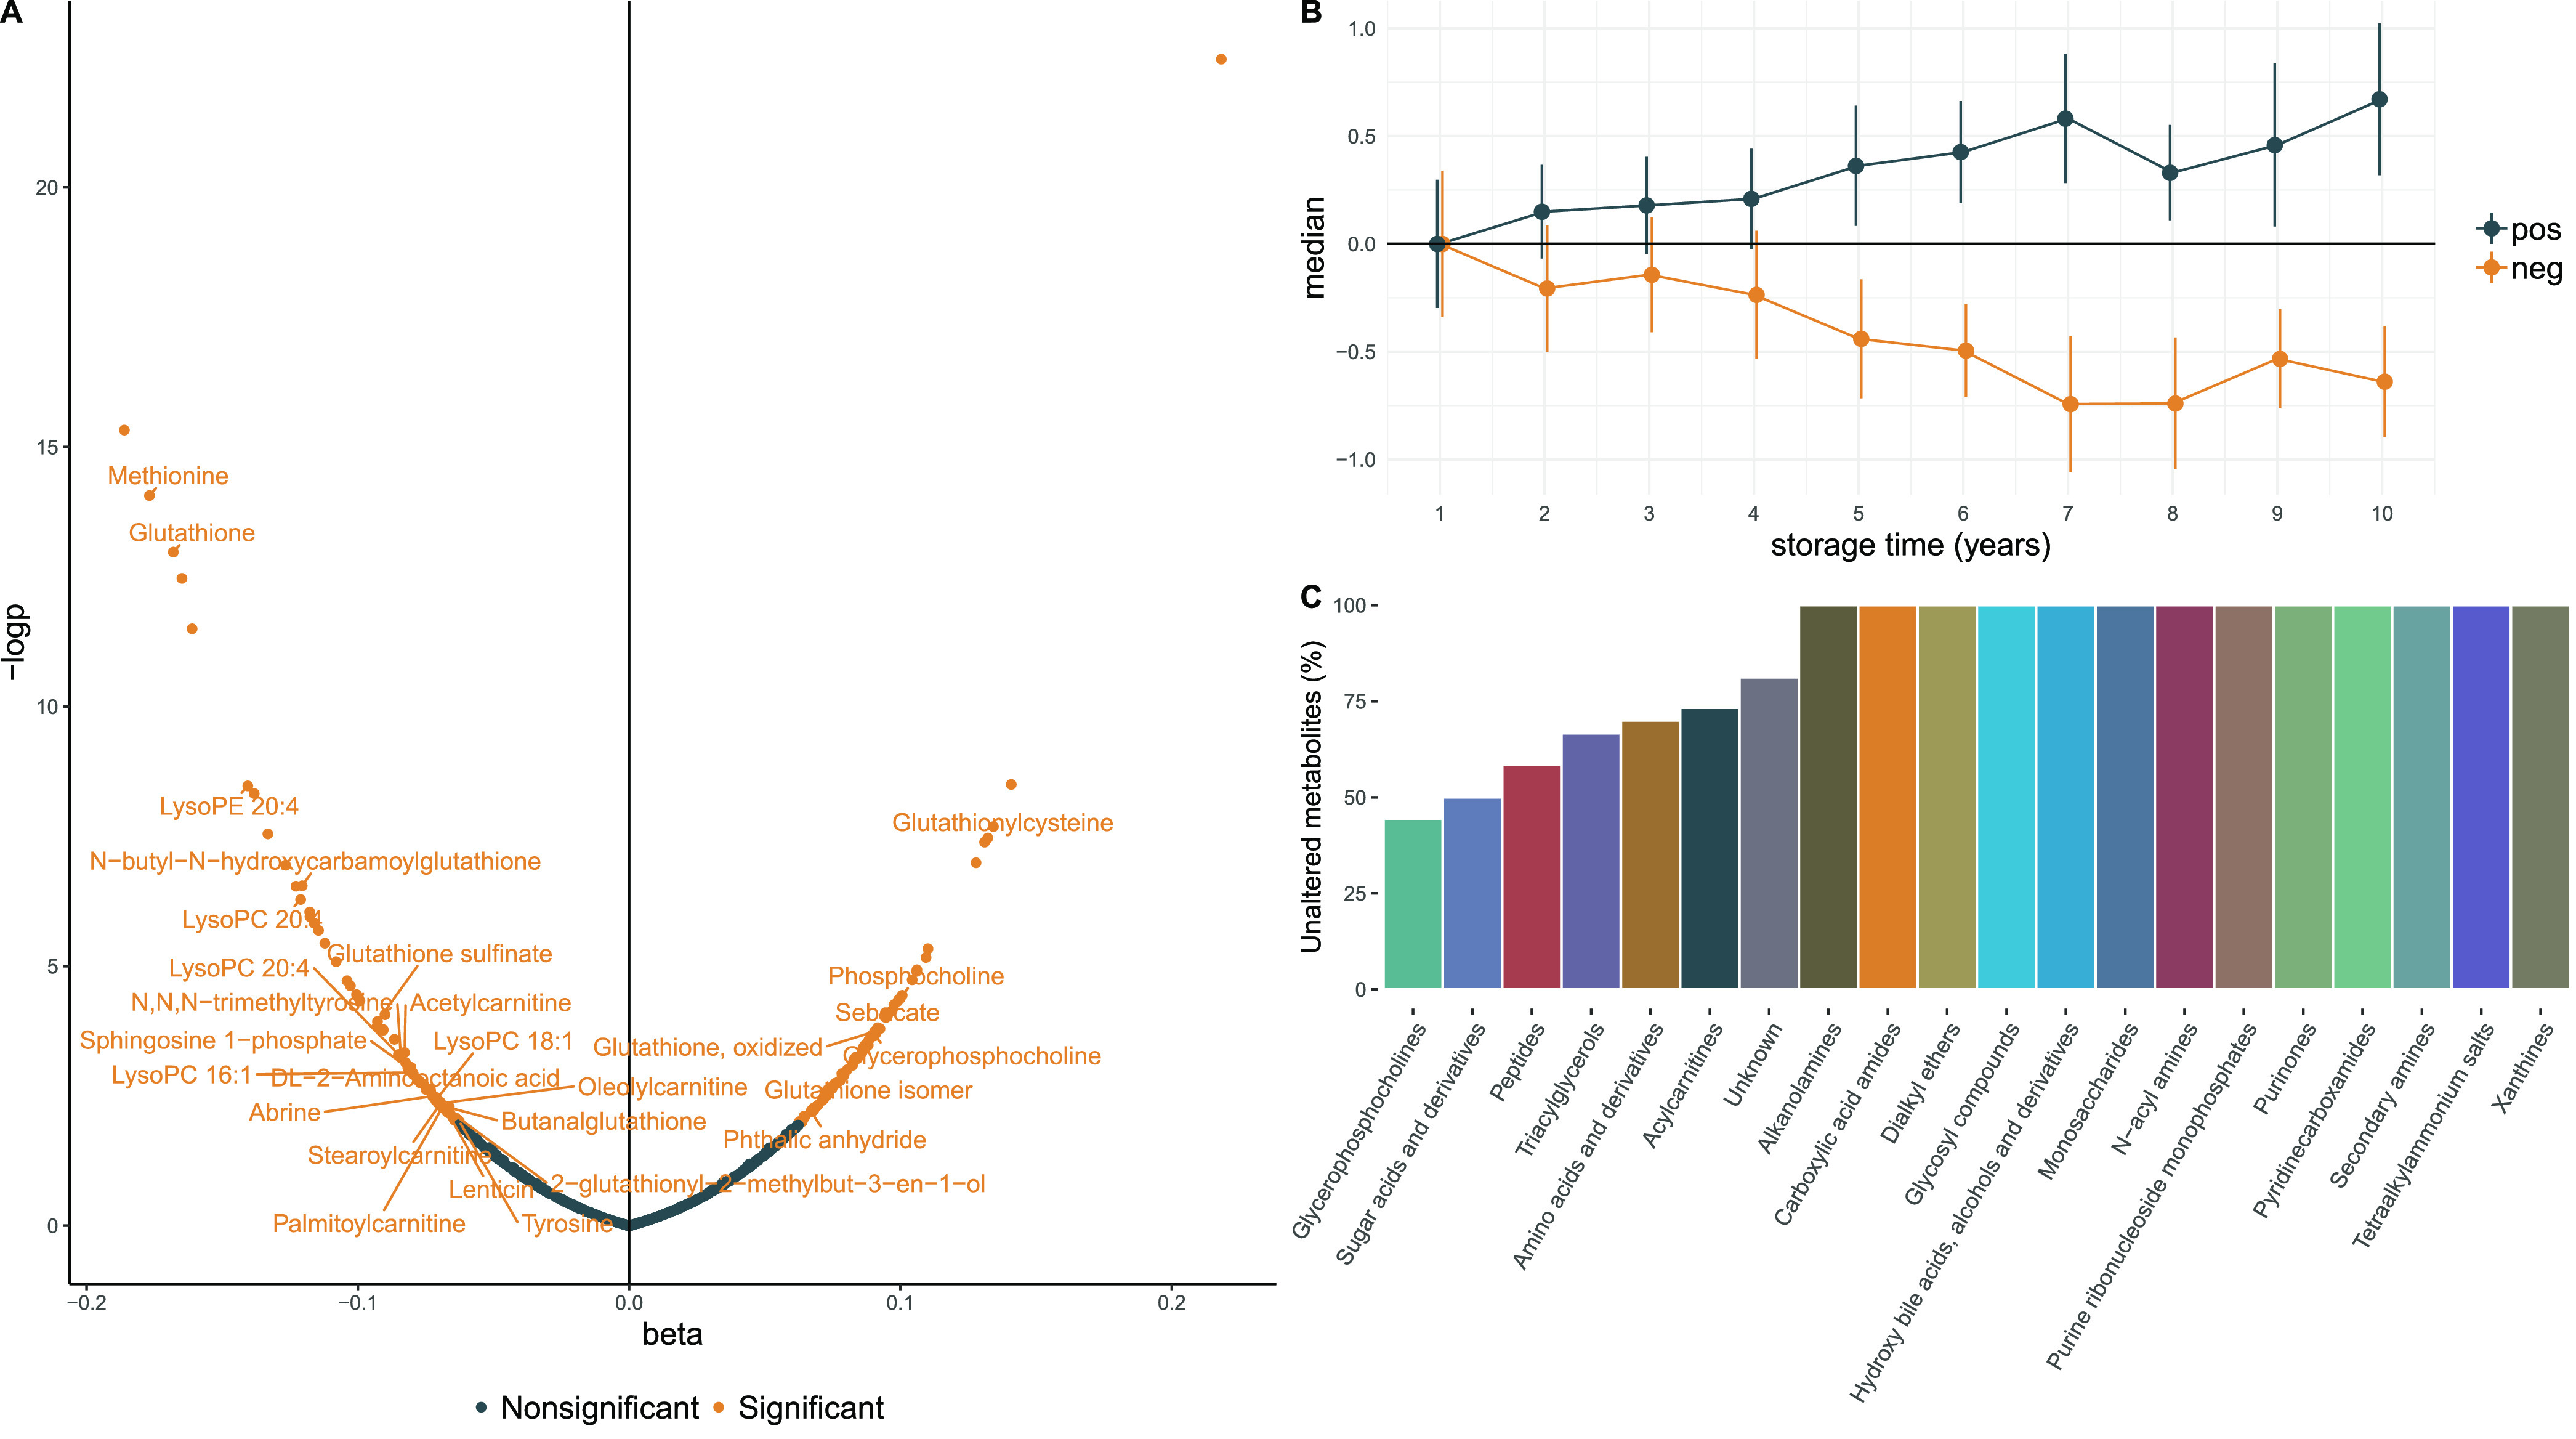
Beta coefficients (standard deviation increment of metabolite feature per year of storage) from linear regression models (A), indicating change for each metabolite in standard deviation units per year of storage time. Significant associations indicate false discovery-rate P values < 0.05. (B) Median levels of all the 152 metabolites significantly associated with storage time for each year of storage time. Point estimates show mean value at each time point and direction (pos, positive; neg, negative), and error bars indicate standard deviations. (C) Proportion of metabolites within each class without associations with storage time, out of 20 putatively annotated classes, only seven showed significant alterations with storage time.
Figure 2.
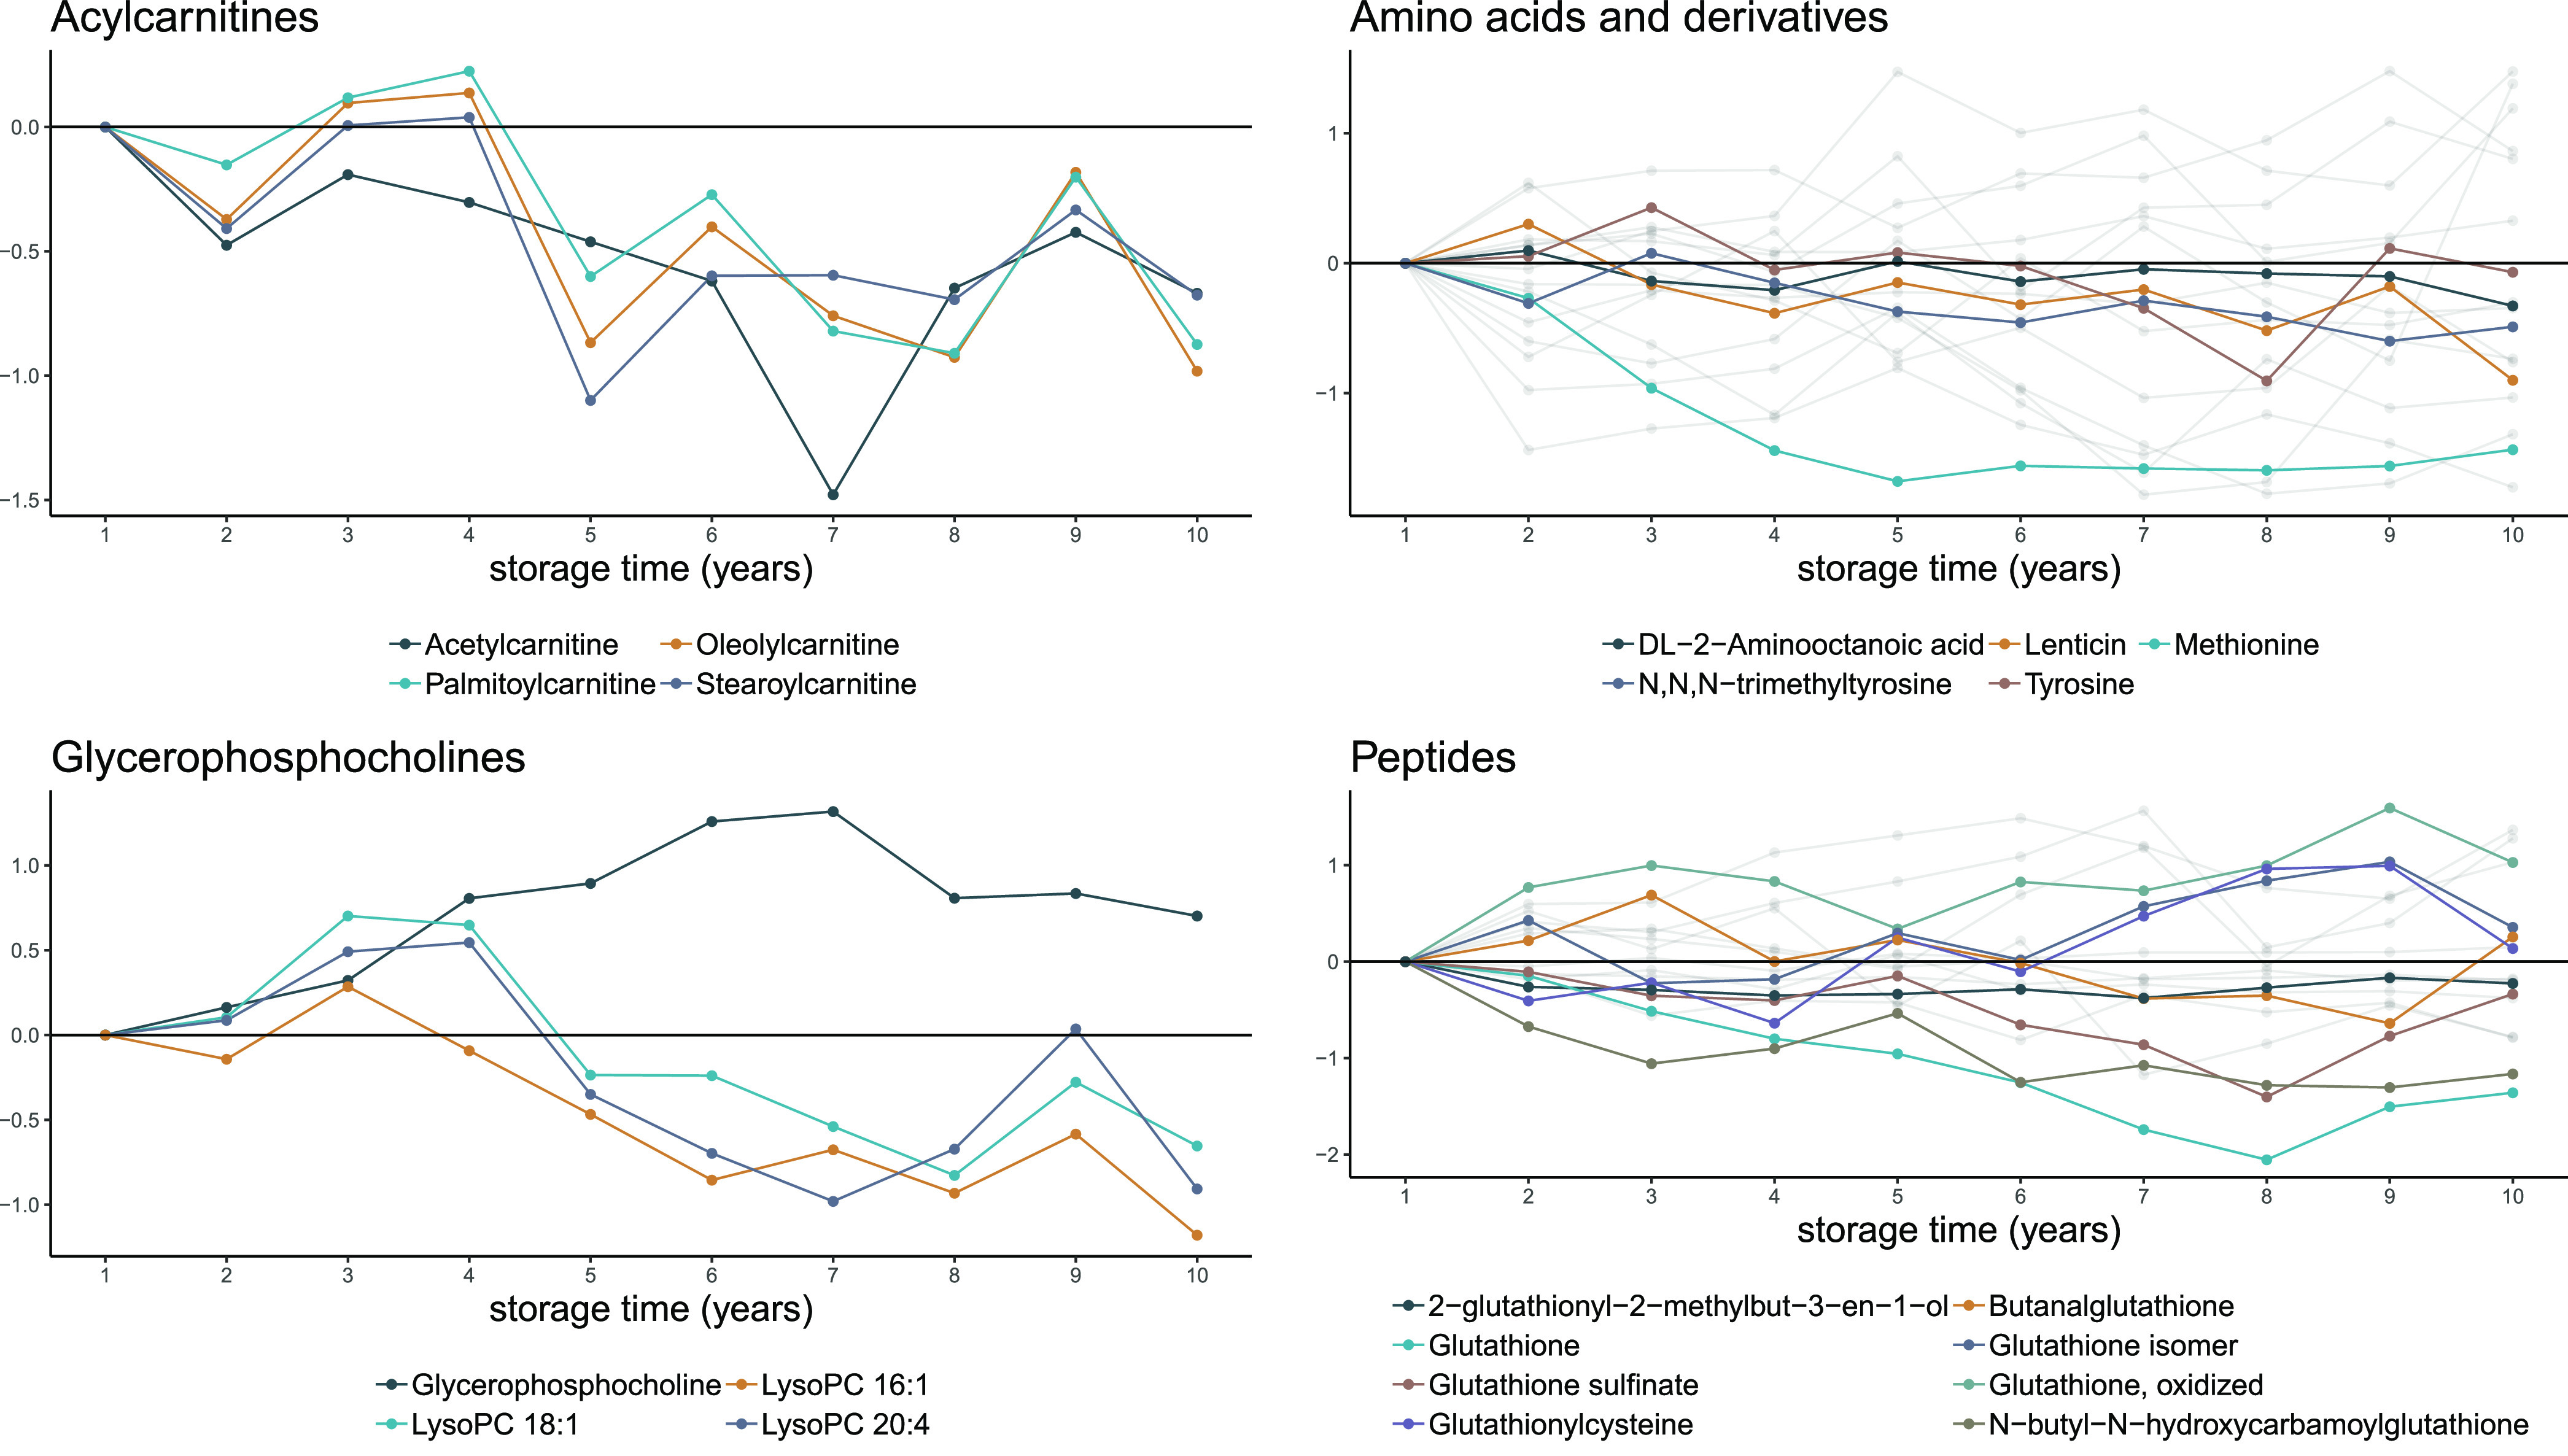
Median metabolite levels for different storage times. Data are shown for all four metabolite classes with more than one metabolite significantly associated with storage time. Only features with significant associations are shown. Metabolites without level 2 annotations are shown in gray.
Overall, similar results were achieved when comparing the results from the linear regression models with those from Spearman’s correlation coefficient tests, where 141 metabolites were significantly (FDR-adjusted P value <0.05) correlated with storage time, out of which 128 were significant using linear regression (Figure S3).
We next explored metabolite changes upon storage using a multivariate approach implemented in the timeOmics R package.32 The optimal clustering was achieved when using only the first principal component (PC1). PC1 was strongly associated with storage time, explaining 81% of the variation in storage time. The loadings of PC1 were very similar to the beta coefficients of the linear regression models (Pearson’s ρ = 0.93). For instance, glutathione was the metabolite with the strongest (negative) contribution to PC1 and among the metabolites with strongest association in the linear regression models (Figure S4).
In order to look for linear trends that do not span the entire 10 years, we performed linear splines with two segments. Among metabolites that did not have significant linear trends over 10 years, 60 metabolites were significantly associated with storage time during at least one of the segments (Table S3). These included four features with a U-shaped trend, five with an inverted U-shaped trend, 17 features with a plateau during the first 5 years (12 with late increasing trend and five with late decreasing trend), and 34 with a plateau during the last 5 years (27 with early increasing trend and 7 with early decreasing trend Figure S5).
As DBS samples are transported from the hospital or site of collection to the site of analysis or biobank at room temperature, metabolite stability may not only be influenced by storage time, but also by variations in transportation times. Therefore, we assessed the relation between transportation time and metabolite features. The time at ambient temperature (average 2.5 days) did not differ between the 10 different time points (Table S1; Figure S6A) but was significantly (FDR-adjusted P value < 0.05) associated with 58 metabolite features (Figure S6B), among which 41 were not associated with storage time (Figure S7). Nicotinamide was the metabolite feature with strongest association with time at ambient temperature (Figure S6C).
Observing both positive and negative temporal trends for metabolites, we sought to identify putative transformation pathways for metabolites in our data set. We found a total of four potential chemical transformations (Figures 3 and S8). A first putative degradation pathway involved an unknown glutathione isomer formed either by deconjugation of crotonaldehyde from 4-oxobutan-2-yl-glutathione or directly from glutathione (Figure 3). Glutathione (beta = −0.17, P = 1 × 10–13) and 4-oxobutan-2-yl-glutathione (beta = −0.06, P = 4.8e-3) were decreasing in levels with longer storage time, while levels of the unknown glutathione isomer were found to be increased with longer storage time (beta = 0.09, P = 1.8 × 10⁻⁵). In addition, we found three further potential degradation pathways, which we were only able to partially annotate (Figure S8). These included degradation of different glutathione analogoues (Figure S8A), degradation of a glycerophosphocholine to an unknown likely phosphocholine related feature, and degradation of N,N,N-trimethyltyrosine or a structural analogue thereof to phosphocholine.
Figure 3.

Putative degradation of glutathione structural analogues. Putative degradation was identified through the mass spectral molecular network and defined as two metabolite features, which (1) correlate significantly with year of sampling (FDR-adjusted P value <0.05), (2) correlate negatively with each other (Pearson’s r < 0; P value <0.05), (3) exhibit chemical structural relationship either through high tandem mass spectral similarity (cosine >0.7) or shared MS2LDA substructural motifs. Shared MS2LDA substructural motifs are further indicated in orange in the molecular structures. Mass2Motif connections are only displayed if spectral cosine similarity > 0.7.
Discussion
In order to study the long-term stability of untargeted metabolomics data in DBS stored at −20 °C, we investigated the relationship between over 700 metabolite features and sample storage up to 10 years. In total, 34.5% of the metabolite features were either associated with biobank storage at −20 °C (28.9%) or with storage at ambient temperature during transportation to the biobank (7.9%). The levels of a few metabolites, such as glutathione and methionine, may be heavily influenced by extended storage time in DBS and should be closely monitored in future studies. For most of the unstable features, the effect of storage was relatively small, with a median explained variance of 9.9%.
Applying untargeted metabolomics in prospective or retrospective cohorts has great potential, but also several challenges, including effects of long-term storage times. The plasma metabolome has been seen to be stable up to five years of storage at −80 °C,34 given that samples do not go through several freeze–thaw cycles.35 Recently, it was shown that, among 200 plasma metabolites, only 2% were significantly altered after seven years but 26% upon 16 years of storage at −80 °C.36 As opposed to plasma samples, DBS are usually stored at −20 °C or even at room temperature, emphasizing the need to ensure the stability of long-term storage. A previous study by Li and collaborators has shown that 76% of DBS metabolites in a targeted metabolomics panel, covering both polar and apolar metabolites, were influenced by storage at −80 °C up to one year. The major effect of storage was seen between months one and three, where influenced metabolites on average decreased in concentration to 60% of the original concentration, while small concentration changes were seen between months three and 12.37
There are few studies of metabolite stability in DBS over a longer time span than one year. In a targeted metabolomics study, with several samples collected over two years, alterations in metabolite stability could only be seen in samples stored at room temperature, as opposed to −20 °C.8 Rus and collaborators applied untargeted metabolomics in six individuals, who deposited DBS samples each year over a period of six years. The authors showed that 30–35% of the ∼6000 measured metabolite features had a between-sample coefficient of variation (CV) < 20%, while the majority of metabolite features displayed large alterations over time.10
In order to best capture the effect of storage, we chose to evaluate the temporal trend in the present study using linear regression models, assuming linear changes in metabolite levels over time. As opposed to the previous study by Rus and collaborators, our investigation showed that almost 70% of the measured metabolite features were unrelated to biobank storage. Among the 152 metabolites that were linearly associated with storage time, we observed that the levels of around half of the metabolites increased with storage, while the remaining decreased. This is in contrast to what was previously seen during one year of storage, where a large majority of influenced metabolites in a targeted panel decreased with time.37 It is important to note that the present study does not investigate the short-term effects of storage, since all investigated samples had a storage time of at least one year. Therefore, we cannot exclude that the relatively large short-term effects described previously also occurred in the present study. Our finding that around half of the metabolites increase with storage and half decrease indicates that chemical transformations may occur over time. This is also supported by the nonlinear trends that were detected, where some of the metabolite features had either U-shaped or inverted U-shaped temporal trends, indicating complex interactions between unstable metabolites. In addition to the effects of biobank storage, the transportation time (at ambient temperature) from the sample collection to the biobank may influence the metabolome. The time at ambient temperature (1 to 5 days) influenced around 8% of the measured features, mirroring the more rapid degradation of DBS samples that have been observed previously at room temperature.5
To further investigate chemical transformations, we combined mass spectral molecular networking, in silico structure, and substructure annotation with information on metabolites significantly increasing or decreasing over time. We found a total of four potential chemical transformations (Figures 3 and S8). One putative transformation pathway involved glutathione, a compound that is previously known to be prone to degradation in DBS samples.37 Our data suggest that a glutathione isomer is formed from glutathione degradation and/or by deconjugation of 4-oxobutan-2-yl-glutathione. Glutathione may also be oxidized to form a disulfide dimer, a process which is well-known in nature, where glutathione is a potent scavenger of reactive oxygen species.38 Our findings indicate that oxidation could contribute to glutathione degradation, since a feature putatively annotated as oxidized glutathione was significantly increasing with storage time, although, glutathione and oxidized glutathione were not inversely correlated with each other (ρ = 0.09, p = 0.18). Glutathione degradation possibly forms many structural analogues, supported further by our finding of different glutathione analogoues inversely correlated with each other (Figure S8A). In addition, our findings suggested two further putative transformation pathways (Figure S8B and C), however only limited structural information and biological interpretation could be retrieved. A glycerophosphocholine structural analogue was found to degrade to a phosphocholine related structure, whereas a feature putatively annotated as N,N,N-trimethyltyrosine or a structural analogue thereof was found to degrade to phosphocholine. We were not able to find a biochemical rationale for the degradation of the N,N,N-trimethyltyrosine structural analogue to phosphocholine. Inverse correlation could either be picked up by chance, involve a chemical intermediate, or may result from false positively annotated features.
Although the majority of the metabolites in our study were not significantly associated with storage, relatively strong associations were seen for some metabolites, such as glutathione and methionine. For instance, our results indicate that the levels of glutathione decrease at a rate of approximately 0.1–0.2 standard deviation units per year, resulting in significant imprecision when analyzing samples with very different storage time. However, for most of the unstable features, the estimated annual change was much smaller (median 0.08 sd units per year). Also the explained variance was low for many features (median 9.9%), such as 3.1% for tyrosine, despite associations being statistically significant. Overall, our results are consistent with previous studies where several of the metabolites, which are associated with storage time in the present study, have previously been reported to be unstable in DBS samples, including glutathione,37 sphingosine-1-phosphate,37 and palmitoylcarnitine.37 Additionally, we observed that acylcarnitines and lysophosphocholines were inversely associated with storage time, indicating either residual enzymatic degradation of the fatty acids or nonenzymatic hydrolysis of the headgroups upon extended storage. Consistent with the latter, we observed that the headgroup of lysophosphocholines, glycerphosphocholine, was positively associated with storage and a similar trend was seen for free carnitine, although not statistically significant after multiple-test correction. Previous studies displayed conflicting findings regarding storage of lysoPCs, where two studies in plasma have shown either increasing36 and decreasing34 concentrations of lysoPCs upon storage. In DBS, several lysoPCs have been shown to decrease in concentration during one year of storage,37 but some lysoPC species, such as LysoPC C26:0, appear to be stable.39 In our study, glycerophosphocholines were the metabolite class with the highest proportion (63%) of metabolites associated with storage time. Decreasing concentrations of acylcarnitines have been reported in several studies of both plasma34 and DBS37 samples, but no evidence of increases in free carnitine has been found previously. It is noteworthy that although we see a negative temporal trend for acylcarnitines in this study, the proportion of altered acylcarnitines (27%) was close to the overall average (21%), indicating that the stability may not be worse for acylcarnitines than for other metabolite classes.
The present study has several limitations, and results should be interpreted within this context. The study design makes it difficult to confidently disentangle biological and technical variation. We addressed this by analyzing neonatal DBS samples, with identical gestational age, age at sampling, and birth month, all factors that were previously identified to have a major effect on the DBS metabolome.11,12 Moreover, in the regression analysis, we adjusted for other potential confounding factors, such as birth weight, sex, and the mothers’ age. Despite these efforts, a limitation with the current study design is that residual biological variation may result in statistically significant differences between individual time points that are not related to storage per se. To minimize the risk of false positives, we modeled a linear association between metabolite and storage, disregarding differences between two individual time points. Results from the linear regression models were confirmed using alternative approaches using both Spearman’s correlation tests and multivariate statistics. A further technical limitation of our study is that data were only acquired in positive ion mode. A broader coverage of the metabolome could have been achieved by using different extraction solvents, chromatographic columns, as well as the negative ionization mode. As our sample material was limited, we aimed at using a single method that would give as broad coverage of annotated semipolar metabolites as possible. As most libraries and in silico tools for chemical structural annotation are built for positive ion mode data, we acquired our data using reversed-phase liquid chromatography in positive ion mode. Finally, data describing whether samples were taken out of the biobank between the original time of collection and analysis was unavailable to us for this study, representing a potential confounder that we were unable to control for.
Conclusions
The majority (>71%) of the biobanked DBS metabolome is stable during storage at −20 °C for up to 10 years. For the majority of the unstable metabolites, storage had a relatively small effect, with a median explained, variance of 9.9%, whereas a few metabolites, including methionine and glutathione, may be strongly influenced by storage. Overall, our findings confirm that untargeted metabolomics methods may be a powerful tool for the discovery of early markers of disease in biobanked neonatal heel prick samples, if storage time is taken into account appropriately. This may be done either during study design, for example by matching cases and controls on storage time in case-cohort studies, by correcting for storage time in posthoc statistical models, or by removing metabolites highlighted in the current study that vary strongly with storage time.
Acknowledgments
This research has been conducted using the Danish National Biobank resource supported by the Novo Nordisk Foundation. We thank Susan Svane Laursen for technical assistance and Cameron Martino and James T. Morton for support in the usage and assessment of DEICODE.
Glossary
Abbreviations
- LC
liquid chromatography
- MS
mass spectrometry
- MS/MS
tandem mass spectrometry
- TIMS
trapped ion mobility spectrometry
- TOF
time-of-flight
- Q-TOF
quadrupole time-of-flight
Data Availability Statement
The data underlying this study are not publicly available due to the Danish Data Protection Act and European Regulation 2016/679 of the European Parliament and of the Council (GDPR) that prohibit distribution of personal data. The data are available from the corresponding authors upon reasonable request and under a data transfer and collaboration agreement.
Supporting Information Available
The Supporting Information is available free of charge at https://pubs.acs.org/doi/10.1021/jasms.2c00358.
Figures S1–S8 (PDF)
Supplementary Data S1: Spectral mirror plots of metabolite annotations retrieved through GNPS with a spectral similarity score (cosine score) ≥ 0.7. Mirror plots were produced in Python 3.7 using the spectrum_utils package40 and spectra extracted automatically using the Metabolomics Spectrum Resolver (http://metabolomics-usi.ucsd.edu/). Experimental spectra are shown in the top panel and library spectra in the bottom panel. Nonmatching peaks are colored gray, whereas matching peaks are highlighted in black and green, respectively (PDF)
Table S1 (PDF)
Tables S2 and S3 (XLSX)
Author Contributions
F.O. performed statistical analysis and manuscript drafting, contributed to chemical structural annotation, study design, and data interpretation. F.R. contributed to the study conceptualization, design, data interpretation, statistical analysis, and manuscript draft. M.E. preprocessed LC-MS/MS data, performed statistical analysis and chemical structural annotation, created transformation networks, and contributed to study conceptualization, design, data interpretation, and manuscript draft. A.A. and N.S.J. acquired LC-MS/MS data and contributed to the preprocessing. Z.K.N and J.C. contributed to the study design, conceptualization, and data acquisition. A.C. and D.H. conceptualized and designed the study, obtained funding, and take full responsibility for compliance with data sharing policies and ethical approval of the study. All authors critically revised the manuscript for important intellectual content.
The authors declare no competing financial interest.
Supplementary Material
References
- Loeber J. G.; Platis D.; Zetterström R. H.; Almashanu S.; Boemer F.; Bonham J. R.; Borde P.; Brincat I.; Cheillan D.; Dekkers E.; Dimitrov D.; Fingerhut R.; Franzson L.; Groselj U.; Hougaard D.; Knapkova M.; Kocova M.; Kotori V.; Kozich V.; Kremezna A.; Kurkijärvi R.; La Marca G.; Mikelsaar R.; Milenkovic T.; Mitkin V.; Moldovanu F.; Ceglarek U.; O’Grady L.; Oltarzewski M.; Pettersen R. D.; Ramadza D.; Salimbayeva D.; Samardzic M.; Shamsiddinova M.; Songailiené J.; Szatmari I.; Tabatadze N.; Tezel B.; Toromanovic A.; Tovmasyan I.; Usurelu N.; Vevere P.; Vilarinho L.; Vogazianos M.; Yahyaoui R.; Zeyda M.; Schielen P. C. J. I. Neonatal Screening in Europe Revisited: An ISNS Perspective on the Current State and Developments Since 2010. IJNS 2021, 7, 15. 10.3390/ijns7010015. [DOI] [PMC free article] [PubMed] [Google Scholar]
- Wilhelm A. J.; den Burger J. C. G.; Swart E. L. Therapeutic drug monitoring by dried blood spot: progress to date and future directions. Clin. Pharmacokinet. 2014, 53, 961–973. 10.1007/s40262-014-0177-7. [DOI] [PMC free article] [PubMed] [Google Scholar]
- Thygesen L. C.; Daasnes C.; Thaulow I.; Brønnum-Hansen H. Introduction to Danish (nationwide) registers on health and social issues: structure, access, legislation, and archiving. Scand. J. Public Health 2011, 39, 12–16. 10.1177/1403494811399956. [DOI] [PubMed] [Google Scholar]
- Nørgaard-Pedersen B.; Hougaard D. M. Storage policies and use of the Danish Newborn Screening Biobank. J. Inherit. Metab. Dis. 2007, 30, 530–536. 10.1007/s10545-007-0631-x. [DOI] [PubMed] [Google Scholar]
- Michopoulos F.; Theodoridis G.; Smith C. J.; Wilson I. D. Metabolite profiles from dried blood spots for metabonomic studies using UPLC combined with orthogonal acceleration ToF-MS: effects of different papers and sample storage stability. Bioanalysis 2011, 3, 2757–2767. 10.4155/bio.11.280. [DOI] [PubMed] [Google Scholar]
- Strnadová K. A.; Holub M.; Mühl A.; Heinze G.; Ratschmann R.; Mascher H.; Stöckler-Ipsiroglu S.; Waldhauser F.; Votava F.; Lebl J.; Bodamer O. A. Long-term stability of amino acids and acylcarnitines in dried blood spots. Clin. Chem. 2007, 53, 717–722. 10.1373/clinchem.2006.076679. [DOI] [PubMed] [Google Scholar]
- Fingerhut R.; Ensenauer R.; Röschinger W.; Arnecke R.; Olgemöller B.; Roscher A. A. Stability of acylcarnitines and free carnitine in dried blood samples: implications for retrospective diagnosis of inborn errors of metabolism and neonatal screening for carnitine transporter deficiency. Anal. Chem. 2009, 81, 3571–3575. 10.1021/ac8022235. [DOI] [PubMed] [Google Scholar]
- Prentice P.; Turner C.; Wong M. C.; Dalton R. N. Stability of metabolites in dried blood spots stored at different temperatures over a 2-year period. Bioanalysis 2013, 5, 1507–1514. 10.4155/bio.13.121. [DOI] [PubMed] [Google Scholar]
- Palmer E. A.; Cooper H. J.; Dunn W. B. Investigation of the 12-Month Stability of Dried Blood and Urine Spots Applying Untargeted UHPLC-MS Metabolomic Assays. Anal. Chem. 2019, 91, 14306–14313. 10.1021/acs.analchem.9b02577. [DOI] [PubMed] [Google Scholar]
- Rus C.-M.; Di Bucchianico S.; Cozma C.; Zimmermann R.; Bauer P. Dried Blood Spot (DBS) Methodology Study for Biomarker Discovery in Lysosomal Storage Disease (LSD). Metabolites 2021, 11, 382. 10.3390/metabo11060382. [DOI] [PMC free article] [PubMed] [Google Scholar]
- Ernst M.; Rogers S.; Lausten-Thomsen U.; Björkbom A.; Laursen S. S.; Courraud J.; Børglum A.; Nordentoft M.; Werge T.; Mortensen P. B.; Hougaard D. M.; Cohen A. S. Gestational age-dependent development of the neonatal metabolome. Pediatr. Res. 2021, 89, 1396–1404. 10.1038/s41390-020-01149-z. [DOI] [PubMed] [Google Scholar]
- Courraud J.; Ernst M.; Svane Laursen S.; Hougaard D. M.; Cohen A. S. Studying Autism Using Untargeted Metabolomics in Newborn Screening Samples. J. Mol. Neurosci. 2021, 71, 1378–1393. 10.1007/s12031-020-01787-2. [DOI] [PMC free article] [PubMed] [Google Scholar]
- Kessner D.; Chambers M.; Burke R.; Agus D.; Mallick P. ProteoWizard: open source software for rapid proteomics tools development. Bioinformatics 2008, 24, 2534–2536. 10.1093/bioinformatics/btn323. [DOI] [PMC free article] [PubMed] [Google Scholar]
- Pluskal T.; Castillo S.; Villar-Briones A.; Oresic M. MZmine 2: modular framework for processing, visualizing, and analyzing mass spectrometry-based molecular profile data. BMC Bioinform. 2010, 11, 395. 10.1186/1471-2105-11-395. [DOI] [PMC free article] [PubMed] [Google Scholar]
- Schmid R.; Petras D.; Nothias L.-F.; Wang M.; Aron A. T.; Jagels A.; Tsugawa H.; Rainer J.; Garcia-Aloy M.; Duhrkop K.; Korf A.; Pluskal T.; Kamenik Z.; Jarmusch A. K.; Caraballo-Rodriguez A. M.; Weldon K. C.; Nothias-Esposito M.; Aksenov A. A.; Bauermeister A.; Albarracin Orio A.; Grundmann C. O.; Vargas F.; Koester I.; Gauglitz J. M.; Gentry E. C.; Hovelmann Y.; Kalinina S. A.; Pendergraft M. A.; Panitchpakdi M.; Tehan R.; Le Gouellec A.; Aleti G.; Mannochio Russo H.; Arndt B.; Hubner F.; Hayen H.; Zhi H.; Raffatellu M.; Prather K. A.; Aluwihare L. I.; Bocker S.; McPhail K. L.; Humpf H.-U.; Karst U.; Dorrestein P. C. Ion identity molecular networking for mass spectrometry-based metabolomics in the GNPS environment. Nat. Commun. 2021, 12, 3832. 10.1038/s41467-021-23953-9. [DOI] [PMC free article] [PubMed] [Google Scholar]
- Myers O. D.; Sumner S. J.; Li S.; Barnes S.; Du X. One Step Forward for Reducing False Positive and False Negative Compound Identifications from Mass Spectrometry Metabolomics Data: New Algorithms for Constructing Extracted Ion Chromatograms and Detecting Chromatographic Peaks. Anal. Chem. 2017, 89, 8696–8703. 10.1021/acs.analchem.7b00947. [DOI] [PubMed] [Google Scholar]
- Nothias L.-F.; Petras D.; Schmid R.; Dührkop K.; Rainer J.; Sarvepalli A.; Protsyuk I.; Ernst M.; Tsugawa H.; Fleischauer M.; Aicheler F.; Aksenov A. A.; Alka O.; Allard P.-M.; Barsch A.; Cachet X.; Caraballo-Rodriguez A. M.; Da Silva R. R.; Dang T.; Garg N.; Gauglitz J. M.; Gurevich A.; Isaac G.; Jarmusch A. K.; Kameník Z.; Kang K. B.; Kessler N.; Koester I.; Korf A.; Le Gouellec A.; Ludwig M.; Martin H C.; McCall L.-I.; McSayles J.; Meyer S. W.; Mohimani H.; Morsy M.; Moyne O.; Neumann S.; Neuweger H.; Nguyen N. H.; Nothias-Esposito M.; Paolini J.; Phelan V. V.; Pluskal T.; Quinn R. A.; Rogers S.; Shrestha B.; Tripathi A.; van der Hooft J. J. J.; Vargas F.; Weldon K. C.; Witting M.; Yang H.; Zhang Z.; Zubeil F.; Kohlbacher O.; Böcker S.; Alexandrov T.; Bandeira N.; Wang M.; Dorrestein P. C. Feature-based molecular networking in the GNPS analysis environment. Nat. Methods 2020, 17, 905–908. 10.1038/s41592-020-0933-6. [DOI] [PMC free article] [PubMed] [Google Scholar]
- Wang M.; Carver J. J.; Phelan V. V.; Sanchez L. M.; Garg N.; Peng Y.; Nguyen D. D.; Watrous J.; Kapono C. A.; Luzzatto-Knaan T.; Porto C.; Bouslimani A.; Melnik A. V.; Meehan M. J.; Liu W.-T.; Crüsemann M.; Boudreau P. D.; Esquenazi E.; Sandoval-Calderón M.; Kersten R. D.; Pace L. A.; Quinn R. A.; Duncan K. R.; Hsu C.-C.; Floros D. J.; Gavilan R. G.; Kleigrewe K.; Northen T.; Dutton R. J.; Parrot D.; Carlson E. E.; Aigle B.; Michelsen C. F.; Jelsbak L.; Sohlenkamp C.; Pevzner P.; Edlund A.; McLean J.; Piel J.; Murphy B. T.; Gerwick L.; Liaw C.-C.; Yang Y.-L.; Humpf H.-U.; Maansson M.; Keyzers R. A.; Sims A. C.; Johnson A. R.; Sidebottom A. M.; Sedio B. E.; Klitgaard A.; Larson C. B.; P C. A. B.; Torres-Mendoza D.; Gonzalez D. J.; Silva D. B.; Marques L. M.; Demarque D. P.; Pociute E.; O’Neill E. C.; Briand E.; Helfrich E. J. N.; Granatosky E. A.; Glukhov E.; Ryffel F.; Houson H.; Mohimani H.; Kharbush J. J.; Zeng Y.; Vorholt J. A.; Kurita K. L.; Charusanti P.; McPhail K. L.; Nielsen K. F.; Vuong L.; Elfeki M.; Traxler M. F.; Engene N.; Koyama N.; Vining O. B.; Baric R.; Silva R. R.; Mascuch S. J.; Tomasi S.; Jenkins S.; Macherla V.; Hoffman T.; Agarwal V.; Williams P. G.; Dai J.; Neupane R.; Gurr J.; Rodríguez A. M. C.; Lamsa A.; Zhang C.; Dorrestein K.; Duggan B. M.; Almaliti J.; Allard P.-M.; Phapale P.; Nothias L.-F.; Alexandrov T.; Litaudon M.; Wolfender J.-L.; Kyle J. E.; Metz T. O.; Peryea T.; Nguyen D.-T.; VanLeer D.; Shinn P.; Jadhav A.; Müller R.; Waters K. M.; Shi W.; Liu X.; Zhang L.; Knight R.; Jensen P. R.; Palsson B. O.; Pogliano K.; Linington R. G.; Gutiérrez M.; Lopes N. P.; Gerwick W. H.; Moore B. S.; Dorrestein P. C.; Bandeira N. Sharing and community curation of mass spectrometry data with Global Natural Products Social Molecular Networking. Nat. Biotechnol. 2016, 34, 828–837. 10.1038/nbt.3597. [DOI] [PMC free article] [PubMed] [Google Scholar]
- Bolyen E.; Rideout J. R.; Dillon M. R.; Bokulich N. A.; Abnet C. C.; Al-Ghalith G. A.; Alexander H.; Alm E. J.; Arumugam M.; Asnicar F.; Bai Y.; Bisanz J. E.; Bittinger K.; Brejnrod A.; Brislawn C. J.; Brown C. T.; Callahan B. J.; Caraballo-Rodríguez A. M.; Chase J.; Cope E. K.; Da Silva R.; Diener C.; Dorrestein P. C.; Douglas G. M.; Durall D. M.; Duvallet C.; Edwardson C. F.; Ernst M.; Estaki M.; Fouquier J.; Gauglitz J. M.; Gibbons S. M.; Gibson D. L.; Gonzalez A.; Gorlick K.; Guo J.; Hillmann B.; Holmes S.; Holste H.; Huttenhower C.; Huttley G. A.; Janssen S.; Jarmusch A. K.; Jiang L.; Kaehler B. D.; Kang K. B.; Keefe C. R.; Keim P.; Kelley S. T.; Knights D.; Koester I.; Kosciolek T.; Kreps J.; Langille M. G. I.; Lee J.; Ley R.; Liu Y.-X.; Loftfield E.; Lozupone C.; Maher M.; Marotz C.; Martin B. D.; McDonald D.; McIver L. J.; Melnik A. V.; Metcalf J. L.; Morgan S. C.; Morton J. T.; Naimey A. T.; Navas-Molina J. A.; Nothias L. F.; Orchanian S. B.; Pearson T.; Peoples S. L.; Petras D.; Preuss M. L.; Pruesse E.; Rasmussen L. B.; Rivers A.; Robeson M. S. 2nd; Rosenthal P.; Segata N.; Shaffer M.; Shiffer A.; Sinha R.; Song S. J.; Spear J. R.; Swafford A. D.; Thompson L. R.; Torres P. J.; Trinh P.; Tripathi A.; Turnbaugh P. J.; Ul-Hasan S.; van der Hooft J. J. J.; Vargas F.; Vázquez-Baeza Y.; Vogtmann E.; von Hippel M.; Walters W.; Wan Y.; Wang M.; Warren J.; Weber K. C.; Williamson C. H. D.; Willis A. D.; Xu Z. Z.; Zaneveld J. R.; Zhang Y.; Zhu Q.; Knight R.; Caporaso J. G. Reproducible, interactive, scalable and extensible microbiome data science using QIIME 2. Nat. Biotechnol. 2019, 37, 852–857. 10.1038/s41587-019-0209-9. [DOI] [PMC free article] [PubMed] [Google Scholar]
- Martino C.; Morton J. T.; Marotz C. A.; Thompson L. R.; Tripathi A.; Knight R.; Zengler K. A Novel Sparse Compositional Technique Reveals Microbial Perturbations. mSystems 2019, 4, e00016-19. 10.1128/mSystems.00016-19. [DOI] [PMC free article] [PubMed] [Google Scholar]
- Anderson M. J. A new method for non-parametric multivariate analysis of variance. Austral Ecol. 2001, 26, 32–46. 10.1111/j.1442-9993.2001.01070.pp.x. [DOI] [Google Scholar]
- van der Hooft J. J. J.; Wandy J.; Barrett M. P.; Burgess K. E. V.; Rogers S. Topic modeling for untargeted substructure exploration in metabolomics. Proc. Natl. Acad. Sci. U. S. A. 2016, 113, 13738–13743. 10.1073/pnas.1608041113. [DOI] [PMC free article] [PubMed] [Google Scholar]
- Wandy J.; Zhu Y.; van der Hooft J. J. J.; Daly R.; Barrett M. P.; Rogers S. Ms2lda.org: web-based topic modelling for substructure discovery in mass spectrometry. Bioinformatics 2018, 34, 317–318. 10.1093/bioinformatics/btx582. [DOI] [PMC free article] [PubMed] [Google Scholar]
- Rogers S.; Ong C. W.; Wandy J.; Ernst M.; Ridder L.; van der Hooft J. J. J. Deciphering complex metabolite mixtures by unsupervised and supervised substructure discovery and semi-automated annotation from MS/MS spectra. Faraday Discuss. 2019, 218, 284–302. 10.1039/C8FD00235E. [DOI] [PubMed] [Google Scholar]
- da Silva R. R.; Wang M.; Nothias L.-F.; van der Hooft J. J. J.; Caraballo-Rodríguez A. M.; Fox E.; Balunas M. J.; Klassen J. L.; Lopes N. P.; Dorrestein P. C. Propagating annotations of molecular networks using in silico fragmentation. PLoS Comput. Biol. 2018, 14, e1006089. 10.1371/journal.pcbi.1006089. [DOI] [PMC free article] [PubMed] [Google Scholar]
- Dührkop K.; Fleischauer M.; Ludwig M.; Aksenov A. A.; Melnik A. V.; Meusel M.; Dorrestein P. C.; Rousu J.; Böcker S. SIRIUS 4: a rapid tool for turning tandem mass spectra into metabolite structure information. Nat. Methods 2019, 16, 299–302. 10.1038/s41592-019-0344-8. [DOI] [PubMed] [Google Scholar]
- Ernst M.; Kang K. B.; Caraballo-Rodríguez A. M.; Nothias L.-F.; Wandy J.; Chen C.; Wang M.; Rogers S.; Medema M. H.; Dorrestein P. C.; van der Hooft J. J. J. MolNetEnhancer: Enhanced Molecular Networks by Integrating Metabolome Mining and Annotation Tools. Metabolites 2019, 9, 144. 10.3390/metabo9070144. [DOI] [PMC free article] [PubMed] [Google Scholar]
- Dührkop K.; Nothias L.-F.; Fleischauer M.; Reher R.; Ludwig M.; Hoffmann M. A.; Petras D.; Gerwick W. H.; Rousu J.; Dorrestein P. C.; Böcker S. Systematic classification of unknown metabolites using high-resolution fragmentation mass spectra. Nat. Biotechnol. 2021, 39, 462–471. 10.1038/s41587-020-0740-8. [DOI] [PubMed] [Google Scholar]
- Djoumbou Feunang Y.; Eisner R.; Knox C.; Chepelev L.; Hastings J.; Owen G.; Fahy E.; Steinbeck C.; Subramanian S.; Bolton E.; Greiner R.; Wishart D. S. ClassyFire: automated chemical classification with a comprehensive, computable taxonomy. J. Cheminform. 2016, 8, 61. 10.1186/s13321-016-0174-y. [DOI] [PMC free article] [PubMed] [Google Scholar]
- Rohart F.; Gautier B.; Singh A.; Lê Cao K.-A. mixOmics: An R package for ’omics feature selection and multiple data integration. PLoS Comput. Biol. 2017, 13, e1005752. 10.1371/journal.pcbi.1005752. [DOI] [PMC free article] [PubMed] [Google Scholar]
- Benjamini Y.; Hochberg Y. Controlling the false discovery rate: A practical and powerful approach to multiple testing. J. R. Stat. Soc. 1995, 57, 289–300. 10.1111/j.2517-6161.1995.tb02031.x. [DOI] [Google Scholar]
- Bodein A.; Chapleur O.; Droit A.; Lê Cao K.-A. A Generic Multivariate Framework for the Integration of Microbiome Longitudinal Studies With Other Data Types. Front. Genet. 2019, 10, 963. 10.3389/fgene.2019.00963. [DOI] [PMC free article] [PubMed] [Google Scholar]
- Sumner L. W.; Amberg A.; Barrett D.; Beale M. H.; Beger R.; Daykin C. A.; Fan T. W.-M.; Fiehn O.; Goodacre R.; Griffin J. L.; Hankemeier T.; Hardy N.; Harnly J.; Higashi R.; Kopka J.; Lane A. N.; Lindon J. C.; Marriott P.; Nicholls A. W.; Reily M. D.; Thaden J. J.; Viant M. R. Proposed minimum reporting standards for chemical analysis Chemical Analysis Working Group (CAWG) Metabolomics Standards Initiative (MSI). Metabolomics 2007, 3, 211–221. 10.1007/s11306-007-0082-2. [DOI] [PMC free article] [PubMed] [Google Scholar]
- Haid M.; Muschet C.; Wahl S.; Römisch-Margl W.; Prehn C.; Möller G.; Adamski J. Long-Term Stability of Human Plasma Metabolites during Storage at −80 °C. J. Proteome Res. 2018, 17, 203–211. 10.1021/acs.jproteome.7b00518. [DOI] [PubMed] [Google Scholar]
- Goodman K.; Mitchell M.; Evans A. M.; Miller L. A. D.; Ford L.; Wittmann B.; Kennedy A. D.; Toal D. Assessment of the effects of repeated freeze thawing and extended bench top processing of plasma samples using untargeted metabolomics. Metabolomics 2021, 17, 31. 10.1007/s11306-021-01782-7. [DOI] [PubMed] [Google Scholar]
- Wagner-Golbs A.; Neuber S.; Kamlage B.; Christiansen N.; Bethan B.; Rennefahrt U.; Schatz P.; Lind L. Effects of Long-Term Storage at −80 °C on the Human Plasma Metabolome. Metabolites 2019, 9, 99. 10.3390/metabo9050099. [DOI] [PMC free article] [PubMed] [Google Scholar]
- Li K.; Naviaux J. C.; Monk J. M.; Wang L.; Naviaux R. K. Improved Dried Blood Spot-Based Metabolomics: A Targeted, Broad-Spectrum, Single-Injection Method. Metabolites 2020, 10, 82. 10.3390/metabo10030082. [DOI] [PMC free article] [PubMed] [Google Scholar]
- Wu G.; Fang Y.-Z.; Yang S.; Lupton J. R.; Turner N. D. Glutathione metabolism and its implications for health. J. Nutr. 2004, 134, 489–492. 10.1093/jn/134.3.489. [DOI] [PubMed] [Google Scholar]
- Haynes C. A.; De Jesús V. R. The stability of hexacosanoyl lysophosphatidylcholine in dried-blood spot quality control materials for X-linked adrenoleukodystrophy newborn screening. Clin. Biochem. 2015, 48, 8–10. 10.1016/j.clinbiochem.2014.10.001. [DOI] [PMC free article] [PubMed] [Google Scholar]
- Bittremieux W. spectrum_utils: A Python Package for Mass Spectrometry Data Processing and Visualization. Anal. Chem. 2020, 92, 659–661. 10.1021/acs.analchem.9b04884. [DOI] [PubMed] [Google Scholar]
Associated Data
This section collects any data citations, data availability statements, or supplementary materials included in this article.
Supplementary Materials
Data Availability Statement
The data underlying this study are not publicly available due to the Danish Data Protection Act and European Regulation 2016/679 of the European Parliament and of the Council (GDPR) that prohibit distribution of personal data. The data are available from the corresponding authors upon reasonable request and under a data transfer and collaboration agreement.