

Abstract
This Perspective argues that most redox reactions of materials at an interface with a protic solution involve net proton-coupled electron transfer (PCET) (or other cation-coupled ET). This view contrasts with the traditional electron-transfer-focused view of redox reactions at semiconductors, but redox processes at metal surfaces are often described as PCET. Taking a thermodynamic perspective, transfer of an electron is typically accompanied by a stoichiometric proton, much as the chemistry of lithium-ion batteries involves coupled transfers of e– and Li+. The PCET viewpoint implicates the surface–H bond dissociation free energy (BDFE) as the preeminent energetic parameter and its conceptual equivalents, the electrochemical ne–/nH+ potential versus the reversible hydrogen electrode (RHE) and the free energy of hydrogenation, ΔG°H. These parameters capture the thermochemistry of PCET at interfaces better than electronic parameters such as Fermi energies, electron chemical potentials, flat-band potentials, or band-edge energies. A unified picture of PCET at metal and semiconductor surfaces is presented. Exceptions, limitations, implications, and future directions motivated by this approach are described.
I. Introduction
Redox reactions at solid–solution interfaces are important in electrochemistry, (photo)electrocatalysis, corrosion, metal production and electroplating, pseudocapacitors, batteries, and other applications. These various areas have developed somewhat different conceptual models. This Perspective develops a common description for many of these processes as proton-coupled electron transfer (PCET), and its relative cation-coupled electron transfer. Examples are given for redox reactions at metal surfaces, at semiconductor surfaces, and of molecules, in contact with aqueous media or other solvents with significant proton activity. The broad PCET perspective prompts a reconsideration of some common descriptions of interfacial redox reactions, especially at semiconductor/solution interfaces.
This Perspective was in part inspired by a 2010 JACS Perspective by Allen J. Bard,1 “Inner-Sphere Heterogeneous Electrode Reactions. Electrocatalysis and Photocatalysis: The Challenge.” Over the last dozen years, such chemical/electrical energy conversions have taken on new urgency because of climate change. Some of the critical (photo)electrochemical reactions that new energy systems will need to catalyze are shown in eqs 1–4.
| 1 |
| 2 |
| 3 |
| 4 |
These need to be catalyzed in both directions, at high rates, with high efficiencies, and using earth-abundant materials. Bard emphasized that such catalysis requires inner-sphere reactivity at the electrode surface, making and breaking bonds to surface atoms. This requirement follows from the typically extreme potentials needed to oxidize or reduce the neutral substrates by outer-sphere electron transfer (ET). Many inner-sphere reactions involve surface–hydrogen bonds. This motivates a PCET description, especially since eqs 1–4 are each PCET processes.
Many laboratories around the world are working on these challenges and probing redox bond making/breaking at solid/solution interfaces (e.g., refs (2−13)). This Perspective is far from comprehensive but rather aims to highlight the generality of PCET at interfaces and to develop the general principles and issues. The Perspective does not claim that all redox reactions at solid–protic solution interfaces are PCET, but the title “Bonds over Electrons” is meant to encourage a PCET way of thinking.
II. Traditional Models for Interfacial Redox Reactions
Interfacial, inner-sphere PCET reactions are not novel. PCET steps have been implicated in the mechanism of the hydrogen evolution reaction (HER) since the early 20th century.14 The Volmer and Heyrovsky steps in Scheme 1 explicitly involve e– and H+, and the Tafel step involves the movement of hydrogen atoms that are implicitly e– plus H+. These are the paradigmatic redox steps for catalytic and electrocatalytic processes at metal/solution interfaces, and they are all PCET.
Scheme 1. Elementary Steps in the Electrochemical Hydrogen Evolution and Oxidation Reactions (HER/HOR).

These concepts have recently been extended to carbon surfaces with attached acid/base sites by Surendranath, Hammes-Schiffer, and co-workers.6,15 When a carboxylic acid is strongly conjugated into the graphitic band structure, deprotonation is coupled to ET in a PCET process (Figure 1), and there is a clear electrochemical response. This is in essence the reverse of the Volmer reaction (Scheme 1). Yet when a single CH2 group is inserted between the carboxylic acid and the graphitic structure, breaking the conjugation and moving the carboxylate further into the solution, proton transfer (PT) becomes uncoupled from ET.6,15
Figure 1.

Schematic of the carboxylic acid-conjugated graphite surface, showing coupled ET and PT. The background colors represent the electrostatic potentials referenced to the point of zero free charge (PZFC). Reproduced from ref (15). Copyright 2020 American Chemical Society.
In contrast with the widespread recognition of PCET reactions at metallic surfaces, redox reactions at semiconductor/solution interfaces have been predominantly discussed with a band-structure model.16−21
In a simple version of this electron-focused model, the separated
semiconductor and solution have characteristic electrochemical and
chemical potentials for the electron,  and μe, respectively. These are defined by the Fermi energy in the solid
and the reduction potential of an electroactive species in solution
(Figure 2a).22 Bringing these phases into contact makes two
potentials equal via movement of electrons and/or holes (e–/h+) into or out of
the surface layer of the semiconductor. The solution potential remains
essentially fixed because of the large excess of the solution molecular
species over the surface e–/h+. The e–/h+ movement creates a space-charge region
near the semiconductor surface, with an internal electric field (Figure 2b). This model follows
directly from well-established solid-state physics of semiconductors,
resembling the interface of n-type and p-type semiconductors in a diode. We will refer to this as the “Gerischer
model.”
and μe, respectively. These are defined by the Fermi energy in the solid
and the reduction potential of an electroactive species in solution
(Figure 2a).22 Bringing these phases into contact makes two
potentials equal via movement of electrons and/or holes (e–/h+) into or out of
the surface layer of the semiconductor. The solution potential remains
essentially fixed because of the large excess of the solution molecular
species over the surface e–/h+. The e–/h+ movement creates a space-charge region
near the semiconductor surface, with an internal electric field (Figure 2b). This model follows
directly from well-established solid-state physics of semiconductors,
resembling the interface of n-type and p-type semiconductors in a diode. We will refer to this as the “Gerischer
model.”
Figure 2.

Contact of an n-type semiconductor with a solution containing a molecular redox couple D+/D. (a) Before contact and (b) after contact. Reproduced with permission from ref (23). Copyright 2013 Institute of Physics Publishing.
In this model, reduction of a semiconductor involves adding an electron to the conduction band (CB) (or a trap state close in energy). Similarly, oxidations add holes or remove electrons to/from the filled valence band (VB). Therefore, the thermodynamic energies of the CB and VB are key parameters of a material, for instance for driving solar fuel reactions such as eqs 1–4.
The CB and VB energies for different materials in contact with aqueous solutions are often summarized in diagrams such as Figure 3(24) (examples go back to at least 197819,20). Figure 3 shows band energies specifically at pH 1 versus NHE, but these are often shown at other pHs (e.g., pH 7 in ref (20)) or versus the reversible hydrogen electrode (RHE). These band energy diagrams are valuable but often misleading. For instance, the electrochemical potential scale should not be placed next to the work function in vacuum because the material surface at pH 1 is quite different than the same material in vacuo. Most semiconductor surfaces are significantly protonated at pH 1. The band potentials versus NHE move substantially with pH (see below) while the work function does not, as there is no pH in vacuo.
Figure 3.
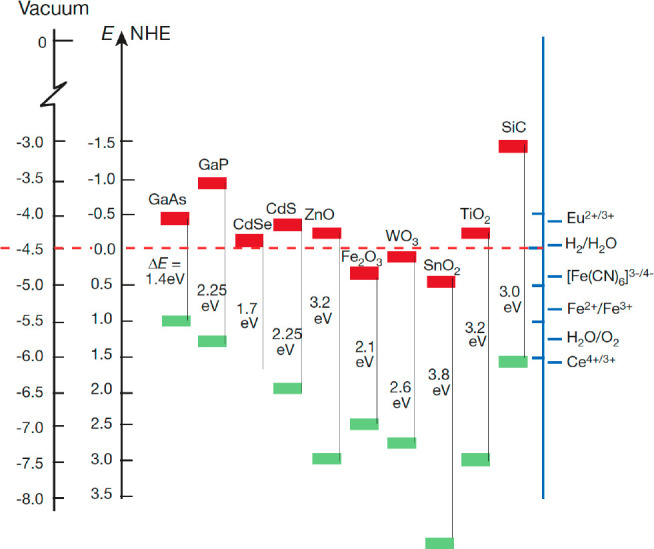
“Band positions of several semiconductors in contact with aqueous electrolyte at pH 1. The lower edge of the conduction band (red colour) and upper edge of the valence band (green colour) are presented along with the band gap in electron volts. The energy scale is indicated in electron volts using either the normal hydrogen electrode (NHE) or the vacuum level as a reference...” Figure and caption reproduced with permission from ref (24). Copyright 2001 Springer Nature.
This electronic band-structure or Gerischer model has been central to semiconductor electrochemistry and photoelectrochemistry for half a century. It has been very successful and appears in multiple papers published daily.
Despite its success, this Perspective argues that the Gerischer model is incomplete in the ways that it is commonly used. The model implicitly assumes that the surface does not undergo any chemical change. Only the electrons move in response to the contact between surface and solution. This assumption is usually fine for the interface between two solids, but electrocatalysis is often done in corrosive media containing acids, bases, and electrolyte ions. As emphasized in Bard’s perspective, bonds are made and broken at the solid surface and redox changes occur in the material.1 Please note that we find no fault in the work of late Professor Dr. Gerischer, who was a giant in this field. He was completely aware that this model would not apply in a simple way to cases where ions bound to or intercalated into a solid (cf., ref (25)). We argue here that the Gerischer model is being applied to systems that do not follow its underlying assumptions. In our view, the typical −59 mV/pH dependence of semiconductor band edge energies with pH (see below) implicates surface chemical change, specifically proton binding and PCET. This changes the interpretation of Figure 3, as discussed below.
III. Introduction to PCET
Proton-coupled electron transfer (PCET) has become a significant theme in many areas of chemistry.26−28 Overlapping PCET research in inorganic chemistry, organic chemistry, biological chemistry, physical chemistry, electrochemistry, and chemical theory has enriched all of these areas. PCET generally refers to chemical processes whose rates and/or thermochemistry are affected by the movement of electron(s) and proton(s). The energy reactions 1–4 are examples of multielectron PCET, as are most biochemical energy conversions. In fact, the mitochondrial “electron transport chain” should really be called the proton-coupled electron transport chain.
These nH+/ne– PCET processes proceed in many mechanistic steps. The protons and electrons can transfer in sequential steps or in the same kinetic step (the latter termed concerted proton–electron transfer, CPET).25 Within the class of CPET reactions, the e– and H+ can transfer together as a hydrogen atom or they can transfer in one step but be physically separated in the reactants or products.29 For instance, a CPET reaction could involve an e– from an external circuit via an electrode and a H+ from a solution reagent.30,31 Some of these cases are illustrated for molecules and interfaces in Scheme 2. The Volmer and Heyrovsky reactions in Scheme 1 can be considered examples of reaction class B1, while the Tafel reaction is closer to B2 (with Y = H also being bound to the surface). Even in a stepwise mechanism such as ET followed by PT, the two steps are thermodynamically coupled, as described in section V (and in our recent review of PCET thermochemistry26).
Scheme 2. Schematic PCET Half and Whole Reactions with Molecules (A) and Materials (B), Illustrated for a Binary Material.

IV. Molecular and Interfacial PCET Stoichiometry
The study of chemical reactions begins with stoichiometry: the composition of the reactants and products and a balanced chemical equation. Stoichiometry is critical for electronic structure calculations, thermochemical analyses, yields, selectivity, and more. For this PCET Perspective, three kinds of stoichiometry are important: (i) the ratio of m protons to n electrons being transferred, (ii) the number of H+ and e– transferred per molecule or per surface site, and (iii) changes in the composition of the molecule or surface that accompany PCET. For instance, a hydroxide-covered metal surface is reduced by 1H+/1e– PCET with loss of H2O to give the bare surface.
For small-molecule
PCET reactions, the H+/e– stoichiometry  is always a ratio of integers by Dalton’s
law (eq 5). Single-step
PCET reactions are typically 1e–/1H+ (often H• transfer29), and some are 2e–/1H+ or hydride transfers. From a molecular perspective, the Heyrovsky
reaction in Scheme 1 can be viewed as hydride transfer from the surface to H+ in solution, forming H2.
is always a ratio of integers by Dalton’s
law (eq 5). Single-step
PCET reactions are typically 1e–/1H+ (often H• transfer29), and some are 2e–/1H+ or hydride transfers. From a molecular perspective, the Heyrovsky
reaction in Scheme 1 can be viewed as hydride transfer from the surface to H+ in solution, forming H2.
| 5 |
A valuable way to measure
the H+/e– ratio of a
molecular half reaction (eq 5) is to determine the electrochemical
potential or an equilibrium constant as a function of pH (or proton
activity aH+ in nonaqueous
media).26 The Nernst equation (eq 6) gives the dependence
of E on [H+] (eq 6). Converting from ln to log so that log[H+]−1 = pH and entering the constants with T = 298 K gives eq 7, with the Nernst constant of 59.2 mV/decade. Plots of E versus pH thus have slopes of 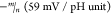 , where
  is the proton/electron stoichiometry (eq 8). In buffered aprotic
solvents, the buffer pKa and ratio of
components are involved instead of the pH.26 In all cases, a slope of −59.2 mV per decade in proton activity
indicates equal numbers of H+ and e– transferring
is the proton/electron stoichiometry (eq 8). In buffered aprotic
solvents, the buffer pKa and ratio of
components are involved instead of the pH.26 In all cases, a slope of −59.2 mV per decade in proton activity
indicates equal numbers of H+ and e– transferring  in the reaction that the E refers to.
| 6 |
| 7 |
| 8 |
The redox energetics of many materials vary with pH by roughly the “Nernstian” −59 mV/pH. This is evident from Pourbaix’s Atlas of Electrochemical Equilibria in Aqueous Solutions, which summarizes the redox chemistry of bulk oxide and hydroxide solids in contact with aqueous solutions as a function of pH across the whole Periodic Table.32 Reactions at metal surfaces, such as the Volmer reaction (Scheme 1), show such a Nernstian shift with pH (see section VII below). The CB and VB energies of semiconductor interfaces also shift approximately −59 mV/pH in most cases, and this shift is usually assumed in band-energy diagrams such as Figure 3. This thermochemical property is thus common across a wide range of situations: for molecules, metals, oxides, and other materials, in solution, in bulk, and at interfaces. This commonality suggests a single origin: PCET. In fact, the definition of PCET above states that the dependence of a potential or free energy on the proton activity is prima facie evidence for a PCET process (though this is not the common view for semiconductor interfaces, see below).
The widespread observation of approximately −59 mV/pH shifts in potential has prompted the frequent use of the reversible hydrogen electrode (RHE) as the electrochemical reference scale (eq 9). RHE itself moves −59.2 mV/pH versus a pH-independent scale like SHE or SCE (from the Nernst equation at 298 K). Thus, many PCET potentials for molecular and interfacial reactions, including eqs 1–4, are constant versus RHE at different pHs. We have advocated for extending the use of RHE as the reference electrode for PCET in nonaqueous electrochemical media, as this connects reduction potentials to the free energy of H2(g)26 (see below). RHE can be determined experimentally in organic solvents in a wide range of media and buffers.26,33,34
| 9 |
While the text above segued simply from molecules to materials for the ideal −59.2 mV/pH cases, there are additional complications for interfaces, bulk materials, and other extended structures. For instance, some interfaces have pH dependences that deviate substantially from −59.2 mV/pH and integer ratios (section XI, subsection iii). Interfaces often have a variety of surface sites with different properties, unlike molecules which are all identical (except for impurities). Surface reconstruction can occur in operando and can be driven by the binding of ligands to the surface.35−39 Even on highly crystalline surfaces such as Pt(111), the first H added is often not chemically the same as the last one (section XI, subsection iv).40
The complexities of interfaces emphasize the importance of stoichiometry beyond the proton/electron ratio. For this analysis, we will use the common H+/e– PCET ratio of one, so that the species on the surface can be viewed as hydrogen atoms (H+ + e– = H•). Unlike a molecule X that can add an integer number of H atoms (XH, XH2, etc.), on a surface any value of the surface coverage θH is possible. The maximum (saturation) coverage can be one H for every surface atom, or 1 H per 100 surface atoms, and may depend on the experimental conditions.
Direct determination of stoichiometry can be challenging because of the small number of atoms on a surface and because hydrogen is not easily detected by most spectroscopic and surface techniques. Still, there are indirect ways to quantify surface hydrogen. Titration of surface H with a soluble reagent can give accurate quantification if the chemistry is well-defined and the small amount of soluble product can be measured (cf., the reverse of eq B2 in Scheme 2). Another chemical method is temperature-programmed desorption (TPD), when H2 and other desorbed products are identified and quantified while heating a material.
The full surface stoichiometry is particularly challenging to establish for binary or ternary materials, MXn, which are of increasing interest as substitutes for noble metal catalysts.41 When more than one kind of element is present, the stoichiometry and structure of a catalytic surface is often not the same as the bulk. For IrO2 catalysis of the oxygen evolution reaction (OER), for example, well-ordered, single crystal surfaces are much poorer catalysts than amorphous, hydrated, mixed-valent surfaces.42,43 As noted above, the conditions being considered in this Perspective are typically corrosive, with acidic or basic solutions and with the materials undergoing chemical change.
While stoichiometry is needed to understand PCET at interfaces, stoichiometry and thermochemistry are blind to structure. A Nernstian dependence (eq 7) will usually not distinguish between H intercalated inside a material, H covalently bonded to a surface atom, or perhaps H+ close enough to the surface to be within the electrochemical double layer (or even a state of equilibrium among these three limiting cases).44−47
V. Thermodynamic Coupling between Proton and Electron Transfers
Thermochemistry is a second cornerstone of PCET chemistry. One would not analyze an ET or PT reaction without knowledge of the relevant E°s and pKa’s, and PCET is the same.
PCET thermochemistry is typically described
using “square
schemes” such as Scheme 3. The horizontal reactions are PT, and the vertical ones are
ET (following the format of Pourbaix and geochemical pE/pH diagrams.)32,48−50 The diagonal
represents the transfer of both e– and H+, the net transfer of a hydrogen atom, and its
energy is the bond dissociation free energy of X–H, BDFE(X–H)
(eq 10a).
Scheme 3. PCET Square Scheme for a Single Reagent XH, Showing ET (vertical), PT (horizontal), and Concerted PCET (Diagonal).

The square scheme shows five thermodynamic parameters, but only three values are independent. ΔG° is a state function, so the sum of energies around any closed loop back to the same point has ΔG° = 0 (Hess’s Law). For example, the loop around the outside of the square shows that the difference in the pKa values must be equal to the difference in E values, after the appropriate conversions to ΔG° (eq 11; energies in kcal mol–1). A detailed discussion of the thermochemistry of PCET reagents is given in a recent review.26
| 11 |
The BDFE (the diagonal of Scheme 3) is conceptually the sum of a pKa and a 1e– reduction potential E. The reactions for the pKa and E° just have to sum to the diagonal (i.e., not the pKa and E° of X from the top left corner). Irrespective of their origin, the e– and H+ together form H•.26 Thermodynamic analyses of H-atom transfers and “separated” PCET reactions (section III) are the same. The thermochemistry being the same regardless of the e– and H+ sites is key to applying BDFEs to a material interface.
The BDFE is quantitatively obtained by converting the pKa and E° to free energies and adding the ΔG° for e– + H+ → H•, known as CG (eq 12; all species other than e– are in solution).26 With RHE as the electrochemical reference, CG becomes almost solvent independent, 52 ± 1 kcal mol–1.26 When the measured reduction potential is for a 1e–/1H+ process (eq 10b), E°(1e–/1H+ vs RHE) directly gives the BDFE via eq 13. This RHE potential (actually eE°) is the same as the free energy of hydrogenation per H, ΔGH (eqs 10c and 14, because the definition of RHE is 1e– + 1H+ = 1/2H2(g) (eq 9). Thus, the PCET approach directly connects ΔGH, a commonly used parameter in gas/solid heterogeneous catalysis, with the solution electrochemical potential E°(1e–/1H+ vs RHE). The three parameters in eq 10a–c are conceptually the same, differing only by constants.26 They are the best energetic parameters for ne–/nH+ PCET, both for molecules and for materials. We prefer BDFEs only because they more intuitively connect to molecular chemistry.
| 12 |
| 13 |
| 14 |
Most studies of semiconducting materials tacitly assume that ET and PT at the surface are independent and not coupled. The surface undergoes rapid protonation/deprotonation upon contact with the solution, which creates a positive or negative surface charge.51 This is independent of any ET processes. Then ET at the surface occurs without any change in the surface proton coverage. This is the traditional explanation of the Nernstian pH dependence51 and is discussed in section IX below. Taking PT and ET as uncoupled reactions is equivalent to assuming that the surface pKa does not change with electron occupancy (that both sides of eq 11 are zero). This independence of PT and ET is implicit in what we refer to as the Gerischer model within this Perspective (Figures 2 and 3).
At metal surfaces, however, the Volmer, Heyrovsky, and Tafel reactions require that the ET and PT steps are closely coupled, that each electron is transferred with a proton (Scheme 1). This tight coupling means that the effective pKa of the surface changes upon electron transfer or, equivalently, that the effective E° changes upon proton transfer (eq 11). Strong coupling is common in molecular PCET. For p-xylene, for instance, the pKa drops by 58 units upon ET to form the radical cation, and the E° drops by ∼3.5 V upon deprotonation to the carbanion.26 This strong ET/PT coupling makes PCET different than separate ET + PT. Strong coupling PCET is inherently different from the electron-focused “Gerischer model”.
VI. Analogy between PCET and Lithium-Ion Batteries: The “Battery Model”
Lithium-ion batteries (LIBs) are analogous to PCET in that both involve cation transfer coupled to ET. Writing a “square scheme” for LIBs, deconstructing the ET and Li+-binding steps into individual e– and Li+ transfers, makes this analogy explicit (Scheme 4). Scheme 4 is directly parallel to Scheme 3 for PCET. In LIBs, every e– transferred is accompanied by Li+ transfer, in both charging and discharging, at both the anode and the cathode. It is not typically valuable to consider the transfer of just an e– or just a Li+ in LIBs because their transfers are tightly coupled. These issues are common to most batteries, so we call this the “battery model.”52,53
Scheme 4. 
 Battery Anode or Cathode.

Adapted from ref (53). Copyright 2019 American Chemical Society.
The strong e–/Li+ coupling in the battery model requires that the battery electrode material has a larger affinity to bind or intercalate a Li+ after an e– is added.53 Using the quasi-equilibrium constants in Scheme 4, KLi(■•e−) must be larger than KLi(■) (the solid square indicates the material). In a computational example, the KLi for Li+ intercalation into small TiO2 clusters was calculated to increase by 108 upon addition of 1e–.54 The shift in KLi(■) is the same as the change in E(■) upon Li+ binding because the analysis is exactly parallel that for PCET (eq 11). The Li electrode reference used for batteries (eq 15) is conceptually the same as RHE. The battery model requires that the properties of the material change upon addition of e– or X+, in contrast to the independence of ET and PT in the Gerischer model.
| 15 |
The battery model depends only on the 1:1 stoichiometry of the reaction. It is independent of the details of the material. It is the same for Li+ intercalated into a solid, as for graphite anodes and for oxide cathodes such as LixCoO2, or for Li+ added to the surface of a Li metal anode. The 1:1 stoichiometry is often favored because it achieves local charge balance, in LIBs as in the Volmer, Heyrovsky, and Tafel reactions.
An important implication of this analysis is that a material that undergoes PCET or Li+-coupled ET cannot be characterized by a single work function, Fermi energy, or valence-conduction band energies. These terms reflect primarily the energy of an electron. The electronic energies must change upon addition of the cation, and the cation affinity must change upon addition of e–, or else the reaction would not be a coupled transfer. Thus, the ubiquitous use of such single, electron-only parameters to characterize interfacial redox reactions is inappropriate when the stoichiometry is 1e–/1H+ (or 1e–/1M+). With this stoichiometry the measured energy is not an electronic energy, it is the surface–H BDFE, and the ΔG to add e– + H+ or an H atom (or a Li atom).
VII. PCET at Metal Interfaces
Protonation of metal surfaces is established as a 1e–/1H+ PCET process, the Volmer reaction (Scheme 1).55−57 From one perspective, the reaction is PCET because bringing a 1+ charge to the surface of a metal will generate a 1– image charge in the metal, which requires one electron.
One of the best studied cases of metal hydrogenation is the formation of underpotential deposited hydrogen (UPD-H) on platinum.56 CVs of Pt(111) single crystal faces show reversible Faradaic current between +0.3 and 0 V versus SHE at pH 1 (Figure 4, top).58 This wave corresponds to the formation of UPD-H by the Volmer reaction. The broad CV peak shifts approximately −59 mV/pH over the normal pH range (Figure 4, bottom), so its potential is essentially constant versus RHE. On the basis of the Nernstian shift and other studies, the reaction occurring has the 1:1 e–: H+ Volmer stoichiometry.56 In addition, UPD-H is the same as the H added to Pt with H2, which must be 1e–/1H+. This well studied system is thought to be representative of all electrochemical additions of protons to metal surfaces (“proton discharge”). As discussed in section XI, subsection iv below, there is also a second kind of H on Pt(111): overpotential hydrogen (OPD-H), the catalytically active form.
Figure 4.
Top: Cyclic voltammogram of Pt(111) in 0.1 M HClO4 sweep rate 50 mV s–1, with the UPD-H region labeled. Adapted with permission from ref (64). Copyright 2008 Royal Society of Chemistry. Bottom: Cyclic voltammetry of a Pt(111) electrode at different solution pH’s (scan rate: 50 mV s–1). The wave for UPD hydrogen is the shape at the left in each CV, with the pH inscribed inside. Reprinted with permission from ref (58). Copyright 2015 Elsevier.
The conclusion of PCET at metal surfaces has interesting implications. Metal surfaces follow the battery model, not the Gerischer model. In the Volmer reaction, the approach of an H+ to the surface draws an e– from the potentiostat, whether a surface monolayer or intercalated H are formed (UPD-H on Pt or H addition to Pd). Further implications are developed in the next section.
VIII. Equivalence of Electrochemical (Faradaic) and Non-Faradaic PCET
Interfacial ne–/nH+ PCET reactions are the same whether they occur by a chemical reaction or an electrochemical process. The same Pt–H is made by the electrochemical Volmer half reaction and by the chemical reaction of the Pt surface with H2. The reduction of ethylene to ethane can be accomplished electrochemically with 2e– + 2H+ or chemically with H2. The same surface intermediates are involved (under similar conditions).
The equivalence of the chemical and electrochemical processes extends to their thermodynamic parameters. For an ne–/nH+ PCET reaction referenced to RHE (eq 16), the electrochemical potential ERHE (actually eERHE) is the same as the chemical free energy of hydrogenation (per H; eq 17). This identity holds in any solvent, at any solution proton activity, and at any X/Xn concentration ratio, because RHE connects e– + H+ with H2(g), which is the common “anchor”: eq 16 – eq 9 = eq 17. A longstanding example is the connection between the Volmer reaction and surface–H binding free energies (via eqs 12–14 above).56,59−63
| 16 |
| –9 |
| 17 |
The specific equality of eERHE and ΔGH does not hold when there are unequal numbers of protons and electrons, for instance for hydride transfer reactions (2e–/H+ = H–), or when any reference electrode other than RHE is used.
The unusual feature of a ne–/nH+ PCET half reaction is that it is charged-balanced (eq 16). Fundamentally, electrochemistry is about the movement of charges, and ne–/nH+ transfers from a solution to an interface do not involve the net movement of charge. This makes the correspondence with a chemical (whole) reaction more direct.
A central parameter in outer-sphere ET reactions at electrodes
is the electrochemical potential of the electron  . In general, the electrochemical potential
for a species i with charge zi (μ̅i, eq 18) is the chemical potential μi (eq 19) plus the work to bring the species from standard state to an electrical
potential ϕ.8 For example, the Volmer
reaction at equilibrium at a Pt surface can be written in terms of
the electron and proton electrochemical potentials
. In general, the electrochemical potential
for a species i with charge zi (μ̅i, eq 18) is the chemical potential μi (eq 19) plus the work to bring the species from standard state to an electrical
potential ϕ.8 For example, the Volmer
reaction at equilibrium at a Pt surface can be written in terms of
the electron and proton electrochemical potentials  and
and  (eq 20).
  and
and  are intuitive experimental variables: the
potentiostat adjusts
are intuitive experimental variables: the
potentiostat adjusts  , and added reagents adjust
  . This separability is in the definition
of the chemical potential because the partial derivative is explicitly
with the amounts of the other species held constant (∂nj≠i = 0, eq 19). However, the stoichiometry
of the Volmer reaction (eq 21) requires that
. This separability is in the definition
of the chemical potential because the partial derivative is explicitly
with the amounts of the other species held constant (∂nj≠i = 0, eq 19). However, the stoichiometry
of the Volmer reaction (eq 21) requires that  and
and  be coupled.
| 18 |
| 19 |
| 20 |
| 21 |
The e–/H+ coupling in a PCET reaction
means that both  and
and  are needed to describe the thermochemistry.
The equivalence of E°(1e–/1H+ vs RHE) and ΔGH shows that PCET cannot be developed using primarily
the electrochemical potential of the electron,
are needed to describe the thermochemistry.
The equivalence of E°(1e–/1H+ vs RHE) and ΔGH shows that PCET cannot be developed using primarily
the electrochemical potential of the electron,  . In general, measured electrochemical cell
potentials report on the overall reaction that is occurring (E = ΔG/nF), not
simply on
. In general, measured electrochemical cell
potentials report on the overall reaction that is occurring (E = ΔG/nF), not
simply on  . For example, the potential for oxidizing
copper metal to [Cu(NH3)4]2+ includes
the removal of Cu from the metal, its oxidation to Cu2+, and binding of NH3 ligands. Similarly, PCET includes
ET and PT, so
. For example, the potential for oxidizing
copper metal to [Cu(NH3)4]2+ includes
the removal of Cu from the metal, its oxidation to Cu2+, and binding of NH3 ligands. Similarly, PCET includes
ET and PT, so  is always paired with
  .
.
IX. PCET at Semiconductors
The potentials versus NHE for most semiconductor/aqueous interfaces shift −59 mV/pH (see also section XI, subsection iii below). This shift means that the pH or proton activity should be specified in any potential measurement. A Nernstian shift is often implicit in diagrams such as Figure 3, for instance being used to extrapolate measured values to pHs where the materials are unstable or soluble (e.g., ZnO and Fe2O3 at low pH). The assumption of a Nernstian shift should perhaps be explicit when the semiconductor potentials are lined up with the H2/H2O and O2/H2O couples (eqs 1 and 2), and when potentials are given versus RHE.
The Nernstian −59 mV/pH shift of the band edge or flat-band potentials is traditionally explained by changes in surface charge.51 At lower pH, surfaces are more protonated and therefore more positively charged, so it is easier to add electrons (more positive potentials). The Nernstian slope is predicted when the proton surface coverage is proportional to the solution proton activity (pH or aH+).51 As noted above, this model assumes independent ET and PT, as the PT happens before any current is passed.
An early study that questioned the surface charging explanation examined the variation in the TiO2 conduction band energy over 1040 in aH+ (Figure 5A).65 For the middle 25 orders of magnitude, the ECB varied 64 mV per −log(aH+). The surface H+ concentration cannot change by 1025, as there are not enough surface sites (∼1014 cm2).66 With the use of an electrochemical quartz crystal microbalance, reduction of the TiO2 caused twice as much mass gain in D2O as in H2O. The authors therefore suggested that “electrochemical generation of Ti(III) trap sites ... is accompanied quantitatively by proton intercalation”, in other words, PCET.65
Figure 5.
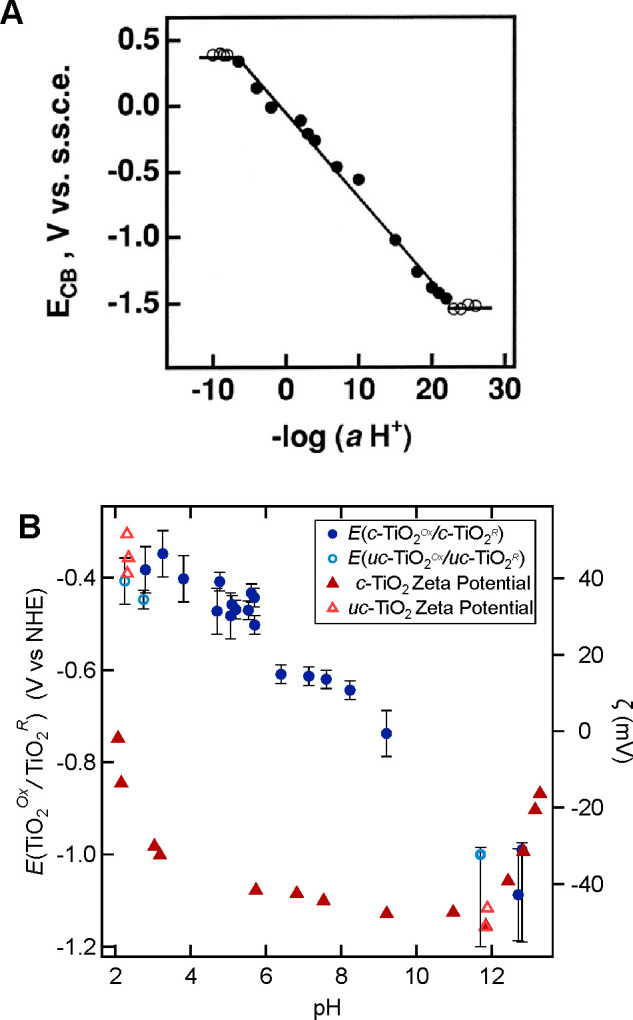
(A) Dependence of reflectance-derived conduction band edge energy on log(proton activity). Reproduced from ref (65). Copyright 1999 American Chemical Society. (B) Plot of E(TiO2/TiO2·e–,H+) (left axis, circles) and zeta (ζ) potential (right axis, triangles) vs pH, for colloidal TiO2 nanoparticles. Data are mostly for citrate-capped TiO2 [c-TiO2, blue ● (E) and red ▲ (ζ)] with a few values for “uncapped”-TiO2 [uc-TiO2, blue ○ (E) and red △]. Reproduced from ref (71). Copyright 2022 American Chemical Society.
A growing body of research on semiconductor/solution interfaces indicates that the ca. −59 mV/pH shift is due to strongly coupled 1:1 ET and PT. Reductive proton intercalation into hydrous phases of WO3, RuO2, and other oxides on electrodes is well established.67 Colloidal TiO2 nanoparticles (NPs) have a roughly Nernstian shift in their apparent reduction potential,68−71 but their ζ potentials, which should correlate with particle surface charge,72,73 have a very different pH dependence than ETiO2 (Figure 5B).71 Oxidation of reduced TiO2 NPs with KI3 gave a drop in pH, implicating a loss of H+ to the solution, with a stoichiometry of slightly more than one H+ per e–.71 Thus, the thermodynamic preference of TiO2 is to stoichiometrically couple e– and H+.
ZnO NPs suspended in THF/toluene similarly added 0.9 e– from a soluble reductant for each H+ added to the organic solution.74,75 Adding Na+ ions had a similar effect, while Mg2+ and Ca2+ gave ∼1.4 e– per M2+.76 This similarity of PT and metal cation transfer and the larger stoichiometry for M2+ demonstrates the importance of charge balance in these reactions.
Flat-band and band-edge energies for semiconductor/solution interfaces are commonly measured using Mott–Schottky plots. This approach requires that at high measurement frequencies, only electrons move. Analyzing the same experimental data with a PCET (battery) model would be of interest. Mott–Schottky analyses can also be problematic when surfaces are not planar and uniform, when there are surface states, and when multiple processes occur at the electrode.77,78 These and other effects contribute to the large variation in energies reported for nominally the same material, ∼0.5 V for TiO2.79
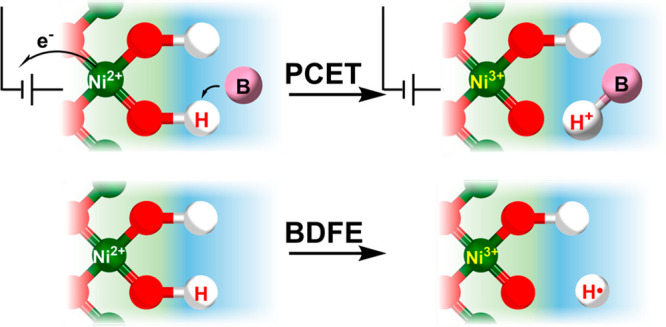
Nickel oxide electrodes in aqueous solutions have long been known to have two Faradaic oxidations that shift approximately −59 mV/pH and that are best described as PCET (eqs 22 and 23 and the TOC image).80,81 We have recently found that a NiO electrode also shows Faradaic waves in buffered acetonitrile or dimethylformamide (DMF) solutions.82 The waves shift ca. −59 mV per unit change in buffer pKa for 1:1 buffers. The NiO–H BDFEs from eq 12 were confirmed by equilibration of the electrodes with a soluble phenoxyl radical.80−82 Remarkably, the BDFEs for the NiO electrodes are the same in different solvents and with a variety of buffers.82 In contrast, electron-only or proton-only energies are very solvent-dependent because they involve movement of charge. Molecular BDFEs are also known to be solvent-independent.26 The constancy with reaction conditions is one of the reasons why BDFEs should be the preferred energy metric for solid/solution interfaces as well as molecules.82
| 22 |
| 23 |
The various examples in this section support the general conclusion that a Nernstian potential with pH or aH+ is due to a stoichiometric and thermodynamic coupling of ET and PT, 1e–/1H+ PCET.
For nonoxide semiconductors, the literature on the aqueous energetics is more limited. Studies of silicon, metal-chalcogenide, and metal-pnictide materials typically show approximately −59 mV/pH shifts.83−86 These surfaces are easily oxidized, and the Nernstian shifts may be a result of the surface oxide formed. More work in this area would be valuable, as some of these materials are being explored as earth-abundant replacements for precious metal catalysts.41
X. BDFEs Provide a Unified View of Interfacial PCET
The conclusion that PCET is the norm for redox reactions at a solid/protic solution interfaces prompts a re-examination of the focus on semiconductor band edge energies (e.g., Figure 3). When the E are for 1e–/1H+ processes, the energies are better recast as surface–H BDFEs (eqs 10 and 13 above), as shown in Figure 6 on the left in blue. The right side has the more traditional band potentials in burgundy, now labeled E°RHE for 1e–/1H+. H2 and RHE are the common anchor on the two scales. The BDFE and E°RHE(1e–/1H+) are the same (section V above), differing only by the constant CG = 53 kcal mol–1 in water (ΔG° for 1/2H2(g) → H•(aq), eq 13).26
Figure 6.
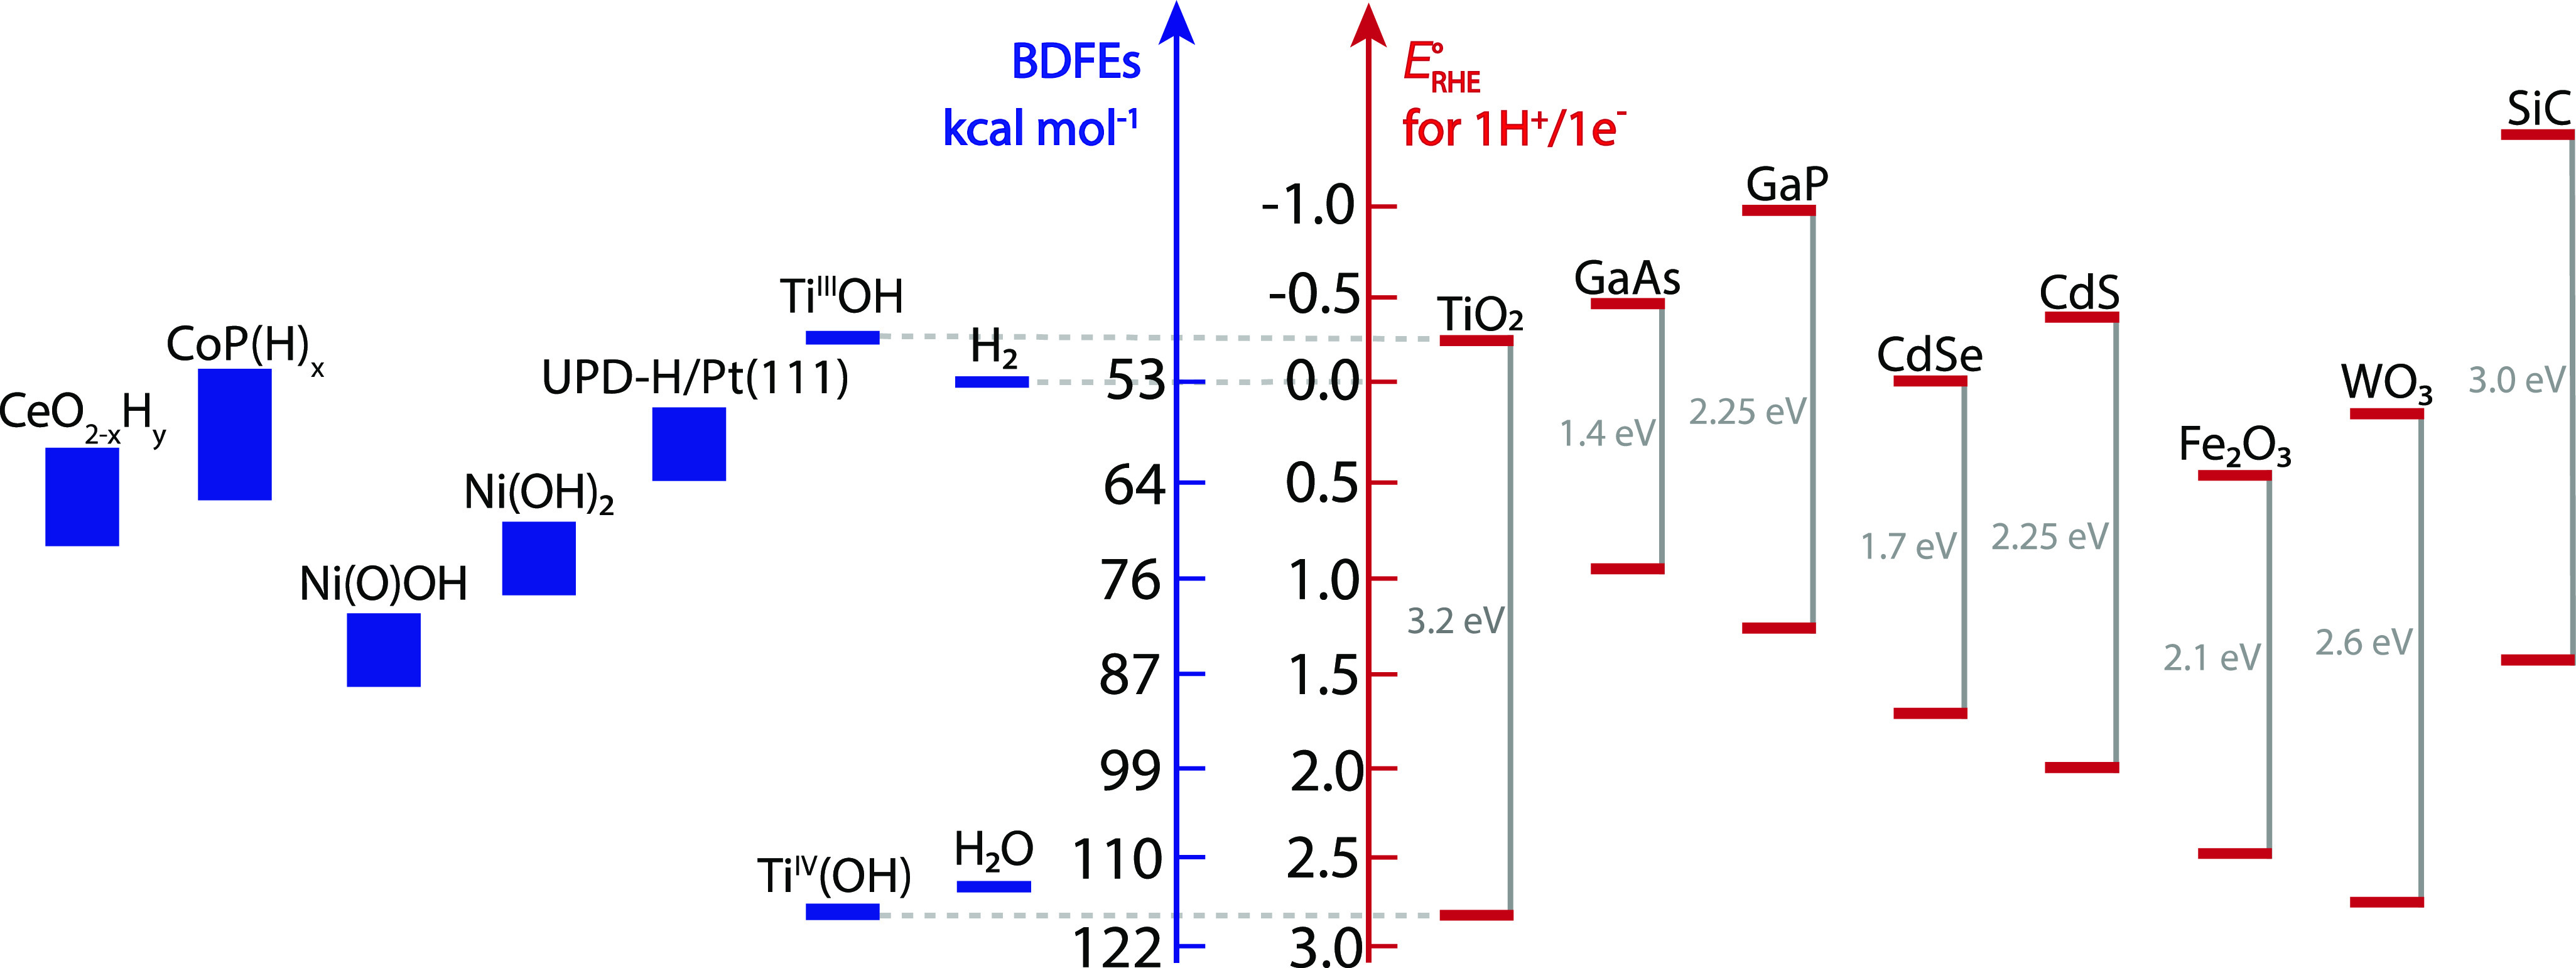
Recasting a traditional plot of conduction and valence band energies such as Figure 3 to reflect the likely 1e–/1H+ nature of the reduction potentials and to show surface–H bond dissociation free energies (BDFEs) for different materials. The heights of the blue boxes on the left side of the diagram show the measured BDFE range for each material.
The two entries for TiO2 on each side of Figure 6, connected by dashed lines, represent different views of the PCET model. The upper burgundy bar originally indicated the potential to add an electron to the bottom of the CB. In the PCET version, this is the potential to add e– + H+. The product of e– + H+ (or H•) addition to TiO2 can be viewed as a TiIII(OH) site, in a localized limit. However, the e– could also be in the CB or (most likely) delocalized over a few Ti ions; as emphasized above, the thermochemistry is consistent with different structures. The O–H BDFE for this state is low because the OH is fairly acidic and the electron is easily removed (it lies at fairly high energy). A recent study computed this BDFE to be ∼39 kcal mol–1 at a TiO2 slab (varying slightly between different sites).87 This value is close to an experimentally measured value of 49 kcal mol–1 for colloidal TiO2 NPs [Figure 7, top blue bar for TiIII(OH)].71
Figure 7.
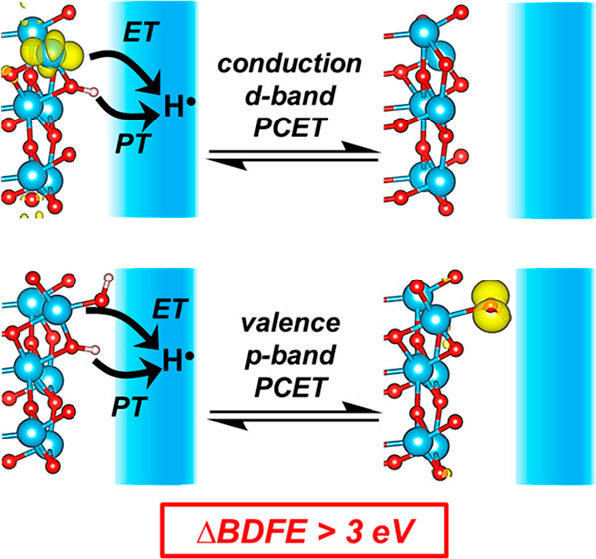
PCET from (top) a Ti d-band state, formally [TiO2]−[H]+ → [TiO2]0 + (H+ + e–), and (bottom) an O p-band state, [TiO2]0[OH]−[H]+ → [TiO2]0[O•] + (H+ + e–). The converged geometries for each structure have a yellow isosurface representing the charge density associated with the Ti3+ polaron (top) or valence band hole (bottom).87 Reproduced from ref (87). Copyright 2021 American Chemical Society.
The lower burgundy bar for TiO2 represents the energy of a hole (h+) at the top of the oxide VB, formed by removal of H• from a TiIV(OH) species. Cleaving this O–H bond is very difficult, with a high BDFE of ∼120 kcal mol–1, because the h+ formed is at high energy (the e– in the VB is tightly bound).87 The TiIVO–H value is close to that for the first O–H BDFE in water,26 which is why the reactivity of the TiO2 hole states (“TiIVO•”) is similar to that of hydroxyl radical (HO•): they react to form O–H bonds of similar strength. The TiIIIO–H BDFE is less than half that in water but close to values for molecular Ti3+(OH2) complexes.88
The difference between the BDFEs of these otherwise similar O–H bonds on a TiO2 surface is a remarkable ∼80 kcal mol–1 (∼3.5 eV). While it is tempting to connect this difference with the TiO2 band gap of similar magnitude, the computations show that a number of terms contribute.87 This study shows the complexity of computing surface–H bond strengths when the nature and density of defect states are not known.
The generality of the BDFE approach is illustrated by the inclusion of materials on the left side of Figure 6 that are not semiconductors. BDFE values are included for H2 (per H) and H2O, and many other molecules could be added.26 UPD-H on Pt(111) is included, and again values for other metals could be added. The height of the blue bar for UPD-H/Pt and for other materials indicates the range of surface–H BDFEs, as discussed in section XI, subsection iv below. Nickel oxide, CoP, and CeO2–x have electronic structures more complex than a simple semiconductor but are easily included in the BDFE chart. This representation is appropriate for any material or molecule that has an X–H bond.
XI. Generality, Limitations, Exceptions, and Complexities of the 1e–/1H+ PCET Model
i. Generality and Scope
Solid materials accepting or donating electrons generally charge-balance much of the electron flow. When protons are present, this normally leads to ne–/nH+ PCET. The same PCET framework applies to semiconductor and metal interfaces. PCET is one example of ion-coupled electron transfer at interfaces.
On the basis of results with NiO electrodes,89 surface–H BDFEs seem to be independent of medium (solvent and buffer). This is also a property of molecular BDFEs.26 In contrast, electron-focused parameters such as band-edge energies vary substantially with the medium. Therefore, BDFEs are the better parameter to compare systems in different media and to guide the development of devices in novel media, including those where pH (aH+) is not well-defined.
Still, the discussion here has been limited to the stoichiometry and thermochemistry of PCET at interfaces. Connections of these with the kinetics and mechanism of surface hydrogen reactivity are just beginning to be understood. Molecular 1e–/1H+ PCET reactions can occur by the concerted transfer of the two particles in a single elementary kinetic step or by stepwise ET-then-PT or PT-then-ET.90 The same will likely be found for interfacial reactions.
A thermochemical view is likely most appropriate in the long time scale and high concentration limits. For example, photoinduced charge injection into nanoscale TiO2 in a dye-sensitized solar cell occurs on time scales from femtoseconds to microseconds. Hours of continuous irradiation forms a material with ca. 1018e– cm–3 (∼1e– for every 3000 Ti ions),91 and both H+ and Li+ likely intercalate to charge balance the electrons.92 On ultrafast time scales, ET could occur prior to cation transfer, though ultrafast concerted PCET is known for molecules93,94 and interfaces.95,96 Perhaps ET is decoupled from PT at low doping levels and at short times, in which case the Gerischer model is most appropriate. Still, discussions of pure ET in this case should not use long-time scale thermodynamic values determined in the PCET regime.
ii. Limitation of the Battery Model: Chemical (Faradaic) vs Physical (capacitive) Processes
This Perspective is about chemical and electrochemical reactions of solids that are in contact with a protic solution. A solid can also undergo physical processes under the discussed conditions, such as developing a surface charge. This perhaps simplistic separation between chemical and physical processes roughly parallels the electrochemical distinction between Faradaic and capacitive processes. The surface charge of the material creates an electrochemical double layer (EDL) and has a capacitance. In general, applying a potential to a redox-active electrode will lead to both PCET (or other ion-coupled ET) and EDL charging.
In many electrochemical experiments, the Faradaic (PCET) current is larger than the capacitive (EDL) current. This is illustrated in the CV of Pt(111) (Figure 4, top) where the capacitive current between 0.4 and 0.6 V is smaller than the Faradaic currents on either side. Still, to obtain the wide range of potentials in Figure 4, bottom, requires polarizing the electrode by electron transfer (balanced only the EDL), as shown by measurements of the potential of zero free charge (PZFC).58,97,98 Semiconductor electrodes can have similar capacitive and Faradaic currents, particularly for high-surface area materials with low fractions of electroactive material, as in the detailed study of mesoporous TiO2 by Balland, Limoges, and Costentin.99,100 Capacitive, not ion coupled, current is clearly important in electrochemical processes, in addition to PCET.
Still, from a chemical standpoint, Faradaic and non-Faradaic PCET reactions are of greater interest because they are the ones that drive catalysis, that lead to corrosion, etc. The materials in Figures 3 and 6 are different because of their distinct Faradaic behaviors.
iii. Exceptions: Non 1e–/1H+ Behavior
Quite a few oxide interfaces have energetics that shift more than the Nernstian −59 mV/pH. These “super-Nernstian” shifts, often −90 or even −120 mV/pH, are particularly common for hydrated oxides grown on a metal.67,101−105 Cyclic voltammograms of aqueous colloidal IrO2 NCs showed 70 or 75 mV per pH shifts for the IrV/IV and IrIV/III couples, except for the latter couple between pH 6–13 that shifted 116 mV/pH.104 Hydrated oxides can be the most catalytically active forms of these materials, and they can be good pseudocapacitor materials.42,67,106,107 Shifts of −90 or −120 mV/pH imply 1.5 or 2 protons per electron added, which by itself would not give charge balance. Perhaps the excess proton charge is balanced by coaddition of electrolyte anions. There might perhaps be an analogy with the apparent noninteger proton/electron ratios in proteins, due to redox changes causing small shifts of pKa’s and protonation states in multiple sites.108 Understanding the super-Nernstian hydrous oxides has been challenging because of the complexity of their structures and variability of their compositions.101
To our knowledge, there are only four examples of semiconductor/aqueous interfaces that do not shift with pH: the fully methyl-covered surface of Si(111),83 fully methyl- or allyl-covered GaP(111),109,110 and NiO coated with a membrane-mimicking dye.111 These surfaces have hydrophobic coverings with no sites for protons or H-atoms to bind. The Si and GaP examples slowly develop oxide coatings upon extended exposure to air and water, and the approximately −59 mV/pH behavior returns. Non-Nernstian behavior could be a valuable tool for optimizing solid/liquid interfaces for catalysis and other applications, as it partially decouples the surface energetics from the substrate energetics (e.g., eqs 1–4).
iv. Complexity: Nonideal Surface Isotherms
In a solution of a pure material all of the molecules have the same properties, but interfaces are more complex. Surfaces typically have chemically different surface sites, including different crystal facets, intrinsic defects (terraces, steps, adatoms, vacancies, etc.), extrinsic defects (impurity atoms), and differences in surface stoichiometry. Even on a well-ordered crystalline surface, adsorbates interact with each other, often strongly, which causes differences in their properties at low and high surface coverages. These effects create a range of surface properties, including a range of surface–H BDFEs.
The nonideality of adsorbates is well-known in the surface science and surface electrochemical literature, where they are typically described by isotherms.112−114 An ideal adsorbate follows the Langmuir isotherm and shows a Gaussian feature in cyclic voltammograms with a fwhm of 90 mV. The CV for UPD-H Pt(111), however, has a width of >300 mV and deviates from a Gaussian shape (Figure 4). Since all the sites are the same on Pt(111), the broadening must be due to adsorbate interactions that vary with surface coverage. From a BDFE perspective, the >300 mV CV wave for UPD-H indicates a ca. 5 kcal mol–1 range of Pt–H BDFEs. Platinum surfaces also bind a second class of surface H: overpotential deposited hydrogen (OPD-H).56,62,115−118 As the name suggests, OPD-H is over the potential to make H2. It forms H2 very quickly, making it difficult to study. OPD-H occupies different surface sites than UPD-H (atop vs 3-fold) and has weaker Pt–H bonds. There are thus two very different classes of H on Pt(111), with only OPD-H active in catalysis. And this is among the simplest redox-active interfaces, with a flat, highly ordered surface and a monatomic adsorbate!
Heterogeneous catalysts are often nanoscaled, high-surface-area materials that have much more complex surfaces than Pt(111). To model these, our lab has been studying colloidal nanoparticles such as oleate-capped 2 nm cerium oxide (ceria) nanoparticles suspended in THF.119 Surface O–H BDFEs were measured by equilibration with molecular reagents such as quinone/hydroquinone redox couples. These studies revealed a large range of CeIIIO–H BDFEs, ≥13 kcal mol–1 (0.6 eV). The BDFEs became weaker as the H-atom surface coverage increased, as more of the surface became reduced to CeIIIOH (Figure 8).
Figure 8.
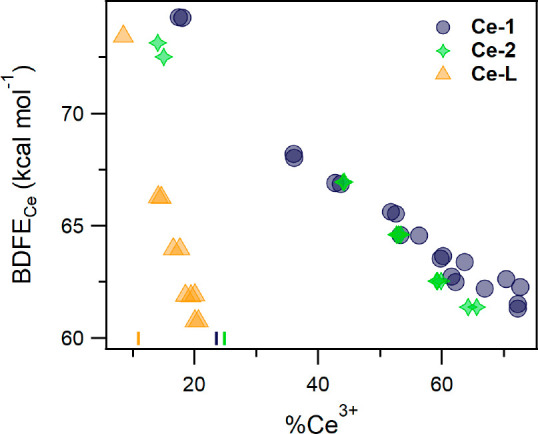
Plot of BDFECe vs the %Ce3+ of oleate-capped ceria NPs suspended in THF. The BDFEs were determined by equilibration with various hydroquinones. The %Ce3+ values were determined by XAS and mass balance. Ce-1 (blue ●), Ce-2 (green stars), and Ce-L (orange ▲) are different batches of NPs with average diameters of 1.8, 1.9, and 4.0 nm, respectively. Reproduced from ref (119). Copyright 2021 the American Chemical Society.
A range of thermochemistry can complicate the use of BDFEs in linear free energy relationships (LFERs), often called Bro̷nsted–Evans–Polanyi (BEP) relationships. Such correlations have been extensively applied to stoichiometric and catalytic reactions.112−114,120−124 While the surface-science literature describes cases where nonideal isotherms have only a small effect on the kinetics,112 that seems unlikely to hold in general. BEP relationships should not hold across different types of surface sites, which are common even for simple materials. For instance, IR spectra identify (Si)3SiH, (Si)2SiH2, and (Si)SiH3 sites on most H-terminated silicon surfaces.125,126 The striking difference in reactivity between UPD-H and OPD-H on Pt(111) surfaces is a dramatic deviation from a BEP relationship.
For most interfaces, the range of thermochemistry and the different types of surface sites have not been identified experimentally. Our study of high-surface-area cobalt phosphide (CoP) revealed a wide experimental range for surface–H BDFEs, ∼16 kcal mol–1 (0.7 eV).127 The BDFEs were estimated by titration of hydrogen-covered, high-surface area CoP with H-atom acceptors (Y in eq B2, Scheme 2). However, the experiments did not identify the surface sites, which are likely quite varied based on computational studies that implicate P–H, Con–H, and bridging sites for H.128
Figure 9 superimposes the experimental BDFE range127 on top of a volcano plot121,123,129 for electrocatalytic hydrogen evolution (HER) by transition metal phosphides.130 The volcano plot shows the dependence of the catalytic HER currents at 100 mV overpotential on values of ΔG°H computed for model single-crystal surfaces. The experimental range for H just on CoP is wider than the range of computed ΔG°H values for all of the phosphides considered. While the volcano plot captures some general trends, going beyond this first-order treatment will require understanding the broad isotherm for hydrogen adsorption.
Figure 9.
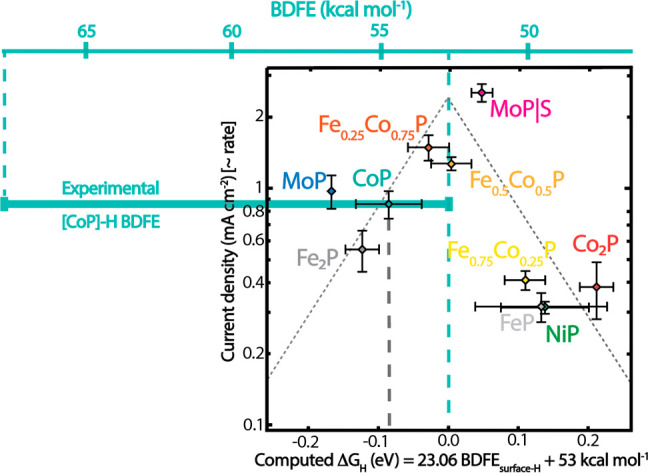
Experimental range of surface–H BDFEs on CoP (thick teal bar)127 superimposed on top of a volcano plot for HER by transition metal phosphides.130 The square volcano plot, adapted from Figure 2D in J. Kibsgaard et al.,130 shows experimental catalytic current density versus computed H-binding energies for crystalline surfaces. The computed BDFE/ΔGH for CoP is indicated by the vertical black dashed line. The BDFE scale at the top parallels the bottom ΔGH scale using BDFE = ΔG°H + CG (eqs 13 + 14).
XII. Conclusions
This Perspective argues that PCET is a very common redox reaction at interfaces of materials and protic solvents. A survey of many different systems is presented, starting with the paradigmatic Volmer reaction, the addition of e– and H+ to a metal to form a surface–H bond. The driving force for PCET is to maintain charge balance.
The Perspective develops parallels between PCET and lithium-ion batteries (LIBs), in which a Li+ rather than H+ accompanies each electron. PCET reduction potentials processes versus RHE are analogous to battery half-cell potentials versus the Li+/Li electrode. PCET processes with 1e–/1H+ stoichiometry are well described by the surface–H bond dissociation free energy (BDFE), and LIBs can be viewed as transfers of lithium atoms. The surface–H BDFE is equivalent to the free energy of hydrogenation per H atom, (ΔG°H), and to E°RHE for a 1e–/1H+ half-reaction.
The PCET approach applies to metal and semiconductor interfaces, so that these and molecules can all be put on the same BDFE scale (Figure 6). This Figure is a re-evaluation of long-standing analyses of semiconductor interfaces using band-edge energies. Since PCET reactions involve both e– and H+ transfers, electron-focused energy parameters such as band energies, Fermi energies, and electrochemical potentials are not sufficient. The PCET approach could provide a bridge between band structures and the use of H binding energies as catalytic descriptors. However, the complexity of H binding to real surfaces may not be fully captured in a single-descriptor model (Figure 9).
This Perspective shows that bringing a molecular PCET approach to interfacial redox reactivity provides new insights to tackling challenges in catalysis and other areas.
Acknowledgments
This work has been stimulated by intellectual and experimental contributions from students, postdocs, collaborators, and skeptics who have thought about PCET at interfaces, especially through the collaborative programs listed above. The manuscript has been greatly improved by comments from current and former group members. In particular, Dr. H. Noh is thanked for his analysis of non-Nernstian interfaces, and E. Stewart-Jones is thanked for recasting Figures 6 and 9.
Financial support from the following sources is gratefully acknowledged, with the research area funded by each program stated. Research on CoP and NiO has been supported as part of the Center for Molecular Electrocatalysis (CME), an Energy Frontier Research Center funded by the U.S. Department of Energy, Office of Science, Office of Basic Energy Sciences. A Swiss National Science Foundation (SNSF) PRIMA postdoctoral fellowship provided partial support for the CoP and ZnO/M+ studies. Acknowledgment is made to the Donors of the American Chemical Society Petroleum Research Fund (ACS PRF 51178-ND3) for support of initial studies of ZnO and TiO2. The National Science Foundation has supported studies of ZnO, TiO2, and CeO2 in nonpolar solvents (CHE-1151726, CHE-1609434, and CHE-1904813), and NSF has generously provided graduate fellowships to co-workers. The Department of Energy, Basic Energy Sciences, Catalysis program has supported the aqueous TiO2 studies (Award DE-SC0021298), which were earlier supported by DOE/BES via the Argonne-Northwestern Solar Energy Research (ANSER) Center, an Energy Frontier Research Center, and a collaborative award from the US/Israel Bilateral Science Foundation. This Perspective was also in part based upon work (on Pt and Au electrodes) and discussions within the Multidisciplinary Research Program of the University Research Initiative (MURI) “Molecular-Scale Studies of Liquid–Solid Interfaces in Electrochemical Processes,” supported by the Air Force Office of Scientific Research under award number FA9550–18–1–0420. Emerging research on hydrogen-terminated silicon surfaces, and many discussions, have been supported as part of the Center for Hybrid Approaches in Solar Energy to Liquid Fuels (CHASE), an Energy Innovation Hub funded by the U.S. Department of Energy, Office of Science, Office of Basic Energy Sciences under Award DE-SC0021173.
The author declares no competing financial interest.
References
- Bard A. J. Inner-Sphere Heterogeneous Electrode Reactions. Electrocatalysis and Photocatalysis: The Challenge. J. Am. Chem. Soc. 2010, 132 (22), 7559–7567. 10.1021/ja101578m. [DOI] [PubMed] [Google Scholar]
- Nocera D. G. Proton-Coupled Electron Transfer: The Engine of Energy Conversion and Storage. J. Am. Chem. Soc. 2022, 144 (3), 1069–1081. 10.1021/jacs.1c10444. [DOI] [PubMed] [Google Scholar]
- Seh Z. W.; Kibsgaard J.; Dickens C. F.; Chorkendorff I.; Norskov J. K.; Jaramillo T. F. Combining theory and experiment in electrocatalysis: Insights into materials design. Science 2017, 355 (6321), eaad4998–4992. 10.1126/science.aad4998. [DOI] [PubMed] [Google Scholar]
- Kuo D.-Y.; Lu X.; Hu B.; Abruña H. D.; Suntivich J. Rate and Mechanism of Electrochemical Formation of Surface-Bound Hydrogen on Pt(111) Single Crystals. J. Phys. Chem. Lett. 2022, 13 (27), 6383–6390. 10.1021/acs.jpclett.2c01734. [DOI] [PubMed] [Google Scholar]
- Jackson M. N.; Surendranath Y. Donor-Dependent Kinetics of Interfacial Proton-Coupled Electron Transfer. J. Am. Chem. Soc. 2016, 138 (9), 3228–3234. 10.1021/jacs.6b00167. [DOI] [PubMed] [Google Scholar]
- Jackson M. N.; Pegis M. L.; Surendranath Y. Graphite-Conjugated Acids Reveal a Molecular Framework for Proton-Coupled Electron Transfer at Electrode Surfaces. ACS Cent. Sci. 2019, 5 (5), 831–841. 10.1021/acscentsci.9b00114. [DOI] [PMC free article] [PubMed] [Google Scholar]
- Jung O.; Jackson M. N.; Bisbey R. P.; Kogan N. E.; Surendranath Y. Innocent buffers reveal the intrinsic pH- and coverage-dependent kinetics of the hydrogen evolution reaction on noble metals. Joule 2022, 6 (2), 476–493. 10.1016/j.joule.2022.01.007. [DOI] [Google Scholar]
- Boettcher S. W.; Oener S. Z.; Lonergan M. C.; Surendranath Y.; Ardo S.; Brozek C.; Kempler P. A. Potentially Confusing: Potentials in Electrochemistry. ACS Energy Lett. 2021, 6 (1), 261–266. 10.1021/acsenergylett.0c02443. [DOI] [Google Scholar]
- Boettcher S. W.; Surendranath Y. Heterogeneous Electrocatalysis Goes Chemical. Nat. Catal. 2021, 4 (1), 4–5. 10.1038/s41929-020-00570-1. [DOI] [Google Scholar]
- Nong H. N.; Falling L. J.; Bergmann A.; Klingenhof M.; Tran H. P.; Spöri C.; Mom R.; Timoshenko J.; Zichittella G.; Knop-Gericke A.; et al. Key role of chemistry versus bias in electrocatalytic oxygen evolution. Nature 2020, 587 (7834), 408–413. 10.1038/s41586-020-2908-2. [DOI] [PubMed] [Google Scholar]
- Ge A.; Kastlunger G.; Meng J.; Lindgren P.; Song J.; Liu Q.; Zaslavsky A.; Lian T.; Peterson A. A. On the Coupling of Electron Transfer to Proton Transfer at Electrified Interfaces. J. Am. Chem. Soc. 2020, 142 (27), 11829–11834. 10.1021/jacs.0c03472. [DOI] [PubMed] [Google Scholar]
- Lindgren P.; Kastlunger G.; Peterson A. A. A Challenge to the G ∼ 0 Interpretation of Hydrogen Evolution. ACS Catal. 2020, 10 (1), 121–128. 10.1021/acscatal.9b02799. [DOI] [Google Scholar]
- Limaye A. M.; Zeng J. S.; Willard A. P.; Manthiram K. Bayesian data analysis reveals no preference for cardinal Tafel slopes in CO2 reduction electrocatalysis. Nat. Commun. 2021, 12 (1), 703. 10.1038/s41467-021-20924-y. [DOI] [PMC free article] [PubMed] [Google Scholar]
- Kucernak A. R.; Zalitis C. General Models for the Electrochemical Hydrogen Oxidation and Hydrogen Evolution Reactions: Theoretical Derivation and Experimental Results under Near Mass-Transport Free Conditions. J. Phys. Chem. C 2016, 120 (20), 10721–10745. 10.1021/acs.jpcc.6b00011. [DOI] [Google Scholar]
- Warburton R. E.; Hutchison P.; Jackson M. N.; Pegis M. L.; Surendranath Y.; Hammes-Schiffer S. Interfacial Field-Driven Proton-Coupled Electron Transfer at Graphite-Conjugated Organic Acids. J. Am. Chem. Soc. 2020, 142 (49), 20855–20864. 10.1021/jacs.0c10632. [DOI] [PubMed] [Google Scholar]
- Morrison S. R.Chapter 1. Introduction and Chapter 2. Space Charge Effects. In The Chemical Physics of Surfaces; Plenum Press, 1977; pp 1–55. [Google Scholar]
- Gerischer H.; Delahay P. Ed.; Advances in Electrochemistry and Electrochemical Engineering, Vol. 1; Wiley, 1961; pp 139–223. [Google Scholar]
- Gerischer H. The impact of semiconductors on the concepts of electrochemistry. Electrochim. Acta 1990, 35 (11), 1677–1699. 10.1016/0013-4686(90)87067-C. [DOI] [Google Scholar]
- Nozik A.; Photoelectrochemistry J. Applications to Solar Energy Conversion. Annu. Rev. Phys. Chem. 1978, 29 (1), 189–222. 10.1146/annurev.pc.29.100178.001201. [DOI] [Google Scholar]
- Putri L. K.; Ng B.-J.; Ong W.-J.; Chai S.-P.; Mohamed A. R. Toward Excellence in Photocathode Engineering for Photoelectrochemical CO2 Reduction: Design Rationales and Current Progress. Adv. Energy Mater. 2022, 12, 2201093. 10.1002/aenm.202201093. [DOI] [Google Scholar]
- Lewis N. S. Chemical Control of Charge Transfer and Recombination at Semiconductor Photoelectrode Surfaces. Inorg. Chem. 2005, 44 (20), 6900–6911. 10.1021/ic051118p. [DOI] [PubMed] [Google Scholar]
- Electrons in a solid electrode are described by an electrochemical potential, but the reduction potential of a dissolved redox reagent is a chemical potential since there is no persistent electric field in the bulk solution. For a colloidal nanocrystal, perhaps either parameter could be used.
- Zhang X.; Chen Y. L.; Liu R.-S.; Tsai D. P. Plasmonic photocatalysis. Rep. Prog. Phys. 2013, 76 (4), 046401 10.1088/0034-4885/76/4/046401. [DOI] [PubMed] [Google Scholar]
- Grätzel M. Photoelectrochemical cells. Nature 2001, 414 (6861), 338–344. 10.1038/35104607. [DOI] [PubMed] [Google Scholar]
- Gerischer H.; Decker F.; Scrosati B. The Electronic and the Ionic Contribution to the Free Energy of Alkali Metals in Intercalation Compounds. J. Electrochem. Soc. 1994, 141 (9), 2297–2300. 10.1149/1.2055115. [DOI] [Google Scholar]
- Agarwal R. G.; Coste S. C.; Groff B. D.; Heuer A. M.; Noh H.; Parada G. A.; Wise C. F.; Nichols E. M.; Warren J. J.; Mayer J. M. Free Energies of Proton-Coupled Electron Transfer Reagents and Their Applications. Chem. Rev. 2022, 122 (1), 1–49. 10.1021/acs.chemrev.1c00521. [DOI] [PMC free article] [PubMed] [Google Scholar]
- Weinberg D. R.; Gagliardi C. J.; Hull J. F.; Murphy C. F.; Kent C. A.; Westlake B. C.; Paul A.; Ess D. H.; McCafferty D. G.; Meyer T. J. Proton-Coupled Electron Transfer. Chem. Rev. 2012, 112 (7), 4016–4093. 10.1021/cr200177j. [DOI] [PubMed] [Google Scholar]
- Hammes-Schiffer S.; Stuchebrukhov A. A. Theory of coupled electron and proton transfer reactions. Chem. Rev. 2010, 110 (12), 6939–6960. 10.1021/cr1001436. [DOI] [PMC free article] [PubMed] [Google Scholar]
- Darcy J. W.; Koronkiewicz B.; Parada G. A.; Mayer J. M. A Continuum of Proton-Coupled Electron Transfer Reactivity. Acc. Chem. Res. 2018, 51 (10), 2391–2399. 10.1021/acs.accounts.8b00319. [DOI] [PMC free article] [PubMed] [Google Scholar]
- Costentin C.; Hajj V.; Louault C.; Robert M.; Saveant J. M. Concerted proton-electron transfers. Consistency between electrochemical kinetics and their homogeneous counterparts. J. Am. Chem. Soc. 2011, 133 (47), 19160–19167. 10.1021/ja206561n. [DOI] [PubMed] [Google Scholar]
- Rhile I. J.; Markle T. F.; Nagao H.; DiPasquale A. G.; Lam O. P.; Lockwood M. A.; Rotter K.; Mayer J. M. Concerted Proton-Electron Transfer in the Oxidation of Hydrogen-Bonded Phenols. J. Am. Chem. Soc. 2006, 128 (18), 6075–6088. 10.1021/ja054167+. [DOI] [PMC free article] [PubMed] [Google Scholar]
- Pourbaix M.Atlas of Electrochemical Equilibria in Aqueous Solutions; National Association of Corrosion Engineers, 1974. [Google Scholar]
- Roberts J. A.; Bullock R. M. Direct determination of equilibrium potentials for hydrogen oxidation/production by open circuit potential measurements in acetonitrile. Inorg. Chem. 2013, 52 (7), 3823–3835. 10.1021/ic302461q. [DOI] [PubMed] [Google Scholar]
- Wise C. F.; Agarwal R. G.; Mayer J. M. Determining Proton-Coupled Standard Potentials and X–H Bond Dissociation Free Energies in Nonaqueous Solvents Using Open-Circuit Potential Measurements. J. Am. Chem. Soc. 2020, 142 (24), 10681–10691. 10.1021/jacs.0c01032. [DOI] [PubMed] [Google Scholar]
- Somorjai G. A. Surface Reconstruction and Catalysis. Annu. Rev. Phys. Chem. 1994, 45 (1), 721–751. 10.1146/annurev.pc.45.100194.003445. [DOI] [Google Scholar]
- Choi Y. W.; Mistry H.; Roldan Cuenya B. New insights into working nanostructured electrocatalysts through operando spectroscopy and microscopy. Current Opinion in Electrochemistry 2017, 1 (1), 95–103. 10.1016/j.coelec.2017.01.004. [DOI] [Google Scholar]
- McCrum I. T.; Bondue C. J.; Koper M. T. M. Hydrogen-Induced Step-Edge Roughening of Platinum Electrode Surfaces. J. Phys. Chem. Lett. 2019, 10 (21), 6842–6849. 10.1021/acs.jpclett.9b02544. [DOI] [PMC free article] [PubMed] [Google Scholar]
- Jacobse L.; Vonk V.; McCrum I. T.; Seitz C.; Koper M. T. M.; Rost M. J.; Stierle A. Electrochemical oxidation of Pt(111) beyond the place-exchange model. Electrochim. Acta 2022, 407, 139881. 10.1016/j.electacta.2022.139881. [DOI] [Google Scholar]
- Polo-Garzon F.; Bao Z.; Zhang X.; Huang W.; Wu Z. Surface Reconstructions of Metal Oxides and the Consequences on Catalytic Chemistry. ACS Catal. 2019, 9 (6), 5692–5707. 10.1021/acscatal.9b01097. [DOI] [Google Scholar]
- Conway B. E.; Angerstein-Kozlowska H. The electrochemical study of multiple-state adsorption in monolayers. Acc. Chem. Res. 1981, 14 (2), 49–56. 10.1021/ar00062a004. [DOI] [Google Scholar]
- Bullock R. M.; Chen J. G.; Gagliardi L.; Chirik P. J.; Farha O. K.; Hendon C. H.; Jones C. W.; Keith J. A.; Klosin J.; Minteer S. D.; et al. Using nature’s blueprint to expand catalysis with Earth-abundant metals. Science 2020, 369 (6505), eabc3183 10.1126/science.abc3183. [DOI] [PMC free article] [PubMed] [Google Scholar]
- Reier T.; Teschner D.; Lunkenbein T.; Bergmann A.; Selve S.; Kraehnert R.; Schlögl R.; Strasser P. Electrocatalytic Oxygen Evolution on Iridium Oxide: Uncovering Catalyst-Substrate Interactions and Active Iridium Oxide Species. J. Electrochem. Soc. 2014, 161 (9), F876–F882. 10.1149/2.0411409jes. [DOI] [Google Scholar]
- Kluge R. M.; Haid R. W.; Bandarenka A. S. Assessment of active areas for the oxygen evolution reaction on an amorphous iridium oxide surface. J. Catal. 2021, 396, 14–22. 10.1016/j.jcat.2021.02.007. [DOI] [Google Scholar]
- There is likely a continuum between the limits of H+ strongly bound to a surface atom versus a proton in a molecule or ion inside the electrochemical double layer (EDL) weakly connected to the surface. For instance, H2O could be viewed as a part of the surface (e.g., a protonated surface hydroxide) or as a molecule coordinated to a surface cation inside the EDL (in the Stern layer, perhaps). This continuum is likely common for metal oxide surfaces, especially for hydrous and/or amorphous materials. For example, a recent report on colloidal indium oxide nanocrystals (NCs) contrasts the compensation of CB electrons by “aliovalent dopants vs. surface cations (e.g., protons),” and refers both to “surface protonation” and protons as electrostatic cations just outside the NC surface.45 The functionalized graphitic structure in Figure 1 is perhaps an interesting example of an intermediate case for a proton bound to a graphite electrode. There could be a valuable analogy with the anion adsorption to metal surfaces, which ranges from purely electrostatic, to “specific adsorption,” to full covalent bonding.46,47 Similar issues could arise in Li+ binding to a battery electrode cathode through the complex surface/electrode interface (SEI).
- Araujo J. J.; Brozek C. K.; Liu H.; Merkulova A.; Li X.; Gamelin D. R. Tunable Band-Edge Potentials and Charge Storage in Colloidal Tin-Doped Indium Oxide (ITO) Nanocrystals. ACS Nano 2021, 15 (9), 14116–14124. 10.1021/acsnano.1c04660. [DOI] [PubMed] [Google Scholar]
- Gileadi E.Electrode Kinetics for Chemists, Chemical Engineers and Materials Scientists; VCH Publishers, 1993; pp 185–211. [Google Scholar]
- Teliska M.; Murthi V. S.; Mukerjee S.; Ramaker D. E. Site-Specific vs Specific Adsorption of Anions on Pt and Pt-Based Alloys. J. Phys. Chem. C 2007, 111 (26), 9267–9274. 10.1021/jp071106k. [DOI] [Google Scholar]
- McCarthy B. D.; Dempsey J. L. Decoding Proton-Coupled Electron Transfer with Potential–pKa Diagrams. Inorg. Chem. 2017, 56 (3), 1225–1231. 10.1021/acs.inorgchem.6b02325. [DOI] [PubMed] [Google Scholar]; Rountree E. S.; McCarthy B. D.; Dempsey J. L. Decoding Proton-Coupled Electron Transfer with Potential-pKa Diagrams: Applications to Catalysis. Inorg. Chem. 2019, 58 (10), 6647–6658. 10.1021/acs.inorgchem.8b03368. [DOI] [PubMed] [Google Scholar]
- Brookins D. G.Introduction. In Eh-pH Diagrams for Geochemistry; Springer-Verlag, 1988; pp 1–13. [Google Scholar]
- Stumm W.; Morgan J. J.. Aquatic Chemistry: Chemical Equilibria and Rates in Natural Waters, 3rd ed.; Section 8.4.; Wiley-Interscience, 1995; pp 455–464. [Google Scholar]
- Morrison S. R. Chapter 2: The Solid/Liquid Interface, especially Section 2.2.3, and Chapter 5: The Properties of the Electrode and Their Effect on Electrochemical Measurements, Section 5.1. In Electrochemistry at semiconductor and oxidized metal electrodes; Plenum Press, 1980; pp 60–64, 153–160. [Google Scholar]
- While lithium-ion batteries (LIBs) and lithium intercalation are emphasized in this section, cation-coupled electron transfer and the issues raised here are common to essentially all batteries. A classical Cu/Zn battery involves M2+(solution) + 2e– = M(solid) reactions at both electrodes, with addition (or loss) of metal atoms to the electrode, and a version of Scheme 4 still applies.
- Peper J. L.; Mayer J. M. Manifesto on the Thermochemistry of Nanoscale Redox Reactions for Energy Conversion. ACS Energy Lett. 2019, 4 (4), 866–872. 10.1021/acsenergylett.9b00019. [DOI] [Google Scholar]
- Zhang J.; Hughes T. F.; Steigerwald M.; Brus L.; Friesner R. A. Realistic Cluster Modeling of Electron Transport and Trapping in Solvated TiO2 Nanoparticles. J. Am. Chem. Soc. 2012, 134 (29), 12028–12042. 10.1021/ja3013787. [DOI] [PubMed] [Google Scholar]
- Quaino P.; Santos E.; Lundin A.; Pötting K.; Schmickler W. Model for the electrocatalysis of hydrogen evolution. Phys. Rev. B 2009, 79 (23), 235436 10.1103/PhysRevB.79.235436. [DOI] [Google Scholar]
- Jerkiewicz G. Electrochemical Hydrogen Adsorption and Absorption. Part 1: Under-potential Deposition of Hydrogen. Electrocatalysis 2010, 1 (4), 179–199. 10.1007/s12678-010-0022-1. [DOI] [Google Scholar]
- Koper M. T. M. Thermodynamic theory of multi-electron transfer reactions: Implications for electrocatalysis. J. Electroanal. Chem. 2011, 660 (2), 254–260. 10.1016/j.jelechem.2010.10.004. [DOI] [Google Scholar]
- Rizo R.; Sitta E.; Herrero E.; Climent V.; Feliu J. M. Towards the understanding of the interfacial pH scale at Pt(111) electrodes. Electrochim. Acta 2015, 162, 138–145. 10.1016/j.electacta.2015.01.069. [DOI] [Google Scholar]
- Hoster H. E.; Alves O. B.; Koper M. T. Tuning adsorption via strain and vertical ligand effects. ChemPhysChem 2010, 11 (7), 1518–1524. 10.1002/cphc.200900500. [DOI] [PubMed] [Google Scholar]
- Conway B. E.; Tilak B. V. Interfacial processes involving electrocatalytic evolution and oxidation of H2, and the role of chemisorbed H. Electrochim. Acta 2002, 47 (22), 3571–3594. 10.1016/S0013-4686(02)00329-8. [DOI] [Google Scholar]
- Strmcnik D.; Tripkovic D.; van der Vliet D.; Stamenkovic V.; Marković N. M. Adsorption of hydrogen on Pt(111) and Pt(100) surfaces and its role in the HOR. Electrochem. Commun. 2008, 10 (10), 1602–1605. 10.1016/j.elecom.2008.08.019. [DOI] [Google Scholar]
- Markovic N. M.; Grgur B. N.; Ross P. N. Temperature-Dependent Hydrogen Electrochemistry on Platinum Low-Index Single-Crystal Surfaces in Acid Solutions. J. Phys. Chem. B 1997, 101 (27), 5405–5413. 10.1021/jp970930d. [DOI] [Google Scholar]
- Ferrin P.; Kandoi S.; Nilekar A. U.; Mavrikakis M. Hydrogen adsorption, absorption and diffusion on and in transition metal surfaces: A DFT study. Surf. Sci. 2012, 606 (7), 679–689. 10.1016/j.susc.2011.12.017. [DOI] [Google Scholar]
- García G.; Koper M. T. M. Stripping voltammetry of carbon monoxide oxidation on stepped platinum single-crystal electrodes in alkaline solution. Phys. Chem. Chem. Phys. 2008, 10 (25), 3802–3811. 10.1039/b803503m. [DOI] [PubMed] [Google Scholar]
- Lyon L. A.; Hupp J. T. Energetics of the Nanocrystalline Titanium Dioxide/Aqueous Solution Interface: Approximate Conduction Band Edge Variations Between H0 = – 10 And H– = + 26. J. Phys. Chem. B 1999, 103 (22), 4623–4628. 10.1021/jp9908404. [DOI] [Google Scholar]
- Mueller R.; Kammler H. K.; Wegner K.; Pratsinis S. E. OH Surface Density of SiO2 and TiO2 by Thermogravimetric Analysis. Langmuir 2003, 19 (1), 160–165. 10.1021/la025785w. [DOI] [Google Scholar]
- Fleischmann S.; Mitchell J. B.; Wang R.; Zhan C.; Jiang D.-e.; Presser V.; Augustyn V. Pseudocapacitance: From Fundamental Understanding to High Power Energy Storage Materials. Chem. Rev. 2020, 120 (14), 6738–6782. 10.1021/acs.chemrev.0c00170. [DOI] [PubMed] [Google Scholar]
- Koelle U.; Moser J.; Graetzel M. Dynamics of Interfacial Charge-Transfer Reactions in Semiconductor Dispersions. Reduction of Cobaltoceniumdicarboxylate in Colloidal Titania. Inorg. Chem. 1985, 24 (14), 2253–2258. 10.1021/ic00208a026. [DOI] [Google Scholar]
- Boschloo G.; Fitzmaurice D. Electron Accumulation in Nanostructured TiO2 (Anatase) Electrodes. J. Phys. Chem. B 1999, 103 (37), 7860–7868. 10.1021/jp983040m. [DOI] [Google Scholar]
- Dimitrijevic N. M.; Savic D.; Micic O. I.; Nozik A. J. Interfacial electron-transfer equilibria and flatband potentials of. alpha.-ferric oxide and titanium dioxide colloids studied by pulse radiolysis. J. Phys. Chem. 1984, 88 (19), 4278–4283. 10.1021/j150663a018. [DOI] [Google Scholar]
- Peper J. L.; Gentry N. E.; Boudy B.; Mayer J. M. Aqueous TiO2 Nanoparticles React by Proton-Coupled Electron Transfer. Inorg. Chem. 2022, 61 (2), 767–777. 10.1021/acs.inorgchem.1c03125. [DOI] [PubMed] [Google Scholar]
- Doane T. L.; Chuang C.-H.; Hill R. J.; Burda C. Nanoparticle ζ-Potentials. Acc. Chem. Res. 2012, 45 (3), 317–326. 10.1021/ar200113c. [DOI] [PubMed] [Google Scholar]
- Kaszuba M.; Corbett J.; Watson F. M.; Jones A. High-concentration zeta potential measurements using light-scattering techniques. Philosophical Transactions of the Royal Society A: Mathematical, Physical and Engineering Sciences 2010, 368 (1927), 4439–4451. 10.1098/rsta.2010.0175. [DOI] [PMC free article] [PubMed] [Google Scholar]
- Valdez C. N.; Braten M.; Soria A.; Gamelin D. R.; Mayer J. M. Effect of Protons on the Redox Chemistry of Colloidal Zinc Oxide Nanocrystals. J. Am. Chem. Soc. 2013, 135 (23), 8492–8495. 10.1021/ja4035945. [DOI] [PubMed] [Google Scholar]
- Valdez C. N.; Schimpf A. M.; Gamelin D. R.; Mayer J. M. Proton-Controlled Reduction of ZnO Nanocrystals: Effects of Molecular Reductants, Cations, and Thermodynamic Limitations. J. Am. Chem. Soc. 2016, 138 (4), 1377–1385. 10.1021/jacs.5b12182. [DOI] [PubMed] [Google Scholar]
- Valdez C. N.; Delley M. F.; Mayer J. M. Cation Effects on the Reduction of Colloidal ZnO Nanocrystals. J. Am. Chem. Soc. 2018, 140 (28), 8924–8933. 10.1021/jacs.8b05144. [DOI] [PubMed] [Google Scholar]
- Hankin A.; Bedoya-Lora F. E.; Alexander J. C.; Regoutz A.; Kelsall G. H. Flat band potential determination: avoiding the pitfalls. Journal of Materials Chemistry A 2019, 7 (45), 26162–26176. 10.1039/C9TA09569A. [DOI] [Google Scholar]
- Cooper G.; Turner J. A.; Nozik A. J. Mott-Schottky Plots and Flatband Potentials for Single Crystal Rutile Electrodes. J. Electrochem. Soc. 1982, 129 (9), 1973–1977. 10.1149/1.2124334. [DOI] [Google Scholar]
- Finklea H. O.Chapter 2: Titanium Dioxide (TiO2) and Strontium Titanate (SrTiO3). In Semiconductor electrodes, Finklea H. O., Ed.; Elsevier, 1988; pp 42–154. [Google Scholar]
- Boschloo G.; Hagfeldt A. Spectroelectrochemistry of Nanostructured NiO. J. Phys. Chem. B 2001, 105 (15), 3039–3044. 10.1021/jp003499s. [DOI] [Google Scholar]
- Wise C. F.; Mayer J. M. Electrochemically Determined O–H Bond Dissociation Free Energies of NiO Electrodes Predict Proton-Coupled Electron Transfer Reactivity. J. Am. Chem. Soc. 2019, 141 (38), 14971–14975. 10.1021/jacs.9b07923. [DOI] [PubMed] [Google Scholar]; Wise C. F.; Mayer J. M. Correction to “Electrochemically Determined O–H Bond Dissociation Free Energies of NiO Electrodes Predict Proton-Coupled Electron Transfer Reactivity. J. Am. Chem. Soc. 2020, 142 (28), 12544–12545. 10.1021/jacs.0c06397. [DOI] [PubMed] [Google Scholar]
- Noh H.; Mayer J. M. Medium-independent hydrogen atom binding isotherms of nickel oxide electrodes. Chem. 2022, 8, 3324–3345. 10.1016/j.chempr.2022.08.018. [DOI] [Google Scholar]
- Hamann T. W.; Lewis N. S. Control of the Stability, Electron-Transfer Kinetics, and pH-Dependent Energetics of Si/H2O Interfaces through Methyl Termination of Si(111) Surfaces. J. Phys. Chem. B 2006, 110 (45), 22291–22294. 10.1021/jp064401y. [DOI] [PubMed] [Google Scholar]
- Finlayson M. F.; Wheeler B. L.; Kakuta N.; Park K. H.; Bard A. J.; Campion A.; Fox M. A.; Webber S. E.; White J. M. Determination of flat-band position of cadmium sulfide crystals, films, and powders by photocurrent and impedance techniques, photoredox reaction mediated by intragap states. J. Phys. Chem. 1985, 89 (26), 5676–5681. 10.1021/j100272a020. [DOI] [Google Scholar]
- Horowitz G. Flatband potential of a p-type phosphide electrode. J. Appl. Phys. 1978, 49 (6), 3571–3573. 10.1063/1.325217. [DOI] [Google Scholar]
- Butler M. A.; Ginley D. S. P-Type GaP as a Semiconducting Photoelectrode. J. Electrochem. Soc. 1980, 127 (6), 1273–1278. 10.1149/1.2129870. [DOI] [Google Scholar]
- Warburton R. E.; Mayer J. M.; Hammes-Schiffer S. Proton-Coupled Defects Impact O–H Bond Dissociation Free Energies on Metal Oxide Surfaces. J. Phys. Chem. Lett. 2021, 12 (40), 9761–9767. 10.1021/acs.jpclett.1c02837. [DOI] [PubMed] [Google Scholar]
- Paradas M.; Campaña A. G.; Marcos M. L.; Justicia J.; Haidour A.; Robles R.; Cárdenas D. J.; Oltra J. E.; Cuerva J. M. Unprecedented H-atom transfer from water to ketyl radicals mediated by Cp2TiCl. Dalton Trans. 2010, 39 (37), 8796–8800. 10.1039/c001689f. [DOI] [PubMed] [Google Scholar]; Paradas M.; Campaña A. G.; Jiménez T.; Robles R.; Oltra J. E.; Buñuel E.; Justicia J.; Cárdenas D. J.; Cuerva J. M. Understanding the Exceptional Hydrogen-Atom Donor Characteristics of Water in TiIII-Mediated Free-Radical Chemistry. J. Am. Chem. Soc. 2010, 132 (36), 12748–12756. 10.1021/ja105670h. [DOI] [PubMed] [Google Scholar]
- Noh H.; Mayer J. M. Medium-Independent Hydrogen Atom Binding Isotherms of Nickel Oxide Electrodes. Chem. 2022, 8, 3324. 10.1016/j.chempr.2022.08.018. [DOI] [Google Scholar]
- Warren J. J.; Tronic T. A.; Mayer J. M. Thermochemistry of Proton-Coupled Electron Transfer Reagents and its Implications. Chem. Rev. 2010, 110 (12), 6961–7001. 10.1021/cr100085k. [DOI] [PMC free article] [PubMed] [Google Scholar]
- O’Regan B. C.; Durrant J. R. Kinetic and Energetic Paradigms for Dye-Sensitized Solar Cells: Moving from the Ideal to the Real. Acc. Chem. Res. 2009, 42 (11), 1799–1808. 10.1021/ar900145z. [DOI] [PubMed] [Google Scholar]
- McCool N. S.; Swierk J. R.; Nemes C. T.; Saunders T. P.; Schmuttenmaer C. A.; Mallouk T. E. Proton-Induced Trap States, Injection and Recombination Dynamics in Water-Splitting Dye-Sensitized Photoelectrochemical Cells. ACS Appl. Mater. Interfaces 2016, 8 (26), 16727–16735. 10.1021/acsami.6b05362. [DOI] [PubMed] [Google Scholar]
- Parada G. A.; Goldsmith Z. K.; Kolmar S.; Pettersson Rimgard B.; Mercado B. Q.; Hammarström L.; Hammes-Schiffer S.; Mayer J. M. Concerted Proton-Electron Transfer Reactions in the Marcus Inverted Region. Science 2019, 364 (6439), 471–475. 10.1126/science.aaw4675. [DOI] [PMC free article] [PubMed] [Google Scholar]
- Dey A.; Dana J.; Aute S.; Maity P.; Das A.; Ghosh H. N. Proton-Coupled Electron-Transfer Processes in Ultrafast Time Domain: Evidence for Effects of Hydrogen-Bond Stabilization on Photoinduced Electron Transfer. Chem.—Eur. J. 2017, 23 (14), 3455–3465. 10.1002/chem.201605594. [DOI] [PubMed] [Google Scholar]
- Petek H.; Zhao J. Ultrafast Interfacial Proton-Coupled Electron Transfer. Chem. Rev. 2010, 110 (12), 7082–7099. 10.1021/cr1001595. [DOI] [PubMed] [Google Scholar]
- Hattori Y.; Abdellah M.; Rocha I.; Pavliuk M. V.; Fernandes D. L. A.; Sá J. Light-induced ultrafast proton-coupled electron transfer responsible for H2 evolution on silver plasmonics. Mater. Today 2018, 21 (6), 590–593. 10.1016/j.mattod.2018.05.002. [DOI] [Google Scholar]
- Ledezma-Yanez I.; Wallace W. D. Z.; Sebastián-Pascual P.; Climent V.; Feliu J. M.; Koper M. T. M. Interfacial water reorganization as a pH-dependent descriptor of the hydrogen evolution rate on platinum electrodes. Nat. Energy 2017, 2 (4), 17031. 10.1038/nenergy.2017.31. [DOI] [Google Scholar]
- Garcia-Araez N.; Climent V.; Feliu J. Potential-Dependent Water Orientation on Pt(111), Pt(100), and Pt(110), As Inferred from Laser-Pulsed Experiments. Electrostatic and Chemical Effects.. J. Phys. Chem. C 2009, 113 (21), 9290–9304. 10.1021/jp900792q. [DOI] [Google Scholar]
- Kim Y. S.; Balland V.; Limoges B.; Costentin C. Cyclic voltammetry modeling of proton transport effects on redox charge storage in conductive materials: application to a TiO2 mesoporous film. Phys. Chem. Chem. Phys. 2017, 19 (27), 17944–17951. 10.1039/C7CP02810E. [DOI] [PubMed] [Google Scholar]
- Costentin C.; Savéant J.-M. Energy storage: pseudocapacitance in prospect. Chem. Sci. 2019, 10 (22), 5656–5666. 10.1039/C9SC01662G. [DOI] [PMC free article] [PubMed] [Google Scholar]
- Burke L. D.; Lyons M. E. G.. Electrochemistry of Hydrous Oxide Films. In Modern Aspects of Electrochemistry: Vol. 18, White R. E., Bockris J. O. M., Conway B. E. Eds.; Springer US, 1986; pp 169–248. [Google Scholar]
- Dincǎ M.; Surendranath Y.; Nocera D. G. Nickel-borate oxygen-evolving catalyst that functions under benign conditions. Proc. Natl. Acad. Sci. U. S. A. 2010, 107 (23), 10337–10341. 10.1073/pnas.1001859107. [DOI] [PMC free article] [PubMed] [Google Scholar]
- Burke L. D.; Mulcahy J. K.; Whelan D. P. Preparation of an oxidized iridium electrode and the variation of its potential with pH. J. Electroanal. Chem. Interfacial Electrochem. 1984, 163 (1), 117–128. 10.1016/S0022-0728(84)80045-5. [DOI] [Google Scholar]
- Gambardella A. A.; Bjorge N. S.; Alspaugh V. K.; Murray R. W. Voltammetry of Diffusing 2 nm Iridium Oxide Nanoparticles. J. Phys. Chem. C 2011, 115 (44), 21659–21665. 10.1021/jp206987z. [DOI] [Google Scholar]
- Stoerzinger K. A.; Rao R. R.; Wang X. R.; Hong W. T.; Rouleau C. M.; Shao-Horn Y. The Role of Ru Redox in pH-Dependent Oxygen Evolution on Rutile Ruthenium Dioxide Surfaces. Chem. 2017, 2 (5), 668–675. 10.1016/j.chempr.2017.04.001. [DOI] [Google Scholar]
- Velasco-Vélez J.-J.; Carbonio E. A.; Chuang C.-H.; Hsu C.-J.; Lee J.-F.; Arrigo R.; Hävecker M.; Wang R.; Plodinec M.; Wang F. R.; et al. Surface Electron-Hole Rich Species Active in the Electrocatalytic Water Oxidation. J. Am. Chem. Soc. 2021, 143 (32), 12524–12534. 10.1021/jacs.1c01655. [DOI] [PMC free article] [PubMed] [Google Scholar]
- Smith R. D. L.; Prévot M. S.; Fagan R. D.; Zhang Z.; Sedach P. A.; Siu M. K. J.; Trudel S.; Berlinguette C. P. Photochemical Route for Accessing Amorphous Metal Oxide Materials for Water Oxidation Catalysis. Science 2013, 340 (6128), 60–63. 10.1126/science.1233638. [DOI] [PubMed] [Google Scholar]
- Zahler C. T.; Shaw B. F. What Are We Missing by Not Measuring the Net Charge of Proteins?. Chem.—Eur. J. 2019, 25 (32), 7581–7590. 10.1002/chem.201900178. [DOI] [PubMed] [Google Scholar]
- Brown E. S.; Peczonczyk S. L.; Wang Z.; Maldonado S. Photoelectrochemical Properties of CH3-Terminated p-Type GaP(111). J. Phys. Chem. C 2014, 118, 11593–11600. 10.1021/jp503147p. [DOI] [Google Scholar]
- Peczonczyk S. L.; Brown E. S.; Maldonado S. Secondary Functionalization of Allyl-Terminated GaP(111)A Surfaces via Heck Cross-Coupling Metathesis, Hydrosilylation, and Electrophilic Addition of Bromine. Langmuir 2014, 30 (1), 156–164. 10.1021/la403558k. [DOI] [PubMed] [Google Scholar]
- Yu Y.; Click K. A.; Chien S.-C.; Sun J.; Curtze A.; Lin L.-C.; Wu Y. Decoupling pH Dependence of Flat Band Potential in Aqueous Dye-Sensitized Electrodes. J. Phys. Chem. C 2019, 123 (14), 8681–8687. 10.1021/acs.jpcc.9b00710. [DOI] [Google Scholar]
- Boudart M.; Djega-Mariadassou G.. Chapter 4: Kinetics of two-step reactions on non-uniform surfaces. In Kinetics of Heterogeneous Catalytic Reactions; Princeton University Press, 1984; pp 118–154. [Google Scholar]
- Gileadi E.Chapter 19: Adsorption isotherms for intermediates formed by charge transfer. In Electrode Kinetics for Chemists, Chemical Engineers and Materials Scientists; VCH Publishers, 1993; pp 261–280. [Google Scholar]
- Schmickler W.; Santos E.. Chapter 6: Adsorption on metal electrodes: principles; Chapter 14: Hydrogen reaction and electrocatalysis. In Interfacial Electrochemistry, 2nd ed.; Springer-Verlag, 2010; pp 51–65 and 163–175. [Google Scholar]
- Primet M.; Basset J. M.; Mathieu M. V.; Prettre M. Infrared investigation of hydrogen adsorption on alumina-supported platinum. J. Catal. 1973, 28 (3), 368–375. 10.1016/0021-9517(73)90129-2. [DOI] [Google Scholar]
- Nichols R. J.; Bewick A. Spectroscopic identification of the adsorbed intermediate in hydrogen evolution on platinum. J. Electroanal. Chem. Interfacial Electrochem. 1988, 243 (2), 445–453. 10.1016/0022-0728(88)80047-0. [DOI] [Google Scholar]
- Conway B. E.; Bai L. Determination of adsorption of OPD H species in the cathodic hydrogen evolution reaction at Pt in relation to electrocatalysis. J. Electroanal. Chem. Interfacial Electrochem. 1986, 198 (1), 149–175. 10.1016/0022-0728(86)90033-1. [DOI] [Google Scholar]
- Zhu S.; Qin X.; Yao Y.; Shao M. pH-Dependent Hydrogen and Water Binding Energies on Platinum Surfaces as Directly Probed through Surface-Enhanced Infrared Absorption Spectroscopy. J. Am. Chem. Soc. 2020, 142 (19), 8748–8754. 10.1021/jacs.0c01104. [DOI] [PubMed] [Google Scholar]
- Agarwal R. G.; Kim H.-J.; Mayer J. M. Nanoparticle O–H Bond Dissociation Free Energies from Equilibrium Measurements of Cerium Oxide Colloids. J. Am. Chem. Soc. 2021, 143 (7), 2896–2907. 10.1021/jacs.0c12799. [DOI] [PubMed] [Google Scholar]
- Jencks W. P. A primer for the Bema Hapothle. An empirical approach to the characterization of changing transition-state structures. Chem. Rev. 1985, 85 (6), 511–527. 10.1021/cr00070a001. [DOI] [Google Scholar]
- van Santen R. A.; Neurock M.; Shetty S. G. Reactivity Theory of Transition-Metal Surfaces: A Bro̷nsted–Evans–Polanyi Linear Activation Energy–Free-Energy Analysis. Chem. Rev. 2010, 110 (4), 2005–2048. 10.1021/cr9001808. [DOI] [PubMed] [Google Scholar]
- Wang S.; Temel B.; Shen J.; Jones G.; Grabow L. C.; Studt F.; Bligaard T.; Abild-Pedersen F.; Christensen C. H.; No̷rskov J. K. Universal Bro̷nsted-Evans-Polanyi Relations for C–C, C–O, C–N, N–O, N–N, and O–O Dissociation Reactions. Catal. Lett. 2011, 141 (3), 370–373. 10.1007/s10562-010-0477-y. [DOI] [Google Scholar]
- Bligaard T.; Nørskov J.K.; Dahl S.; Matthiesen J.; Christensen C.H.; Sehested J. The Bro̷nsted–Evans–Polanyi relation and the volcano curve in heterogeneous catalysis. J. Catal. 2004, 224 (1), 206–217. 10.1016/j.jcat.2004.02.034. [DOI] [Google Scholar]
- Akhade S. A.; Nidzyn R. M.; Rostamikia G.; Janik M. J. Using Bro̷nsted-Evans-Polanyi relations to predict electrode potential-dependent activation energies. Catal. Today 2018, 312, 82–91. 10.1016/j.cattod.2018.03.048. [DOI] [Google Scholar]
- Borghesi A.; Guizzetti G.; Sassella A.; Bisi O.; Pavesi L. Induction-model analysis of Si-H stretching mode in porous silicon. Solid State Commun. 1994, 89 (7), 615–618. 10.1016/0038-1098(94)90175-9. [DOI] [Google Scholar]
- Buriak J. M. Organometallic Chemistry on Silicon and Germanium Surfaces. Chem. Rev. 2002, 102 (5), 1271–1308. 10.1021/cr000064s. [DOI] [PubMed] [Google Scholar]
- Delley M. F.; Wu Z.; Mundy M. E.; Ung D.; Cossairt B. M.; Wang H.; Mayer J. M. Hydrogen on Cobalt Phosphide. J. Am. Chem. Soc. 2019, 141 (38), 15390–15402. 10.1021/jacs.9b07986. [DOI] [PubMed] [Google Scholar]
- Kuo D.-Y.; Nishiwaki E.; Rivera-Maldonado R. A.; Cossairt B. M. The Role of Hydrogen Adsorption Site Diversity in Catalysis on Transition-Metal Phosphide Surfaces. ACS Catal. 2023, 13 (1), 287–295. 10.1021/acscatal.2c04936. [DOI] [Google Scholar]
- Quaino P.; Juarez F.; Santos E.; Schmickler W. Volcano plots in hydrogen electrocatalysis – uses and abuses. Beilstein Journal of Nanotechnology 2014, 5, 846–854. 10.3762/bjnano.5.96. [DOI] [PMC free article] [PubMed] [Google Scholar]
- Kibsgaard J.; Tsai C.; Chan K.; Benck J. D.; No̷rskov J. K.; Abild-Pedersen F.; Jaramillo T. F. Designing an improved transition metal phosphide catalyst for hydrogen evolution using experimental and theoretical trends. Energy Environ. Sci. 2015, 8 (10), 3022–3029. 10.1039/C5EE02179K. [DOI] [Google Scholar]