

SUMMARY
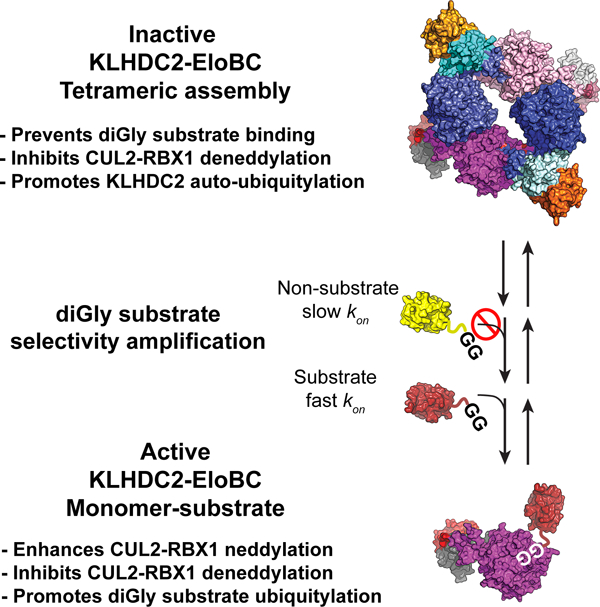
E3 ligase recruitment of proteins containing terminal destabilizing motifs (degrons) is emerging as a major form of regulation. How those E3s discriminate bona fide substrates from other proteins with terminal degron-like sequences remains unclear. Here, we report that human KLHDC2, a CRL2 substrate receptor targeting C-terminal Gly-Gly degrons, is regulated through interconversion between two assemblies. In the self-inactivated homotetramer, KLHDC2’s C-terminal Gly-Ser motif mimics a degron and engages the substrate-binding domain of another protomer. True substrates capture the monomeric CRL2KLHDC2, driving E3 activation by neddylation and subsequent substrate ubiquitylation. Non-substrates such as NEDD8 bind KLHDC2 with high affinity, but its slow on-rate prevents productive association with CRL2KLHDC2. Without substrate, neddylated CRL2KLHDC2 assemblies are deactivated via distinct mechanisms: the monomer by deneddylation and the tetramer by auto-ubiquitylation. Thus, substrate specificity is amplified by KLHDC2 self-assembly acting like a molecular timer, where only bona fide substrates may bind before E3 ligase inactivation.
Graphical Abstract
In Brief/eTOC blurb:
E3 ligases must recruit proteins needing ubiquitylation while ignoring related non-substrate proteins. Scott et al. show this depends on interconversion between a C-degron mimic-mediated autoinhibited self-assembly and an active monomer for the CUL2 receptor KLHDC2. Both forms are deactivated without substrate. True substrates drive forming the active neddylated CRL2KLHDC2 E3.
INTRODUCTION
The ubiquitin-proteasome system (UPS) is a major pathway regulating eukaryotic protein levels. Selectivity for UPS protein substrates is largely governed by E3 ligases, which modify proteins with ubiquitin (UB) to target them for degradation.1 Given the importance of the UPS in regulating protein turnover, a major question is how E3 ligases selectively target bona fide substrates, while sparing other proteins.2
E3 ligases possess unique protein interaction domains that recruit substrates by recognizing a molecular motif termed a “degron”.3 Many E3 ligases maintain proteostasis in quality control pathways, and such E3s typically detect degrons within native sequences aberrantly exposed upon errors in protein synthesis, folding, or complex assembly.4–9 Other E3 ligases function in regulatory cascades, selectively binding degrons modified post-translationally by phosphorylation or prolyl hydroxylation.10
Yet another theme in the field of E3 specificity is recognition of degrons at protein termini.11–13 The first degrons identified - more than 30 years ago – are hydrophobic or basic amino acids at protein N-termini.14 Such sequences bind distinct domains within a family “N-degron” E3 ligases, as well as bacterial Clp-family proteases.15–17 Recently, several other E3 ligase substrate binding domains (SBDs) were shown to recognize degrons at either N- or C-termini. Some of these terminal degrons were identified serendipitously18–20, while others were identified by Global Protein Stability (GPS) technology, a high-throughput method for profiling UPS substrates.21–23
How is specificity for terminal degrons established by E3s? For some, regulation is achieved through controlled formation of terminal degrons, such as proteolytic cleavage yielding fragments with C- and/or N-degrons, or by enzymatic addition or modification of amino acids at protein termini.11,24 Alternatively, E3 ligases can be regulated by metabolically-controlled incorporation of SBDs into multiprotein complexes.25–28
Nonetheless, for many E3 ligases recognizing terminal degrons, the question remains as to how true substrates are distinguished from those naturally bearing degron-like amino acid sequences.17,29–35 In this regard, a particularly vexing terminal degron E3 ligase is CRL2KLHDC2, a member of the CRL2 family of multiprotein cullin-RING ligases (CRLs).21,22,29 Prior GPS screens and crystal structures revealed the Gly-Gly C-terminus as the primary feature of CRL2KLHDC2 substrate degrons.21,22,29,36,37 Identification of CRL2KLHDC2 substrates by GPS profiling revealed roles in selenoprotein quality control and signal-induced regulation by targeting the deubiquitylating enzyme USP1 during DNA repair.18,21,22,29,37,38 Because KLHDC2’s SBD binds peptide-like sequences with a C-terminal Gly-Gly sequence, it remains perplexing how CRL2KLHDC2 avoids targeting UB and Ub-like proteins (UBLs) that contain flexible C-termini terminating with Gly-Gly. Crystal structures of the KLHDC2 SBD in complex with C-terminal degron peptides revealed an extensive constellation of KHLDC2 basic and aromatic residues anchoring the substrates C-terminal di-Gly motif.29 KHLDC2’s propensity to tolerate diverse sequences upstream of the di-Gly motif is explained by interactions with only backbone carbonyls of three of four upstream residues of the substrate. While structural studies raised the possibility that a UBL protein might bind the KLHDC2 SBD, prior GPS studies suggested that GFP-UB had negligible ability to trigger its KLHDC2-dependent degradation.22,37
Here, by investigating how CRL2KLHDC2 excludes the UBL NEDD8 as a substrate, we report biochemical, structural, and cell biological studies that collectively reveal a unique substrate mimicry mediating self-assembly of KHLDC2-EloBC as a specificity amplification mechanism that restricts ubiquitylation to bona fide substrates.
RESULTS
KLHDC2 recognizes the diGly C-terminus of NEDD8
We confirmed how KLHDC2 binds C-degrons by determining the crystal structure of its SBD in complex with a peptide derived from EPHB2 (Figure 1A, Table 1). KLHDC2 sidechains cradle the substrate C-terminal Gly-Gly residues, making limited contacts with sidechains of preceding residues (Figure 1A). Thus, consistent with prior structures, we observed an apparent lack of sequence requirements for residues preceding the di-Gly motif.29
Figure 1. KLHDC2 displays selectivity for the diGly C-terminus of NEDD8.
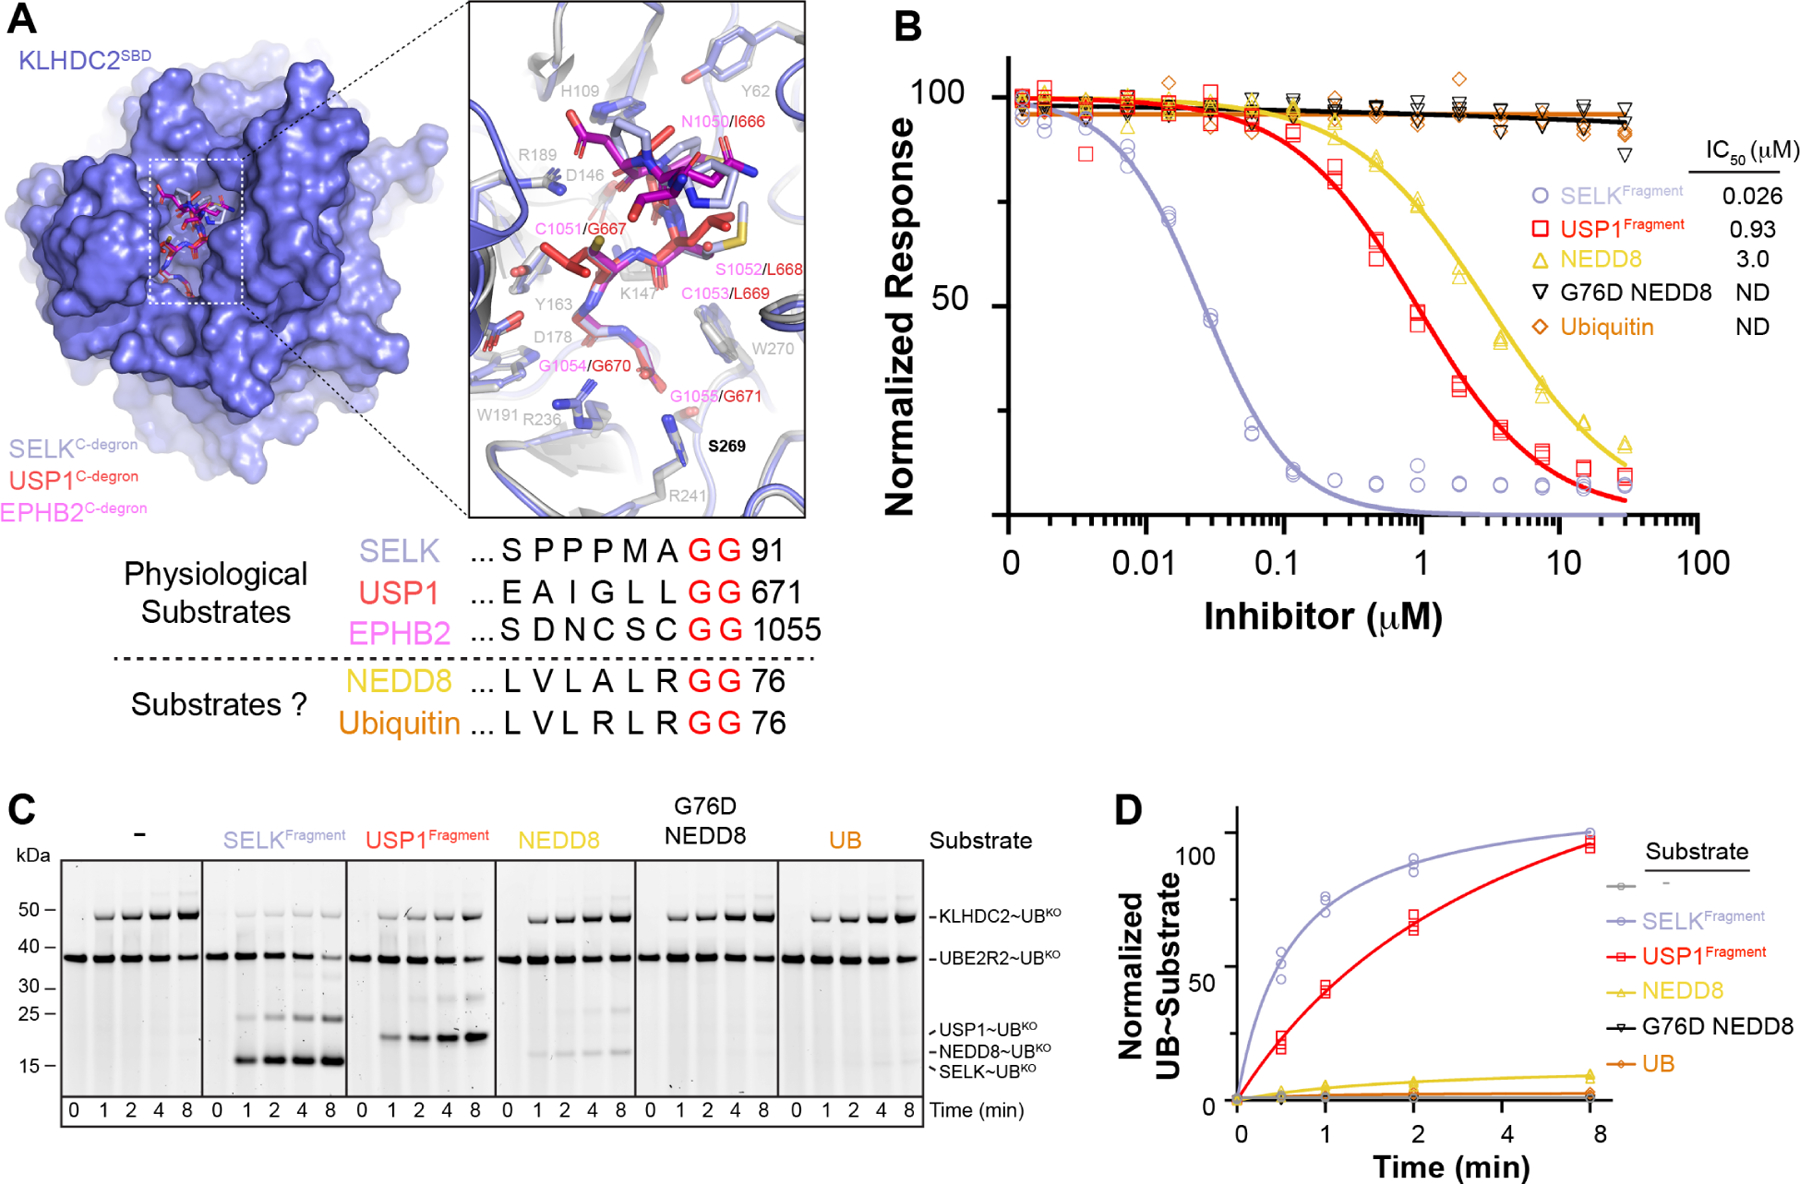
(a) Superposition of the KLHDC2 SBD (surface representation colored slate) bound to the di-Gly motif of EPHB2 (sticks colored magenta), SELK (sticks colored light blue; 6DO3.pdb), and USP1 (red, 6DO5.pdb). Inset depicts the structural conservation of C-degron binding. C-terminal sequences from known physiological substrates and for UB and NEDD8. (b) Results of TR-FRET assay between KLHDC2 and Ric8b peptide and the dose-dependent TR-FRET in the presence of five di-Gly containing proteins. (c) Pulse-chase ubiquitylation assay monitoring the transfer of fluorescently labeled Lys-less UB from UB~UBE2R2B to KLHDC2 or the indicated diGly containing substrates. (d) Quantification of assays shown in (c). Results shown in (b-d) are representative of n=3 replicates.
Table 1.
Data collection and refinement statistics
| KLHDC2SBD-EPHB2C-degron | KLHDC2SBD-KLHDC2C-terminus | KLHDC2-EloBC | |
|---|---|---|---|
| PBD accession code | 8EBL.pdb | 8EBM.pdb | 8EBN.pdb |
| Data Collection | |||
| Space group | P21 | P21 | P3112 |
| Cell dimensions | |||
| a, b, c (Å) | 49.48, 84.482, 90.729 | 44.761, 88.634, 89.082 | 142.431, 142.431, 140.749 |
| α, β, γ (°) | 90, 90, 90 | 90, 104.573, 90 | 90, 90, 120 |
| Resolution range (Å) a | 33.44 – 1.372 (1.421 – 1.372) | 38.93 – 1.58 (1.637 – 1.58) | 46.34 – 2.6 (2.693 – 2.6) |
| R-merge | 3.9 (61.7) | 8.4 (76.6) | 7.7 (70.5) |
| r-pim | 1.8 (26.4) | 4.6 (41) | 3.7 (34.5) |
| CC 1/2 | 98.9 (86.3) | 98.8 (62.7) | 99.5 (82.9) |
| I / σI | 28.5 (2) | 27.2 (1.8) | 25.0 (2.1) |
| Completeness (%) | 95.45 (92.98) | 97.71 (97.18) | 98.4 (99.06) |
| Redundancy | 3.1 (3.2) | 1.7 (1.7) | 2.2 (2.3) |
| Refinement | |||
| Resolution (Å) | 33.4 – 1.372 | 39.41 – 1.58 | 46.62 – 2.6 |
| No. Reflections | 148627 (14428) | 89960 (8934) | 49369 (4941) |
| R work /R free | 0.1488/0.1792 | 0.1925/0.2385 | 0.2108/0.2502 |
| No. atoms | 5988 | 5604 | 8463 |
| Protein | 5401 | 5201 | 8396 |
| Water | 587 | 403 | 67 |
| Wilson B-factor | 17.39 | 20.89 | 59.05 |
| RMS deviations | |||
| Bond lengths (Å) | 0.013 | 0.006 | 0.002 |
| Bond angles (°) | 1.21 | 0.87 | 0.55 |
Values in parentheses are for highest-resolution shell.
To determine if KLHDC2 binds to ubiquitin (UB) or the UB-like protein NEDD8, we developed a competitive binding assay. Briefly, time-resolved fluorescence resonance energy transfer (TR-FRET) occurs upon binding of a fluorescently-labeled substrate peptide from Ric8B to the SBD of KLHDC2; proteins are assayed for binding to KLHDC2 based on their inhibition of the TR-FRET signal. Titration of two CRL2KLHDC2 substrates (SELK or USP1) resulted in the loss of TR-FRET signal (Figure 1B). Consistent with prior studies, UB was not an effective competitor22,37, but unexpectedly, NEDD8 inhibited the KLHDC2-Ric8B interaction. A NEDD8 mutant whose C-terminal Gly residue was mutated to Asp could not compete (Figure 1B), consistent with the essential nature of the di-Gly motif in binding to KLHDC2.
To determine if NEDD8 can serve as a CRL2KLHDC2 substrate, we assayed ubiquitylation employing a “pulse-chase” format that detects neddylated CRL2KLHDC2-dependent transfer (CRL2-family members are activated by post-translational modification with the UBL NEDD8 through a process called neddylation) of labeled UB (*UB) from UBE2R2. In the absence of substrate, KLHDC2 is rapidly ubiquitylated. However, instead of auto-ubiquitylation of KLHDC2, neddylated CRL2KLHDC2 preferentially promotes *UB ligation to SELK or USP1 when present in the reaction mixtures (Figures 1C and 1D). Surprisingly, despite the ability of free NEDD8 to bind KLHDC2’s SBD, little *UB transfer to NEDD8 was observed. Instead, KLHDC2 was still auto-ubiquitylated to the extent observed in assays lacking substrate (Figure 1C). The results suggest that: (1) complex formation with KLHDC2’s SBD is necessary but not sufficient for substrate ubiquitylation; (2) the CRL2KLHDC2 complex has the means to distinguish between SBD protein interactors and bona fide substrates; and (3) the latter protect KLHDC2 from auto-ubiquitylation.
KLHDC2 C-terminus is a C-degron mimic
To gain insights into how the KLHDC2-EloBC substrate receptor complex is regulated, we determined its crystal structure at 2.6 Å resolution (Table 1). Unexpectedly, the SBD of each KLHDC2 protomer was occupied by the C-terminus from the adjacent KLHDC2 in the crystal. The C-terminal Ser, penultimate Gly, and preceding 4 residues superimpose with true substrate degrons bound to KLHDC2’s isolated SBD (Figures 2A, S1A, and S1B).29 To rule out the possibility that the interaction was artifactually imposed by crystal packing, the observed binding mode was confirmed with another crystal structure of the isolated SBD bound to a peptide corresponding to the KLHDC2 C-terminus. (Figure 2B, Table 1).
Figure 2. KLHDC2’s C-terminal GlySer acts as a C-degron mimic.
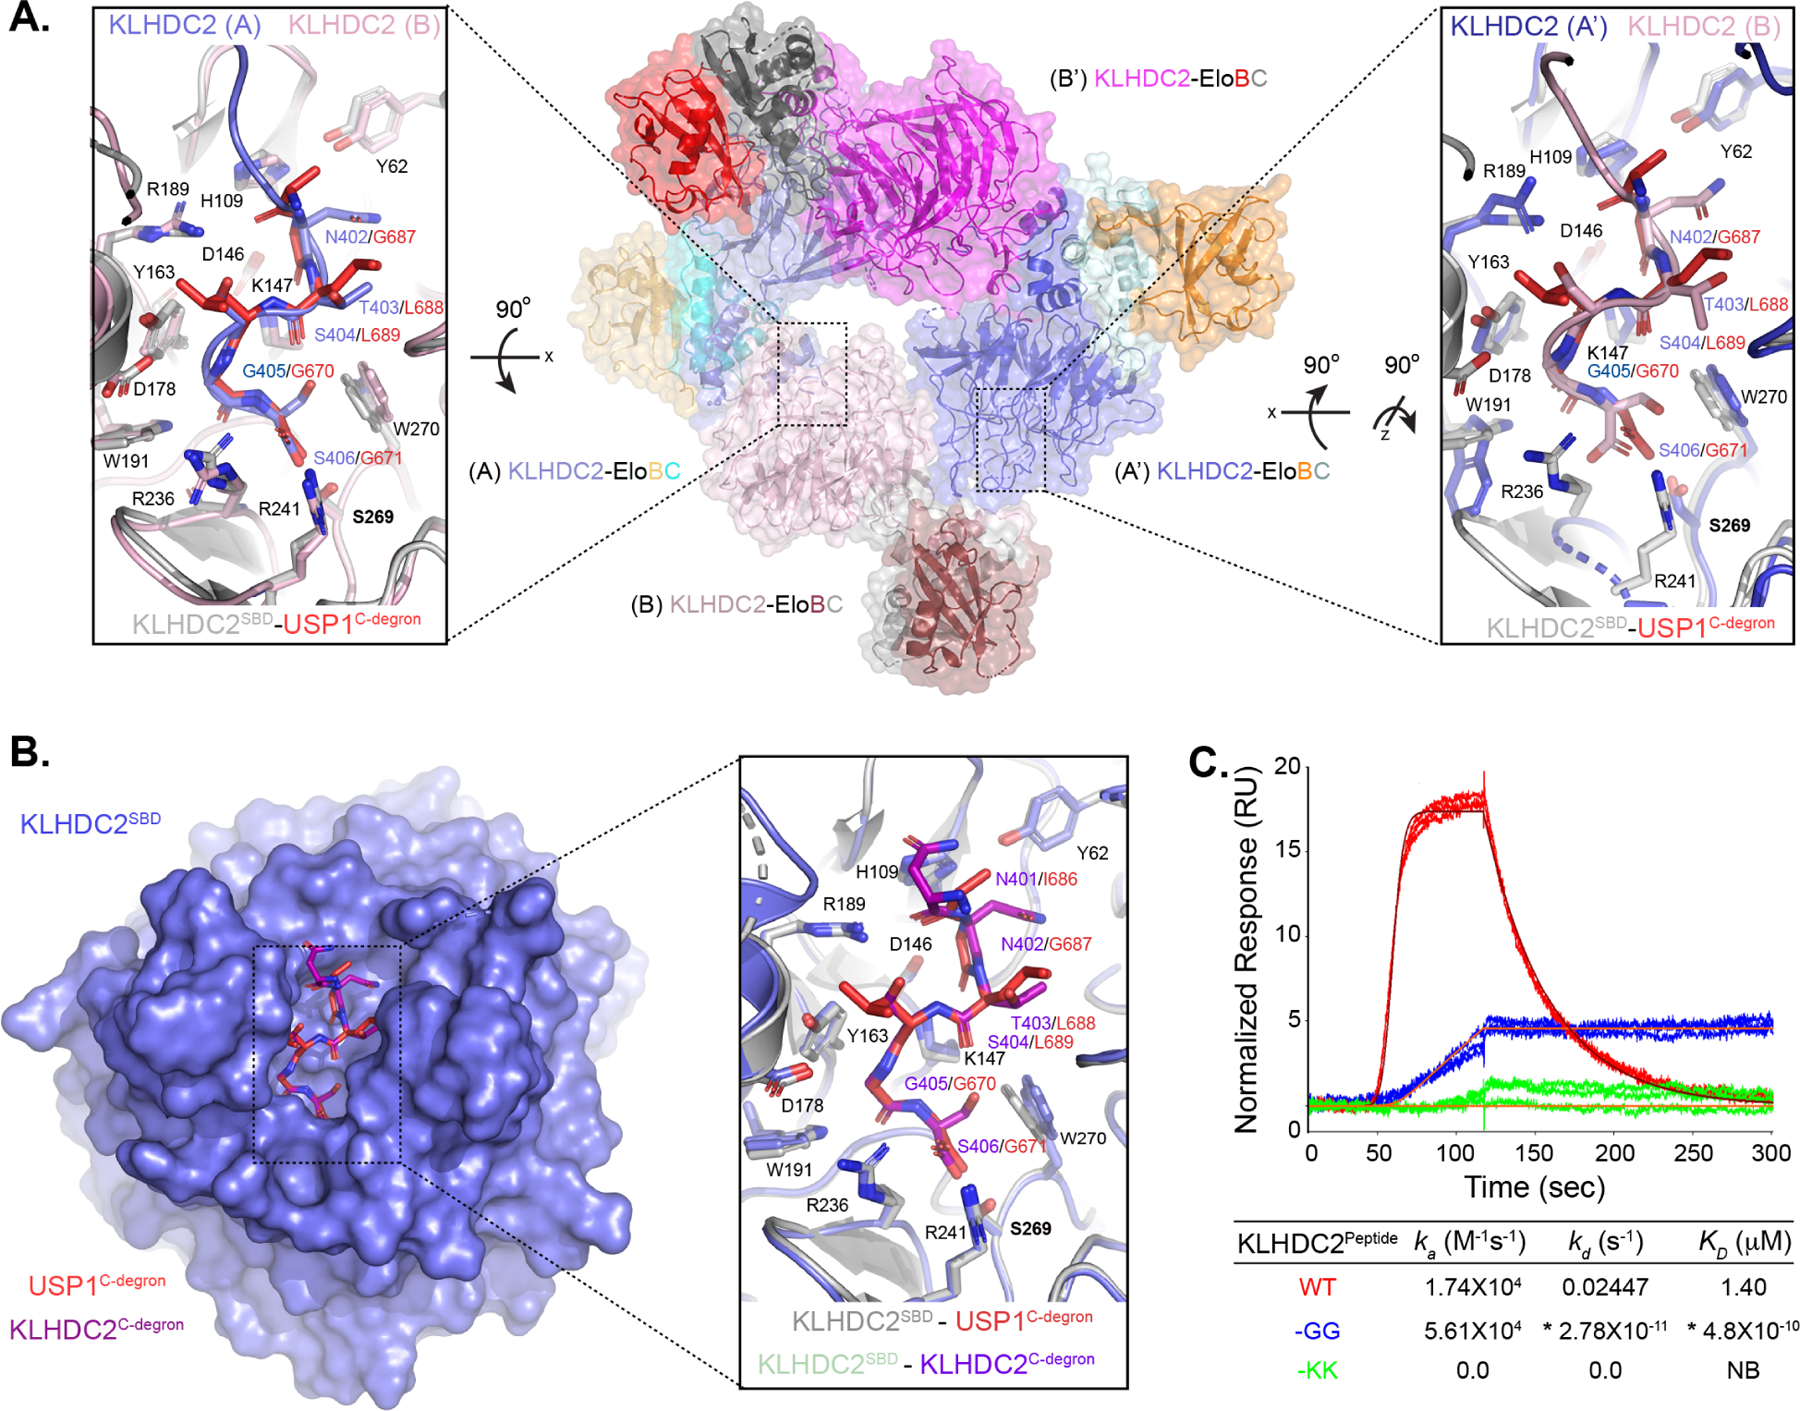
(a) Crystal structure of full-length KLHDC2-EloBC. The crystallographic asymmetric unit contains subunits A (slate) and B (light pink) that interact with symmetry related subunits A’ (blue) and B’ (magenta). Insets depict the binding of KLHDC2’s C-degron mimic from protomer A (slate; left panel) to B (light pink) or protomer A’ (blue; right panel) to B (light pink) compared to USP1’s diGly C-degron bound to KLHDC2’s SBD (red, 6DO5.pdb). (b) Superposition of KLHDC2 SBD (slate) bound to a peptide derived from KLHDC2’s C-degron mimic and the SBD bound to USP1’s diGly C-degron (red; 6DO5.pdb). Inset shows the structural conservation of interactions. (c) SPR between the KLHDC2 SBD and various peptides with WT or mutant C-degron sequences from KLHDC2’s C-terminus. Asterisks denote estimated kinetic parameters as the extreme slow-off rate of the -GG peptide precluded accurate determinations.
Measuring affinities of interactions between the KLHDC2 SBD and peptides by surface plasmon resonance (SPR) showed that the WT KLHDC2-derived peptide bound to the KLHDC2 SBD with a KD of 1.4 μM (Figure 2C). This is only 3–5-fold lower affinity than KD values for peptides from physiological substrates, USP1’s N-terminal UBL domain (KD of 0.26 uM) or GFP-RIC8B (KD of 0.46 uM; Figure S1C). Interestingly, a single amino acid replacement of the KLHDC2 C-terminal Ser with Gly increased the affinity by more than three orders-of-magnitude, owing to a much slower off-rate (Figure 2C). As predicted from the structure, mutation of the Gly-Ser motif to Lys-Lys completely abolished binding (Figure 2C). Thus, the KLHDC2 C-terminus mimics a degron, but with a sequence motif of intermediate affinity.
KLHDC2-EloBC forms a substrate mimic induced tetramer
The ability of the KLHDC2 degron mimicking C-terminus (hereafter referred to as C-degronmimic) to engage another molecule of KHLDC2’s SBD suggested that such interactions could avidly stabilize self-assembly of the substrate receptor complex. To test for oligomerization in solution, we employed size exclusion chromatography coupled with multi-angle light scattering. The data revealed an estimated mass of 280.8kDa for the complex, which matches the calculated mass of a tetrameric KLHDC2-EloBC complex (282.1kDa, Figure 3A; hereafter we refer to “tetramer” as four KLHDC2-EloBC complexes in a singular assembly, and “monomer” as one KLHDC2-EloBC complex). Performing sedimentation velocity analytical ultracentrifugation (SV-AUC) at various concentrations revealed a dilution-dependent decrease in tetramer population concomitant with increasing levels of monomer (Figure 3B). The data yielded an estimated KD value for tetramer dissociation of ~150 pM. Thus, the KLHDC2-EloBC substrate receptor complex forms an exceptionally stable tetrameric assembly.
Figure 3. KLHDC2-EloBC forms C-degron mimic dependent tetramers in solution.
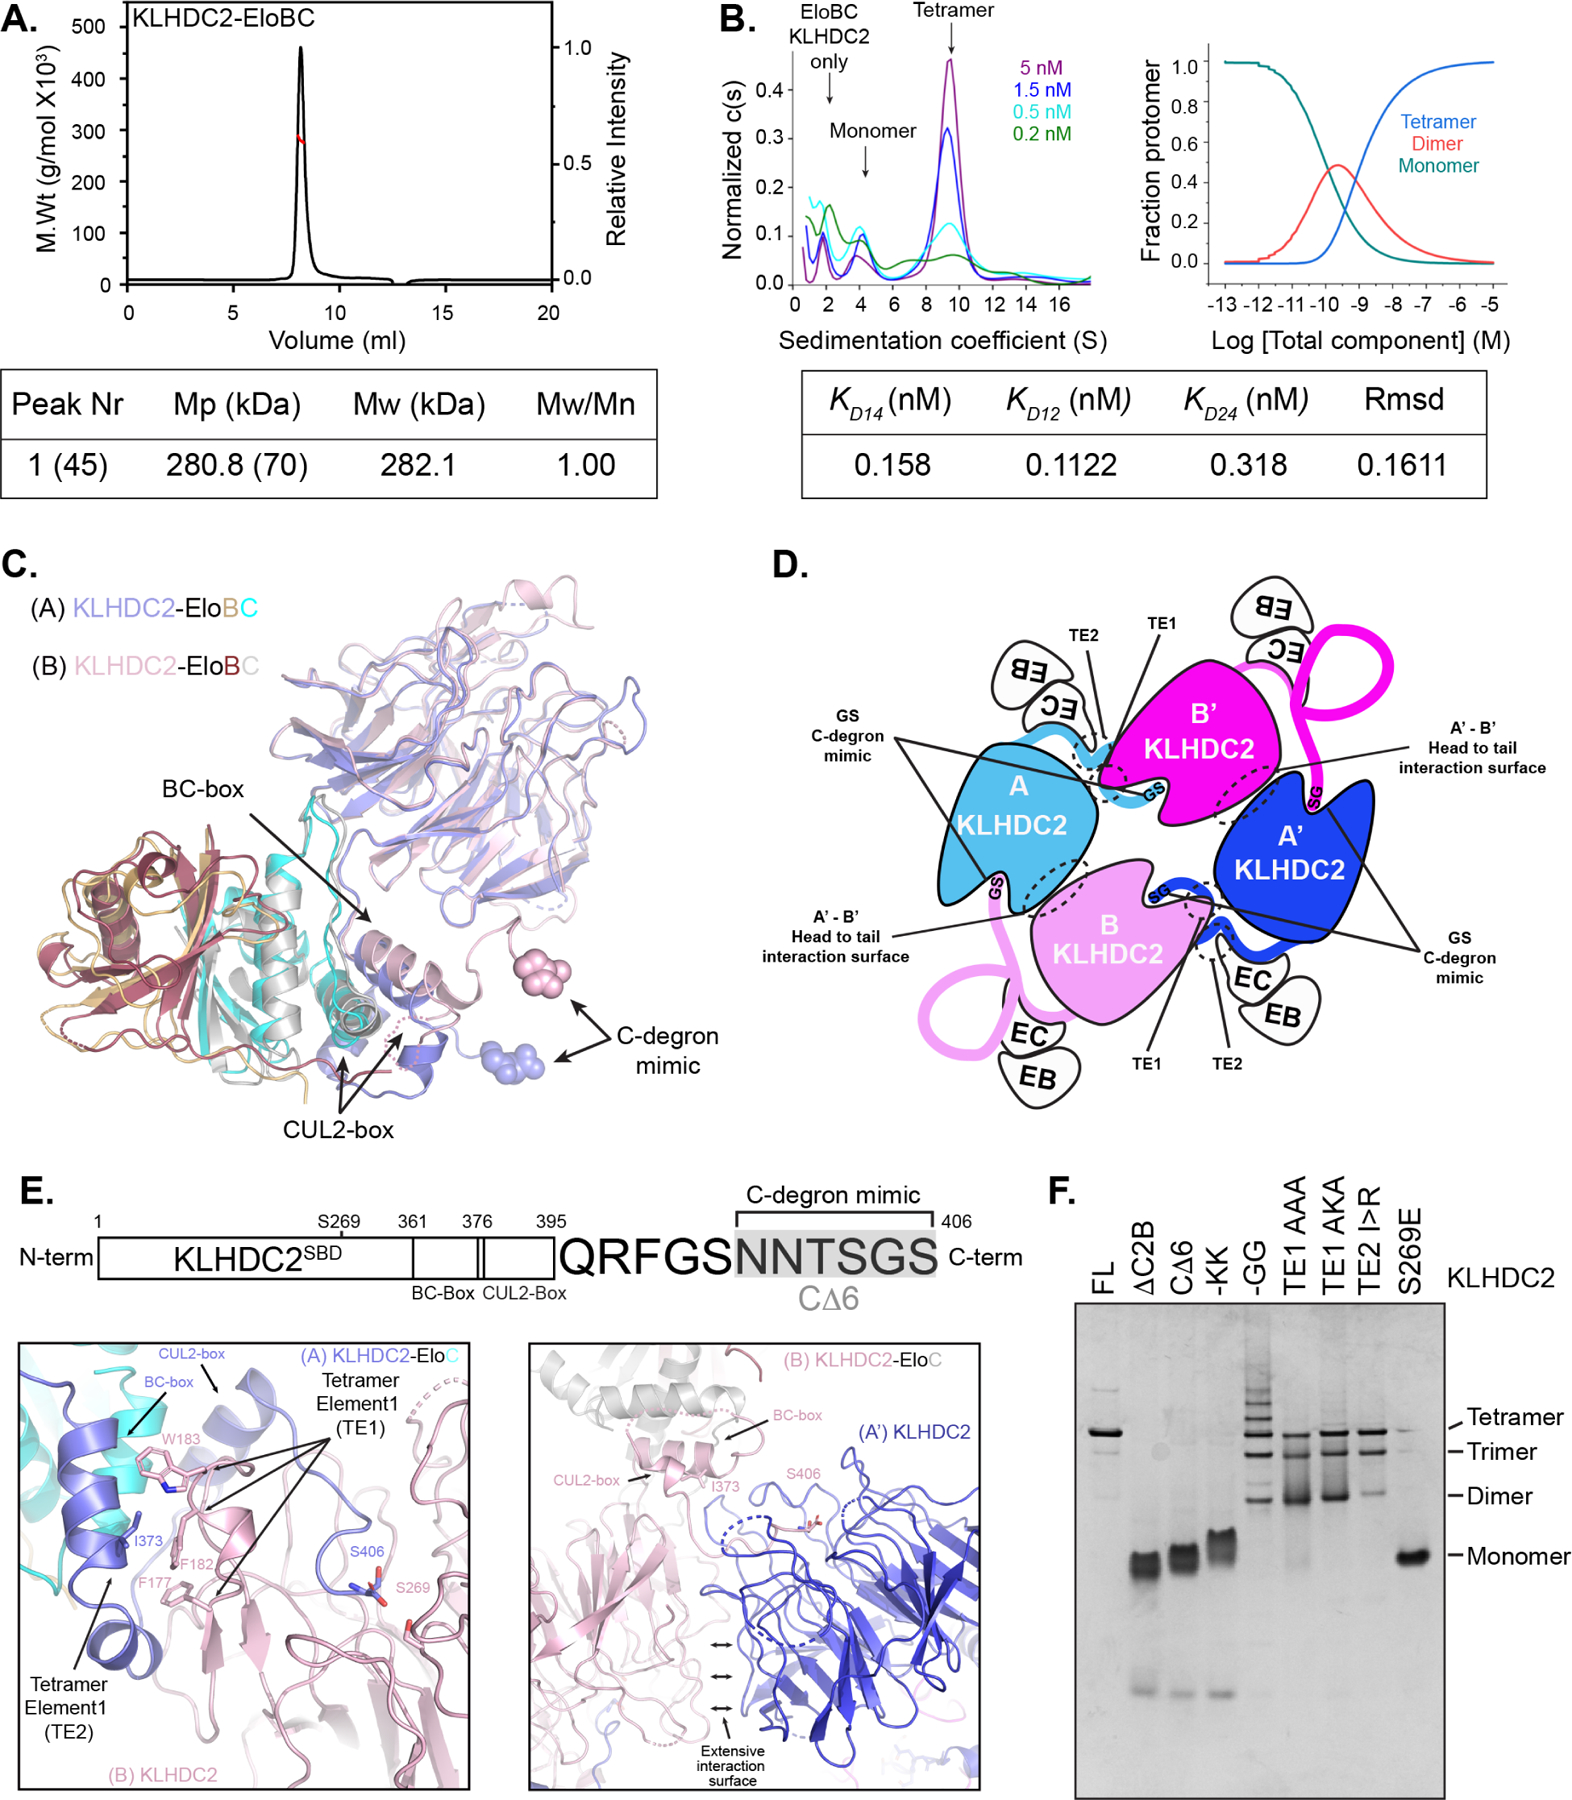
(a) SEC-MALS of KLHDC2-EloBC. Nr is peak number with the mass (μg) of injected protein sample in parenthesis; Mp is kDa molar mass of the protein complex at the peak apex (molar mass of monomer shown in parenthesis); Mw is the weight-averaged molar mass from multi-angle light scattering; and Mw/Mn is the polydispersity of mass in the peak. (b) SV-AUC with AlexaFluor488 labeled KLHDC2-EloBC. The y-axis shows the normalized continuous sedimentation coefficient c(s) as a function of the sedimentation coefficient (S) at the indicated concentrations of KLHDC2-EloBC (left panel). Species population plots as a function of KLHDC2-EloBC concentration (right panel). Model-derived dissociation constants KD14 for tetramer to monomer dissociation, KD12 for KLHDC2-EloBC dimerization, and KD24 for dimer-dependent tetramerization are shown. Root-mean square deviation (Rmsd) of the fit to the model is shown. (c) Superposition of promoters A and B from the KLHDC2-EloBC tetramer. Structural elements including the SBD, BC-box, and EloBC align well, with structural differences restricted to the extreme C-terminal degron mimic sequence of KLHDC2 subunits. (d) Cartoon schematic of the KLHDC2-EloBC tetramer highlighting locations of inter-molecular interactions between protomers and their associated tetramerization elements. (e) Primary structure of KLHDC2 highlighting positional boundaries for the SBD, BC-box, and CUL2-box. The C-terminal 12 residues of the C-degron mimic are shown. Ribbon diagrams highlighting tetramerization elements and the C-degron mimic between KLHDC2 protomers A and B (left panel) or A’ and B (right panel). (f) Coomassie stained native gel of WT KLHDC2-EloBC or indicated mutants monitoring the formation of oligomeric species.
The KLHDC2-EloBC x-ray structure revealed the molecular mechanism of tetramer formation: the asymmetric unit contained two KLHDC2-EloBC complexes that together with two flanking complexes in the crystallographic lattice formed a tetramer (Figures 2A, S1A, and S1B). We term the non-equivalent KLHDC2-EloBC complexes as protomers A or B, and symmetry-related protomers A’ and B’ (Figure 2A). Each protomer is connected to two others by interactions between SBDs and KLHDC2 C-degron-mimics. For instance, the C-degron-mimic of protomer A occupies the SBD of protomer B, and the SBD from A is occupied by the C-degron-mimic of protomer B’. As such, the tetrameric arrangement is closed since all SBDs are engaged (Figure 2A).
Although each copy of the KLHDC2 SBD and the BC-box-EloBC complex superimposed with the prior structures of these domains (Figures S1D and S1E)29,39, the helices emanating from the BC-box and preceding the C-degron mimic approach protomers A and B (or A’ and B’) from different orientations (Figure 3C). The distinct trajectories depend on inter-protomer interactions that establish the specific closed tetrameric arrangement (Figure 3D). The 6 C-terminal residues of KLHDC2 A are guided into the substrate binding pocket of KLHDC2 B by two unique sets of interactions. First, the backside of the BC-box helix of KLHDC2 A, opposite the face bound to EloBC, interacts with the β-propeller SBD from KLHDC2 B (Figure 3E, left panel). Also, the CUL2-box from subunit A forms an α-helical structure that is buttressed on both sides by KLHDC2 B (Figure 3E, left panel). Second, the β-propellers from protomers B and A’ are arranged in a head-to-tail fashion that creates an extensive interaction surface between solvent exposed residues from Kelch-repeat 5 (KR5) and KR6 from protomer B, with those from KR1 and KR2 from protomer A’ (Figure 3E right panel). As a result, instead of extensive interactions with a nearby protomer, the backside of the BC-box of KLHDC2 B interacts with the extreme C-terminal sequence of its own CUL2-box, thereby stabilizing its C-degron-mimic proximal to the substrate binding pocket of KLHDC2 A’ (Figures 3C and 3E right panel). The KLHDC2 B-A’ subunit interaction is further stabilized by loop elements from KLHDC2 A’ interacting with elements from the BC-box and EloC from protomer B (Figure 3E, right panel).
Within the interactions described above, two tetramerization elements (TE) define the specific geometry. Formation of the closed tetramer would prevent the assembly of filament structures by unchecked head-to-tail binding between KLHDC2 SBDs and C-degron mimics (Figure S2A). The tetrameric structure suggested that a loop within KLHDC2 KR4 serves as one TE (TE1), displaying several residues including Phe177, Phe182, and Trp183 that collectively interact with TE2 (Ile373 and the backside of the BC-box) of an adjacent KHLDC2 subunit (Figure 3E, left panel).
The roles of KLHDC2 sequences predicted to stabilize the tetramer were characterized through mutagenesis and monitoring the migration pattern of these mutants by nondenaturing gel electrophoresis. Deleting KLHDC2’s C-terminal 6 residues (CΔ6 mutant, Figure 3E), either alone or together with the CUL2-binding “CUL2-box” (ΔC2B), converted KLHDC2-EloBC to a monomeric species (Figure 3F). Notably, the CΔ6 mutant also terminates with Gly-Ser, suggesting the length of the KLHDC2 C-terminus has evolved to engage the adjacent subunit (Figure 3E). A mutant with the KLHDC2 C-terminal Gly-Ser di-peptide replaced with Lys-Lys (-KK) also migrated as a monomer (Fig 3F, confirmed by AUC, Figure. S2B), as does a mutant in the SBD (S269E) previously demonstrated to disrupt C-degron binding (Figure 3F).29
Mutation of the C-degron mimic to the optimal degron sequence Gly-Gly (-GG) resulted in multiple species whose gel migrations were indicative of a range of oligomers from dimers to assemblies larger than tetramers (Figure 3F). Importantly, mutation of TE1 or TE2 was destabilizing leading to the appearance of trimeric and dimeric species (Figure 3F). These results demonstrate that KLHDC2’s C-terminal degron mimic is indispensable for oligomerization, but additional elements constrain the assembly to the closed tetramer thwarting formation of varying oligomeric species.
The tetrameric KLHDC2-EloBC assembly is shared with at least one closely related CRL2-based C-degron substrate receptor, KLHDC3 (Figure S3). As predicted from its C-terminal -His-Gly sequence, purified KLHDC3-EloBC migrated with a mass consistent with a tetrameric assembly (Figures S3B and S3C). On the other hand, KLHDC10-EloBC was monomeric, consistent with divergence of its C-terminal sequence from its cognate degron (Figures S3B, S3I, and S3J).
The KLHDC2-EloBC tetramer is autoinhibited for substrate binding
Several experiments indicated that the KLHDC2-EloBC self-assembly is autoinhibited for substrate binding. First, the potential for KLHDC2-EloBC to interact with a fluorescein-labeled fragment from the substrate SELK (FAM-SELK) was examined by non-denaturing gel electrophoresis. FAM-SELK alone was not observed in the gel, presumably due to its small size (~5,700Da) and high charge density (pI = 11.5). Upon mixing with KLHDC2-EloBC a single band appeared (Figures 4A and S2C). Substantially greater signal was observed with monomeric -KK mutant. Similar migration in the gel raised the possibility that the WT KLHDC2-EloBC complex was also monomeric when bound to FAM-SELK (Figures 4A and S2C). Interestingly, a FAM-SELK band was not observed with the stabilized -GG mutant or with the negative control degron-binding deficient S269E mutant (Figures 4A, S2C–E).
Figure 4. The KLHDC2-EloBC tetramer does not bind protein substrates.
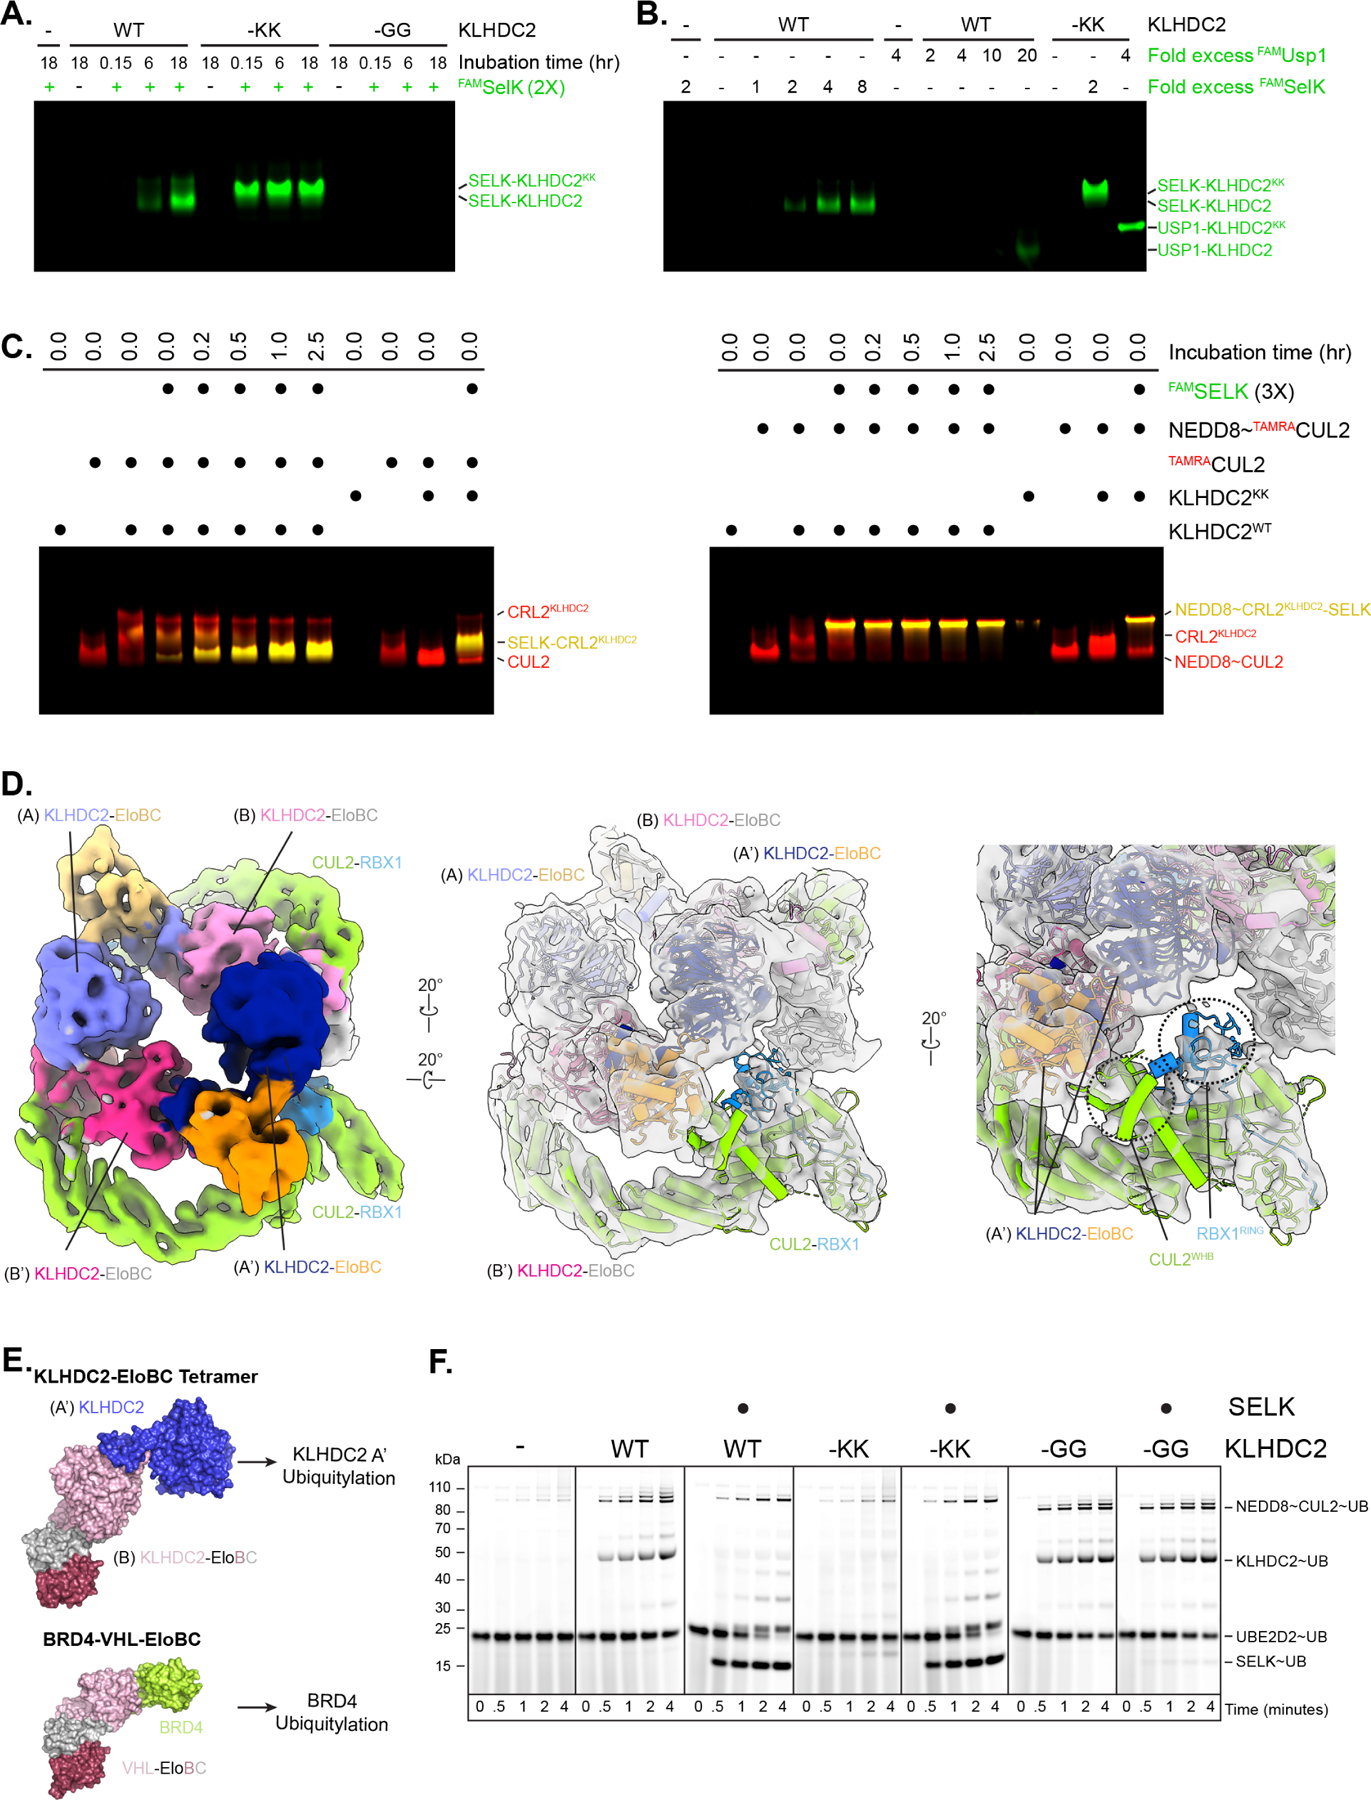
(a) Fluorescence-scan of native gel electrophoresis monitoring time dependence for binding of fluorescent SELK (FAMSELK) to WT or the indicated C-degron mimic mutants. (b) same as in (a) but monitoring concentration dependence of FAMSELK or FAMUSP1 after 4-hour pre-incubation. (c) same as in (a) but monitoring complex formation between TAMRA-labeled CUL2 (left panel) or TAMRA-labeled NEDD8~CUL2 (right panel) and FAMSELK. Co-migration of CUL2 and FAMSELK results in yellow bands. (d) Surface representations of the cryo-EM structure of KLHDC2-EloBC bound to CUL2-RBX1. (e) Models for ubiquitylation complexes with tetrameric KLHDC2-EloBC and substrate bound monomer KLHDC2. Note positioning of protomer A or A’ correlates with the predicted positioning of a diGly substrate. (f) Pulse-chase ubiquitylation reactions monitoring the transfer of fluorescently labeled WT UB from UB~UBCH5B to WT KLHDC2-EloBC or the indicated C-degron mutants with or without the addition of SELK.
The data raised the possibility that FAM-SELK could capture monomeric KLHDC2-EloBC present from slow tetramer/monomer interconversion at equilibrium. This model predicts that the KLHDC2-SELK interaction should increase with both greater incubation time and increasing substrate concentration which were both confirmed in experiments with wild-type KLHDC2-EloBC (Figures 4A, 4B, and S2F). However, neither an 18-hour pre-incubation, nor a 4-molar excess of FAM-SELK was sufficient to achieve the level of interaction observed with KLHDC2-EloBC -KK. The identity of substrate and its affinity for isolated KLHDC2 SBD also appeared to be important (Figures 1B and S1C). Compared to FAM-SELK, for which a 4-fold molar excess allowed substantial complex formation with KLHDC2-EloBC, a 20-fold molar excess of FAM-USP1 was required for only minimal interaction (Figures 4B and S2F).
To further explore the parameters of conversion from tetrameric KLHDC2-EloBC to substrate-bound monomer, we performed analytical size exclusion chromatography after various incubation periods for KLHDC2-EloBC and substrate. Without incubation, the tetrameric form of KLHDC2-EloBC and MBP-fused SELK fragment migrate in discrete fractions across an SD200 column. Mixing the two for extended time periods led to migration of a stoichiometric MBP-SELK:KLHDC2-EloBC complex (Figure S2G). Modeling the distribution of tetramer and MBP-SELK-KLHDC2-EloBC species under various incubation times enabled the computational estimation of the rates of tetramer dissociation and association (Figures S2G and S2H). Interestingly, the estimated KD (180–260 pM) agrees with the experimentally derived value from SV-AUC experiments performed in the absence of substrate (KD = 158 pM, Figure 3B), suggesting that substrate does not directly stimulate tetramer dissociation. Furthermore, the range of estimated kinetic rates for tetramer dissociation (2–2.5 × 10⁵ s−1) suggest KLHDC2-EloBC tetramers dissociate with a half-life of >12 hours, consistent with the time-course of substrate binding observed in nondenaturing gel electrophoresis (Figures 4A and S2C).
The prolonged incubation times required for substrate binding to KLHDC2-EloBC seemed to exceed a biologically relevant time scale. Thus, we considered if substrate binding may synergize with other facets of an active CRL2KHLDC2 E3 ligase. Indeed, in the nondenaturing gel mobility shift assay, adding CUL2-RBX1 reduced the required pre-incubation time for KLHDC2-FAM-SELK complex formation to <3 hours (Figure 4C, left panel), while a monomeric neddylated CRL-KLHDC2-EloBC-substrate complex required no pre-incubation (Figure 4C, right panel). In summary, while KLHDC2-EloBC on its own slowly dissociates into monomer capable of binding to substrates, dissociation was greatly accelerated in the neddylated CRLKLHDC2 complex that is activated for ubiquitylation.
Structural modeling provided a rationale for the accelerated dissociation. First, we superimposed EloBC-CUL2-RBX1 from the prior structure of CRL2VHL onto the corresponding region of the KLHDC2-EloBC tetramer, which showed the CUL2 binding sites are only accessible in the B and B’ protomers (Figures S4A and S4B).40,41 Second, we confirmed this arrangement by SEC-MALS (Figures S4C and S4D). For the KLHDC2 -KK monomer bound to either KLHDC2-EloBC-CUL2-RBX1 or KLHDC2-EloBC-NEDD8~CUL2-RBX1 the observed masses of 170.3 kDa and 182.7 kDa agrees with the calculated mass of a 1:1 complex (Figures S4C and S4D). For WT KLHDC2-EloBC-CUL2-RBX1 the peak was broad and deconvoluted into at least two distinct complexes. The leading edge of the peak with an estimated mass of 456.7 kDa is within experimental error of the calculated molecular mass for a KLHDC2-EloBC tetramer bound to two copies of CUL2-RBX1 (~480 kDa). The lagging edge of the peak corresponded to an estimated mass of 427.5 kDa. While we cannot unequivocally define this complex assembly, the estimated mass is consistent with a trimeric KLHDC2-EloBC (~210 kDa) bound to two CUL2-RBX1 subcomplexes (~200 kDa). For WT KLHDC2-EloBC-NEDD8~CUL2-RBX1, the estimated mass was 388 kDa, consistent with a tetrameric KLHDC2-EloBc assembly (~280 kDa) bound to one NEDD8~CUL2-RBX1 moiety (~110 kDa). In summary, the data are consistent with dynamic assembly between KLHDC2-EloBC and CUL2-RBX1, resulting in a sample that contained both two CUL2-RBX1 bound to a KLHDC2-EloBC tetrameric assembly and another sub-complex, seemingly of this where one KLHDC2-EloBC entity has dissociated. These results are consistent with accelerated dissociation of the KLHDC2-EloBC tetramer in the presence of CUL2-RBX1. In addition, the predominant complex of KLHDC2-EloBC tetramer with one NEDD8~CUL2-RBX1 is consistent with the notion that clashing between the tetrameric assembly and both NEDD8 and the CUL2 and RBX1 domains (that become mobilized by neddylation) reduces the overall stability relative to the 4:2 KLHDC2-EloBC:CUL2-RBX1 assembly. Indeed, analytical sizing runs of WT KLHDC2-EloBC NEDD8~CUL2-RBX1 with or without the SelK fragment confirm that NEDD8~CUL2-RBX1 accelerates KLHDC2-EloBC tetrameric disassembly (Figures S4E and S4F), although peak overlap between oligomeric KLHDC2-EloBC-NEDD8~CUL2-RBX1 and substrate bound monomeric KLHDC2-EloBC-NEDD8~CUL2-RBX1 prevented accurate quantification of these species precluding kinetic modeling as in Figures S2G and S2H.
To further corroborate these ideas, we obtained an 8.2 Å resolution cryo EM map of CRL2KLHDC2 (Figure 4D and S5A). The EM density was readily fit with the crystallographically-determined KLHDC2-EloBC tetramer, and CUL2 bound to protomers B and B’. As is typical for CRL structures, density for the catalytic regions - CUL2’s C-terminal “WHB” domain and RBX1’s RING domain - was visible only at low contour and resolution, precluding unambiguous orientation of these domains. Nonetheless, they are adjacent to EloBC and KLHDC2, respectively, from protomer A or A’ (Figure 4D). By analogy to other CRLs, in which the cullin WHB and RBX1 RING domains are flexibly tethered, it seems likely that positions accessible to these domains would sterically clash with the tetramer.42–44 This would be further exacerbated for the neddylated complex, in which NEDD8, the CUL2 WHB domain to which it is linked, and RBX1’s RING domain would all be expected to sample multiple conformations.42–46
To gain insights into potential catalytic functions of tetramerization, we superimposed a prior structure of a CRL2 substrate receptor bound to a protein substrate (a PROTAC-mediated complex between VHL-EloBC and second bromodomain from BRD4) onto protomer B, which can bind CUL2.47 This comparison revealed that KLHDC2 A’ recruited to KLHDC2 B is similarly positioned as a substrate (Figure 4E), suggesting that KLHDC2 tetramerization could promote its auto-ubiquitylation. Indeed, ubiquitylation assays showed that only versions of KLHDC2 that oligomerize (WT without substrate and -GG with or without substrate) are subject to auto-ubiquitylation (Figure 4F), whereas the obligate monomer KLHDC2 -KK is only marginally auto-ubiquitylated even in the absence of substrate.
A slow on-rate protects NEDD8 from ubiquitylation by CRL2KHLDC2
The structural and biochemical results hint at intricate interplay between the degron-mimic-mediated KLHDC2 tetramer and monomer capture by substrate. To further explore why NEDD8 was a relatively poor ubiquitylation substrate in pulse-chase assays despite its comparable affinity with USP1 for the KLHDC2 SBD, rapid quench flow was employed to quantify pre-steady state kinetic parameters. In reactions with KLHDC2 -KK and following a one-hour equilibration of substrate with E3, the rate of NEDD8 modification was surprisingly faster than for the bona fide substrates USP1 and SELK (Figures S6A–D; kobs 0.30s-1 NEDD8, 0.21s-1 USP1, and 0.10s-1 SELK). Thus, NEDD8 has potential to serve as a substrate if sufficient time is provided for formation of a KLHDC2-substrate complex (Figures S6A–D).
Next, qualitative ubiquitylation reactions were performed comparing *UB transfer to USP1 or NEDD8 after varying pre-incubation periods between substrate and NEDD8~CRL2KLHDC2. Maximal ubiquitylation of USP1 was achieved after a 5-minute pre-incubation, whereas under identical conditions with NEDD8, the majority of *UB partitioned to KLHDC2 (Figures 5A and 5B). Even a 30-minute pre-incubation with NEDD8 was not sufficient to fully direct *UB conjugation to NEDD8 (Figure S6E). With KLHDC2 -KK, maximal ubiquitylation of UPS1 required no pre-incubation, whereas the pre-incubation required for NEDD8 ubiquitylation was reduced to <5 minutes (Figures 5A and 5B).
Figure 5. KLHDC2-EloBC substrate mimic-induced tetramers select for bona fida substrates through a proofreading mechanism.
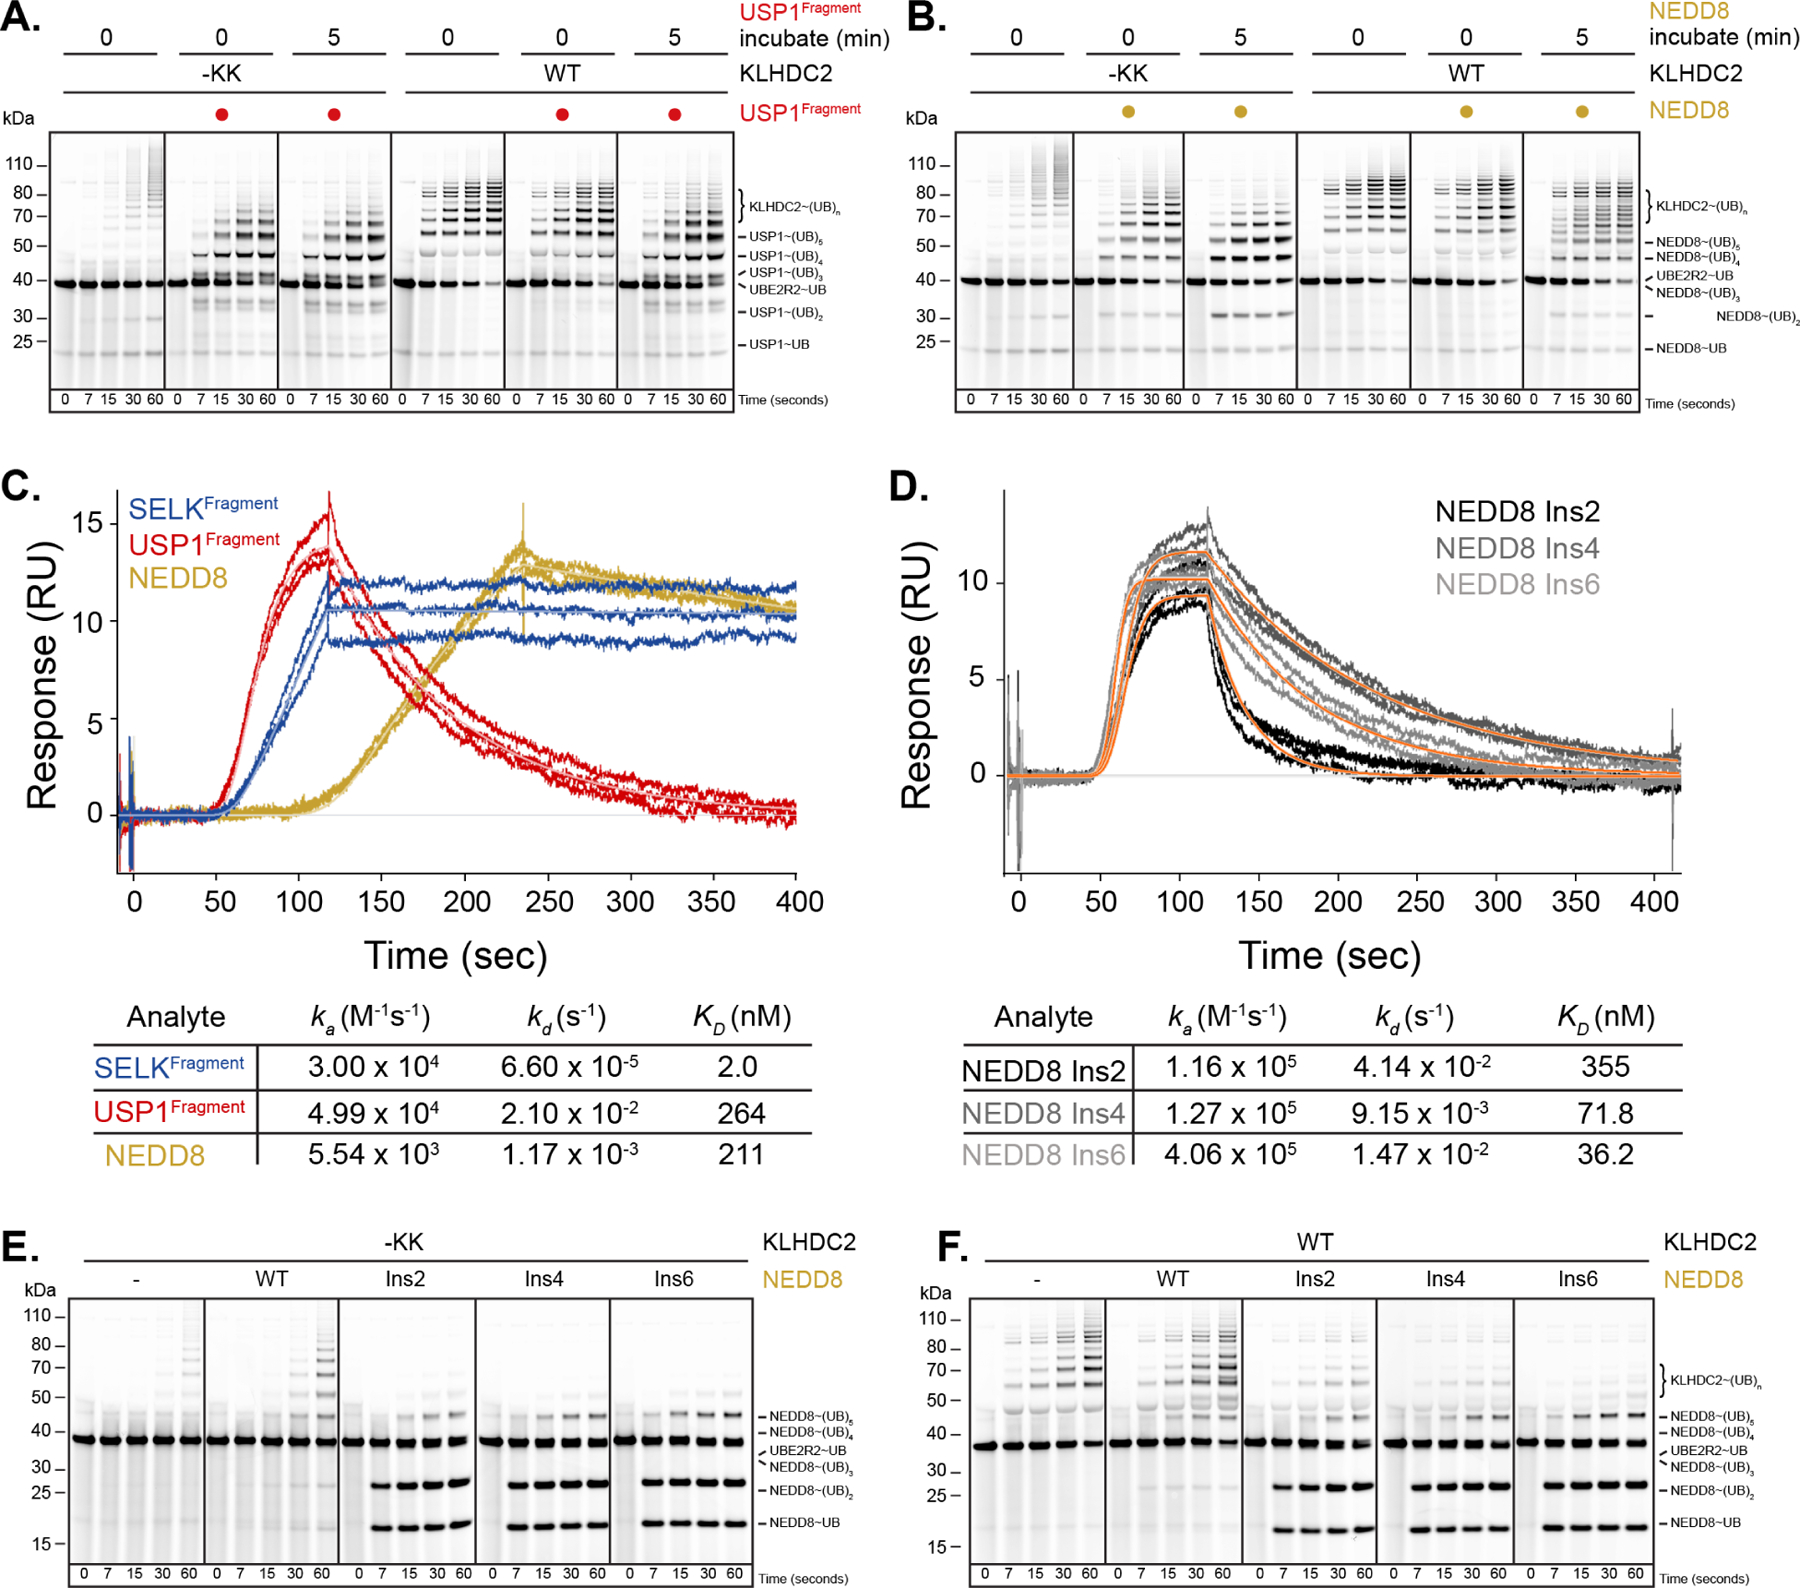
(a) Pulse-chase ubiquitylation reactions monitoring how pre-incubation of a USP1-NEDD8~CUL2KLHDC2 complex affects transfer of UB from UB~UBE2R2 to substrate with WT or -KK monomeric KLHDC2-EloBC. (b) same as in (a) but with NEDD8. Note that pre-incubation results in partitioning of UB from KLHDC2 to USP1 but not NEDD8 in a tetramer-dependent fashion. (c) SPR traces monitoring the binding of SELKFragment, USP1Fragment, or NEDD8 proteins to the KLHDC2 SBD. Association rates (ka), dissociation rates (kd), and the equilibrium binding constants (KD) obtained from fits are shown. (d), same as in (c), but with the indicated GlySer insertion mutants of NEDD8. (e) same as in (a) but with -KK KLHDC2 and NEDD8 or the indicated insertion mutant substrates. (f) same as in (e) but with WT KLHDC2.
The extended pre-incubation requirement suggested that NEDD8 associates with KLHDC2 relatively slowly. Indeed, the association rate of NEDD8, as measured by SPR, was an order-of-magnitude slower (Figure 5C; 5.5 X 10³ M−1s−1) than that of USP1 or SELK (4.9 X 10⁴ and 3 X 10⁴ respectively). Despite NEDD8’s slow rate of association, its equilibrium binding affinity is comparable with USP1 (211 nM vs. 264 nM), due to an order-of-magnitude slower rate of dissociation (Figure 5C).
Structural analysis suggested that NEDD8’s C-terminal tail might be too short to enable rapid association with KLHDC2.22,37 This was tested for with a panel of NEDD8 variants extending the C-terminal tail by inserting 2, 4, or 6 residues (1, 2, or 3 Gly-Ser repeats, respectively) upstream of the Gly-Gly. SPR measurements confirmed that the NEDD8 mutants rescued the rate of association with KLHDC2 (Figure 5D). Consistent with this, the insertion variants were readily ubiquitylated without pre-incubation (Figures 5E and 5F). Taken together, the data indicate that C-degron mimicry-induced KLHDC2 tetramerization excludes NEDD8 as a substrate due to its slow on-rate, while bona fide substrates possess on-rates that are sufficient to capture the monomeric form of neddylated CRL2KLHDC2 within the monomer-tetramer equilibrium.
Multimodal effects of C-degron mimic-mediated tetramerization on CRL2KLHDC2 neddylation
Given the importance of neddylation in activating CRL-dependent ubiquitylation, we tested effects of mutations impacting the C-degron mimic-mediated tetramerization on NEDD8 transfer to CRL2KLHDC2, inhibition of this reaction by CAND1, and deneddylation mediated by the COP9 Signalosome (CSN). Assays were performed with or without a C-degron peptide or a bona fide C-degron protein substrate, which both shift the tetramer-to-monomer equilibrium for WT CRL2KLHDC2, while also having complementary structural properties of being small (peptide) or large (protein).
The results showed a striking trend: monomeric versions of KLHDC2-EloBC, in some cases bound to substrate protein, were preferentially neddylated. For example, the rate of CUL2-RBX1 neddylation was greatest with the -KK monomeric mutant of KLHDC2-EloBC, with or without a bound substrate, and for the tetramer supplied with substrate that captures the monomer (Figures 6A left panel, and S7A). The same trend was also observed in the presence of CAND1, whose inhibition of neddylation of other CRLs has been shown to be overcome by their binding to substrate receptors (Figures 6A right panel, and S7B).
Figure 6. KLHDC2 C-degron mimic-induced tetramerization affects myriad CRL2KLHDC2 biochemical activities.
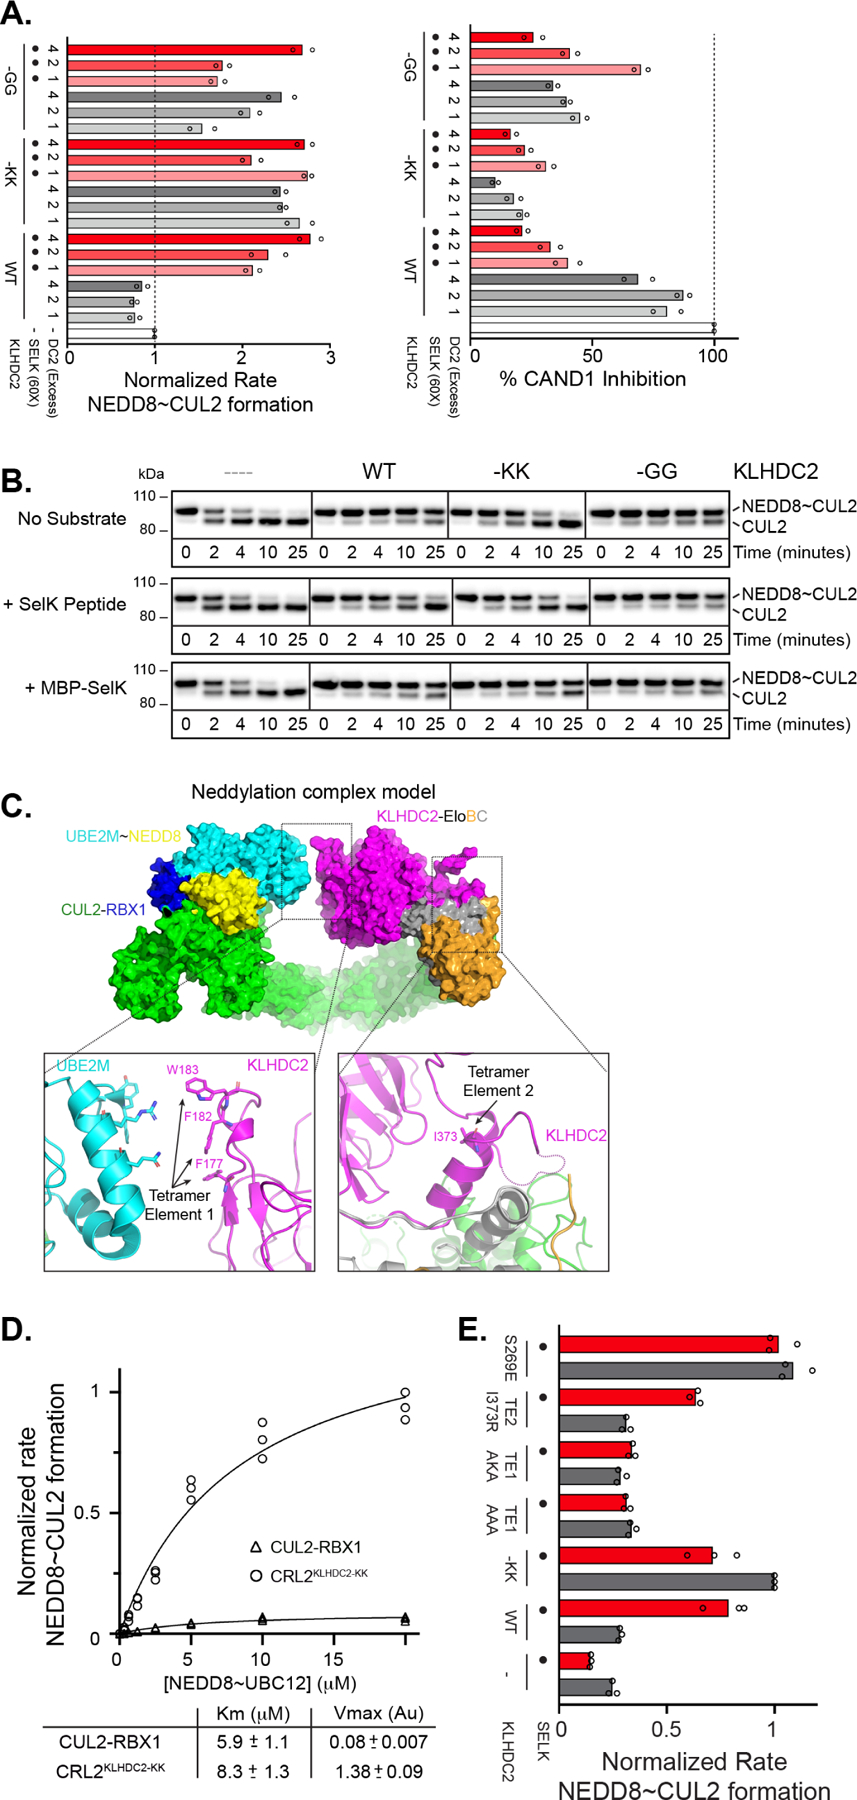
(a) Normalized rates of CUL2 neddylation by NEDD8~UBE2M in the absence (left panel) or presence (right panel) of CAND1 and with WT or the indicated KLHDC2-EloBC C-degron mutants and with or without SELK peptide. (b) Western blot monitoring NEDD8~CUL2 deneddylation by CSN in the absence or presence of WT or the indicated KLHDC2-EloBC C-degron mutants and with or without the addition of SELK peptide or a MBP-SELK fusion protein. (c) Model of monomeric CUL2KLHDC2 neddylation complex. The relative position of tetramerization elements 1 and 2 are highlighted. (d) Velocity of CUL2 neddylation versus NEDD8~UBE2M concentration. Rates of NEDD8~CUL2 formation were measured in the presence of CUL2 alone (circles) or CUL2KLHDC2(-KK). Data were fit to the Michaelis-Menten model using Graphpad Prism software. (e) same as in (a) but monitoring the stimulation of CUL2 neddylation in the presence of WT or the indicated KLHDC2-EloBC mutants with or without SELK. All results represent replicates of n=3.
The effects of tetramerization and substrate binding on deneddylation of NEDD8~CRL2KLHDC2 were more intricate but agreed with structural modeling. Briefly, superimposing the EloBC-CUL2 portion of the complex on a prior cryo-EM map of CSN-bound to neddylated CRL2VHL showed substantial clashing between CSN with the tetramer, explaining its inhibition of deneddylation (Figures 6B and S7C).45 In contrast, less clashing is observed with a monomeric NEDD8~CRL2KLHDC2, explaining increased deneddylation rates of the monomeric -KK mutant, and of this mutant and WT NEDD8~CRL2KLHDC2 in the presence of a small C-degron peptide (Figures 6B and S7C). As with other CRLs, the binding of a larger protein substrate would substantially obstruct CSN, thus explaining why a substrate protein (MBP-SELK) maintains NEDD8 on monomeric versions of CRL2KLHDC2 (Figure 6B and S7C).48,49
The increased rate of CUL2 neddylation in the presence of monomeric versions of KLHDC2-EloBC were unexpected as cullin neddylation is not typically influenced in vitro by substrate receptors. However, modeling a CRL2KLHDC2 neddylation complex by superimposing the prior structure of the NEDD8 ligation machinery onto monomeric KLHDC2-EloBC showed that residues corresponding to KLHDC2 TE1, which are buried in the tetramer but exposed in the monomer, are proximal to UBE2M (which catalyzes NEDD8 transfer to cullin; Figure 6C).50 Michaelis-Menten kinetics on the neddylation reaction revealed that, in comparison to the values for CUL2-RBX1 alone, adding monomeric KLHDC2-EloBC -KK resulted in a ~17-fold increase in the maximal rate of neddylation (Vmax) with little impact on the Michaelis constant (Km) (Figure 6D). Furthermore, while similar rates of neddylation were achieved by adding substrate to WT CRL2KLHDC2 (Figure 6A left panel), this was largely abrogated by mutation of KLHDC2 TE1 (Figures 6E and S7D). Importantly, the activation of neddylation by monomeric KLHDC2-EloBC required binding to CUL2, as a truncated version of CUL2-RBX1 that is competent for neddylation but cannot bind substrate receptors did not show KLHDC2-dependent stimulation of CUL2 neddylation (Figure S7E). Thus, the monomeric CRL2KLHDC2 complex seems specifically arranged in a manner to promote formation of the catalytically competent conformation of neddylation enzymes, although future studies will be required to determine the precise structural mechanism.
Cellular roles for KLHDC2 C-degron mimicry
We sought to gain insights into potential roles of KLHDC2’s C-degron mimic mediating self-assembly in cells. Analysis of whole cell lysates from transiently transfected 293T cells by gel filtration chromatography showed KLHDC2 migrating across numerous fractions (from <660,000 Da to 75,000 Da; Figure S8A), presumably due to its bewildering number of interacting partners. We thus tested if mutations affecting tetramer formation in vitro resulted in similar outcomes in cells.
We first examined the impact on CUL2 deneddylation. After confirming that CSN activity is maintained in lysis buffer conditions (Figure S8B), we performed transient transfections of 293T cells with FLAG-tagged WT or mutant KLHDC2, lysates were prepared in either the absence or presence of excess of SELK peptide, and with or without pharmacological inhibitors of neddylation (MLN4924) or deneddylation (CSN5i). Anti-FLAG immunoprecipitants were analyzed by immunoblotting for associated proteins. In the absence of any treatment, WT KLHDC2 co-precipitated a mixture of unmodified and neddylated CUL2. However, the monomeric -KK KLHDC2 mutant co-immunoprecipitated unneddylated CUL2, whereas the stabilized -GG KLHDC2 mutant preferentially associated with fully neddylated CUL2 (Figure 7A). Notably, as with experiments performed in vitro with purified components (Figure 6B), addition of SELK peptide stimulated CUL2 deneddylation in complexes with WT KLHDC2, and inclusion of CSNi5 confirmed CSN as responsible for CUL2 deneddylation (Figure 7A).
Figure 7. KLHDC2-EloBC appears to form C-degron mimic-dependent tetramers in cells that control CUL2KLHDC2 function.
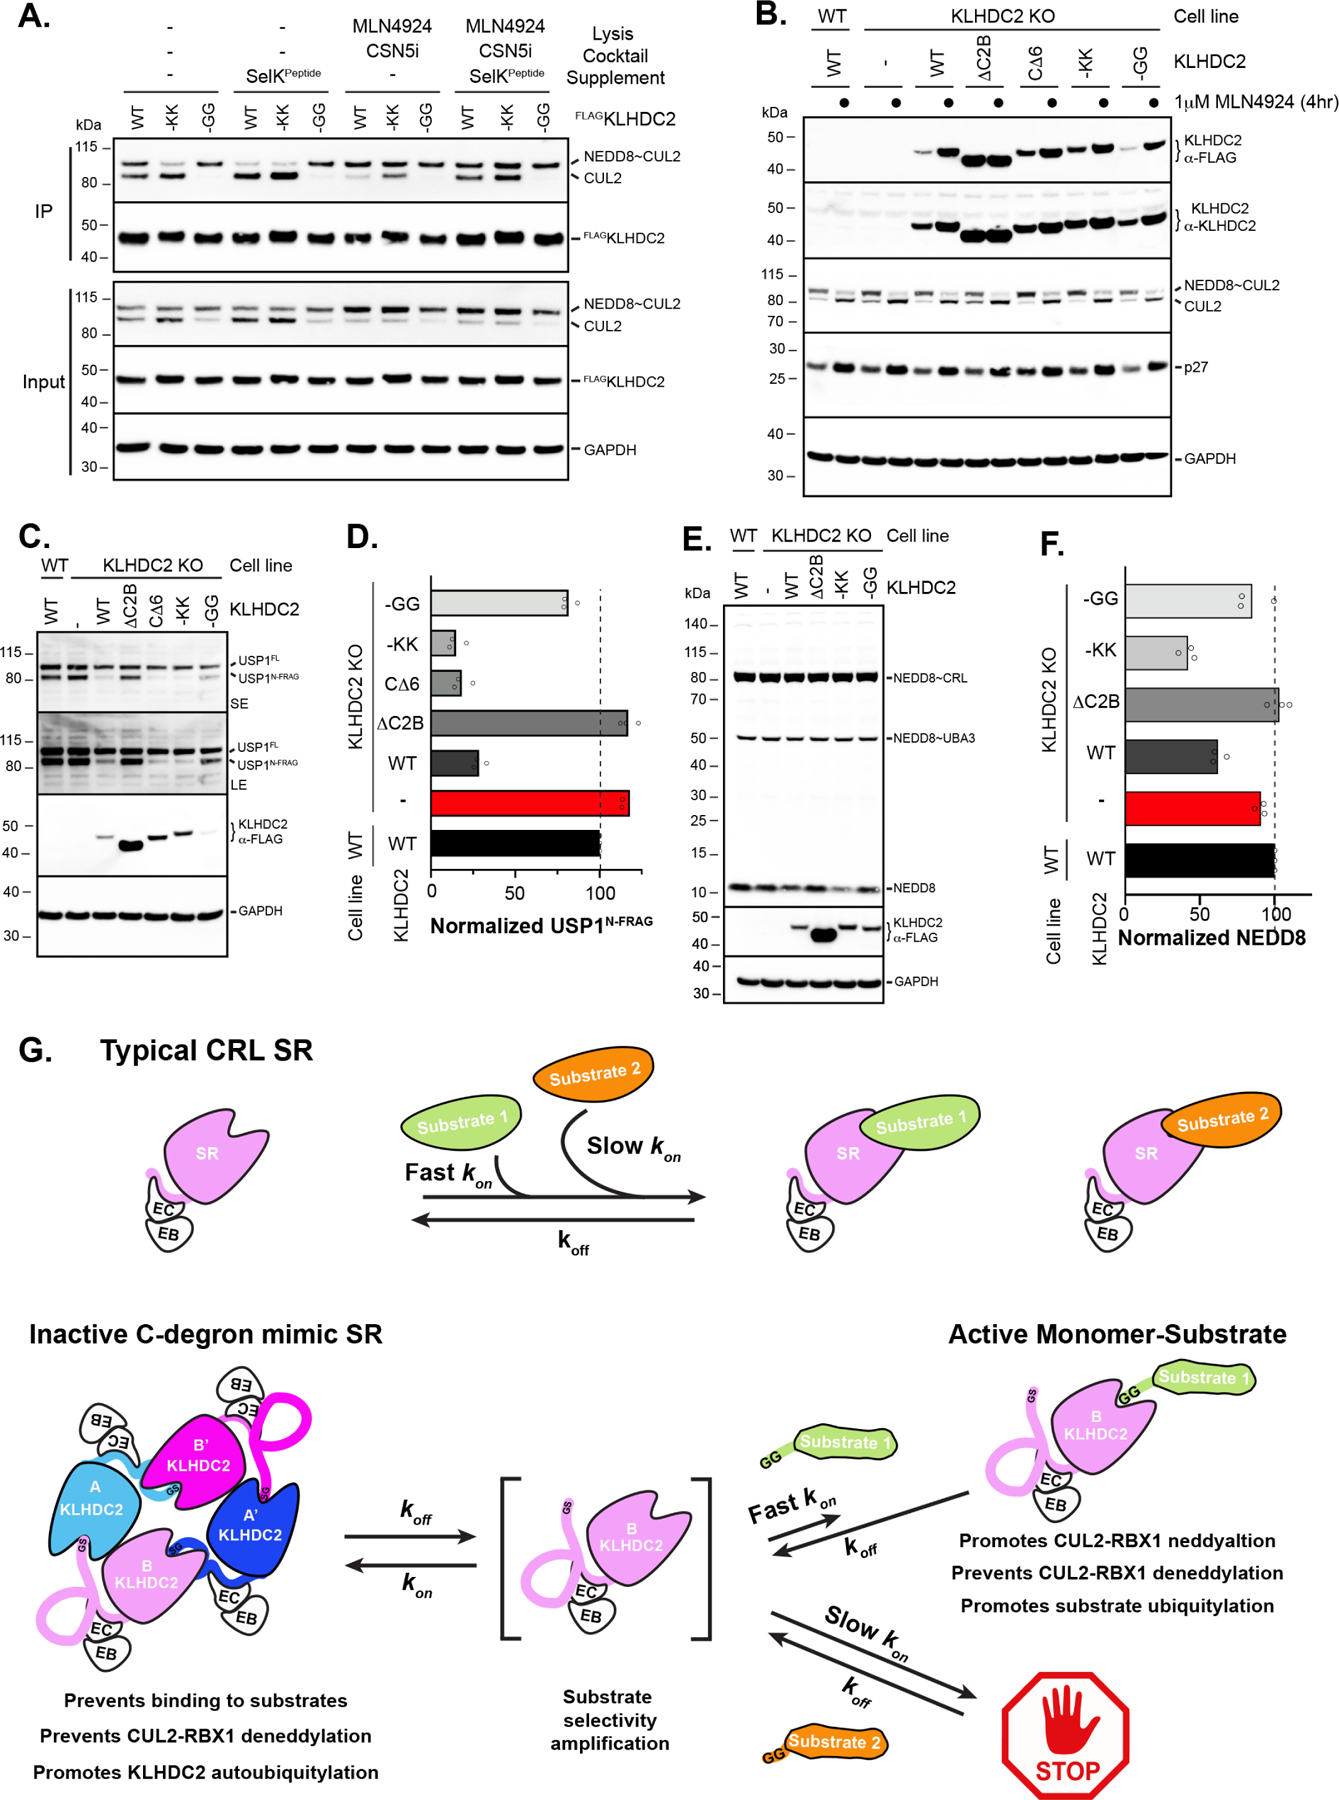
(a) HEK-293T cells were transiently transfected with constructs for FLAG-tagged WT or C-degron mutant KLHDC2. Immunoprecipitations were performed in the absence or presence of the indicated supplements followed by Western blotting. (b) Steady-state levels of proteins from WT U2OS cells, KLHDC2 knockout (KO), or KLHDC2 KO cells with ectopic expression of the indicated KLHDC2 proteins. (c) same as (b), monitoring the steady-state levels of the diGly C-terminal fragment of USP1. (d) Quantification of steady-state levels of UPS1 fragment from (c); (technical replicates are shown of n=3). (e) same as (b) but monitoring the steady-state levels of NEDD8. (f) same as (d) but for NEDD8. (g) Cartoon model for substrate selectivity amplification by the C-degron mimic KLHDC2-EloBC tetramer. Typical CRL SRs (top panel) poorly discriminate between bona fide substrates with fast association rates and “non-substrates” with slow association rates. In contrast, the C-degron mimic KLHDC2-EloBC tetramer (bottom panel) is unable to directly engage substrates. Substrates must “capture” the KLHDC2-EloBC monomer upon dissociation from tetramer. Thus, substrate selectivity is achieved by enabling SR-substrate complex formation for only substrates that have association rates that are sufficiently fast to capture monomer prior to tetramer reformation.
We also examined the effects of tetramerization mutants on KLHDC2 protein levels in U2OS cells. After CRISPR-mediated knockout of endogenous KLHDC2, stable cells lines were generated via lentiviral transduction of FLAG-tagged WT or mutant KLHDC2. While the endogenous expression levels of KLHDC2 in U2OS cells is low, such that the exogenous Flag-tagged WT KLHDC2 protein is expressed at roughly 10-fold higher, the amount of Flag-KLHDC2 matched endogenous levels seen in other cell lines such as PC-3 and HepG2 (Figure S8C). Notably, the normalized protein levels for the KLHDC2 variants differed, where both WT and -GG KLHDC2 protein levels were significantly lower than that of CΔ6 and -KK monomers. The ΔC2B KLHDC2 variant displayed the highest protein levels, presumably due to its failure to interact with CUL2 preventing auto-ubiquitylation. Consistent with this notion, treatment of the cell lines with MLN4924 stabilized both tetrameric and monomeric KLHDC2 variants to levels comparable to that of ΔC2B KLHDC2 (Figure 7B). Cell lines containing KLHDC2 variants were also treated with the proteasome inhibitor Bortezomib, followed by FLAG immunoprecipitation and detection of poly-ubiquitylated KLHDC2 by anti-K48 specific ubiquitin antibodies (Figure S8D). The KLHDC2 tetramer and stabilized -GG mutant was indeed more ubiquitylated than their monomeric counterparts, although surprisingly ΔC2B KLHDC2 was also ubiquitylated, presumably in a CUL2-independent manner as MLN4924 treatment fails to stabilize this mutant (Figure 7B). Taken together, the cellular data are consistent with the in vitro biochemical data indicating that C-degron mimicry-mediated tetramerization of KLHDC2 inhibits CSN-mediated deneddylation of CUL2 and promotes its auto-ubiquitylation.
Next, we tested the mutants for effects on substrate degradation. Steady-state levels of the USP1 N-fragment were marginally but consistently increased in the KLHDC2 knockout cell line, whereas full-length USP1 levels were unchanged (Figures 7C and 7D). Exogenous rescue of WT KLHDC2 resulted in ~4-fold reduction of USP1 N-fragment levels, whereas the levels were unchanged upon expression of ΔC2B KLHDC2 which neither tetramerizes nor binds CUL2. Importantly, expressing monomeric CΔ6 and -KK versions of KLHDC2 further reduced levels of USP1 N-fragment (Figures 7C and 7D). These results are consistent with the tetrameric assembly downregulating CRL2KLHDC2 activity.
Experiments with mutant cell lines also suggested that the KLHDC2 oligomeric assembly affects NEDD8 levels in cells. Unlike USP1, deletion of KLHDC2 in U2OS cells had no significant effect on NEDD8 protein levels, suggesting KLHDC2 levels are finely tuned such that NEDD8 is unperturbed by its presence in cells. However, ectopic expression of WT KLHDC2 reduced the levels of unconjugated NEDD8 (Figures 7E, and 7F). Expression of monomeric -KK KLHDC2 resulted in the further decrease of NEDD8 protein levels, whereas both -GG and ΔC2B KLHDC2 expression restored NEDD8 to levels observed in WT U2OS cells (Figures 7E and 7F). In summary, these results support the notion of a synergistic relationship between the capacity of KLHDC2 to form a C-degron mimic-mediated self-restrained tetramer and the absolute levels of both KLHDC2 and NEDD8 in cells.
DISCUSSION
Here we show that the C-degron-recognizing CRL2 substrate receptor KLHDC2 terminates with a sequence mimicking a C-degron. The C-degron mimic mediates E3 ligase self-assembly into an inactive homo-tetramer controlling the selection of protein substrates for ubiquitylation while protecting NEDD8, whose degron-like sequence paradoxically can bind the SBD with high affinity.
Regulation of C-degron recognition by KLHDC2 relies on the interconversion of an inactive KLHDC2-EloBC tetramer and an active monomeric form. The C-degron mimic, in combination with additional elements, stabilizes the tetramer by occupying the KLHDC2 SBD of an adjacent protomer. As such, KLHDC2-EloBC tetramers cannot engage C-degron substrates and require dissociation to the monomeric form for substrate binding. However, it seems that the equilibrium between these two species is controlled by both CUL2-RBX1 and substrate (Figures 4A, 4B, and 4C left panel), as well as the neddylation state of CUL2 (Figure 4C right panel). We propose that protein substrates ‘capture’ the monomeric KLHDC2-EloBC-CUL2-RBX1 complex (CRL2KLHDC2) preventing reformation of the tetramer. In this way, substrate-binding also activates the CRL-substrate complex, since a KLHDC2 surface mediating tetramerization becomes exposed and potentiates neddylation (Figures 6C and 6E). In the absence of substrate, the monomer is subjected to CSN-mediated deneddylation and inactivation (Figures 6B and 7A) while the tetramer is subject to auto-ubiquitylation (Figures 4F and 7B).
A defining feature emerging from this work is that KLHDC2 tetramerization introduces an additional barrier for substrate recruitment that includes the rates of tetramer formation and dissolution. The combination of the kinetics of tetramerization with the rate of substrate association results in a phenomenon known as kinetic amplification. Our model shares similar aspects with kinetic proofreading, a mechanism where non-substrates display increased rates of dissociation from enzyme relative to real substrates and are coupled to pseudo-irreversible energy consuming steps in the reaction scheme.51,52
Here specificity for CRL2KLHDC2 appears to be determined by the association rate of the substate relative to the rates that control the KLHDC2-EloBC tetramer-monomer equilibrium. Without the self-assembly/disassembly steps and kinetic amplification, non-substrates such as NEDD8 would eventually gain access to the ligase even with their slow on-rates (Figures 7G. S6A–D, and 5B). Thus, it seems that only substrates that associate with CRL2KLHDC2 monomers with kinetics more rapid than the rate of KLHDC2-EloBC tetramer formation become ubiquitylated. Non-physiological substrates like NEDD8 which associate more slowly with CRL2KLHDC2 than the rate of tetramer reformation miss their window for poly-ubiquitin chain formation due to KLHDC2 auto-ubiquitylation. The inclusion of a time barrier for substrate selection by CRL2KLHDC2, via auto-ubiquitylation, is like kinetic proofreading in that it will further amplify substrate selectivity beyond the differences in the association rates of substrates. While additional selection strategies may also contribute, such as an evolutionary pressure for non-substrates to lack Lys residues on their surfaces that may serve as aberrant acceptors of UB conjugation53,54, we propose that the KLHDC2-dependent molecular timer has an important role in protecting non-substrate proteins from degradation (Figures 7G and S8E).
For many CRLs, substrate binding also leads to CRL activation in cells. In these cases, the presence of substrates bound to CRLs controls neddylation, and thus E3 ligase activity, by virtue of sterically blocking CSN-mediated deneddylation.48,49,55 In support of this, we found that a bulky substrate (MBP-fused SELK) inhibits CRL2KLHDC2 deneddylation. However, the tetrameric KLHDC2-EloBC self-assembly also inhibits deneddylation. Thus, these two distinct E3 ligase assemblies mediate either substrate ubiquitylation or KLHDC2 auto-ubiquitylation.
With CRLs now firmly established as primary E3 ligases chosen for targeted protein degradation (TPD) efforts, we suggest that the TPD field consider the SR’s of the C-degron pathway as intriguing candidates for promoting TPD due to their well-defined substrate binding pockets.56 Consistent with this, KLHDC2 has recently been proposed as a binding site for the highly in vogue proteolysis targeting chimeric (PROTAC) drugs.57–59 Our insights into the regulation of KLHDC2 activity suggest that specific attention should be made to the association rates of KLHDC2 ligands to permit effective CRL2KLHDC2 monomer capture for target degradation. Finally, our finding that C-degron-mimic mediated self-assembly is conserved for the KLHDC2 paralog KLHDC3-EloBC suggests E3 self-association could be a robust and evolutionarily successful means for kinetic amplification of E3 ligase terminal degron substrate selection.
Limitations of the study
Given the number of potential KLHDC2 interacting partners of varying sizes in cells (>80 identified in Biogrid), we were unable to directly demonstrate the existence of free tetrameric KLHDC2-EloBC in cells, presumably due to a extensive range of size distributions of KLHDC2-containing molecular complexes. Instead, evidence of tetrameric assemblies comes from the expression of WT and mutant KLHDC2 variants and comparison of their effects on myriad CRL-dependent assays.
STAR★METHODS
RESOURCE AVAILABILITY
Lead contact
Further information and requests for reagents may be directed to and will be fulfilled by the lead contact Daniel Scott (Danny.Scott@stjude.org).
Materials availability
Reagents generated in this study are listed in key resources table and are available upon request.
KEY RESOURCES TABLE
| REAGENT or RESOURCE | SOURCE | IDENTIFIER |
|---|---|---|
| Antibodies | ||
| Mouse monoclonal anti-FLAG M2 antibody | Sigma | Cat# F3165;RRID:AB_259529 |
| Rabbit polyclonal anti-KLHDC2 antibody | Sigma | Cat# HPA000628; RRID:AB_266051 |
| Rabbit polyclonal anti-USP1 antibody | Bethyl laboratories | Cat# 301–699A; RRID:AB_1211376 |
| Mouse monoclonal anit-GAPDH | Santa Cruz | Cat# Sc-47724; RRID:AB_627678 |
| Rabbit polyclonal anti-CUL2 antibody | Abcam | Cat# ab166917; RRID:AB |
| Mouse monoclonal anti-p27 (Kip1) antibody | BD Transduction | Cat# 610242; RRID:AB_397637 |
| Rabbit polyclonal anti-NEDD8 antibody | Huang et. al.60 | N/A |
| Bacterial and virus strains | ||
| E. coli BL21 Gold (DE3) | Thermo Fisher | Cat# 50–125-348 |
| E. coli Rosetta 2 (DE3) | EMD Millipore | Cat# 71400 |
| Chemicals, peptides, and recombinant proteins | ||
| CSN5i | MedChem Express | Cat# Hy-112134; CAS:2375740–98-8 |
| HALT protease and phosphatase inhibitor cocktail | Thermo Fisher | Cat# 78441 |
| Fluorescein-5-Maleimide | Thermo Fisher | Cat# F150 |
| Alexa Fluor 674 Maleimide C2 | Thermo Fisher | Cat# A20347 |
| Alexa Fluor 488 carboxylic acid NHS ester | Thermo Fisher | Cat# A20000 |
| Hygromycin B | Thermo Fisher | Cat# 10687010 |
| Puromycin | Gibco | Cat# A11138–03 |
| Roche mini complete EDTA free | Roche | Cat# 11836170001 |
| 1,10-Phenanthroline | Sigma | Cat# 131377 |
| MLN4924 | EMD Millipore | Cat# 5054770001 |
| Avidin | Sigma | Cat# A8706 |
| Terbium-Streptavidin | Thermo Fisher | Cat# PV3966 |
| Sypro Ruby protein gel stain | Thermo Fisher | Cat# S12000 |
| COP9 Signalosome | Enzo LifeSciences | Cat# BML-PW9425–0020 |
| 3x FLAG Peptide | Sigma | Cat# F4799 |
| Deposited data | ||
| Gel Images | This Study | Mendeley Data: doi:10.17632/x5pbbkd6vf.1 |
| Cryo-EM map of KLHDC2-EloBC-CUL2-RBX1 | Electron microscopy Data Bank | EMD-16370 |
| Atomic model of KLHDC2-EloBC | Protein data bank | 8EBN |
| Atomic model of KLHDC2 SBD-EPHB2 peptide | Protein data bank | 8EBL |
| Atomic model of KLHDC2 SBD-KLHDC2 C-terminal peptide | Protein data bank | 8EBM |
| Experimental models: Cell lines | ||
| U2-OS | ATCC | ATCC# HTB-96; RRID:CVCL_0042 |
| HEK 293T | ATCC | ATTC# CRL-3216; RRID:CVCL_0063 |
| HepG2 | ATCC | ATCC# HB8065 |
| PC-3 | ATCC | ATCC# CRL-1435 |
| SK-BR-3 | ATCC | ATCC# HTB-30; RRID:CVCL_0033 |
| Sf9 Insect cells | Thermo Fisher | Cat# 11496015 |
| High Five Insect cells | Thermo Fisher | Cat# B85502 |
| Oligonucleotides | ||
| TrueGuide KLHDC2 sgRNA 5’ CTTCGAGAGCTATGAGTCCA |
Thermo Fisher | Cat# A35533;CRISPR988731_SGM |
| Recombinant DNA | ||
| pGEX4T1 GST-Thrombin-UBCH5B | Duda et al.42 | N/A |
| pGEX4T1 GST-Thrombin-UBC12 | Duda et al.42 | N/A |
| pGEX4T1 GST-Thrombin-APPBP1-UBA3 | Duda et al.42 | N/A |
| pGEX4T1 GST-Thrombin-NEDD8 (S>C) | Scott et al.50 | N/A |
| pGEX2TK GST-Thrombin-UB (S>C) | Scott et al.50 | N/A |
| pGEX2TK GST-Thrombin-UBK0 (S>C) | This Study | N/A |
| pGEX4T1 GST-TEV-CDC34B | Duda et al.42 | N/A |
| pLib | Weissman et al.61 | N/A |
| pBig1a | Weissman et al.61 | N/A |
| pCDNA5 FRT | Thermo Fisher | Cat# V601020 |
| pHAGE Dest | Gift from Wade Harper | N/A |
| pDONR223 | Gift from Wade Harper | N/A |
| pSPAX.2 | Addgene | Plasmid# 12260 |
| pMD2.G | Addgene | Plasmid# 12259 |
| pGEX4T1 GST-Thrombin-NEDD8 (S>C) Insert GS @72 | This Study | N/A |
| pGEX4T1 GST-Thrombin-NEDD8 (S>C) Insert GSGS @72 | This Study | N/A |
| pGEX4T1 GST-Thrombin-NEDD8 (S>C) Insert GSGSGS @72 | This Study | N/A |
| pRSF DUET His-MBP-TEV-KLHDC2 (15–361) | This Study | N/A |
| pRSF DUET His-MBP-TEV-Avi-KLHDC2 (15–361) | This Study | N/A |
| pGEX GST-TEV-SELK (43-C) | This Study | N/A |
| pGEX GST-TEV-USP1 (592–671) | This Study | N/A |
| pRSF DUET His-MBP-TEV-SELK (43-C) | This Study | N/A |
| pLib KLHDC2 | This Study | N/A |
| pLib KLHDC2 (∆CBCT) | This Study | N/A |
| pLib KLHDC2 (∆CT) | This Study | N/A |
| pLib KLHDC2 DMDM | This Study | N/A |
| pLib KLHDC2 DMCM | This Study | N/A |
| pLib KLHDC2 TE1 AAA | This Study | N/A |
| pLib KLHDC2 TE1 AKA | This Study | N/A |
| pLib KLHDC2 TE2 | This Study | N/A |
| pLib KLHDC2 SBM | This Study | N/A |
| pLib His-TEV-EloC (17-C) | This Study | N/A |
| pLib EloB (N-104) | This Study | N/A |
| pLib KLHDC3 | This Study | N/A |
| pLib KLHDC3 DMDM | This Study | N/A |
| pLib KLHDC3 DMCM | This Study | N/A |
| pLib KLHDC10 (41-C) | This Study | N/A |
| pLib RBX1 | This Study | N/A |
| pLib His-TEV-DAC-CUL2 | This Study | N/A |
| pBig1a Cass1-His-TEV-Eloc (17-C) Cass2-Eloc (N-104) Cas3-KLHDC2 | This Study | N/A |
| pBig1a Cass1-His-TEV-Eloc (17-C) Cass2-Eloc (N-104) Cas3-KLHDC2 (∆CBCT) | This Study | N/A |
| pBig1a Cass1-His-TEV-Eloc (17-C) Cass2-Eloc (N-104) Cas3-KLHDC2 (∆CT) | This Study | N/A |
| pBig1a Cass1-His-TEV-Eloc (17-C) Cass2-Eloc (N-104) Cas3-KLHDC2 DMDM | This Study | N/A |
| pBig1a Cass1-His-TEV-Eloc (17-C) Cass2-Eloc (N-104) Cas3-KLHDC2 DMCM | This Study | N/A |
| pBig1a Cass1-His-TEV-Eloc (17-C) Cass2-Eloc (N-104) Cas3-KLHDC2 TE1 AAA | This Study | N/A |
| pBig1a Cass1-His-TEV-Eloc (17-C) Cass2-Eloc (N-104) Cas3-KLHDC2 TE1 AKA | This Study | N/A |
| pBig1a Cass1-His-TEV-Eloc (17-C) Cass2-Eloc (N-104) Cas3-KLHDC2 TE2 | This Study | N/A |
| pBig1a Cass1-His-TEV-Eloc (17-C) Cass2-Eloc (N-104) Cas3-KLHDC2 SBM | This Study | N/A |
| pBig1a Cass1-His-TEV-Eloc (17-C) Cass2-Eloc (N-104) Cas3-KLHDC3 | This Study | N/A |
| pBig1a Cass1-His-TEV-Eloc (17-C) Cass2-Eloc (N-104) Cas3-KLHDC3 DMDM | This Study | N/A |
| pBig1a Cass1-His-TEV-Eloc (17-C) Cass2-Eloc (N-104) Cas3-KLHDC3 DMCM | This Study | N/A |
| pBig1a Cass1-His-TEV-Eloc (17-C) Cass2-Eloc (N-104) Cas3-KLHDC10 (41-C) | This Study | N/A |
| pBig1a Cass1-CUL1 Cass2-GST-TEV-Rbx1 | This Study | N/A |
| pBig1a Cass1-His-DAC-TEV-CUL1 Cass2-Rbx1 | This Study | N/A |
| pGEX4T1 GST-REV-GFP-RIC8B(C-terminal 23) | This Study | N/A |
| pCDNA5 FRT FLAG-KLHDC2 | This Study | N/A |
| pCDNA5 FRT FLAG-KLHDC2 (∆CBCT) | This Study | N/A |
| pCDNA5 FRT FLAG-KLHDC2 (∆CT) | This Study | N/A |
| pCDNA5 FRT FLAG-KLHDC2 DMDM | This Study | N/A |
| pCDNA5 FRT FLAG-KLHDC2 DMCM | This Study | N/A |
| pHAGE DEST FLAG-KLHDC2 | This Study | N/A |
| pHAGE DEST FLAG-KLHDC2 (∆CBCT) | This Study | N/A |
| pHAGE DEST FLAG-KLHDC2 (∆CT) | This Study | N/A |
| pHAGE DEST FLAG-KLHDC2 DMDM | This Study | N/A |
| pHAGE DEST FLAG-KLHDC2 DMCM | This Study | N/A |
| Software and algorithms | ||
| Prism | GraphPad | ver 5; RRID:SCR_002798 |
| R statistical package | www.rproject.org | ver 3.2.3 |
| Raw Gel Images | This Study | doi:10.17632/x5pbbkd6vf.1 |
| Other | ||
| DMEM, high glucose, pyruvate | Thermo Fisher | Cat# 11995–073 |
| McCoys 5A medium | ATCC | Cat# 30–2007 |
| EMEM medium | ATCC | Cat# 30–2003 |
| F-12K medium | ATCC | Cat# 30–2004 |
| HyClone Fetal Bovine Serum | Cytiva Life Sciences | Cat# SH30071.03HI |
| Lipofectamine 3000 | Invitrogen | Cat# L3000–015 |
| Gateway BP Clonase II | Invitrogen | Cat# 11789–020 |
| Gateway LR Clonase II | Invitrogen | Cat# 11791–020 |
| ExpiFectamine Sf | Gibco | Cat# A38915 |
| TrueCutCas9 Protein v2 | Invitrogen | Cat# A36498 |
| Lipofectamine CRISPRMAX Ca9 transfection reagent | Invitrogen | Cat# CMAX00001 |
Data and Code availability
Structural coordinates and electron density maps have been deposited in the Protein data bank and Electron microscopy data bank respectively and are publicly available as of the date of publication. Their accession codes are listed in the key resources table. Original gel images have been deposited at Mendeley and are publicly available as of the date of publication. The DOI is listed in the key resources table.
This study does not report original code.
Any additional information required to reanalyze the data reported in this paper is available from the lead contact upon request.
EXPERIMENTAL MODEL AND SUBJECT DETAILS
Cell lines
HEK293T Cells
Cells were maintained in DMEM (High glucose, L-glutamine, Pyruvate) with 10% fetal bovine serum.
U2OS and SK-BR-3 Cells
Cells were maintained in McCoys 5A supplemented with 10% fetal bovine serum at.
PC-3 Cells
Cells were maintained in F-12K supplemented with 10% fetal bovine serum at.
HepG2
Cells were maintained in EMEM supplemented with 10% fetal bovine serum at.
Cells were maintained at 37°C and 5 % CO2. All cell lines were routinely checked for mycoplasma contamination with LookOut mycoplasma PCR detection kit (Sigma).
METHOD DETAILS
Constructs
Expression constructs generated for this study were prepared by standard molecular biology techniques and coding sequences entirely verified. Mutant versions used in this study were generated by QuickChange (Stratagene). For expression of KLHDC2 B-propellor only domain, residues 15–361 of KLHDC2 were cloned into a pRSF DUET 6X His-MBP based vector to generate His-MBP-KLHDC2. For biotinylation of the B-propellor only domain, an AviTag sequence (GSMSGLNDIFEAQKIEWHEGS) and flanking GlySer linkers between the TEV cleavage site and KLHDC2 B-propellor ORF were inserted into the pRSF DUET based MBP-TEV-KLHDC2 vector. For SPR experiments a N-terminal 10X Histidine tag was placed on the KLHDC2 B-propellor only domain by PCR and cloned into a pRSF DUET based vector. For expression of SELK and USP1 we cloned fragments, residues 43-C and residues 592–671 respectively, into a pGEX-TEV based vector. To express a GFP-RIC8B fusion protein we appended the C-terminal 23 amino-acids of RIC8B to the C-terminus of GFP by PCR and cloned this fragment into a pGEX-TEV based vector. Clones for insect cell expression of full-length KLHDC2-EloB/C, mutant variants therof, full-length KLHDC3-EloB/C, or KLHDC10-EloB/C were first cloned into pLib via Gibson assembly. Cassettes were then generated via PCR as described (Weissman) and Gibson assembled into pBig1a to generate a single vector for co-expression of all components. Proper assembly into pBig1a was confirmed by PmeI and SwaI restriction digestion. To generate clones for transient transfection into 293T cells, a N-terminal FLAG tag was added by PCR to KLHDC2, or mutants, using the pLib vectors as templates and cloned into a pCDNA5 FRT based vector. For production of lentiviral particles to rescue KLHDC2 knockout in U2OS cells, we first clone FLAG-KLHDC2 variants into pDONR223 BP clonase gateway cloning and subsequently transferred to pHAGE DEST vector via LR clonase.
Protein expression and purification
UBE2D2, UBE2M, UBE2R2, ARIH1, the NEDD8 E1 APPBP1-UBA3, and GFP-RIC8B (C-terminal 23 residues) were expressed in E. coli BL21 Gold (DE3) cells as GST fusion proteins. Fusion proteins were purified from cell lysates by glutathione affinity chromatography and liberated from GST by thrombin or TEV cleavage overnight at 4 °C. Cleavage reactions were further purified by ion-exchange and size exclusion chromatography in 25mM HEPES, 200mM NaCl, 1mM DTT pH = 7.5 (Buffer A). NEDD8, UB, SELK (residues 43-C), and USP1 (residues 592–671), (residues 5–73) were expressed in E. coli BL21 Gold (DE3) cells as GST-fusion proteins. Fusion proteins were purified from cell lysates by glutathione affinity chromatography and liberated from GST by thrombin or TEV cleavage during extensive dialysis overnight in Buffer A at 4 °C. Cleavage reactions were passed back over a glutathione affinity resin to remove free GST and any remaining uncleaved GST-fusion protein. Protein collected in the flow fraction was concentrated with an Amicon Ultra filtration unit and further purified by size exclusion chromatography in Buffer A.
KLHDC2 b-propellor fold only domain (15–361), its Avi-tagged counterpart were, expressed in E. coli Rosetta2 cells, grown in Terrific broth, with a N-terminal 6XHis-MBP-TEV tag.Tagged protein was purified from cell lysates by Ni affinity chromatography. Bound proteins were eluted from the Ni resin with 250mM Immidazole. The 6XHis-MBP tag was liberated by cleavage with TEV overnight at 4 °C. Cleavage products were further purified by ion-exchange and size exclusion chromatography in Buffer A. KLHDC2s b-propellor fold only domain harboring a N-terminal 10X Histidine tag was expressed and purified as described above for the His-MBP verions.
Full-length CUL1-RBX1 full-length was expressed in insect cells as GST-TEV fusion proteins. Fusion proteins were purified from cell lysates by glutathione affinity chromatography and GST liberated by TEV cleavage overnight at 4 C. Cleavage reactions were further purified by ion exchange and size exclusion chromatography in Buffer A.
Full length KLHDC2-EloB/C, KLHDC3-EloB/C, KLHDC10-EloB/C and mutant variants therof wer expressed in insect cells with a N-terminal 6XHis tag on EloC. Tagged proteins were purified from cell lysates by Ni affinity chromatography and further purified by ion exchange and size exclusion chromatography in Buffer A.
Neddylation and purification of CUL2–RBX1, were prepared as described previously for CUL1-RBX1 50. Briefly, the final concentrations of components in the neddylation reactions were as follows: 12μM CUL2-RBX1, 1μM UBE2M, 0.1μM APPBP1-UBA3, and 20μM NEDD8 in 25mM HEPES, 200mM NaCl, 10mM MgCl2, 1mM ATP, pH = 7.5. Reactions were initiated at room temperature by the addition of NEDD8 and incubated for ten minutes prior to quenching by the addition of DTT to 10mM. Quenched reactions were spun at 13K rpm for 10 minutes and immediately applied to a Superdex SD200 column to purify NEDD8-CUL2-RBX away from reaction components.
Protein Modifications
Reaction conditions for biotinylation of Avi-KLHDC2 b-propellor fold only were initially established in small scale pilot experiments and the efficiency of Avi-KLHDC2 biotinylation was assessed by super shift of biotin-KLHDC2 in SDS-PAGE after the addition of a stoichiometric excess of avidin (Sigma Aldrich A9275). Biotinylation reactions contained 50 μM Avi-KLHDC2 and 1.5 μM BIRA in 10 mM Tris, 10 mM ATP, 10 mM magnesium acetate, 2 mM Biotin, pH 8.0 and were incubated at room temperature for 1 hours and continued overnight at 4C. The reaction mixture was diluted four-fold into 25 mM Tris, 1 mM DTT, pH 8.0 and purified over a HiTrap Q ion-exchange column. Fractions containing biotin-KLHDC2 were pooled, concentrated, and further purified by size exclusion chromatography in 25 mM HEPES, 200 mM NaCl, 1 mM DTT, pH 7.5.
Reaction conditions for the sortase mediated protein ligation of fluorescent peptides were initially established in small scale pilot experiments with the efficiency of labeling determined by fluorescent scanning of gels. Reactions to label the amino-terminus of SELK and USP1 with fluorescein contained 50 μM SELK or USP1, 2uM sortase, 200μM FAM-(PEG)5-LPETGG peptide in 50 mM Tris, 150 mM NaCl, 10 mM CaCl2. After a thirty-minute incubation samples were buffer exchanged over a NAP-5 column into 25 mM HEPES, 200 mM NaCl, 1 mM DTT, pH 7.5 (Buffer A) to remove unconjugated fluorescent peptide. Samples were concentrated and further purified over a Superdex SD75 sizing column in Buffer A. To label the amino-terminus of CUL2 with TAMRA reactions contained 25μM CUL2-RBX1, 1uM sortase, 150μM FAM-(PEG)5-LPETGG peptide in 50 mM Tris, 150 mM NaCl, 10 mM CaCl2. After two-hour incubation samples were buffer exchanged over a NAP-5 column into Buffer A to remove unconjugated fluorescent peptide. Samples were concentrated and further purified over a Superdex SD200 sizing column in Buffer A. Extent of labeling was calculated through the ratio of protein concentration by absorbance at 280 nm to the concentration of fluorescent probe. In all cases labeling was estimated to be >85%.
To introduce a cysteine for fluorescent labeling of NEDD8, UB and K0UB we mutated the protein kinase a site in the pGEX2TK backbone converting the PKA site from RRASV to RRACV (Scott et al., 2014). NEDD8, UB or UBK0 purified from this expression construct were labeled with Fluorescein-5-Maleimide , AlexaFluor 488 Maleimide, or Fluorescein-5-Maleimide respectively as previously described (Scott et al., 2014). Briefly, DTT was added to UB or UBK0 at a final concentration of 10mM and incubated on ice for 20 minutes to completely reduce cysteines for labeling. DTT was removed by buffer exchange over a NAP-5 column (GE Healthcare) in labeling buffer (25mM HEPES, 200mM NaCl). Labeling reactions consisted of UB or UBK0 at 150μM final concentration and were initiated by the addition of 600μM Fluorescein-5-Maleimide or Tetramethylrhodamine-5-Maleimide (4X excess over labeling target and <5% final DMSO concentration). Reactions were incubated at room temperature for 2 hours and quenched by the addition of DTT to 10mM. Quenched reactions were desalted over a PD-10 column in labeling buffer containing 1mM DTT to remove unreacted probe. Desalted protein was concentrated in an Amicon Ultra filtration unit and further purified over a Sephadex SD75 column.
Cell biological experiments
To monitor the existence of the C-degron mimic KLHDC2-EloB/C tetrameric assembly of cells we took advantage of the knowledge that the COP9 signalosome remains active and can deneddylated NEDD8~CUL in non-denaturing lysates. We transfected 293T cells with Lipofectamine 3000 per the manufacture’s recommendations with the indicated pDCNA5-FRT based vectors. Forty-eight hours later, cells were harvested and lysed in 50 mM Tris, 150 mM NaCl, 0.5% NP-50, 1X HALT protease and phosphatase inhibitor cocktail, 250 U universal nuclease, pH 7.5 with or without the addition of 10 μM CSN5i, 10 μM MLN4924, and/or 100 μM SELKPeptide. Cells were lysed for 5 minutes on ice with repeated pipetting, spun at 14,000 rpm for 5 minutes to remove cell debris, and the supernatant subjected to a rapid FLAG immunoprecipitation (15 minutes). FLAG resin was washed four times with lysis buffer and proteins eluted with 2X SDS-PAGE sample buffer. Elution’s were separated on 4–12 % Bis-Tris gels, transferred to PVDF membranes, and probed with the indicated antibodies. Western blots were developed with SuperSignal West Pico Plus substrate and chemiluminescent signal read on an ImageQuant LAS4000.
The KLHDC2 knockout cell line was generated by transfecting a mixture of KLHDC2 directed TrueGuide sgRNA (ThermoFisher, CRISPR988733_SGM, TGATGGCAACGAGGATCTGC) and TrueCut Cas9 protein v2 with Lipofectamine CRISPRMAX transfection reagent according to the manufacture’s recommendations. Forty-eight hours later cells were harvested and single sorted into 96-well plates. Plates were monitored over the course of ~3 weeks for single cell growth and expansion. Individual clones were subjected to Next Gen sequencing to identify correct knockouts. Stable cells lines for re-expressing FLAG-tagged WT or mutant KLHDC2 variants were obtained by lentiviral transduction of the KLHDC2 knockout line with lentivirus generated from pHAGE DEST vectors. Forty-eight hours after transduction cells were selected in complete media supplemented with 3 μg/ml puromycin for two weeks.
Samples for western blots were prepared by resuspension of cell pellets in lysis buffer consisting of 50 mM Tris, 150 mM NaCl, 0.5% NP-50, 6 M Urea, 10 mM Iodoacetamide, 0.1 % SDS, 1X HALT protease and phosphatase inhibitor cocktail, 250 U universal nuclease, pH 7.5. Samples were lysed on ice for 20 minutes and cellular debris cleared by a 10-minute spin at 14,000 rpm. The protein concentration of supernatants were determined by BCA protein assay. Equivalent total amounts of protein lysate were mixed with 2X SDS-PAGE sample buffer, were separated on 4–12 % Bis-Tris gels, transferred to PVDF membranes, and probed with the indicated antibodies. Western blots were developed with SuperSignal West Pico Plus substrate and chemiluminescent signal read on an ImageQuant LAS4000.
To immunoprecipiate UB conjugated variants of KLHDC2, the indicated U2OS WT, knockout, or KLHDC2 rescue lines were treated with bortezomib for (1 μM) for five hours. Cell pellets were harvested and lysed by resuspension in 50 mM Tris, 150 mM NaCl, 0.5% NP-50, 10 mM Iodoacetamide, 1X HALT protease and phosphatase inhibitor cocktail, 250 U universal nuclease, pH 7.5. Cells were lysed on ice for 20 minutes and cellular debris cleared by a 10-minute spin at 14,000 rpm. Supernatants were subjected to FLAG immunoprecipitation for 2 hours, washed four times with lysis buffer, and eluted with 2X SDS-PAGE sample buffer. Elutions were separated on 4–12 % Bis-Tris gels, transferred to PVDF membranes, and probed with the indicated antibodies. Western blots were developed with SuperSignal West Pico Plus substrate and chemiluminescent signal read on an ImageQuant LAS4000.
TR-FRET Assay
TR-FRET assays were carried out in black 384-well microtiter plates at a final volume of 20 μL per well. An assay cocktail was prepared as a mixture of 55.5 nM Biotin-KLHDC2 SBD, 22.2 nM AlexaFluor488-RIC8B peptide, 2.77 nM Tb-Streptavidin (ThermoFisher) in assay buffer (25 mM HEPES, 100 mM NaCl, 0.1% Triton X-100, 0.5 mM DTT, pH 7.5). The assay cocktail was incubated for thirty-minutes at room temperature and 18μl distributed to assay plates. Appropriate dilutions of SELK, USP1, NEDD8, NEDD8 G76D, UB, or buffer (2μl) were added to assay plates. The assay mixture was incubated for 1 hour at room temperature prior to measuring the TR-FRET signal with a PHERAstar FS plate reader (BMG Labtech) equipped with modules for excitation at 337 nm and emissions at 490 and 520 nm. The integration start was set to 100 μs and the integration time to 200 μs. The number of flashes was fixed at 100. The ratio of 520/490 was used as TR-FRET signal in calculations. Assay endpoints were normalized to 100% (buffer only) and used for curve fitting in Prisim. Data curves in Figures 1b are fits to the average of n=3 independent experiments.
Crystallography
For the structure of KLHDC2’s SBD bound to a diGly consensus peptide from EPHB2, KLHDC2 (250μM final concentration) was mixed with a 1.5 fold excess of peptide, and incubated on ice for 1 hour to equilibrate binding prior to setting crystal trays. Crystals grew at room temperature in 10–15% PEG3350, 0.2M NaSCN, 0.1 M Bis-Tris Propane, pH = 7.5. Crystals were harvested in mother liquor supplemented with 25% Glycerol prior to flash-freezing in liquid nitrogen. Reflection data were collected at Sercat 24-ID at the Advanced Photon Source. The crystals belong to space group P21 with two KLHDC2-peptide complexes in the asymmetric unit. Phases were obtained by molecular replacement using PHASER60 searching for two copies of KLHDC2 (with peptide omitted) from 6DO2.pdb. Manual building was performed in COOT and refinement was performed using Phenix61. Additional details of the refinement are provided in Table 1.
Mixtures for crystals trays of the structure of KLHDC2’s SBD bound to a 12mer peptide derived from the C-terminus of KLHDC2 were prepared as described above. Crystals grew at 4 C in 8–12% PEG3350, 0.2M NaSCN, 0.1 M Bis-Tris Propane, 5 nM Hexamine cobalt (III) chloride, pH = 7.5. Crystals were harvested in mother liquor supplemented with 25% MPD prior to flash-freezing in liquid nitrogen. Reflection data were collected at NECAT 24-ID-E at the Advanced Photon Source. The crystals belong to space group P21 with two KLHDC2-peptide complexes in the asymmetric unit. Phases were obtained by molecular replacement using PHASER60 searching for two copies of KLHDC2 (with peptide omitted) from 6DO2.pdb. Manual building was performed in COOT and refinement was performed using Phenix61. Additional details of the refinement are provided in Table 1.
Crystals of the full-length KLHDC2-EloB/C (10 mg/ml) complex initially grew in 11–14% PEG3350, 0.2 M KSCN, 0.1 M Tris, pH =6.8 but diffracted poorly >10A. We noticed that diffraction substantially improved (~5–6A) upon cryopreservation of the crystals in mother liquor supplemented with 25% MPD. Ultimately, diffraction quality crystals were grown by streak seeding into 9% PEG3350, 0.2 M KSCN, 0.1 M Tris, 0.1M Na/K Tartrate, 2.5% MPD, pH =6.8. Crystals were harvested in mother liquor supplemented with 25% MPD prior to flash-freezing in liquid nitrogen. Reflection data were collected at NECAT 24-ID-C at the Advanced Photon Source. The crystals belong to space group P3112 with two KLHDC2-Elo/B complexes in the asymmetric unit. Phases were obtained by molecular replacement using PHASER60 with (1) two copies of KLHDC2 (with peptide omitted) from 6DO2.pdb (2) Two copies of EloB/C from 1VCB.pdb. Manual building was performed in COOT and refinement was performed using Phenix61. Additional details of the refinement are provided in Table 1. The final Ramachandran statistics are as follows: 99% Favored, 0%.
Biochemical Assays
The use of pulse-chase assays allowed comparing the paths of UB transfer starting from either UBE2D2 or UBE2R2. First, the indicated E2 was pulse-labeled by incubating a mixture of UBA1 (0.3 μM), E2 (10 μM), and *UB (15 μM) in 25 mM HEPES, 100 mM NaCl, 100mM MgCl2, ATP (2 mM), pH 7.5 at room temperature for 13 minutes. Pulse-loading reactions were quenched by the addition of EDTA to 50 mM and incubated on ice for 5 minutes. Chase reactions consisted of mixing the E2~*UB thioester conjugate (0.3 μM final concentration) with the indicated pre-equilibrated NEDD8~CUL2-RBX1-SR complexes (0.3 μM final concentration) in 25 mM HEPES, 100 mM NaCl, 50 mM EDTA, 0.5 mg/ml BSA, pH 7.5 at room temperature. Where indicated test substrates were pre-incubated (0.6 μM final concentration) with NEDD8~CUL2-RBX1-SR complexes for the indicated times prior to initiating reactions by the addition of E2~*UB. Reactions were quenched at the indicated times with 2X SDS-PAGE sample buffer and separated on 4–12% Bis-Tris gradient gels, scanned for fluorescence on a Typhoon imager.
Neddylation of CUL2-RBX1 was also monitored by pulse-chase assays. First, UBE2M was pulse-labeled by incubating a mixture of APPBP1/UBA3 (0.3 μM), UBE2M (10 μM), and *NEDD8 (15 μM) in 25 mM HEPES, 100 mM NaCl, 100mM MgCl2, ATP (2 mM), pH 7.5 at room temperature for 13 minutes. Pulse-loading reactions were quenched by the addition of EDTA to 50 mM and incubated on ice for 5 minutes. Chase reactions consisted of mixing the UBE2M~*UB thioester conjugate (75 nM final concentration) with CUL2-RBX1 (100 nM final concentration) pre-equilibrated with the indicated fold excess of SR complexes with or without the indicated fold excess of diGly substrate in 25 mM HEPES, 100 mM NaCl, 50 mM EDTA, 0.5 mg/ml BSA, pH 7.5 at room temperature. Reactions monitoring the displacement of CAND1 were performed as described above, except CUL2-RBX1 (100 nM final concentration) was pre-equilibrated with equimolar CAND1, prior to initiating neddylation reactions by the simultaneous addition of UBE2M~*NEDD8 and the indicated fold excess of SR with or without the indicated fold excess diGly substrate. Reactions were quenched at the indicated times with 2X SDS-PAGE sample buffer and separated on 4–12% Bis-Tris gradient gels, scanned for fluorescence on a Typhoon imager
Assays monitoring deneddylation of NEDD8~CUL2-RBX1 entailed pre-equilibration of equimolar NEDD8~CUL2-RBX1 with the indicated SRs (200 nM final concentration) with or without five-fold excess of test diGly peptide, or protein substrate. Reactions were initiated by the addition of COP9 signalosome to 2 nM final concentration. Aliquots were quenched with 2X SDS-PAGE sample buffer at the indicated times, separated on 4–12% Bis-Tris gradient gels, transferred to PVDF membranes, and subjected to western blot with α-CUL2 antibodies. Western blots were developed with SuperSignal West Pico Plus substrate and chemiluminescent signal read on an ImageQuant LAS4000.
Time-course reactions
Reactions were pre-assembled into two separate mixtures with proteins diluted into reaction buffer containing 30 mM Tris-HCl (pH 7.5), 100 mM NaCl, 5 mM MgCl2, 2 mM DTT and 2 mM ATP. CRL components and 32P-labeled substrate protein were sequentially added (tube 1) and incubated for 5, 10, 20, 40 and 60 minutes. Meanwhile, E1, ubiquitin and UBE2R2 proteins were sequentially added and incubated for a period of approximately 15 minutes (tubes 2). Ubiquitylation reactions were initiated by mixing equal volumes of tube 2 mix with the tube 1 incubations and time points were collected at 10-second and 5-minute intervals. Reactions were quenched in reducing 2X SDS-PAGE loading buffer (100 mM Tris-HCl (pH 6.8), 20% glycerol, 30 mM EDTA, 4% SDS and 4% beta-mercaptoethanol). Each reaction was performed in triplicate and was resolved on 18% polyacrylamide SDS-PAGE gels. Autoradiography was performed using an Amersham Typhoon 5 imager and quantification performed with ImageQuant software (Cytiva). The fraction of substrate ubiquitylated was calculated as the fraction of products over the total signal of each respective lane.
Pre-steady state quench flow kinetics
Reactions were pre-assembled into two separate mixtures with proteins diluted into reaction buffer as described in the previous section. CRL components and 32P-labeled substrate protein were sequentially added (tube 1) and incubated for an hour. Afterwards, E1, ubiquitin and UBE2R2 proteins were sequentially added and incubated for a further 15 minutes (tubes 2). Each mix was loaded into separate sample loops on a KinTek RQF-3 Quench-Flow instrument. Reactions were initiated by bringing the two mixes together in drive buffer (30 mM Tris-HCl (pH 7.5) and 100 mM NaCl), and then quenched at various time points in reducing 2X SDS-PAGE loading buffer. Each reaction was performed in triplicate, and time points were resolved on 18% polyacrylamide SDS-PAGE gels and processed as described above. The rates of ubiquitin transfer were determined by fitting to analytical closed-form solutions (Pierce et al., 2009) using Mathematica.
| Experimental conditions for ubiquitylation reactions | ||||||
| Experiment | [CUL2 KLHDC2 ] (μM) | [ 32 P-labeled substrate] (μM) |
[E1]
(μM) |
[Ub]
(μM) |
[UBE2R2] (μM) | [unlabeled substrate] (μM) |
| 0.25 | 0.25 | 0.25 | 10 | 5 | N/A | |
Analytical size exclusion chromatography
The distribution of KLHDC2-EloB/C species in the absence or presence of substate was monitored through migration over size exclusion chromatography. KLHDC2-EloB/C (6 μM final) was mixed with MBP-SelK (12 μM final) in 25 mM HEPES, 150 mM NaCl, 1 mM DTT, pH = 7.5 and incubated for the indicated times on ice. Mixtures were spun in a microfuge for 5 minutes and immediately applied to a Superdex SD200 column equilibrated in the same buffer. Fraction aliquots were removed and mixed with an equal volume of 2X SDS sample buffer and separated through 4–12% Bis-Tris gels. Gels were stained with Sypro Ruby according to the manufactures instructions and scanned on a Typhoon imager.
Native gel electrophoresis
Native gel electrophoresis was used monitor the migration of KLHDC2-EloB/C species in the absence or presence of substate with or without CUL2 or N8~CUL2. Briefly, 2.5 μM KLHDC2, in the absence or presence of 2.5 μM TAMRA labeled CUL2 or N8~CUL2, was mixed with the indicated concentrations of Fluorescein labeled SELK or USP1 in 25 mM HEPES, 150 mM NaCl, 5 % glycerol, 1 mM DTT, pH =7.5. Mixtures were allowed to equilibrate on ide for the indicated times and immediately loaded onto a 4–20% Tris-Glycine gel. Samples were separated at 130V for 180 minutes at 4 C. We note that, as we have no way of quenching binding reactions, continued binding and dissociation between protein complexes can occur during the 180 minute time period in which the gel is running.
Fluorescence-detected sedimentation velocity analytical ultracentrifugation (FDS-SV-AUC)
Sedimentation velocity analytical ultracentrifugation (SV-AUC) experiments were conducted in a ProteomeLab XL-I analytical ultracentrifuge (Beckman Coulter, Indianapolis, IN) with the fluorescence detective system (AVIV Biomedical) following standard protocols unless mentioned otherwise.62,63 All samples were prepared in a buffer containing 25 mM HEPES pH 7.5, 200 mM NaCl, 1 mM DTT at 20 C. AF488-DC2 and AF488-DC3 samples were loaded into cell assemblies comprised of double sector charcoal-filled centerpieces with a 12 mm path length and quartz windows. Buffer density and viscosity were determined in a DMA 5000 M density meter and an AMVn automated micro-viscometer (both Anton Paar, Inc., Ashland, VA) respectively. A dilution series of 5,000, 800, 170, 30, 5 & 0.5 nM were examined. In order to avoid surface adsorption of AF488-DC2 and AF488-DC3 0.1 mg/mL bovine serum albumin (BSA) was added in all protein samples as a carrier protein. The cell assemblies, containing sample volumes of approximately 390 μL, were placed in a rotor. For the FDS-SV experiments radial calibration and the set-up of focusing depth and PMT voltage were performed at 3,000 rpm. The focal depth was set at 4.696 mm, and, in order to obtain sufficient fluorescent signal for the samples with different concentrations of the fluorescent labelled protein a range of PMT settings were used (40% and gain 8 for 5 and 0.5 nM and 40 % and gain 1 for 5,000 nM). Then temperature equilibrium was carried out at rest at 20 °C for 2 hours followed by acceleration from 0 to 45,000 rpm. Fluorescence scans were collected continuously for 12 hours. The velocity data were modeled with diffusion-deconvoluted sedimentation coefficient distributions c(s) in SEDFIT (https://sedfitsedphat.nibib.nih.gov/software), using algebraic noise decomposition and with signal-average frictional ratio and meniscus position refined with non-linear regression.64 The s-values were corrected for time and finite acceleration of the rotor was accounted for in the evaluation of Lamm equation solutions. Maximum entropy regularization was applied at a confidence level of P-0.68.
The FDS sedimentation velocity data were subjected to standard c(s) analysis in SEDFIT as described above.64 Isotherm data were obtained by the integration between 3 and 12 S of these c(s) distributions at concentrations of 800, 170, 30, 5 and 0.5 nM to generate signal weight-average sedimentation coefficient values, sw (or expressed as sw(c)) for the isotherm analysis. Again the 2 S peak was excluded from the analysis because the mass was smaller than the monomer mass of AF488-DC2/DC3 and thus not part of the self-association process. It is possibly a breakdown product or contaminant protein. The resulting sw isotherm was then loaded into SEDPHAT (https://sedfitsedphat.nibib.nih.gov/software) and fitted with the monomer-dimer-tetramer self‐ association model.62 The peaks centered at ∼4 and ∼10 S are the monomer and tetramer species, respectively. The association scheme used in this analysis was A + A ↔ [A2] + [A2] ↔ [A4] with A the AF488-DC2 and AF488-DC3 monomer (MW = 72,990 and 69,977 Da) and K12 the equilibrium association constant of the first step and K24 the second step.62 Since K = 1/Kd these association constants are expressed as dissociation constants Kd12, Kd14 and Kd24 and were determined by nonlinear regression analysis of the sw isotherms. Kd12 and Kd14 as well as s1, s2 and s4 were optimized in the fit, and the error intervals of the best-fit Kd14 values were determined using error surface projection at a 68.3 % confidence level.65
All plots were created in GUSSI (http://www.utsouthwestern.edu/labs/mbr/software/).66
Surface Plasmon Resonance
Surface plasmon resonance (SPR) was utilized to determine kinetic parameters and binding affinity of KLHDC2 substrates using a PioneerFE (Sartorius). Experiments were carried out in 20 mM Tris, 200 mM NaCl, 1 mM TCEP, 0.01% Brij35, 1% DMSO, at pH 7.4 as a running buffer with a flow rate of 100 μL/min at 20°C. WT Nedd8 was tested at a slower flow rate (50 μL/min) due to slow association kinetics. 10xHis-KLHDC2 was diluted in running buffer and immobilized onto a Ni-NTA-coated biosensor chip (HisCap). The chip surface was conditioned using 10 mM HCl, 50 mM NaOH, and 0.1% SDS, (50 μL at 100 μL/min) twice followed by a 100 mM Tris buffer wash (100 μL at 100 μL/min). The surface was then activated using an injection of 0.5M EDTA (125μL at 25 μL/min) followed by an injection of 5 mM NiCl2 (125 μL at 25 μL/min). Protein was then immobilized onto channel 3 around 300 RU for most analytes, around 1500 RU for SelK and WT Nedd8, and around 2200 RU for the weak-binding substrates. Channel 2 was treated identically to channel 3 with the exception of protein loading to be used as a reference channel. Protein analytes were diluted to their designated concentrations in the running buffer and injected using the OneStep® injection method on the Pioneer system which utilizes Taylor dispersion to obtain binding kinetics data from a single injection. 100% of the loop was injected with a 300 s dissociation time. All samples were run in triplicate. Data was analyzed using Qdat software and fit to a simple 1-site model.
Cryo-EM sample preparation and microscopy
The protein complex of CUL2-RBX1-EloB-EloC-KLHDC2 was prepared at 1.7mg/ml in 25mM HEPES, 150mM NaCl, 1mM DTT, pH 7.5. Sample was vitrified by applying 3.5μL of the protein complex onto Quantifoil R1.2/1.3 holey carbon grids and immediately plunge frozen into liquid ethane with a Vitrobot Mark IV. Dataset was collected on a 200kV Glacios equipped with a K2 Summit direct detector. 2609 movies were gained on counting mode at a nominal magnification of 22kx with a 1.885Å/pixel. 60 e-/Å2 were fractionated over 40 frames, using a defocal range of - 1.5μm ~ −3.0μm.
Cryo-EM data processing
Collected movies were motion-corrected using RELION-3.167, and CTF estimated by CTFFIND-4.168 and particles were picked using Gautomatch-0.56 (K. Zhang, MRC Laboratory of Molecular Biology, Cambridge). Picked particles were subject to several rounds of 2D classification, followed by 3D classification and 3D refinement. While the 3D reconstruction covered all angular distributions, it contained a significant number of particles with one particular view. The dominant view was downsized by removing views with iterative 2D classification without performing alignment and 3D refinement. Final reconstruction yielded a 8.2Å map with a more homogeneous reconstruction. Processing schematic is shown in Fig. S4.
Size Exclusion chromatography multi-angle light scattering (SEC-MALS)
SEC-MALS experiments were carried out using WTC-030S5 (MW range 5000–1, 250,000 Da) size-exclusion column (Wyatt Technologies, Santa Barbara, CA, USA) with three detectors connected in series: an Agilent 1200 ultraviolet (UV) detector (Agilent Technologies, Santa Clara, CA), a Wyatt DAWN-HELEOS-II multi-angle light-scattering (MALS) and a Wyatt Optilab T-rEX differential refractive index (RI) detector (Wyatt Technologies, Santa Barbara, CA, USA). The column was equilibrated with 25 mM HEPES (pH 7.5), 200 mM NaCl, and 1 mM TCEP. All the data were collected at 25 °C. A 100 μL sample in volume was injected into the column using an auto-sample injection method with a flow rate of 0.5 ml/min. Protein in the eluent was detected via UV absorbance at 280 nm, light scattering, and refractive index detectors. The data were recorded and analysed with the Wyatt Astra software (version 6.1). The refractive index increment, dn/dc, was assumed to be 0.185 ml/g for measuring the concentration of the protein samples. EASI Graphs (Astra software) were exported and plotted as a molar mass distribution superimposed on a chromatogram of absorbance at 280 nm versus elution volume.
QUANTIFICATION AND STATISTICAL ANALYSIS
Statistical analysis
For CUL2-RBX1 neddylation kinetics N=3 and the values reported in the figures are the mean ± one SD as determined by fitting in Prisim.
Data and software availability
The following PDB files were used to generate structural models as described in the figures utilizing the molecular visualization software PyMOL (https://www.pymol.org/). PDB:4KBL, PDB:4LJO, PDB:5EDV, PDB:4UN2, and PDB:4P5O
Supplementary Material
Highlights:
KLHDC2 C-degron mimicry promotes autoinhibited self-assembly
KLHDC2 self-assembly acts like a molecular timer rejecting non substrates
Both active and autoinhibited neddylated CRL2KLHDC2 are inactivated without substrate
Only bona fide substrates bind faster than E3 ligase inactivation
ACKNOWLEDGEMENTS
We thank Inês Chen, Daniel Bollschweiler and Tillman Schäfer for advice and assistance. This research was supported by ALSAC, St. Jude Children’s Research Hospital, NIH P30CA021765 to St. Jude, NIH R01GM125885 (DCS and BAS), NIH R01GM141409 (JL, NP, GK), NIH R01AG11085 and Howard Hughes Medical Institute (SJE), and Max-Planck-Gesellschaft and the EU H2020 ERC Advanced Grant Nedd8Activate (BAS and KB).
Footnotes
Publisher's Disclaimer: This is a PDF file of an unedited manuscript that has been accepted for publication. As a service to our customers we are providing this early version of the manuscript. The manuscript will undergo copyediting, typesetting, and review of the resulting proof before it is published in its final form. Please note that during the production process errors may be discovered which could affect the content, and all legal disclaimers that apply to the journal pertain.
DECLARATION OF INTERESTS
BAS is a member of the scientific advisory boards of Interline Therapeutics and BioTheryX. BAS and DCS are co-inventors of intellectual property licensed to Cinsano.
References
- 1.Li W, Bengtson MH, Ulbrich A, Matsuda A, Reddy VA, Orth A, Chanda SK, Batalov S, and Joazeiro CA (2008). Genome-wide and functional annotation of human E3 ubiquitin ligases identifies MULAN, a mitochondrial E3 that regulates the organelle’s dynamics and signaling. PLoS One 3, e1487. 10.1371/journal.pone.0001487. [DOI] [PMC free article] [PubMed] [Google Scholar]
- 2.Hershko A, Ciechanover A, and Varshavsky A (2000). Basic Medical Research Award. The ubiquitin system. Nat Med 6, 1073–1081. 10.1038/80384. [DOI] [PubMed] [Google Scholar]
- 3.Ravid T, and Hochstrasser M (2008). Diversity of degradation signals in the ubiquitin-proteasome system. Nat Rev Mol Cell Biol 9, 679–690. 10.1038/nrm2468. [DOI] [PMC free article] [PubMed] [Google Scholar]
- 4.Hatakeyama S, and Nakayama KI (2003). Ubiquitylation as a quality control system for intracellular proteins. J Biochem 134, 1–8. 10.1093/jb/mvg106. [DOI] [PubMed] [Google Scholar]
- 5.Kevei E, Pokrzywa W, and Hoppe T (2017). Repair or destruction-an intimate liaison between ubiquitin ligases and molecular chaperones in proteostasis. FEBS Lett 591, 2616–2635. 10.1002/1873-3468.12750. [DOI] [PMC free article] [PubMed] [Google Scholar]
- 6.Joazeiro CAP (2019). Mechanisms and functions of ribosome-associated protein quality control. Nat Rev Mol Cell Biol 20, 368–383. 10.1038/s41580-019-0118-2. [DOI] [PMC free article] [PubMed] [Google Scholar]
- 7.Christianson JC, and Carvalho P (2022). Order through destruction: how ER-associated protein degradation contributes to organelle homeostasis. EMBO J 41, e109845. 10.15252/embj.2021109845. [DOI] [PMC free article] [PubMed] [Google Scholar]
- 8.Padovani C, Jevtic P, and Rape M (2022). Quality control of protein complex composition. Mol Cell 82, 1439–1450. 10.1016/j.molcel.2022.02.029. [DOI] [PubMed] [Google Scholar]
- 9.Pla-Prats C, and Thoma NH (2022). Quality control of protein complex assembly by the ubiquitin-proteasome system. Trends Cell Biol 32, 696–706. 10.1016/j.tcb.2022.02.005. [DOI] [PubMed] [Google Scholar]
- 10.Zheng N, and Shabek N (2017). Ubiquitin Ligases: Structure, Function, and Regulation. Annu Rev Biochem 86, 129–157. 10.1146/annurev-biochem-060815-014922. [DOI] [PubMed] [Google Scholar]
- 11.Varshavsky A (2019). N-degron and C-degron pathways of protein degradation. Proc Natl Acad Sci U S A 116, 358–366. 10.1073/pnas.1816596116. [DOI] [PMC free article] [PubMed] [Google Scholar]
- 12.Timms RT, and Koren I (2020). Tying up loose ends: the N-degron and C-degron pathways of protein degradation. Biochem Soc Trans 48, 1557–1567. 10.1042/BST20191094. [DOI] [PMC free article] [PubMed] [Google Scholar]
- 13.Sherpa D, Chrustowicz J, and Schulman BA (2022). How the ends signal the end: Regulation by E3 ubiquitin ligases recognizing protein termini. Mol Cell 82, 1424–1438. 10.1016/j.molcel.2022.02.004. [DOI] [PMC free article] [PubMed] [Google Scholar]
- 14.Bachmair A, Finley D, and Varshavsky A (1986). In vivo half-life of a protein is a function of its amino-terminal residue. Science 234, 179–186. 10.1126/science.3018930. [DOI] [PubMed] [Google Scholar]
- 15.Bartel B, Wunning I, and Varshavsky A (1990). The recognition component of the N-end rule pathway. EMBO J 9, 3179–3189. 10.1002/j.1460-2075.1990.tb07516.x. [DOI] [PMC free article] [PubMed] [Google Scholar]
- 16.Schmidt R, Zahn R, Bukau B, and Mogk A (2009). ClpS is the recognition component for Escherichia coli substrates of the N-end rule degradation pathway. Mol Microbiol 72, 506–517. 10.1111/j.1365-2958.2009.06666.x. [DOI] [PubMed] [Google Scholar]
- 17.Pan M, Zheng Q, Wang T, Liang L, Mao J, Zuo C, Ding R, Ai H, Xie Y, Si D, et al. (2021). Structural insights into Ubr1-mediated N-degron polyubiquitination. Nature 600, 334–338. 10.1038/s41586-021-04097-8. [DOI] [PMC free article] [PubMed] [Google Scholar]
- 18.Piatkov KI, Colnaghi L, Bekes M, Varshavsky A, and Huang TT (2012). The auto-generated fragment of the Usp1 deubiquitylase is a physiological substrate of the N-end rule pathway. Mol Cell 48, 926–933. 10.1016/j.molcel.2012.10.012. [DOI] [PMC free article] [PubMed] [Google Scholar]
- 19.Chen SJ, Wu X, Wadas B, Oh JH, and Varshavsky A (2017). An N-end rule pathway that recognizes proline and destroys gluconeogenic enzymes. Science 355. 10.1126/science.aal3655. [DOI] [PMC free article] [PubMed] [Google Scholar]
- 20.Ravalin M, Theofilas P, Basu K, Opoku-Nsiah KA, Assimon VA, Medina-Cleghorn D, Chen YF, Bohn MF, Arkin M, Grinberg LT, et al. (2019). Specificity for latent C termini links the E3 ubiquitin ligase CHIP to caspases. Nat Chem Biol 15, 786–794. 10.1038/s41589-019-0322-6. [DOI] [PMC free article] [PubMed] [Google Scholar]
- 21.Koren I, Timms RT, Kula T, Xu Q, Li MZ, and Elledge SJ (2018). The Eukaryotic Proteome Is Shaped by E3 Ubiquitin Ligases Targeting C-Terminal Degrons. Cell 173, 1622–1635 e1614. 10.1016/j.cell.2018.04.028. [DOI] [PMC free article] [PubMed] [Google Scholar]
- 22.Lin HC, Yeh CW, Chen YF, Lee TT, Hsieh PY, Rusnac DV, Lin SY, Elledge SJ, Zheng N, and Yen HS (2018). C-Terminal End-Directed Protein Elimination by CRL2 Ubiquitin Ligases. Mol Cell 70, 602–613 e603. 10.1016/j.molcel.2018.04.006. [DOI] [PMC free article] [PubMed] [Google Scholar]
- 23.Timms RT, Zhang Z, Rhee DY, Harper JW, Koren I, and Elledge SJ (2019). A glycine-specific N-degron pathway mediates the quality control of protein N-myristoylation. Science 365. 10.1126/science.aaw4912. [DOI] [PMC free article] [PubMed] [Google Scholar]
- 24.Dissmeyer N, Rivas S, and Graciet E (2018). Life and death of proteins after protease cleavage: protein degradation by the N-end rule pathway. New Phytol 218, 929–935. 10.1111/nph.14619. [DOI] [PubMed] [Google Scholar]
- 25.Menssen R, Bui K, and Wolf DH (2018). Regulation of the Gid ubiquitin ligase recognition subunit Gid4. FEBS Lett 592, 3286–3294. 10.1002/1873-3468.13229. [DOI] [PubMed] [Google Scholar]
- 26.Melnykov A, Chen SJ, and Varshavsky A (2019). Gid10 as an alternative N-recognin of the Pro/N-degron pathway. Proc Natl Acad Sci U S A 116, 15914–15923. 10.1073/pnas.1908304116. [DOI] [PMC free article] [PubMed] [Google Scholar]
- 27.Qiao S, Langlois CR, Chrustowicz J, Sherpa D, Karayel O, Hansen FM, Beier V, von Gronau S, Bollschweiler D, Schafer T, et al. (2020). Interconversion between Anticipatory and Active GID E3 Ubiquitin Ligase Conformations via Metabolically Driven Substrate Receptor Assembly. Mol Cell 77, 150–163 e159. 10.1016/j.molcel.2019.10.009. [DOI] [PubMed] [Google Scholar]
- 28.Kong KE, Fischer B, Meurer M, Kats I, Li Z, Ruhle F, Barry JD, Kirrmaier D, Chevyreva V, San Luis BJ, et al. (2021). Timer-based proteomic profiling of the ubiquitin-proteasome system reveals a substrate receptor of the GID ubiquitin ligase. Mol Cell 81, 2460–2476 e2411. 10.1016/j.molcel.2021.04.018. [DOI] [PMC free article] [PubMed] [Google Scholar]
- 29.Rusnac DV, Lin HC, Canzani D, Tien KX, Hinds TR, Tsue AF, Bush MF, Yen HS, and Zheng N (2018). Recognition of the Diglycine C-End Degron by CRL2(KLHDC2) Ubiquitin Ligase. Mol Cell 72, 813–822 e814. 10.1016/j.molcel.2018.10.021. [DOI] [PMC free article] [PubMed] [Google Scholar]
- 30.Chen X, Liao S, Makaros Y, Guo Q, Zhu Z, Krizelman R, Dahan K, Tu X, Yao X, Koren I, and Xu C (2021). Molecular basis for arginine C-terminal degron recognition by Cul2(FEM1) E3 ligase. Nat Chem Biol 17, 254–262. 10.1038/s41589-020-00704-3. [DOI] [PubMed] [Google Scholar]
- 31.Manford AG, Mena EL, Shih KY, Gee CL, McMinimy R, Martinez-Gonzalez B, Sherriff R, Lew B, Zoltek M, Rodriguez-Perez F, et al. (2021). Structural basis and regulation of the reductive stress response. Cell 184, 5375–5390 e5316. 10.1016/j.cell.2021.09.002. [DOI] [PMC free article] [PubMed] [Google Scholar]
- 32.Yan X, Wang X, Li Y, Zhou M, Li Y, Song L, Mi W, Min J, and Dong C (2021). Molecular basis for ubiquitin ligase CRL2(FEM1C)-mediated recognition of C-degron. Nat Chem Biol 17, 263–271. 10.1038/s41589-020-00703-4. [DOI] [PubMed] [Google Scholar]
- 33.Zhang B, Li Y, Feng Q, Song L, Dong C, and Yan X (2022). Structural insights into ORF10 recognition by ZYG11B. Biochem Biophys Res Commun 616, 14–18. 10.1016/j.bbrc.2022.05.069. [DOI] [PMC free article] [PubMed] [Google Scholar]
- 34.Liang X, Xiao J, Li X, Liu Y, Lu Y, Wen Y, Li Z, Che X, Ma Y, Zhang X, et al. (2022). A C-terminal glutamine recognition mechanism revealed by E3 ligase TRIM7 structures. Nat Chem Biol 10.1038/s41589-022-01128-x. [DOI] [PubMed]
- 35.Ru Y, Yan X, Zhang B, Song L, Feng Q, Ye C, Zhou Z, Yang Z, Li Y, Zhang Z, et al. (2022). C-terminal glutamine acts as a C-degron targeted by E3 ubiquitin ligase TRIM7. Proc Natl Acad Sci U S A 119, e2203218119. 10.1073/pnas.2203218119. [DOI] [PMC free article] [PubMed] [Google Scholar]
- 36.Canzani D, Rusnac DV, Zheng N, and Bush MF (2019). Degronomics: Mapping the Interacting Peptidome of a Ubiquitin Ligase Using an Integrative Mass Spectrometry Strategy. Anal Chem 91, 12775–12783. 10.1021/acs.analchem.9b02331. [DOI] [PMC free article] [PubMed] [Google Scholar]
- 37.Yeh CW, Huang WC, Hsu PH, Yeh KH, Wang LC, Hsu PW, Lin HC, Chen YN, Chen SC, Yeang CH, and Yen HS (2021). The C-degron pathway eliminates mislocalized proteins and products of deubiquitinating enzymes. EMBO J 40, e105846. 10.15252/embj.2020105846. [DOI] [PMC free article] [PubMed] [Google Scholar]
- 38.Huang TT, Nijman SM, Mirchandani KD, Galardy PJ, Cohn MA, Haas W, Gygi SP, Ploegh HL, Bernards R, and D’Andrea AD (2006). Regulation of monoubiquitinated PCNA by DUB autocleavage. Nat Cell Biol 8, 339–347. 10.1038/ncb1378. [DOI] [PubMed] [Google Scholar]
- 39.Stebbins CE, Kaelin WG Jr., and Pavletich NP (1999). Structure of the VHL-ElonginC-ElonginB complex: implications for VHL tumor suppressor function. Science 284, 455–461. 10.1126/science.284.5413.455. [DOI] [PubMed] [Google Scholar]
- 40.Nguyen HC, Yang H, Fribourgh JL, Wolfe LS, and Xiong Y (2015). Insights into Cullin-RING E3 ubiquitin ligase recruitment: structure of the VHL-EloBC-Cul2 complex. Structure 23, 441–449. 10.1016/j.str.2014.12.014. [DOI] [PMC free article] [PubMed] [Google Scholar]
- 41.Cardote TAF, Gadd MS, and Ciulli A (2017). Crystal Structure of the Cul2-Rbx1-EloBC-VHL Ubiquitin Ligase Complex. Structure 25, 901–911 e903. 10.1016/j.str.2017.04.009. [DOI] [PMC free article] [PubMed] [Google Scholar]
- 42.Duda DM, Borg LA, Scott DC, Hunt HW, Hammel M, and Schulman BA (2008). Structural insights into NEDD8 activation of cullin-RING ligases: conformational control of conjugation. Cell 134, 995–1006. 10.1016/j.cell.2008.07.022. [DOI] [PMC free article] [PubMed] [Google Scholar]
- 43.Yu C, Mao H, Novitsky EJ, Tang X, Rychnovsky SD, Zheng N, and Huang L (2015). Gln40 deamidation blocks structural reconfiguration and activation of SCF ubiquitin ligase complex by Nedd8. Nat Commun 6, 10053. 10.1038/ncomms10053. [DOI] [PMC free article] [PubMed] [Google Scholar]
- 44.Baek K, Krist DT, Prabu JR, Hill S, Klugel M, Neumaier LM, von Gronau S, Kleiger G, and Schulman BA (2020). NEDD8 nucleates a multivalent cullin-RING-UBE2D ubiquitin ligation assembly. Nature 578, 461–466. 10.1038/s41586-020-2000-y. [DOI] [PMC free article] [PubMed] [Google Scholar]
- 45.Faull SV, Lau AMC, Martens C, Ahdash Z, Hansen K, Yebenes H, Schmidt C, Beuron F, Cronin NB, Morris EP, and Politis A (2019). Structural basis of Cullin 2 RING E3 ligase regulation by the COP9 signalosome. Nat Commun 10, 3814. 10.1038/s41467-019-11772-y. [DOI] [PMC free article] [PubMed] [Google Scholar]
- 46.Wang K, Reichermeier KM, and Liu X (2021). Quantitative analyses for effects of neddylation on CRL2(VHL) substrate ubiquitination and degradation. Protein Sci 30, 2338–2345. 10.1002/pro.4176. [DOI] [PMC free article] [PubMed] [Google Scholar]
- 47.Gadd MS, Testa A, Lucas X, Chan KH, Chen W, Lamont DJ, Zengerle M, and Ciulli A (2017). Structural basis of PROTAC cooperative recognition for selective protein degradation. Nat Chem Biol 13, 514–521. 10.1038/nchembio.2329. [DOI] [PMC free article] [PubMed] [Google Scholar]
- 48.Emberley ED, Mosadeghi R, and Deshaies RJ (2012). Deconjugation of Nedd8 from Cul1 is directly regulated by Skp1-F-box and substrate, and the COP9 signalosome inhibits deneddylated SCF by a noncatalytic mechanism. J Biol Chem 287, 29679–29689. 10.1074/jbc.M112.352484. [DOI] [PMC free article] [PubMed] [Google Scholar]
- 49.Enchev RI, Scott DC, da Fonseca PC, Schreiber A, Monda JK, Schulman BA, Peter M, and Morris EP (2012). Structural basis for a reciprocal regulation between SCF and CSN. Cell Rep 2, 616–627. 10.1016/j.celrep.2012.08.019. [DOI] [PMC free article] [PubMed] [Google Scholar]
- 50.Scott DC, Sviderskiy VO, Monda JK, Lydeard JR, Cho SE, Harper JW, and Schulman BA (2014). Structure of a RING E3 trapped in action reveals ligation mechanism for the ubiquitin-like protein NEDD8. Cell 157, 1671–1684. 10.1016/j.cell.2014.04.037. [DOI] [PMC free article] [PubMed] [Google Scholar]
- 51.Hopfield JJ (1974). Kinetic proofreading: a new mechanism for reducing errors in biosynthetic processes requiring high specificity. Proc Natl Acad Sci U S A 71, 4135–4139. 10.1073/pnas.71.10.4135. [DOI] [PMC free article] [PubMed] [Google Scholar]
- 52.Ninio J (1975). Kinetic amplification of enzyme discrimination. Biochimie 57, 587–595. 10.1016/s0300-9084(75)80139-8. [DOI] [PubMed] [Google Scholar]
- 53.Lu Y, Wang W, and Kirschner MW (2015). Specificity of the anaphase-promoting complex: a single-molecule study. Science 348, 1248737. 10.1126/science.1248737. [DOI] [PMC free article] [PubMed] [Google Scholar]
- 54.Varshavsky A (2011). The N-end rule pathway and regulation by proteolysis. Protein Sci 20, 1298–1345. 10.1002/pro.666. [DOI] [PMC free article] [PubMed] [Google Scholar]
- 55.Fischer ES, Scrima A, Bohm K, Matsumoto S, Lingaraju GM, Faty M, Yasuda T, Cavadini S, Wakasugi M, Hanaoka F, et al. (2011). The molecular basis of CRL4DDB2/CSA ubiquitin ligase architecture, targeting, and activation. Cell 147, 1024–1039. 10.1016/j.cell.2011.10.035. [DOI] [PubMed] [Google Scholar]
- 56.Cowan AD, and Ciulli A (2022). Driving E3 Ligase Substrate Specificity for Targeted Protein Degradation: Lessons from Nature and the Laboratory. Annu Rev Biochem 91, 295–319. 10.1146/annurev-biochem-032620-104421. [DOI] [PubMed] [Google Scholar]
- 57.Schapira M, Calabrese MF, Bullock AN, and Crews CM (2019). Targeted protein degradation: expanding the toolbox. Nat Rev Drug Discov 18, 949–963. 10.1038/s41573-019-0047-y. [DOI] [PubMed] [Google Scholar]
- 58.Poirson J, Dhillon A, Cho H, Lam MHY, Alerasool N, Lacoste J, Mizan L, and Taipale M (2022). Proteome-scale induced proximity screens reveal highly potent protein degraders and stabilizers. bioRxiv, 2022.2008.2015.503206 10.1101/2022.08.15.503206. [DOI]
- 59.Kim Y, Seo C, Jeon E, You I, Hwang K, Kim N, Choi H-S, Hinshaw SM, Sim T, and Gray N (2022). Targeted Kinase Degradation via the KLHDC2 Ubiquitin E3 Ligase. bioRxiv, 2022.2012.2017.520883 10.1101/2022.12.17.520883. [DOI] [PMC free article] [PubMed]
- 60.McCoy AJ, Grosse-Kunstleve RW, Adams PD, Winn MD, Storoni LC, and Read RJ (2007). Phaser crystallographic software. J Appl Crystallogr 40, 658–674. 10.1107/S0021889807021206. [DOI] [PMC free article] [PubMed] [Google Scholar]
- 61.Adams PD, Afonine PV, Bunkoczi G, Chen VB, Davis IW, Echols N, Headd JJ, Hung LW, Kapral GJ, Grosse-Kunstleve RW, et al. (2010). PHENIX: a comprehensive Python-based system for macromolecular structure solution. Acta Crystallogr D Biol Crystallogr 66, 213–221. 10.1107/S0907444909052925. [DOI] [PMC free article] [PubMed] [Google Scholar]
- 62.Zhao H, Brautigam CA, Ghirlando R, and Schuck P (2013). Overview of current methods in sedimentation velocity and sedimentation equilibrium analytical ultracentrifugation. Curr Protoc Protein Sci Chapter 20, Unit20 12. 10.1002/0471140864.ps2012s71. [DOI] [PMC free article] [PubMed] [Google Scholar]
- 63.Chaturvedi SK, Ma J, Zhao H, and Schuck P (2017). Use of fluorescence-detected sedimentation velocity to study high-affinity protein interactions. Nat Protoc 12, 1777–1791. 10.1038/nprot.2017.064. [DOI] [PMC free article] [PubMed] [Google Scholar]
- 64.Schuck P (2000). Size-distribution analysis of macromolecules by sedimentation velocity ultracentrifugation and lamm equation modeling. Biophys J 78, 1606–1619. 10.1016/S0006-3495(00)76713-0. [DOI] [PMC free article] [PubMed] [Google Scholar]
- 65.Zhao H, and Schuck P (2012). Global multi-method analysis of affinities and cooperativity in complex systems of macromolecular interactions. Anal Chem 84, 9513–9519. 10.1021/ac302357w. [DOI] [PMC free article] [PubMed] [Google Scholar]
- 66.Brautigam CA (2015). Calculations and Publication-Quality Illustrations for Analytical Ultracentrifugation Data. Methods Enzymol 562, 109–133. 10.1016/bs.mie.2015.05.001. [DOI] [PubMed] [Google Scholar]
- 67.Zivanov J, Nakane T, Forsberg BO, Kimanius D, Hagen WJ, Lindahl E, and Scheres SH (2018). New tools for automated high-resolution cryo-EM structure determination in RELION-3. Elife 7. 10.7554/eLife.42166. [DOI] [PMC free article] [PubMed] [Google Scholar]
- 68.Rohou A, and Grigorieff N (2015). CTFFIND4: Fast and accurate defocus estimation from electron micrographs. J Struct Biol 192, 216–221. 10.1016/j.jsb.2015.08.008. [DOI] [PMC free article] [PubMed] [Google Scholar]
Associated Data
This section collects any data citations, data availability statements, or supplementary materials included in this article.
Supplementary Materials
Data Availability Statement
Structural coordinates and electron density maps have been deposited in the Protein data bank and Electron microscopy data bank respectively and are publicly available as of the date of publication. Their accession codes are listed in the key resources table. Original gel images have been deposited at Mendeley and are publicly available as of the date of publication. The DOI is listed in the key resources table.
This study does not report original code.
Any additional information required to reanalyze the data reported in this paper is available from the lead contact upon request.
The following PDB files were used to generate structural models as described in the figures utilizing the molecular visualization software PyMOL (https://www.pymol.org/). PDB:4KBL, PDB:4LJO, PDB:5EDV, PDB:4UN2, and PDB:4P5O