

Abstract
Purpose
To investigate the relative positional changes between the Bruch's membrane opening (BMO) and the anterior scleral canal opening (ASCO), and border tissue configuration changes during experimental high myopia development in juvenile tree shrews.
Methods
Juvenile tree shrews were assigned randomly to two groups: binocular normal vision (n = 9) and monocular −10 D lens treatment starting at 24 days of visual experience to induce high myopia in one eye while the other eye served as control (n = 12). Refractive and biometric measurements were obtained daily, and 48 radial optical coherence tomography B-scans through the center of the optic nerve head were obtained weekly for 6 weeks. ASCO and BMO were segmented manually after nonlinear distortion correction.
Results
Lens-treated eyes developed high degree of axial myopia (−9.76 ± 1.19 D), significantly different (P < 0.001) from normal (0.34 ± 0.97 D) and control eyes (0.39 ± 0.88 D). ASCO–BMO centroid offset gradually increased and became significantly larger in the experimental high myopia group compared with normal and control eyes (P < 0.0001) with an inferonasal directional preference. The border tissue showed a significantly higher tendency of change from internally to externally oblique configuration in the experimental high myopic eyes in four sectors: nasal, inferonasal, inferior, and inferotemporal (P < 0.005).
Conclusions
During experimental high myopia development, progressive relative deformations of ASCO and BMO occur simultaneously with changes in border tissue configuration from internally to externally oblique in sectors that are close to the posterior pole (nasal in tree shrews). These asymmetric changes may contribute to pathologic optic nerve head remodeling and an increased risk of glaucoma later in life.
Keywords: high myopia, optic nerve head, anterior scleral canal opening, Bruch's membrane opening, border tissue, optical coherence tomography
Myopia has been identified as an independent risk factor for glaucoma in different ethnicities, yet the link between both conditions remains unknown.1 The prevalence of myopia has been increasing dramatically, now affecting proximately 40% of the United States’ adult population2 and up to 96% of some Asian populations.3,4 Although myopic refractive error is treatable, the increased axial length (AL) and associated risk for irreversible blinding comorbidities, including glaucoma and macular degeneration, remain a major concern. The risk of these comorbidities increases with higher degrees of myopia, where high myopia in humans is typically defined as spherical equivalent of less than −6 D or AL of more than 26 mm.5 Parallel to this, glaucoma prevalence is projected to be 111.8 million among people aged 40 to 80 years worldwide by 2040.6 The growing prevalence of both diseases represents a significant global health concern.
Myopia and glaucoma are chronic conditions that involve connective tissue remodeling of the optic nerve head (ONH). ONH remodeling is of particular interest in glaucoma research because the ONH represents a mechanical weak spot in the otherwise robust ocular coat.7 Pathologic remodeling at the ONH, specifically at the lamina cribrosa (LC), may cause mechanical insult to retinal ganglion cell (RGC) axons and impair RGC axonal transport.8–14 An elevated IOP is the primary risk factor for glaucoma. Additionally, in contrast with other optic neuropathies, progressive remodeling of the ONH tissues is the defining feature of glaucoma.10 The pathological ONH remodeling response in glaucoma is thought to be load driven10 and may be impacted by the ONH remodeling response that occurs in myopia.
Myopic eyes are too long for their optics, and the AL is commonly used to define the severity of myopia and its progression.15 Axial elongation in myopia is typically caused by excessive scleral remodeling, which can be caused by visual cues such as defocus, light intensity, and chromatic cues.16,17 Remodeling in myopia leads to morphological changes at the ONH, which may permanently alter the RGC axons' biomechanical environment.10,18–20 Consequently, connective tissue remodeling is considered to play a crucial role in both pathologies, where remodeling that leads to myopia early in life may increase the risk for pathologic remodeling and glaucoma later in life.18 Furthermore, the effect of connective tissues remodeling on neural tissues resulting from both pathologies may accumulate over time and result eventually in an increased risk of mechanical insult of RGC axons.18
To gain insights into the interacting remodeling mechanisms, several studies investigated the morphological changes of the ONH in myopia and glaucoma.7,20–25 Structural ONH changes have been reported in myopia, including optic disc tilt, torsion,26 and increased Bruch's membrane opening (BMO) area.25,27,28 Jeoung et al.20 investigated the relative changes between neural and connective tissues at the ONH showing that the centroids of BMO (a retinal landmark) and the anterior scleral canal opening (ASCO, a connective tissue landmark) deformed relative to each other in myopia. Pertinent to this, the Boramae Myopia Cohort Study reported longitudinal structural changes of the ONH in myopic children, including relative deformations between the LC and the retina,29 along with the development30 and enlargement31 of peripapillary atrophy. Furthermore, Kim et al.32 reported border tissue configuration change from internally to externally oblique during axial elongation in myopic children. These findings indicate that remodeling in myopia involves complex relative deformations between neural and connective tissues at the ONH, which may increase the vulnerability of myopic eyes to glaucomatous optic neuropathy.
To date, most of the clinical studies that investigated ONH changes in myopia are cross-sectional20,23–25,27,28 and primarily included adult subjects.20,23–25 The cross-sectional design limits the chronological investigation of the events underlying the progressive ONH remodeling. This limitation is highly significant when the interaction between myopia and glaucoma is being investigated, where deformations caused by aging and/or pathological remodeling in glaucoma cannot be easily distinguished from those caused by myopia even with absent IOP elevation and visual field changes.20 To the best of our knowledge, longitudinal structural changes of the ONH during myopia development in children have been reported only in a few studies.29–33 However, the subjects of those studies29–33 were enrolled after they had already developed some levels of myopia, which may inhibit the detection of some early myopic structural changes of the ONH. Furthermore, because human myopia is mostly bilateral, the lack of a self-control eye in these studies is another challenge to isolate myopia-induced ONH changes. Presently, no study has investigated the longitudinal structural changes of the ONH before the onset of myopia to detect early myopia-induced structural changes of the ONH. Such a study would require recruiting healthy young children with the expectation they develop myopia, which is challenging to conduct. Another significant challenge to conducting such a study would be the lack of cooperation in young children, which may require examination under anesthesia. Translational animal models of myopia can account for these limitations, and, therefore, provide critical insights into ONH remodeling during high myopia development.
Tree shrews (genus Tupaia) are small mammals that are closely related to primates with well-developed visual systems and fast maturation. The tree shrew model of myopia is well-established with an extensive normative database is available in published literature.34–36 Recently, Samuels et al.37 have established the tree shrew model of glaucoma. In contrast with rats and mice, the tree shrew load-bearing LC is made mainly of collagen, similar to that of humans and nonhuman primates.35 Furthermore, tree shrews age rapidly compared with primates, where 20 weeks of early eye development is equivalent to 20 years in humans.36 Consequently, tree shrews present a unique opportunity to study ONH remodeling in myopia and glaucoma and throughout aging.
Our working hypothesis is that vision-guided ONH remodeling in high myopia contributes to subsequent pathologic ONH remodeling and glaucoma later in life. In this study, we aim to quantify longitudinally the structural change in neural and connective tissues at the ONH during experimental high myopia development in juvenile tree shrew eyes using optical coherence tomography (OCT) imaging. In so doing, we lay the foundation to understand the underlying mechanisms of ONH remodeling in myopia that could potentially contribute to an increased risk to glaucoma later in life.
Methods
Experimental Groups
This study was carried out using northern tree shrews (Tupaia belangeri), which were bred in the Tree Shrew Core at The University of Alabama at Birmingham and raised by their mothers until weaning. After weaning, tree shrews were housed in individual cages under 14/10 hours of light/dark cycles with continuous access to water and dry food. Tree shrews are born with closed eyelids, and the day when both eyes open (around 21 days postnatal) is defined as the first day of visual experience (DVE).
A total of 21 juvenile tree shrews were randomly assigned to one of two groups: a normal group with binocular normal visual experience (n = 9) and a group with monocular experimental high myopia (n = 12). At 21 DVE, a dental acrylic pedestal was installed surgically onto the head of all animals as previously described.38–40 At 24 DVE, an aluminum goggle frame was attached to the pedestal in the myopic group. The goggle frame had a clear PMMA lens (−10 D, 12 mm in diameter, 7.5 mm base curve, 0.2 mm thickness) on one side to induce high myopia in one eye; the fellow eye served as a control. All procedures were approved by the UAB Institutional Animal Care and Use Committee and adhered to the Association of Research in Vision and Ophthalmology Statement for the Use of Animals in Ophthalmic and Visual Research.
Refractive and Biometry Measurements
Noncycloplegic refractive and biometric measurements were performed daily from 24 to 59 DVE in fully awake animals around 10:00 am using the Nidek ARK-700A infrared auto-refractor (Marco Ophthalmic, Jacksonville, FL, USA) and Lenstar LS-900 optical biometry (Haag-Streit USA, Mason, OH, USA), respectively. Axial eye dimensions were obtained by analyzing the Lenstar raw data using species-specific refractive indices as described in El Hamdaoui et al.41
OCT Imaging
Tree shrews were anesthetized by an intramuscular injection of xylazine (100 mg/mL) followed by a continuous delivery of isoflurane (1% in 100% oxygen at 1 L/min) through a nose cone attached to a custom-built imaging platform with a heating pad to maintain a stable animal position and a constant body temperature throughout the imaging session. One drop of 2.5% phenylephrine hydrochloride and one drop of 1% tropicamide (Akorn, Lake Forest, IL, USA) were used to dilate the eye. Rigid contact lenses (Plano sphere; base curve, 4.0 mm; diameter, 6.3 mm) were placed onto the cornea, and the OCT camera head was positioned perpendicular to the limbal plane. After that, 48 radial B-scans centered on the ONH were obtained using Spectralis OCT2 (Heidelberg Engineering Inc., Heidelberg, Germany) using the high resolution and enhanced-depth imaging settings. The radial OCT scan pattern was centered at the ONH, the camera was adjusted so that the retina appeared flat in a circular OCT scan, indicating it was perpendicular to the light path. Additionally, the camera focus was adjusted so that the LC was in best focus. Baseline B-scans were acquired at 24 DVE, and five follow-up B-scans were acquired weekly using the follow-up mode.
Exported OCT image files were processed in terms of shadow removal, contrast enhancement42 and nonlinear distortion correction.43 Manual segmentation of the BMO (defined as the termination of retinal pigment epithelium/Bruch's membrane complex) and ASCO (defined by the intersection of the plane of the peripapillary anterior scleral surface and the neural canal wall) was performed by a single observer (M.T.K.). In each B-scan, we identified two points (one point on each side of the neural canal) resulting in a set of 96 manually segmented points for each of ASCO and BMO. Figure 1 shows a representative en face scanning laser ophthalmoscopy image (Fig. 1A), a representative OCT B-scan after nonlinear distortion correction (Fig. 1B), a two-dimensional projection of BMO points into the ASCO plane (Fig. 1C), and the three-dimensional (3D) reconstruction of the BMO and ASCO points (Fig. 1D). The following variables were quantified from the 3D reconstruction of the BMO and ASCO points using a custom code (MATLAB version R2020b; The MathWorks, Natick, Massachusetts, USA):
-
•
ASCO and BMO Areas and Ovality Indices: ASCO and BMO areas and ovalities were computed using the best-fitted ellipse to ASCO and BMO points as shown in Figure 1D. The ovality index was defined as the ratio of the major to the minor radius of the best-fitted ellipses.
-
•
ASCO–BMO Centroid Offset: The ASCO–BMO centroid offset was defined as the vector connecting ASCO and BMO centroids. This vector was projected onto the ASCO plane, and the length of the projected vector represented the ASCO–BMO centroid offset magnitude.
-
•
Border Tissue Length: Border tissue length was defined as the length of the connective tissue strut that connects BMO and ASCO. This length was computed as the 3D distance between ASCO and BMO points (green lines shown in Fig. 1D) for each B-scan and then averaged for all scans (global border tissue length) and for each of the following sectors: temporal, superotemporal, superior, superonasal, nasal, inferonasal, inferior, and inferotemporal.
-
•
Border Tissue Configuration: Three border tissue configurations were identified based on the BMO location relative to ASCO (Fig. 2).44 The border tissue configuration was defined as internally oblique if the BMO position was inside the ASCO perimeter and the projected border tissue length of more than 3 µm, externally oblique if the BMO position was outside the ASCO perimeter and the projected border tissue length of more than 3 µm, and nonoblique when the projected border tissue length was 3 µm or less. The cut of distance of 3 µm corresponds with approximately 1 pixel in the distortion-corrected OCT image. Because each B-scan shows two border tissue configurations (one on each side of the ONH), 96 observations of border tissue configuration were made for each OCT scan.
Figure 1.

ONH anatomical landmarks from OCT of a right eye. (A) En face image showing the tree shrew ONH alongside with the OCT scan pattern on top of it. (B) Distortion-corrected B-scan (marked by the thick green line in A) showing the manually segmented BMO (blue circle) and ASCO (red circle). (C) BMO and ASCO points projected into ASCO plane. (D) Three-dimensional reconstruction of all BMO and ASCO points, ASCO-BMO centroid offset, and border tissue. I, inferior; IN, inferonasal; N, nasal; S, superior; ST, superotemporal; T, temporal.
Figure 2.

Schematic representation of border tissue configurations. (A) Internally oblique configuration: BMO position is inside of ASCO perimeter with a projected border tissue length of more than 3 µm. (B, C) Nonoblique configurations: BMO position is within 3 µm on either side of ASCO. (D) Externally oblique configurations: BMO position is outside ASCO perimeter with a projected border tissue length of more than 3 µm.
Data and Statistical Analyses
The BMO and ASCO coordinates were analyzed in right eye configuration. Owing to the nonindependence of eyes being nested within animals, as well as the longitudinal nature of the data, differences among normal, control, and experimental high myopic eyes were assessed using linear mixed models for continuous outcomes. We assumed a compound symmetric correlation among measurements. When examining the data to determine the significance of post hoc comparisons among the groups, we employed a Bonferroni correction to maintain an appropriate type I error rate. Except where stated otherwise, the data are presented as mean ± standard deviations, and the type I level error rate set at 0.05 per analysis. Statistical analysis was performed using SAS 9.4 (SAS Institute, Cary, NC, USA).
Results
Refractive and Biometric Results
Significant group interaction by time was observed for AL and spherical equivalent refraction (P < 0.001). All lens-treated eyes developed high levels of myopia with significant increase in AL (7.56 ± 0.13 mm) and myopic refraction (−9.76 ± 1.19 D) compared with normal (7.32 ± 0.12 mm and 0.34 ± 0.97 D; P < 0.001) and control (7.33 ± 0.13 mm and 0.39 ± 0.88 D; P < 0.001) eyes. Interaction with time was not significantly different between normal and control eyes for either the AL (P = 0.03) or refraction (P = 0.14) (Fig. 3).
Figure 3.
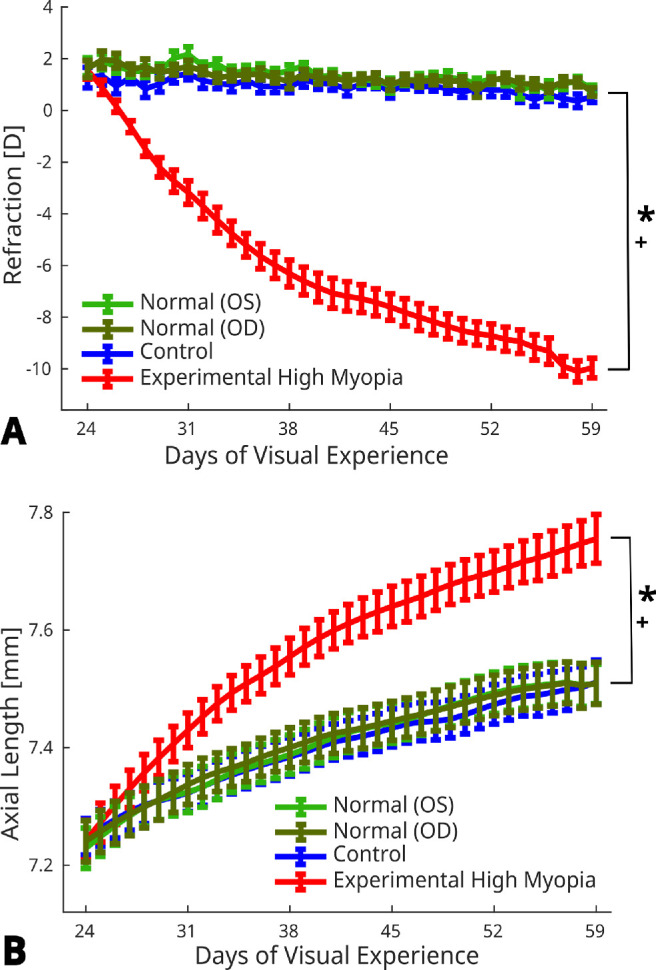
Daily measurements of (A) refraction and (B) AL of normal (OD and OS), control and experimental high myopic eyes from 24 to 59 days of visual experience. Error bars represent standard error of mean. * and + indicate statistically significant interaction with time for experimental high myopia versus normal and control eyes, respectively (P < 0.001).
ASCO–BMO Areas and Ovality Indices
No significant group interaction with time was detected for ASCO area (P = 0.44), BMO area (P = 0.17), ASCO ovality (P = 0.24) and BMO ovality (P = 0.24).
ASCO–BMO Centroid Offset
The magnitude of ASCO–BMO centroid offset showed significant group interaction with time (P < 0.0001), where it gradually increased to become significantly larger in the experimental high myopia group compared with normal (P < 0.0001) and control (P < 0.0001) eyes (Fig. 4A). Figures 4B–D illustrate the individual development of the ASCO-BMO offset for each eye in the three groups showing that the largest changes in the ASCO–BMO centroid offset occurred toward the inferonasal direction in the experimental high myopic eyes. For each eye, a line is drawn connecting the ASCO–BMO offsets, chronologically, starting at baseline (DVE 24) and ending at the last observed offset (DVE 59).
Figure 4.

Development of ASCO-BMO centroid offset. (A) Changes in ASCO-BMO offset magnitude from baseline for normal, control, and experimental high myopic eyes (error bars represent standard error of mean). (B–D) Change in ASCO-BMO centroid offset direction from baseline for normal (B), control (C) and experimental high myopic (D) eyes. Solid lines connect the longitudinal data points (circles) of individual eyes. * and + indicate statistically significant interaction with time for experimental high myopia versus normal and control eyes, respectively (P < 0.0001). Abbreviations: I, inferior; N, nasal; S, superior; T, temporal.
Border Tissue Length
Border tissue length was relatively stable in all three groups including the experimental high myopia group, with no significant group interaction by time for the global border tissue length (P = 0.27) or for the border tissue length of any sector (P > 0.05).
Border Tissue Configuration
A significant group interaction by time was observed for the prevalence of border tissue configurations, where the prevalence of internally oblique configuration gradually decreased (P < 0.0001) and the prevalence of externally oblique configuration gradually increased (P < 0.0001) in experimental high myopia compared with both normal (P < 0.0001) and control (P < 0.0001) eyes (Fig. 5). In contrast, normal and control eyes were not significantly different in terms of border tissue configuration prevalence over time (P > 0.05).
Figure 5.
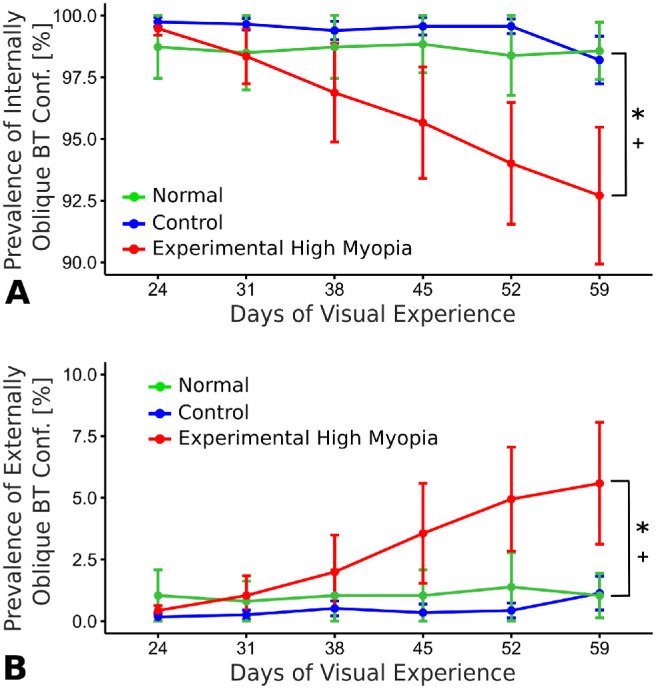
Longitudinal changes in the prevalence of (A) internally oblique and (B) externally oblique border tissue configurations as a mean percentage (error bars represent standard error of mean). * and + indicate statistically significant interaction with time (P < 0.0001) for experimental high myopia versus normal and control eyes, respectively.
In the context of the observed trajectories in border tissue configuration, we investigated the change in the border tissue configuration from internally to externally oblique in each sector. Figure 6 shows the sectorial changes in border tissue configuration from internally oblique at baseline to externally oblique at each follow-up session. A significant interaction with time was observed in experimental high myopic eyes compared with normal and control eyes in four sectors: nasal (P < 0.002), inferonasal (P < 0.001), inferior (P < 0.0002), and inferotemporal (P < 0.005). Normal and control eyes did not show any significant differences in any sector (P > 0.05). The changes in border tissue configuration suggest that the BMO and ASCO points deformed relative to each other during experimental high myopia development. Figure 7 shows a case example for the longitudinal positional changes of BMO and ASCO points in one OCT B-scan of an experimental highly myopic eye imaged at different time points. The left-hand side of the OCT B-scan shows the outward gradual displacement of the BMO relative to the ASCO in the inferonasal direction, resulting in a border tissue configuration change from internally to externally oblique during experimental high myopia development and progression.
Figure 6.

Polar plots showing sectorial border tissue configuration changes from internally oblique at baseline to externally oblique at each follow-up session. Significant interactions with time (P < 0.05) were observed for experimental high myopia versus normal and control eyes in four sectors (N, IN, I and IT). Solid lines and shaded areas represent mean percentages and standard error of mean, respectively. Abbreviations: DVE, days of visual experience; I, inferior; IN, inferonasal; IT, inferotemporal; N, nasal; S, superior; SN, superonasal; ST, superotemporal; T, temporal.
Figure 7.

OCT B-scans showing the longitudinal change of the BMO (light blue circles) and ASCO (red circles) positions during experimental high myopia development in a left eye. The same B-scan location was imaged using follow-up mode at 24 (baseline), 38, 45, and 59 DVE. At the left side of the scans (orange box), BMO gradually displaced from inside at 24 DVE to outside relative to the ASCO perimeter at 59 DVE, changing the border tissue configuration from internally to externally oblique. Abbreviations: DVE, days of visual experience; IN, inferonasal; ST, superotemporal.
Discussion
The results of this longitudinal study investigated the longitudinal positional changes of BMO relative to ASCO during experimental high myopia development in juvenile tree shrews. Our results showed that ASCO and BMO deform relative to each other during experimental high myopia development in juvenile tree shrews. This relative deformation involved an overall increase of the ASCO–BMO centroid offset toward the inferonasal direction. At baseline, the border tissue configuration was predominantly internally oblique in all groups with no significant changes over time in normal or control eyes. During experimental high myopia development, BMO positions were shifted away from the ONH center and beyond the ASCO perimeter, significantly changing the border tissue configuration to be externally oblique in the nasal, inferonasal, inferior, and inferotemporal sectors. Our results support the notion that experimental high myopia leads to an asymmetric remodeling of the ONH, which may contribute to pathologic remodeling of the ONH and glaucoma later in life.18
In a cross-sectional study, Jeoung et al.20 reported a significantly greater offset between ASCO and BMO centroids in high myopic eyes compared with age-matched controls (264.3 ± 131.1 µm and 89 ± 55.8 µm in myopic and control eyes, respectively). Whereas we defined the ASCO–BMO centroid offset vector from the ASCO to the BMO centroid, Jeoung et al.20 defined this vector in the opposite direction. If we matched the vector definition to the one used in the present study, the results of Jeoung et al.20 suggest a temporal displacement of the BMO centroid relative to the ASCO centroid. Whereas the temporal displacement of BMO20 seems to contradict our findings of inferonasal displacement, the anatomical differences between the human and tree shrew eyes can unify these results. In tree shrews, the posterior pole location is nasal and slightly inferior with respect to the ONH35,45,46 (Fig. 8), which is the exact opposite in humans. In light of such species-dependent anatomical differences, our findings closely match the results in humans,20 wherein in both species the ASCO–BMO centroid offset20 occurs toward the posterior pole (nasal in tree shrews and temporal in humans).
Figure 8.
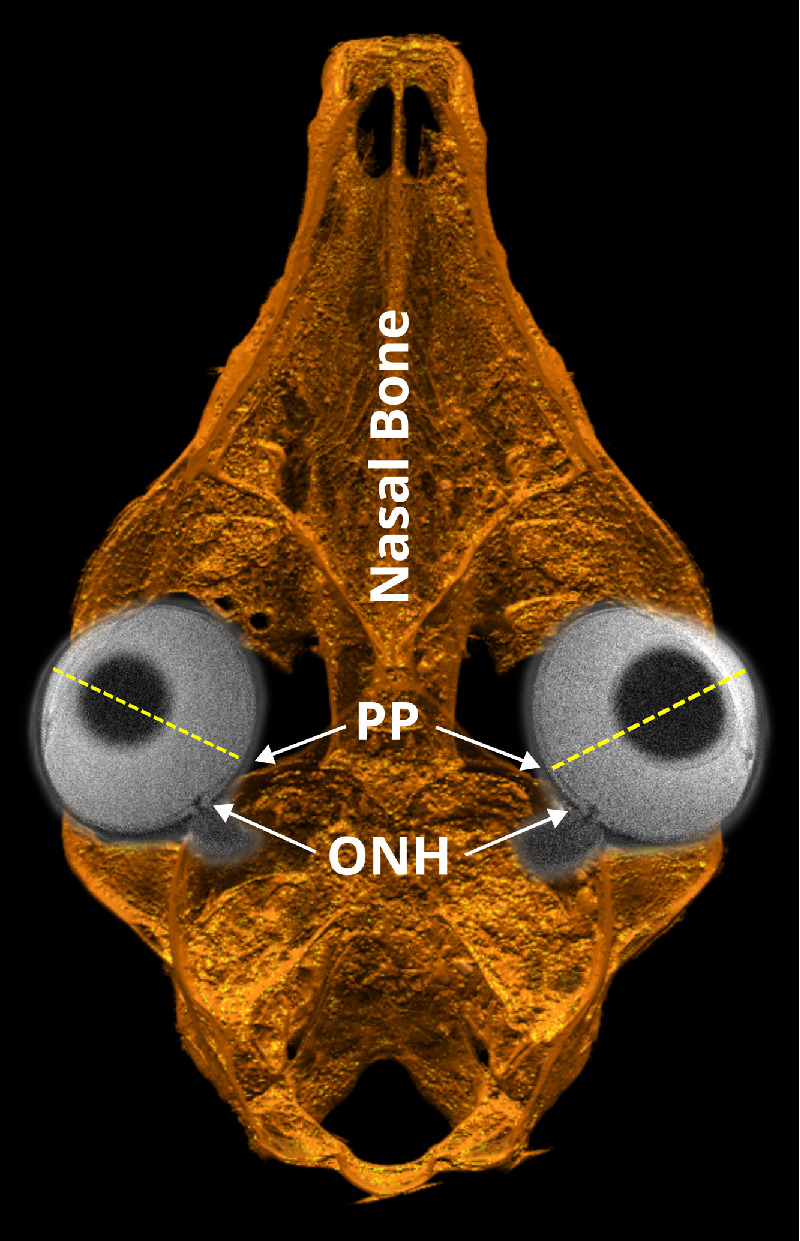
Horizontal cut through a 3D reconstruction of a tree shrew skull from an ex vivo CT scan overlaid with horizontal slices of both eyes from in vivo MRI showing the relative anatomical positions of the ONH and posterior pole (PP) of the tree shrew eye.
Kim et al.32 and Sawada et al.44 reported a predominantly internally oblique border tissue configuration in the nasal region and an externally oblique configuration in the temporal region in cohorts of myopic children and adults, respectively. In children, the externally oblique border tissue configurations at the temporal side became more prominent with myopia progression.32 The progressive changes and topography of border tissue configurations in myopic human eyes32,44 are consistent with our findings showing a progressive development of externally oblique border tissue configurations in sectors that are closest to the posterior pole. Furthermore, the here observed relative shift between BMO and ASCO may be the underlying basis for the development of the so-called gamma zone of peripapillary atrophy (γPPA).47–51 The prevalence and width of the γPPA have been positively correlated with higher levels of myopia44 and longer AL.33,52 In addition, Kim et al.27 documented the progressive development and enlargement of PPA in myopic children (7.3 ± 3.7 years of age). A similar trend was observed in a case study of a young adult (21 years old at baseline), where progressive temporal displacements of BMO relative to ASCO resulted in the exposure of the scleral flange over 5 years of myopia progression.53 In a cohort of Chinese children (age at the end of follow-up, 11.4 ± 0.5 years), Guo et al.33 have also reported the development and enlargement of γPPA in the temporal direction during myopia progression. Although no PPA was observed in our study, the here observed progressive border tissue changes at the nasal side are consistent with the progressive shifting of BMO relative to ASCO53 and the development of PPA toward the temporal side in myopic humans,27,33 when the aforementioned anatomical differences between human and tree shrew eyes are considered (Fig. 8).
Despite the observed asymmetric border tissue configuration changes, no significant changes in ASCO and BMO areas and ovalities were found in this study. Consistent with our findings, Jnawali et al.28 did not find a significant correlation between AL and BMO area in myopic and nonmyopic children (mean age, 11.12 ± 2.64 years). Similarly, the distance between opposite BMO points, which could be considered as a surrogate measure of BMO area, did not change during myopia progression.30 Furthermore, only 25 of 46 eyes (54.3%) showed increased disc ovality in the Boramae Myopia Cohort Study.30 However, these findings are in contrast with other studies reporting a significantly smaller54 or larger55–60 optic disc area in myopic eyes. These contradicting findings might signify a wide inter-subject variability in myopic ONH remodeling.30 An age-dependent remodeling of the myopic ONH48,49 may underlie the controversial results across studies, where no significant changes in ASCO and BMO areas were seen in our study and in myopic children,28,30 but found in adult eyes.55–59 Furthermore, the variability between studies could be aggravated by a poor agreement between ONH parameters measured with different imaging devices, including fundus photography, Heidelberg Retinal Tomography, and OCT.61–66 Because there is no consensus on the definition of optic disc margin, different results for optic disc area and ovality should be interpreted carefully. The clinically visible optic disc margin in fundus photography does not usually match the innermost margin of BMO obtained by OCT imaging.62,66 Therefore, the BMO area obtained by fundus photography55,57–59 might be overestimated and should be interpreted carefully when compared with other OCT-obtained BMO areas. Furthermore, results may be affected by the segmentation technique, where fully automated, semiautomated, or manual segmentation strategies can yield different results.63,64 The cumulative effects of interactions with age, inherent differences of imaging devices, and ONH margin delineation methods across studies may explain the controversial results in the optic disc area and ovality changes reported in different myopia studies.
There is increasing evidence that ASCO–BMO offset and border tissue configuration changes in myopic eyes may contribute to the risk of glaucoma later in life. For instance, the sectorial distribution of peripapillary retinal nerve fiber layer thickness was found to be strongly correlated with the ASCO–BMO offset direction in eyes of healthy adults,65 pointing to a potential interaction between the structural changes at the ONH and the peripapillary retinal nerve fiber layer thickness. Jeoung et al.20 reported that the ASCO–BMO offset was significantly larger in myopic eyes without glaucoma compared with myopic eyes with coexisting glaucoma. The length of the externally oblique border tissue in glaucomatous eyes has been identified as an independent risk factor for visual field defects,67 focal LC defects, and microvascular dropout.68 Sawada et al.44 reported worse visual field defects in myopic eyes with a wider γPPA, suggesting that a greater shift of the BMO position away from the ONH center may increase the vulnerability of the ONH to subsequent glaucomatous damage. However, existing studies, including the current study, investigated myopic ONH changes in either juvenile or adult populations. It remains unknown how aging and chronic IOP elevation might interact with myopic ONH remodeling that starts early in life and potentially impacts the risk for glaucoma later in life.
Pertinent to the discussion of potential and robust biomarkers, it should be acknowledged that OCT biomarkers could be biased owing to inherent artifacts introduced by the imaging device used. For instance, lateral magnification and nonlinear optical distortions could bias any OCT-based biomarkers, including ASCO–BMO offset.69 Leung et al.24 reported a significantly larger optic disc area after magnification correction in adult human eyes (2.36 and 2.61 mm2 before and after correction, respectively; P < 0.001). Clinical studies often consider AL, refraction, and keratometry for the lateral magnification correction of OCT scans. A similar correction is not commonly used in animal studies and is likely insufficient owing to significant size differences compared with human eyes. In the current study, we used the Spectralis OCT2 (Heidelberg Engineering), a spectral domain OCT, which uses a Gullstrand eye model-based algorithm to scale the transverse dimensions.70 A prior study has shown that small changes in camera position can introduce significant nonlinear distortions when using clinical OCT devices in animals with small eyes such as tree shrews.71 To resolve this potential source of bias, we have used our previously published nonlinear distortion correction method.43 Although it remains challenging to obtain anatomically correct OCT images of the posterior segment, OCT-based biomarkers that are insensitive to optical distortions may be ideal to provide robust predictions of glaucoma risk or ONH remodeling in myopia. The border tissue configuration is an interesting candidate as the close anatomical position of BMO and ASCO minimizes the impact of nonlinear distortions on this potentially robust biomarker of progressive ONH remodeling in myopia.
Although the present study was the first experimental study to characterize the longitudinal myopic ONH changes during the juvenile stage, the mechanism underlying the observed deformations remains unclear. We have hypothesized that scleral remodeling is the primary diver of ONH remodeling in myopia and expected that the retina would follow the sclera as it remodels given the geometrical proximity and minimal resistance offered by the neurovascular tissues.18 The observed relative deformations between BMO and ASCO may suggest that the retina resisted or was shielded from the scleral remodeling deformations. Although our OCT data cannot distinguish which tissue component moved and which tissue component resisted these deformations, several potential mechanisms have been suggested. Lee et al.72 suggested that the sclera shifts away from the posterior pole during axial elongation, whereas preferential retinal growth at the equator could preserve the retinal structure at the posterior pole and cause a relative shift between ASCO and BMO as seen here. Abbott et al.73 reported that the volumetric density of retinal cells is preserved, but the areal density is decreased near the posterior pole suggesting that retinal stretching, but not growth, may occur in highly myopic eyes of tree shrews. Another possible explanation might reside in the Bruch's membrane. Prior histological evaluations of human74,75 and animals76 eyes have shown that the Bruch's membrane thickness is independent of the AL, pointing to a potential growth and volume increase of the Bruch's membrane during myopia development. Indeed, a growing Bruch's membrane might minimize the shear forces that are transmitted from the sclera to the retina, hence, preserving the retinal structure and BMO location as the sclera remodels relative to the retina in myopia. Further experiments and simulation models are needed to gain insight into the potential role of Bruch's membrane in myopia.
In summary, our findings showed that ONH remodeling during experimental high myopia development and progression involves relative deformations between ASCO and BMO. These relative deformations resulted in a progressive increase of ASCO-BMO centroid offset and local changes of the border tissue configuration form internally to externally oblique. The observed asymmetric remodeling of the ONH during juvenile high myopia development and progression may contribute to pathologic ONH remodeling and glaucomatous damage later in life. Additional studies are needed to investigate the interacting effects of aging and glaucoma with the ONH changes in juvenile myopia reported here.
Acknowledgments
The authors thank the UAB Small Animal Imaging Shared Facility for facilitating the MRI and CT scans.
Supported by NIH Grants R01-EY027759, R01-EY026588, P30 EY0039039; Unrestricted Grant Support from EyeSight Foundation of Alabama and Research to Prevent Blindness.
Disclosure: M.T. KhalafAllah, None; P.A. Fuchs, None; F. Nugen, None; M. El Hamdaoui, None; A. Levy, None; D.T. Redden, None; B.C. Samuels, Heidelberg Engineering provided Spectralis OCT2 at no cost (F); R. Grytz, Heidelberg Engineering provided Spectralis OCT2 at no cost (F)
References
- 1. Chen S-J, Lu P, Zhang W-F, Lu J-H.. High myopia as a risk factor in primary open angle glaucoma. Int J Ophthalmol. 2012; 5(6): 750–753, doi: 10.3980/j.issn.2222-3959.2012.06.18. [DOI] [PMC free article] [PubMed] [Google Scholar]
- 2. Vitale S, Ellwein L, Cotch MF, Ferris FL, Sperduto R.. Prevalence of refractive error in the United States, 1999-2004. Arch Ophthalmol. 2008; 126(8): 1111–1119, doi: 10.1001/archopht.126.8.1111. [DOI] [PMC free article] [PubMed] [Google Scholar]
- 3. Pan C-W, Dirani M, Cheng C-Y, Wong T-Y, Saw S-M.. The age-specific prevalence of myopia in Asia: A meta-analysis. Optom Vis Sci. 2015; 92(3): 258–266, doi: 10.1097/OPX.0000000000000516. [DOI] [PubMed] [Google Scholar]
- 4. Lin LLK, Shih YF, Hsiao CK, Chen CJ.. Prevalence of myopia in Taiwanese schoolchildren: 1983 to 2000. Ann Acad Med Singapore. 2004; 33(1): 27–33. [PubMed] [Google Scholar]
- 5. Holden BA, Fricke TR, Wilson DA, et al.. Global prevalence of myopia and high myopia and temporal trends from 2000 through 2050. Ophthalmology. 2016; 123(5): 1036–1042, doi: 10.1016/j.ophtha.2016.01.006. [DOI] [PubMed] [Google Scholar]
- 6. Tham Y-C, Li X, Wong TY, Quigley HA, Aung T, Cheng C-Y.. Global prevalence of glaucoma and projections of glaucoma burden through 2040: A systematic review and meta-analysis. Ophthalmology. 2014; 121(11): 2081–2090, doi: 10.1016/j.ophtha.2014.05.013. [DOI] [PubMed] [Google Scholar]
- 7. Burgoyne CF, Crawford Downs J, Bellezza AJ, Francis Suh J-K, Hart RT. The optic nerve head as a biomechanical structure: A new paradigm for understanding the role of IOP-related stress and strain in the pathophysiology of glaucomatous optic nerve head damage. Prog Retin Eye Res. 2005; 24(1): 39–73, doi: 10.1016/j.preteyeres.2004.06.001. [DOI] [PubMed] [Google Scholar]
- 8. Downs JC, Roberts MD, Sigal IA.. Glaucomatous cupping of the lamina cribrosa: A review of the evidence for active progressive remodeling as a mechanism. Exp Eye Res. 2011; 93(2): 133–140, doi: 10.1016/j.exer.2010.08.004. [DOI] [PMC free article] [PubMed] [Google Scholar]
- 9. Burgoyne CF. A biomechanical paradigm for axonal insult within the optic nerve head in aging and glaucoma. Exp Eye Res. 2011; 93(2): 120–132, doi: 10.1016/j.exer.2010.09.005. [DOI] [PMC free article] [PubMed] [Google Scholar]
- 10. Grytz R, Girkin CA, Libertiaux V, Downs JC.. Perspectives on biomechanical growth and remodeling mechanisms in glaucoma. Mech Res Commun. 2012; 42: 92–106, doi: 10.1016/j.mechrescom.2012.01.007. [DOI] [PMC free article] [PubMed] [Google Scholar]
- 11. Fazio MA, Grytz R, Morris JS, Bruno L, Girkin CA, Downs JC.. Human scleral structural stiffness increases more rapidly with age in donors of African descent compared to donors of European descent. Invest Ophthalmol Vis Sci. 2014; 55(11): 7189–7198, doi: 10.1167/iovs.14-14894. [DOI] [PMC free article] [PubMed] [Google Scholar]
- 12. Grytz R, Meschke G, Jonas JB, Downs JC.. Glaucoma and structure-based mechanics of the lamina cribrosa at multiple scales. In: Kassab GS, Sacks MS, eds. Structure-Based Mechanics of Tissues and Organs. New York: Springer; 2016: 93–122, doi: 10.1007/978-1-4899-7630-7_6. [DOI] [Google Scholar]
- 13. Downs JC, Girkin CA.. Lamina cribrosa in glaucoma. Curr Opin Ophthalmol. 2017; 28(2): 113–119, doi: 10.1097/ICU.0000000000000354. [DOI] [PMC free article] [PubMed] [Google Scholar]
- 14. Karimi A, Rahmati SM, Grytz RG, Girkin CA, Downs JC.. Modeling the biomechanics of the lamina cribrosa microstructure in the human eye. Acta Biomater. 2021; 134: 357–378, doi: 10.1016/j.actbio.2021.07.010. [DOI] [PMC free article] [PubMed] [Google Scholar]
- 15. Meng W, Butterworth J, Malecaze F, Calvas P.. Axial length of myopia: A review of current research. Ophthalmologica. 2011; 225(3): 127–134, doi: 10.1159/000317072. [DOI] [PubMed] [Google Scholar]
- 16. Diether S, Wildsoet CF.. Stimulus requirements for the decoding of myopic and hyperopic defocus under single and competing defocus conditions in the chicken. Invest Ophthalmol Vis Sci. 2005; 46(7): 2242–2252, doi: 10.1167/iovs.04-1200. [DOI] [PubMed] [Google Scholar]
- 17. Gawne TJ, Siegwart JT, Ward AH, Norton TT.. The wavelength composition and temporal modulation of ambient lighting strongly affect refractive development in young tree shrews. Exp Eye Res. 2017; 155: 75–84, doi: 10.1016/j.exer.2016.12.004. [DOI] [PMC free article] [PubMed] [Google Scholar]
- 18. Grytz R, Yang H, Hua Y, Samuels BC, Sigal IA.. Connective tissue remodeling in myopia and its potential role in increasing risk of glaucoma. Curr Opin Biomed Eng. 2020; 15: 40–50, doi: 10.1016/j.cobme.2020.01.001. [DOI] [PMC free article] [PubMed] [Google Scholar]
- 19. McBrien NA, Cornell LM, Gentle A.. Structural and ultrastructural changes to the sclera in a mammalian model of high myopia. Invest Ophthalmol Vis Sci. 2001; 42(10): 2179–2187. [PubMed] [Google Scholar]
- 20. Jeoung JW, Yang H, Gardiner S, et al.. Optical coherence tomography optic nerve head morphology in myopia I: Implications of anterior scleral canal opening versus Bruch membrane opening offset. Am J Ophthalmol. 2020; 218: 105–119, doi: 10.1016/j.ajo.2020.05.015. [DOI] [PMC free article] [PubMed] [Google Scholar]
- 21. Downs JC, Yang H, Girkin C, et al.. Three-dimensional histomorphometry of the normal and early glaucomatous monkey optic nerve head: Neural canal and subarachnoid space architecture. Invest Ophthalmol Vis Sci. 2007; 48(7): 3195–3208, doi: 10.1167/iovs.07-0021. [DOI] [PMC free article] [PubMed] [Google Scholar]
- 22. Hu G, Chen Q, Xu X, et al.. Morphological characteristics of the optic nerve head and choroidal thickness in high myopia. Invest Ophthalmol Vis Sci. 2020; 61(4): 1–6, doi: 10.1167/iovs.61.4.46. [DOI] [PMC free article] [PubMed] [Google Scholar]
- 23. Hwang YH, Yoo C, Kim YY.. Characteristics of peripapillary retinal nerve fiber layer thickness in eyes with myopic optic disc tilt and rotation. J Glaucoma. 2012; 21(6): 394–400, doi: 10.1097/IJG.0b013e3182182567. [DOI] [PubMed] [Google Scholar]
- 24. Leung CKS, Cheng ACK, Chong KKL, et al.. Optic disc measurements in myopia with optical coherence tomography and confocal scanning laser ophthalmoscopy. Invest Ophthalmol Vis Sci. 2007; 48(7): 3178–3183, doi: 10.1167/iovs.06-1315. [DOI] [PubMed] [Google Scholar]
- 25. Samarawickrama C, Mitchell P, Tong L, et al.. Myopia-related optic disc and retinal changes in adolescent children from Singapore. Ophthalmology. 2011; 118(10): 2050–2057, doi: 10.1016/j.ophtha.2011.02.040. [DOI] [PubMed] [Google Scholar]
- 26. Jeon SJ, Park HYL, Kim YC, Kim EK, Park CK.. Association of scleral deformation around the optic nerve head with central visual function in normal-tension glaucoma and myopia. Am J Ophthalmol. 2020; 217: 287–296, doi: 10.1016/j.ajo.2020.04.041. [DOI] [PubMed] [Google Scholar]
- 27. Kim T-W, Kim M, Weinreb RN, Woo SJ, Park KH, Hwang J-M.. Optic disc change with incipient myopia of childhood. Ophthalmology. 2012; 119(1): 21–26, doi: 10.1016/j.ophtha.2011.07.051. [DOI] [PubMed] [Google Scholar]
- 28. Jnawali A, Mirhajianmoghadam H, Musial G, Porter J, Ostrin LA.. The optic nerve head, lamina cribrosa, and nerve fiber layer in non-myopic and myopic children. Exp Eye Res. 2020; 195: 108041, doi: 10.1016/j.exer.2020.108041. [DOI] [PMC free article] [PubMed] [Google Scholar]
- 29. Lee KM, Choung HK, Kim M, Oh S, Kim SH.. Positional change of optic nerve head vasculature during axial elongation as evidence of lamina cribrosa shifting: Boramae Myopia Cohort Study Report 2. Ophthalmology. 2018; 125(8): 1224–1233, doi: 10.1016/j.ophtha.2018.02.002. [DOI] [PubMed] [Google Scholar]
- 30. Kim M, Choung H-K, Lee KM, Oh S, Kim SH.. Longitudinal changes of optic nerve head and peripapillary structure during childhood myopia progression on OCT: Boramae Myopia Cohort Study Report 1. Ophthalmology. 2018; 125(8): 1215–1223, doi: 10.1016/j.ophtha.2018.01.026. [DOI] [PubMed] [Google Scholar]
- 31. Lee KM, Choung HK, Kim M, Oh S, Kim SH.. Change of β-zone parapapillary atrophy during axial elongation: Boramae Myopia Cohort Study Report 3. Invest Ophthalmol Vis Sci. 2018; 59(10): 4020–4030, doi: 10.1167/IOVS.18-24775. [DOI] [PubMed] [Google Scholar]
- 32. Kim YW, Choi JJ, Girard MJAA, Mari JM, Choi DG, Park KH.. Longitudinal observation of border tissue configuration during axial elongation in childhood. Invest Ophthalmol Vis Sci. 2021; 62(4): 10, doi: 10.1167/iovs.62.4.10. [DOI] [PMC free article] [PubMed] [Google Scholar]
- 33. Guo Y, Liu LJ, Tang P, et al.. Parapapillary gamma zone and progression of myopia in school children: The Beijing Children Eye Study. Invest Ophthalmol Vis Sci. 2018; 59(3): 1609–1616, doi: 10.1167/iovs.17-21665. [DOI] [PubMed] [Google Scholar]
- 34. Norton TT. Animal models of myopia: Learning how vision controls the size of the eye. ILAR J. 1999; 40(2): 59–77, doi: 10.1093/ilar.40.2.59. [DOI] [PubMed] [Google Scholar]
- 35. Albon J, Farrant S, Akbtar S, et al.. Connective tissue structure of the tree shrew optic nerve and associated ageing changes. Invest Ophthalmol Vis Sci. 2007; 48(5): 2134–2144, doi: 10.1167/iovs.06-0084. [DOI] [PubMed] [Google Scholar]
- 36. Siegwart JT, Norton TT.. The susceptible period for deprivation-induced myopia in tree shrew. Vision Res. 1998; 38(22): 3505–3515, doi: 10.1016/S0042-6989(98)00053-4. [DOI] [PubMed] [Google Scholar]
- 37. Samuels BC, Siegwart JT, Zhan W, et al.. A novel tree shrew (Tupaia belangeri) model of glaucoma. Invest Ophthalmol Vis Sci. 2018; 59(7): 3136–3143, doi: 10.1167/iovs.18-24261. [DOI] [PMC free article] [PubMed] [Google Scholar]
- 38. John T., Siegwart J, Norton TT.. The time course of changes in mRNA levels in tree shrew sclera during induced myopia and recovery. Invest Ophthalmol Vis Sci. 2002; 43(7): 2067–2075. [PMC free article] [PubMed] [Google Scholar]
- 39. Siegwart JT, Norton TT.. Selective regulation of MMP and TIMP mRNA levels in tree shrew sclera during minus lens compensation and recovery. Invest Ophthalmol Vis Sci. 2005; 46(10): 3484–3492, doi: 10.1167/IOVS.05-0194. [DOI] [PMC free article] [PubMed] [Google Scholar]
- 40. Siegwart JT, Norton TT.. Binocular lens treatment in tree shrews: Effect of age and comparison of plus lens wear with recovery from minus lens-induced myopia. Exp Eye Res. 2010; 91(5): 660–669, doi: 10.1016/j.exer.2010.08.010. [DOI] [PMC free article] [PubMed] [Google Scholar]
- 41. El Hamdaoui M, Gann DW, Norton TT, Grytz R.. Matching the LenStar optical biometer to A-Scan ultrasonography for use in small animal eyes with application to tree shrews. Exp Eye Res. 2019; 180: 250–259, doi: 10.1016/j.exer.2018.12.008. [DOI] [PMC free article] [PubMed] [Google Scholar]
- 42. Girard MJA, Strouthidis NG, Ethier CR, Mari JM.. Shadow removal and contrast enhancement in optical coherence tomography images of the human optic nerve head. Invest Ophthalmol Vis Sci. 2011; 52(10): 7738–7748, doi: 10.1167/iovs.10-6925. [DOI] [PubMed] [Google Scholar]
- 43. Grytz R, El Hamdaoui M, Fuchs PA, et al.. Nonlinear distortion correction for posterior eye segment optical coherence tomography with application to tree shrews. Biomed Opt Express. 2022; 13(2): 1070–1086, doi: 10.1364/BOE.447595. [DOI] [PMC free article] [PubMed] [Google Scholar]
- 44. Sawada Y, Araie M, Shibata H, Ishikawa M, Iwata T, Yoshitomi T.. Optic disc margin anatomic features in myopic eyes with glaucoma with spectral-domain OCT. Ophthalmology. 2018; 125(12): 1886–1897, doi: 10.1016/j.ophtha.2018.07.004. [DOI] [PubMed] [Google Scholar]
- 45. Abbott CJ, McBrien NA, Grünert U, Pianta MJ.. Relationship of the optical coherence tomography signal to underlying retinal histology in the tree shrew (Tupaia belangeri). Invest Ophthalmol Vis Sci. 2009; 50(1): 414–423, doi: 10.1167/iovs.07-1197. [DOI] [PubMed] [Google Scholar]
- 46. Sajdak BS, Salmon AE, Cava JA, et al.. Noninvasive imaging of the tree shrew eye: Wavefront analysis and retinal imaging with correlative histology. Exp Eye Res. 2019; 185: 107683, doi: 10.1016/j.exer.2019.05.023. [DOI] [PMC free article] [PubMed] [Google Scholar]
- 47. Miki A, Ikuno Y, Weinreb RN, et al.. Measurements of the parapapillary atrophy zones in en face optical coherence tomography images. PLoS One. 2017; 12(4): e0175347, doi: 10.1371/journal.pone.0175347. [DOI] [PMC free article] [PubMed] [Google Scholar]
- 48. Dai Y, Jonas JB, Huang H, Wang M, Sun X.. Microstructure of parapapillary atrophy: Beta zone and gamma zone. Invest Ophthalmol Vis Sci. 2013; 54(3): 2013–2018, doi: 10.1167/iovs.12-11255. [DOI] [PubMed] [Google Scholar]
- 49. Kim M, Kim T-W, Weinreb RN, Lee EJ.. Differentiation of parapapillary atrophy using spectral-domain optical coherence tomography. Ophthalmology. 2013; 120(9): 1790–1797, doi: 10.1016/j.ophtha.2013.02.011. [DOI] [PubMed] [Google Scholar]
- 50. Jonas JB, Jonas SB, Jonas RA, et al.. Parapapillary atrophy: Histological gamma zone and delta zone. PLoS One. 2012; 7(10): e47237, doi: 10.1371/journal.pone.0047237. [DOI] [PMC free article] [PubMed] [Google Scholar]
- 51. Jonas JB, Jonas SB, Jonas RA, Holbach L, Panda-Jonas S. Histology of the parapapillary region in high myopia. Am J Ophthalmol. 2011; 152(6): 1021–1029, doi: 10.1016/j.ajo.2011.05.006. [DOI] [PubMed] [Google Scholar]
- 52. Jonas JB, Zhang Q, Xu L, Bin Wei W, Jonas RA, Wang YX. Parapapillary gamma zone enlargement in a 10-year follow-up: The Beijing Eye Study 2001–2011. Eye. Published online February 23, 2022: 1–7, doi: 10.1038/s41433-022-01978-8. [DOI] [Google Scholar]
- 53. Zangalli C, Costa VP.. OCT detected optic nerve head remodeling in a young adult with early progressive myopia. Am J Ophthalmol Case Reports. 2022; 26: 101535, doi: 10.1016/j.ajoc.2022.101535. [DOI] [PMC free article] [PubMed] [Google Scholar]
- 54. Miller GD, Abu-Qamar O, Salim S.. Evaluation of retinal nerve fiber layer, ganglion cell-inner plexiform layer, and optic nerve head in glaucoma suspects with varying myopia. J Glaucoma. 2021; 30(5): e213–e221, doi: 10.1097/IJG.0000000000001834. [DOI] [PubMed] [Google Scholar]
- 55. Xu L, Li Y, Wang S, Wang Y, Wang Y, Jonas JB.. Characteristics of highly myopic eyes: The Beijing Eye Study. Ophthalmology. 2007; 114(1): 121–126, doi: 10.1016/j.ophtha.2006.05.071. [DOI] [PubMed] [Google Scholar]
- 56. Zhang Q, Xu L, Bin Wei W, Wang YX, Jonas JB. Size and shape of Bruch's membrane opening in relationship to axial length, gamma zone, and macular Bruch's membrane defects. Invest Ophthalmol Vis Sci. 2019; 60(7): 2591–2598, doi: 10.1167/iovs.19-27331. [DOI] [PubMed] [Google Scholar]
- 57. Wang YX, Panda-Jonas S, Jonas JB.. Optic nerve head anatomy in myopia and glaucoma, including parapapillary zones alpha, beta, gamma and delta: Histology and clinical features. Prog Retin Eye Res. 2021; 83: 100933, doi: 10.1016/j.preteyeres.2020.100933. [DOI] [PubMed] [Google Scholar]
- 58. Ramrattan RS, Wolfs RC., Jonas JB, Hofman A, de Jong PTV.. Determinants of optic disc characteristics in a general population: The Rotterdam study. Ophthalmology. 1999; 106(8): 1588–1596, doi: 10.1016/S0161-6420(99)90457-8. [DOI] [PubMed] [Google Scholar]
- 59. Jonas JB. Optic disk size correlated with refractive error. Am J Ophthalmol. 2005; 139(2): 346–348, doi: 10.1016/j.ajo.2004.07.047. [DOI] [PubMed] [Google Scholar]
- 60. Cheung CY, Chen D, Wong TY, et al.. Determinants of quantitative optic nerve measurements using spectral domain optical coherence tomography in a population-based sample of non-glaucomatous subjects. Invest Ophthalmol Vis Sci. 2011; 52(13): 9629–9635, doi: 10.1167/iovs.11-7481. [DOI] [PubMed] [Google Scholar]
- 61. Rezapour J, Tran AQ, Bowd C, et al.. Comparison of optic disc ovality index and rotation angle measurements in myopic eyes using photography and OCT based techniques. Front Med. 2022; 9: 872658, doi: 10.3389/fmed.2022.872658. [DOI] [PMC free article] [PubMed] [Google Scholar]
- 62. Reis ASC, Sharpe GP, Yang H, Nicolela MT, Burgoyne CF, Chauhan BC.. Optic disc margin anatomy in patients with glaucoma and normal controls with spectral domain optical coherence tomography. Ophthalmology. 2012; 119(4): 738–747, doi: 10.1016/j.ophtha.2011.09.054. [DOI] [PMC free article] [PubMed] [Google Scholar]
- 63. Yang B, Ye C, Yu M, Liu S, Lam DSC, Leung CK.. Optic disc imaging with spectral-domain optical coherence tomography: Variability and agreement study with Heidelberg retinal tomograph. Ophthalmology. 2012; 119(9): 1852–1857, doi: 10.1016/j.ophtha.2012.02.033. [DOI] [PubMed] [Google Scholar]
- 64. Garas A, Vargha P, Holló G.. Automatic, operator-adjusted, and manual disc-definition for optic nerve head and retinal nerve fiber layer measurements with the RTVue-100 optical coherence tomograph. J Glaucoma. 2011; 20(2): 80–86, doi: 10.1097/IJG.0b013e3181d787fd. [DOI] [PubMed] [Google Scholar]
- 65. Hong S, Yang H, Gardiner SK, et al.. OCT-detected optic nerve head neural canal direction, obliqueness, and minimum cross-sectional area in healthy eyes. Am J Ophthalmol. 2019; 208: 185–205, doi: 10.1016/j.ajo.2019.05.009. [DOI] [PMC free article] [PubMed] [Google Scholar]
- 66. Strouthidis NG, Yang H, Reynaud JF, et al.. Comparison of clinical and spectral domain optical coherence tomography optic disc margin anatomy. Invest Ophthalmol Vis Sci. 2009; 50(10): 4709–4718, doi: 10.1167/iovs.09-3586. [DOI] [PMC free article] [PubMed] [Google Scholar]
- 67. Han JC, Choi JH, Park DY, Lee EJ, Kee C.. Deep optic nerve head morphology is associated with pattern of glaucomatous visual field defect in open-angle glaucoma. Invest Ophthalmol Vis Sci. 2018; 59(10): 3842–3851, doi: 10.1167/iovs.18-24588. [DOI] [PubMed] [Google Scholar]
- 68. Han JC, Choi JH, Park DY, Lee EJ, Kee C.. Border tissue morphology is spatially associated with focal lamina cribrosa defect and deep-layer microvasculature dropout in open-angle glaucoma. Am J Ophthalmol. 2019; 203: 89–102, doi: 10.1016/j.ajo.2019.02.023. [DOI] [PubMed] [Google Scholar]
- 69. Folgar FA, Yuan EL, Farsiu S, Toth CA.. Lateral and axial measurement differences between spectral-domain optical coherence tomography systems. J Biomed Opt. 2014; 19(1): 016014–016014, doi: 10.1117/1.JBO.19.1.016014. [DOI] [PMC free article] [PubMed] [Google Scholar]
- 70. Ctori I, Gruppetta S, Huntjens B.. The effects of ocular magnification on Spectralis spectral domain optical coherence tomography scan length. Graefe's Arch Clin Exp Ophthalmol. 2015; 253(5): 733–738, doi: 10.1007/s00417-014-2915-9. [DOI] [PubMed] [Google Scholar]
- 71. Grytz R, Fuchs P, El Hamdaoui M, McNabb RP, Kuo AN, Samuels BC.. Empirical distortion correction for posterior segment SD-OCT images in small animals. Invest Ophthalmol Vis Sci. 2020; 61(7): 4778–4778. [Google Scholar]
- 72. Lee KM, Park S-W, Kim M, Oh S, Kim SH.. Relationship between three-dimensional magnetic resonance imaging eyeball shape and optic nerve head morphology. Ophthalmology. 2021; 128(4): 532–544, doi: 10.1016/j.ophtha.2020.08.034. [DOI] [PubMed] [Google Scholar]
- 73. Abbott CJ, Grünert U, Pianta MJ, McBrien NA.. Retinal thinning in tree shrews with induced high myopia: Optical coherence tomography and histological assessment. Vision Res. 2011; 51(3): 376–385, doi: 10.1016/j.visres.2010.12.005. [DOI] [PubMed] [Google Scholar]
- 74. Jonas JB, Holbach L, Panda-Jonas S. Bruch's membrane thickness in high myopia. Acta Ophthalmol. 2014; 92: e470–e474, doi: 10.1111/AOS.12372 [DOI] [PubMed] [Google Scholar]
- 75. Bai HX, Mao Y, Shen L, et al.. Bruch´s membrane thickness in relationship to axial length. PLoS One. 2017; 12(8): e0182080, doi: 10.1371/JOURNAL.PONE.0182080. [DOI] [PMC free article] [PubMed] [Google Scholar]
- 76. Dong L, Shi XH, Kang YK, et al.. Bruch's membrane thickness and retinal pigment epithelium cell density in experimental axial elongation. Sci Rep. 2019; 9(1): 1–9, doi: 10.1038/s41598-019-43212-8. [DOI] [PMC free article] [PubMed] [Google Scholar]