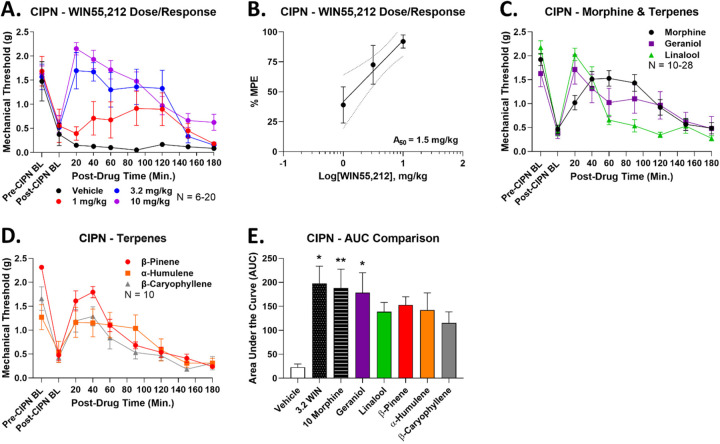
Figure 1: Terpenes are efficacious in relieving neuropathic pain.
Male and female CD-1 mice had CIPN induced and measured as described in the Methods. Data shown is the mean ± SEM, performed in 2–6 technical replicates for each experiment, with sample sizes noted in each graph. BL = baseline. A) WIN55,212 or vehicle injected (1–10 mg/kg, IP). Each dose had a vehicle comparison performed at the same time, which are all combined here. B) The data from A was normalized to %Maximum Possible Effect (%MPE) and used to construct a dose/response curve. Linear regression revealed an A50 = 1.5 mg/kg for WIN55,212 in CIPN. The dotted lines are the 95% confidence intervals for the regression. C-D) Each terpene (200 mg/kg, IP) or morphine comparison (10 mg/kg, SC) was injected. Each experiment had a morphine comparison, which are all combined here. E) The AUC for each terpene along with vehicle, morphine, and 3.2 mg/kg WIN55,212 controls are shown here. *, ** = p < 0.05, 0.01 vs. vehicle control by 1 Way ANOVA with Fisher’s Least Significant Difference post hoc test.

