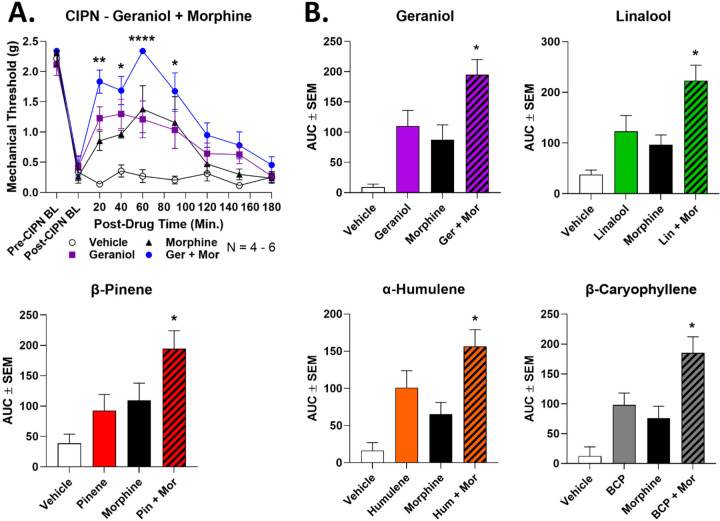
Figure 4: Terpenes enhance morphine pain relief in CIPN.
Male and female CD-1 mice had CIPN induced and measured as described in the Methods. Data shown is the mean ± SEM, performed in 2–3 technical replicates for each experiment, with sample sizes noted in each graph. BL = baseline. Vehicle, morphine (3.2 mg/kg, SC), terpene (100 mg/kg, IP) or both combined were injected, with mechanical allodynia measured. A) The time course data for geraniol is shown as an example; the curves for the other terpenes are all shown in Figure S1. *, **, **** = p < 0.05, 0.01, 0.0001 vs. same time point morphine or terpene group by RM 2 Way ANOVA with Dunnett’s post hoc test. B) The AUC data from A was calculated and is shown here. * = p < 0.05 vs. terpene or morphine group by 1 Way ANOVA with Tukey’s post hoc test.

