

Abstract
Pathogenic variants in KCNB1 are associated with a neurodevelopmental disorder spectrum that includes global developmental delays, cognitive impairment, abnormal electroencephalogram (EEG) patterns, and epilepsy with variable age of onset and severity. Additionally, there are prominent behavioral disturbances, including hyperactivity, aggression, and features of autism spectrum disorder. The most frequently identified recurrent variant is KCNB1-p.R306C, a missense variant located within the S4 voltage-sensing transmembrane domain. Individuals with the R306C variant exhibit mild to severe developmental delays, behavioral disorders, and a diverse spectrum of seizures. Previous in vitro characterization of R306C described loss of voltage sensitivity and cooperativity of the sensor and inhibition of repetitive firing. Existing Kcnb1 mouse models include dominant negative missense variants, as well as knockout and frameshifts alleles. While all models recapitulate key features of KCNB1 encephalopathy, mice with dominant negative alleles were more severely affected. In contrast to existing loss-of-function and dominant-negative variants, KCNB1-p.R306C does not affect channel expression, but rather affects voltage-sensing. Thus, modeling R306C in mice provides a novel opportunity to explore impacts of a voltage-sensing mutation in Kcnb1. Using CRISPR/Cas9 genome editing, we generated the Kcnb1R306C mouse model and characterized the molecular and phenotypic effects. Heterozygous and homozygous R306C mice exhibited pronounced hyperactivity, altered susceptibility to flurothyl and kainic acid induced-seizures, and frequent, long runs of spike wave discharges on EEG. This novel model of channel dysfunction in Kcnb1 provides an additional, valuable tool to study KCNB1 encephalopathies. Furthermore, this allelic series of Kcnb1 mouse models will provide a unique platform to evaluate targeted therapies.
Keywords: Epilepsy, Encephalopathy, Developmental Disorder, Autism Spectrum Disorder, KV2.1, Voltage-gated potassium channels, Voltage-gated ion channels
1. Introduction
Disease phenotyping in animal models is an important step for understanding many aspects of human physiological and pathological processes. This is especially true for neurological diseases that are often rare and complex, because the manifestation of disease phenotypes involves advanced dimensions of human biology such as the collective environment (i.e. neural circuitry) and time (i.e. neurodevelopment), which cannot be adequately addressed in non-animal experimental systems like cell culture or computational methods (Chesselet and Carmichael, 2012). CRISPR/Cas9 genome editing technology has enabled faster and more accurate recapitulation of human diseases in mice, and thus accelerated construction of genotype-phenotype correlations for rare diseases with genetic basis (Aida et al., 2014; Platt et al., 2014).
KCNB1 encephalopathy is a rare autosomal dominant disorder caused by pathogenic variants in the KCNB1 gene that most often arise de novo in the affected child. Individuals with KCNB1 encephalopathy present with global developmental delay in infancy or early childhood accompanied by features of autism spectrum disorder, abnormal EEG patterns, and development of epilepsy in most children, although epilepsy severity and treatment response are variable (Bar et al., 2020a; Bar et al., 2020b; de Kovel et al., 2017; Kang et al., 2019; Saitsu et al., 2015; Scheffer and Liao, 2020; Thiffault et al., 2015; Torkamani et al., 2014). KCNB1, encoding the KV2.1 voltage-gated potassium channel alpha subunit, is a critical contributor to neuronal repolarization and homeostasis (Murakoshi and Trimmer, 1999). The majority of KCNB1 variants studied thus far in heterologous cells and cultured neurons have been shown to confer an ultimate outcome of loss-of-function (LoF) that prevents the channel from conducting K+ ions across the plasma membrane (Kang et al., 2019; Saitsu et al., 2015; Thiffault et al., 2015). Although the ultimate outcome is largely LoF, there are several classes of underlying mechanisms that lead to diminished channel function, including defective KV2.1 synthesis, trafficking, or function. Targeted therapies tailored to the specific mechanism can improve patient outcomes (Haq et al., 2022; Tian et al., 2022), highlighting the important of representing these different mechanisms in preclinical animal models. Variants modeled in mice to date have focused on those that affect KV2.1 expression, including Kcnb1G379R, Kcnb1R312H and Kcnb1 null and frameshift alleles (Bortolami et al., 2022; Hawkins et al., 2021; Speca et al., 2014). KCNB1-p.G379R exhibited a dominant-negative LoF phenotype with altered ion-selectivity in CHO-K1 cells (Torkamani et al., 2014), and recapitulated dominant-negative cellular phenotypes, epilepsy, background EEG abnormalities and neurobehavioral symptoms in mice (Hawkins et al., 2021). KCNB1-p.R312H exhibited a LoF phenotype with deficient cell surface expression in CHO-K1 cells, and diminished KV2.1 protein and seizures in knock-in mice (Bortolami et al., 2022; Kang et al., 2019).
KCNB1-p.R306C represents another major class of channel dysfunction, diminished function due to altered voltage-sensing, and is one of the most recurrent variants (Kang et al., 2019). At least six cases with KCNB1-p.R306C have been described in the literature and severity of the associated phenotypes ranges from mild developmental disability with absence epilepsy to severe developmental disability with intractable epilepsy that includes multiple seizure types (Bar et al., 2020a; de Kovel et al., 2017; Kang et al., 2019; Saitsu et al., 2015). Arginine 306 is one of the positively charged residues in the S4 transmembrane domain that is critical for voltage-sensor function of the KV2.1 channel (Catacuzzeno and Franciolini, 2022). Functional studies of the R306C variant in heterologous expression systems showed normal cell surface expression, but loss of KV2.1 channel current and shifts in voltage-dependence of activation (Kang et al., 2019; Saitsu et al., 2015). Consistent with this, transient overexpression in primary cultured cortical pyramidal neurons resulted in lower sensitivity and cooperativity of the voltage sensor and severely impaired capacity for repetitive firing (Saitsu et al., 2015). To model KV2.1 voltage-sensor dysfunction in vivo, we generated and characterized a novel Kcnb1R306C mouse line using CRISPR/Cas9 genome editing (Platt et al., 2014). We evaluated the effects of heterozygosity and homozygosity for the R306C variant on KV2.1 expression and localization in cultured neurons, as well as seizure susceptibility, EEG, and locomotor activity in behaving mice. Although expression and localization of KV2.1 was unaffected, Kcnb1R306C mice displayed hyperactivity, altered susceptibility to induced seizures by flurothyl and kainic acid (KA), and significant EEG abnormalities. Thus, Kcnb1R306C mice recapitulate key features of KCNB1 encephalopathy and will be a useful platform for studying disease mechanisms, probing variable expressivity, and evaluating potential therapies.
2. Methods
2.1. Mice
Gene editing was performed in fertilized C57BL/6J embryos via electroporation of CRISPR components. The Cas9 protein was complexed with a CRISPR guide RNA (gRNA), which generated DNA double strand break in exon 2 of the Kcnb1 gene. A single-stranded donor oligonucleotide (ssODN) was included in the reaction to introduce the R306C point mutation via homology dependent repair (HDR): gRNA sequence: 5’ GGGCCAACTTCAGGATGCGC 3’ The ssODN sequence is as follows: 5’CTGCGCAGCGTGAAGCCCAAGGACTGCAGACCGGTGGAGTGGCGGGCCAACTTCAGGATGCaCAGaATGCGCATGATGCGGAAGATCTGGACCACACGGCGCACATTCTGGAACTGCAGC 3’. This was designed as an antisense sequence, complementary to the sense (coding) strand. Highlighted in green is a change in the coding sequence from CGC→tGC, resulting in the Kcnb1 R306C point mutation upon ssODN mediated HDR. Highlighted in teal is a silent mutation changing coding of the Ile from ATC-ATt which disrupts the protospacer adjacent motif (PAM, −NGG) site preventing re-cutting of the site once ssODN mediated HDR occurs.
For the CRISPR components we used the AltR-Cas9 system (Integrated DNA Technologies, Inc. (IDT), Coralville, Iowa). Briefly, the gRNA was custom synthesized as crRNA and complexed with tracrRNA (IDT, 1070532) to form the gRNA complex. It was combined with HiFidelity Cas9 protein (IDT, 1081064) to form the ribonucleotide protein complex (RNP). The 120 nucleotide ssODN (IDT) was added to the reaction mixture after RNP formation, prior to electroporation. The final concentration of the electroporation mixture was 3uM Cas9, 3uM gRNA, 10uM ssODN.
Potential founders were screened by PCR of genomic DNA with primers outside of the homology region for the repair oligo (Table 1). PCR products were cloned into pCR-TOPO (ThermoFisher) and Sanger sequenced. The mosaic R306C founder was backcrossed to C57BL/6J mice (Jackson Labs, #000664, Bar Harbor, ME) to generate N1 offspring. The N1 offspring were genotyped by Sanger sequencing to confirm transmission of the R306C editing event and absence of off-target events at predicted sites with <3 mismatches. N1 males with the confirmed on-target event and without predicted off-target events were bred with C57BL/6J females to establish the line Kcnb1em3Kea (MGI: 675522), which has been maintained as an isogenic strain on C57BL/6J by continual backcrossing of Kcnb1R306C heterozygous mice (abbreviated Kcnb1C/+) with inbred C57BL/6J mice. For experiments, male and female Kcnb1C/+ mice were intercrossed to generate Kcnb1+/+ wildtype (WT), heterozygous Kcnb1C/+ (C/+), and homozygous Kcnb1C/C (C/C) mice.
Table 1.
List of Primers
| Assay | Description | Sequence |
|---|---|---|
|
| ||
| Founder Screening PCR | Kcnb1 Primer 1 | 5’-TTGTCCTCTCCACCATTGCC |
| Kcnb1 Primer 2 | 5’-AGTCTTAGGGTAGATGTCTCCGT | |
|
| ||
| RFLP Genotyping (BsmI digest) | Kcnb1 Primer 3 | 5’-TTGTGTGAGAGCCATGCTGT |
| Kcnb1 Primer 2 | 5’-AGTCTTAGGGTAGATGTCTCCGT | |
Mice were maintained in a Specific Pathogen Free (SPF) barrier facility with a 14-h light/10-h dark cycle and access to food and water ad libitum. Both female and male mice were used for all experiments. All animal care and experimental procedures were approved by the Northwestern University Animal Care and Use Committees in accordance with the National Institutes of Health Guide for the Care and Use of Laboratory Animals. The principles outlined in the ARRIVE (Animal Research: Reporting of in vivo Experiments) guideline was considered when planning experiments (Percie du Sert et al., 2020).
2.2. Genotyping
Mice were genotyped by PCR of genomic DNA isolated from tail biopsies, using a restriction fragment length polymorphism (RFLP) assay. Genomic DNA was amplified using RFLP genotyping primers (Table 1), followed by restriction digest with BsmI for at least 15 minutes at 65°C. Digestion resulted in 402 bp and 253 bp products for the mutant allele and 655 bp for the WT allele.
2.3. Transcript Analysis
Forebrain isolated from male and female WT, Kcnb1C/+ and Kcnb1C/C mice at postnatal days 58–83 (P58–83) was used for total RNA extraction using TRIZol reagent according to the manufacturer’s instructions (Invitrogen). First strand cDNA was synthesized using 4 μg of RNA using oligo(dt) primer and Superscript IV according to the manufacturer’s instructions (Life Technologies). First strand cDNA samples were diluted 1:10 and 5 μL was used as template with ddPCR Supermix for Probes (No dUTP) (Bio-Rad) and TaqMan Gene Expression Assays (Life Technologies) for mouse Kcnb1 (FAM-MGB-Mm00492791_m1) and Tbp (normalization control; VIC-MGB-Mm00446971_m1). Reactions were partitioned into a QX200 droplet generator (Bio-Rad) and then amplified using PCR conditions: 95 °C for 10 min, 44 cycles of 95 °C for 30 s and 60 °C for 1 min (ramp rate of 2 °C/s) with a final inactivation step of 98 °C for 5 min. Following amplification, droplets were analyzed with a QX200 droplet reader and QuantaSoft vl.6.6 software (Bio-Rad). Relative transcript levels were expressed as a ratio of Kcnb1 to Tbp with WT normalized to 1 and included 14–16 biological replicates per genotype. Normality of transcript and protein expression was assessed by D’Agostino & Pearson test and statistical comparison between groups was made using the nonparametric test Kruskal-Wallis with Dunn’s post-hoc comparisons (GraphPad Prism v9.4.1, Graph Pad Software, San Diego, CA). Both assays lacked detectable signal in genomic, no-RT and no template controls.
2.4. Immunoblotting
Forebrain P3 membrane protein fractions were isolated from male and female WT, Kcnb1C/+ and Kcnb1C/C mice at P58–83. Membrane fractions (50 μg) were separated on a 7.5% SDS-PAGE gel and transferred to nitrocellulose. Blots were probed with anti-KV2.1 (K89/34) and anti-mortalin/GRP75 antibodies (Table 2). Alexa Fluor 790 goat anti-mouse antibodies (Table 2) were used to detect signal on an Odyssey imaging system (LI-COR). Relative protein levels were determined by densitometry using Image Studio (LI-COR) and expressed as a ratio of KV2.1 to GRP75 with WT normalized to 1 and included 7–14 biological replicates per genotype. Normality of transcript and protein expression was assessed by D’Agostino & Pearson test and statistical comparison between groups was made using the nonparametric test Kruskal-Wallis with Dunn’s post-hoc comparisons (GraphPad Prism).
Table 2.
List of Antibodies
| Antibody | Immunogen | Manufacturer Information | Concentration/Dilution Used | RRID |
|---|---|---|---|---|
| K89/34 (KV2.1) | Synthetic peptide aa 837–853 of rat KV2.1 | NeuroMab; mouse IgG1 monoclonal | 2 μg/mL (WB) 1:1000 (ICC) | AB_10673392 |
| N52A/42 (GRP75/mortalin) | Identified as off-target mAb in screen for anti-SALM2 mAbs | NeuroMab; Mouse IgG1 mAb | 1 μg/mL (WB) | AB_2120479 |
| ab32454 (Map2) | Synthetic peptide within Rat MAP2 aa 1–100 (N terminal) | Abcam; rabbit polyclonal | 1:1000 (ICC) | AB_776174 |
| 386 003 (Ankyrin G) | Recombinant protein corresponding to AA 1784 to 1961 from mouse AnkyrinG | Synaptic Systems; rabbit polyclonal | 1:2000 (ICC) | AB_2661876 |
| 111-655-144 (Rabbit IgG) | Rabbit IgG | Jackson ImmunoResearch; goat anti-rabbit IgG (H+L) cross-adsorbed secondary antibody, conjugated with Alexa Fluor 790 | 1:10,000 (WB) | AB_2338086 |
| A-21121 (Mouse IgG) | Mouse IgG1 | Thermo Fisher; goat anti-mouse IgG1 cross-adsorbed secondary antibody, conjugated with Alexa Fluor 488 | 1:2000 (ICC) | AB_2535764 |
| A-21245 (Rabbit IgG) | Rabbit IgG | Thermo Fisher; goat anti-rabbit IgG (H+L) highly cross-adsorbed secondary antibody, conjugated with Alexa Fluor 647 | 1:2000 (ICC) | AB_2535813 |
WB, western blot; ICC, immuncytochemistry
2.5. Primary neuron cultures
P0–1 pups were rapidly genotyped using the RFLP genotyping assay as described above. Hippocampal neurons were harvested and plated on poly-D-lysine-coated coverslips (GG-12-15-PDL; Neuvitro, Vancouver WA) at a density of 0.25–0.30×10e6 cells per well, maintained in Neurobasal medium supplemented with B-27 and Culture One (17504044 and A3320201; Gibco, Waltham, MA), with weekly half-volume media changes for 2–3 weeks. At least 3 independent cultures of 2 to 3 mice of each genotype were used for immunocytochemistry.
2.6. Immunocytochemistry and image analyses
At DIV18-21, coverslips were fixed using Cytofix/Cytoperm (554714; BD biosciences, San Jose CA) containing 4% sucrose (w/v) followed by additional permeabilization with 0.25% Triton X100 when necessary For Ankyrin G (AnkG) staining, two additional washes with 0.5% CHAPS (C3023; Sigma) in PermWash/PBS-T (PBS+tween-20) for 5 min were conducted. Coverslips were blocked with 10% normal goat serum for 30 mins. Incubations with primary antibodies for KV2.1 and Map2 or AnkG (Table 2) was performed in PermWash/PBS-T overnight at room temperature. Coverslips were then incubated with secondary antibodies (Table 2) diluted in PermWash/PBS-T + 10% NGS for 1–2h, followed by DAPI staining for 10 minutes. Coverslips were then mounted on glass slides using prolong gold antifade reagent (P36934; Invitrogen).
Images were acquired using a Nikon W1 spinning disk confocal and Hamamatsu camera in the Center for Advanced Imaging at Northwestern University. ND2 files were processed and analyzed using NIS elements software (Nikon). Images were identically processed in Adobe Photoshop (v23.2.1) for figure production.
Approximately 15 to 23 axon initial segment (AIS) measurements were taken from 10 to 12 randomly selected images at 60x magnification. For each genotype, 3 to 4 coverslips were evaluated.
2.7. Open field assay
Baseline locomotor activity was measured in P70–91 male and female WT, Kcnb1C/+ and Kcnb1C/C using an open field assay. Male and female mice were tested separately with at least a 1 h delay between sessions. Prior to behavioral testing, mice were acclimated in the behavior suite with white noise for 1 h. Each mouse was placed at the center of the open field arena (46cm × 46 cm) and video monitored for 30 min. Video records were analyzed offline using Ethovision XT software (Noldus Information Technology, Leesburg, VA, USA) by a reviewer blinded to genotype. Distance traveled, number of zone transitions and % time spent in center of arena for each trial were compared with one or two-way ANOVA with Tukey’s post hoc comparisons. No difference in sex was detected, therefore groups were by collapsed across sex (n=14–17 mice per genotype).
2.8. Seizure induction
2.8.1. Flurothyl seizure induction
Susceptibility to seizures induced by the chemoconvulsant flurothyl (Bis(2,2,2-trifluoroethyl) ether, Sigma-Aldrich, St. Louis, MO) was tested in male and female WT, Kcnb1C/+ and Kcnb1C/C at P72–90 as previously described (Echevarria-Cooper et al., 2022; Hawkins et al., 2021). Briefly, mice were placed in a Plexiglas chamber (2.2 L) and flurothyl was introduced using a syringe pump (20 uL/min) and allowed to volatilize. Latencies to first myoclonic jerk, generalized tonic-clonic seizure (GTCS) with loss of posture, and time interval between these phases were compared using Kruskal-Wallis with Dunn’s post-hoc comparisons. No difference in sex was detected, therefore groups were collapsed across sex (n=33–40 mice per genotype).
2.8.2. Kainic Acid seizure induction
Susceptibility to seizures induced by the chemoconvulsant KA (kainic acid, Cat #0222, Tocris Bioscience, Minneapolis, MN) was tested in WT, Kcnb1C/+ and Kcnb1C/C mice at P41–50. KA dissolved in saline was administered by intraperitoneal injection (25 mg/kg) and mice were video recorded for 2 hours. Videos were scored offline by reviewers blinded to genotype using a modified Racine scale (Racine, 1972) (1- behavioral arrest; 2- forelimb and/or Straub tail, facial automatisms; 3- automatisms, including repetitive scratching, circling, forelimb clonus without falling; 4- forelimb clonus with rearing and/or falling, barrel roll; 5- repetition of stage 4; 6- generalized tonic-clonic seizure, wild running and/or jumping; 7- death). Latencies to the first occurrence of each stage and the highest seizure stage reached within 5 minutes bins were determined from video records by reviewers blinded to genotype. Latency to death following KA injection was compared by log-rank Mantel-Cox time to event analysis. Severity within time bins was compared between mutant alleles and WT by two-way ANOVA with Tukey’s post hoc comparisons. No difference in sex was identified, therefore groups were collapsed across sex (n=12–19 mice per genotype).
2.9. Video-EEG Monitoring
At 19–21 weeks of age, male and female WT, Kcnb1C/+ and Kcnb1C/C mice were implanted with EEG headmounts (8201, Pinnacle Technology, Lawrence, KS) under ketamine/xylazine anesthesia. Headmounts with four stainless steel screws that served as cortical surface electrodes were affixed to the skull with glass ionomer cement. Anterior screw electrodes were 0.5–1 mm anterior to bregma and 1 mm lateral from the midline. Posterior screws were 4.5–5 mm posterior to bregma and 1 mm lateral from the midline. EEG1 represents recordings from right posterior to left posterior (interelectrode distance ≈2 mm) and EEG2 represents recordings from right anterior to left posterior (interelectrode distance ≈5 mm). The left anterior screw served as the ground connection. Following at least 48 h of recovery, tethered EEG and video data were continuously collected for 7 to 14 days from freely moving mice with Sirenia acquisition software (Pinnacle Technology). Individual files were packeted into approximately 24-to-96-hour segments. EEG records were assigned a randomly generated code to blind reviewers to genotype during analysis. One file per mouse was chosen for manual review, and each file reviewed had a total average EEG baseline <75 μV with a low artifact incidence. On average, 67.5 hours of EEG data were analyzed from each subject (WT: 45–91 h/mouse (n = 4 mice); Kcnb1C/+: 47–73 h/mouse (n = 6 mice); Kcnb1C/C: 70–74 h/mouse (n = 5 mice)). EEG data between 0.5 and 200 Hz were acquired at a sampling rate of 400 Hz. Raw data was notch filtered around 60 and 120 Hz prior to analysis. Video-EEG records were manually reviewed for electrographic seizures (≥2x baseline; ≥10 sec; evolution in frequency and amplitude) and epileptiform discharges, including spike trains. Spike trains were defined as having regular, rhythmic sharp spike and slow wave components with ≥1 SWD per second continuing for ≥5 seconds, between 1–2.5 Hz frequencies.
2.10. EEG spectral analysis
To quantify baseline EEG activity and generate spectral arrays from Figures 5 and 6, we used a Fast Fourier Transform (FFT) algorithm with an FFT size of 1024, 93.75% overlap window and Hann-Cosine-Bell fit, which generated approximately 330 frequency data points between 0–128 Hz. After visual inspection to exclude artifacts, we used Lab Chart v.8.1.19 (DSI) for spectral analysis and max power frequency data. Power analysis was performed on EEG baseline recordings for each file selected. PSD values were generated from 13-h segments during the light cycle (1–3 PSDs/mouse, 9–11 PSDs/genotype) and a 9-h segment during the dark cycle (2–4 PSDs/mouse, 13–17 PSDs/genotype). All PSD frequencies (per genotype) were analyzed for outliers by ROUTs. Statistical analysis was performed for each frequency band, delta (0.1–4 Hz), theta (5–8 Hz), alpha (8–13 Hz) and beta (14–29 Hz), using Two-way ANOVA with Tukey’s multiple comparison test. Maximum power frequency was calculated for each light or dark cycle segment reviewed (Lab Chart v.8.1.19). Light and dark values for each genotype were compared using Student’s T-test or Mann-Whitney. There were no significant differences between light or dark; therefore, all light and dark maximum frequency values were combined for each genotype, with 22–24 values per genotype.
Figure 5.

EEG abnormalities in Kcnb1C/+ and Kcnb1C/C mice. (A) EEG trace of the single GTC seizure identified in a Kcnb1C/+ mouse with corresponding spectral density array. Corresponding with the electrographic seizure, the Kcnb1C/+ mouse displayed head bobbing and facial automatisms. All observable behaviors concluded when the baseline EEG activity returned to normal. One additional GTCS was detected in a Kcnb1C/C mouse with similar electrographic and behavioral manifestations. (B-D) Top trace represents a two-hour segment of continuous spike-wave discharges identified in a Kcnb1C/+ mouse with corresponding spectral density array (B). Red line represents a ~7-minute segment expanded in panel C and the purple line represents a ~40 second segment expanded in panel D. (E-G) Top trace represents a ~30-minute segment of continuous spike-wave discharges identified in a Kcnb1C/C mouse with corresponding spectral density array (E). Red line represents a ~7-minute trace expanded in panel F and purple line represents a ~ 40 second expanded in panel G.
Figure 6.

Abnormal EEG power in Kcnb1C/+ and Kcnb1C/C mice. (A) Spike train frequency and durations for Kcnb1R306C mice. During manual review of EEG records (45–91 hrs per mouse), four Kcnb1C/+ (66%) and 3 Kcnb1C/C (60%) mice exhibited recurrent spike trains of various durations, while never detected in the EEG files reviewed from WT mice. Bars represent median length of spike trains. Symbols represent durations of individual trains. Left side shows trains during wakeful behavior and right side shows trains during restful behavior. (B) Max power frequency for WT, Kcnb1C/+ and Kcnb1C/C mice. WT mice had a calculated average max power frequency of 3.6 ± 0.4 Hz, while Kcnb1C/+ averaged 2.3 ± 0.2 Hz (*p < 0.03) and Kcnb1C/C averaged 2.6 ± 0.4. Bars represent mean and error bars SEM. Symbols represent individual values. No difference in max frequency was detected between light and dark cycles, therefore they were combined, resulting in 22–24 values per genotype. P values calculated by one-way ANOVA with Tukey’s. (C) Power spectra in Kcnb1 mice. Power band comparisons for delta (0.4 – 4 Hz) theta (4 – 8 Hz), alpha (8 – 13 Hz) and beta (13 – 30 Hz) during light and dark phases. In the light phase, compared to WT, Kcnb1C/+ mice had elevated PSD in the delta (p < 0.0001), theta (p < 0.002), alpha (p < 0.0003) and beta (p < 0.0001) frequency bands, while Kcnb1C/C mice had elevated beta PSD (p < 0.0001) compared to WT. In the dark phase, compared to WT, Kcnb1C/+ had elevated PSD across all frequency bands (p < 0.0001), while Kcnb1C/C had elevated PSD in the alpha (p < 0.02) and beta (p < 0.0001) frequency bands. PSD represents average power from n = 4–6 mice per genotype, with 9–17 values per frequency. Symbols represent average frequency and error bars are SEM. Black asterisks represent significance between Kcnb1C/+ and Kcnb1C/C, red asterisks represent significance between WT and Kcnb1C/C and blue asterisks represent significance between WT and Kcnb1C/+. P values calculated by two-way ANOVA with Tukey’s.
2.11. Statistical analysis
Table 3 summarizes statistical tests used for all comparisons along with computed values. Values for post-hoc tests are reported in the results and figure legends. No significant differences were detected between sexes on reported measures; thus, groups were collapsed across sex variables.
Table 3.
Summary of Statistical Comparisons
| Figure | Comparison | Test | Value | Post-Hoc |
|---|---|---|---|---|
| 1b | Transcript | Kruskal-Wallis | P=0.2827 | n/a |
| 1c | Protein | Kruskal-Wallis | P=0.6821 | n/a |
| 2b | AIS length | One-way ANOVA | F(2,177) = 1.807, P=0.1671 | n/a |
| 3a | Open Field Total Distance | One-way ANOVA | F(2,44) = 20.60, P<0.0001 | Tukey’s |
| 3b | Open Field 10-minute Bins | Two-way repeated measures ANOVA | F(2,44) = 19.11, P<0.0001, Genotype; F(3.821,168.1) = 119.0, P<0.0001, Time; F(10,220) = 0.6897, P=0.7336, Interaction | Tukey’s |
| 4a | Flurothyl - MJ latency | Kruskal-Wallis | H(2) = 12.28, P=0.0022 | Dunn’s |
| 4b | Flurothyl - GTCS latency | Kruskal-Wallis | H(2) = 35.83, P<0.0001 | Dunn’s |
| 4c | Flurothyl - MJ-GTCS interval | Kruskal-Wallis | H(2) = 13.50, P=0.0012 | Dunn’s |
| 4d | KA Latency | Two-way repeated measures ANOVA | F(5,209) = 31.48, P<0.0001, Genotype; F(5, 209) = 44.12, P<0.0001, Racine Score; F(10, 209) = 4.921, p<0.0001, Interaction | Tukey’s |
| 4e | KA- Survival | Mantel-Cox | P<0.0001 | n/a |
| 6b | Max Frequency – Light Phase T vs Kcnb1C/+ | One-way ANOVA | F(2,66)=4.262 p<0.02 | Tukey’s |
| 6c | Delta band – Dark Phase | Two-way ANOVA (main effects - genotype) | F(2,377) = 32.61, P<0.0001 | Dunnet’s |
| Theta band – Dark Phase | Two-way ANOVA (main effects - genotype) | F(2,390) = 39.6, P<0.0001 | Dunnet’s | |
| Alpha band – Dark Phase | Two-way ANOVA (main effects - genotype) | F(2,423) = 28.16, P<0.0001, Genotype | Dunnet’s | |
| Beta band – Dark Phase | Two-way ANOVA (main effects - genotype) | F(2,1943) = 109.6, P<0.0001 | Dunnet’s | |
| Delta band – Light Phase | Two-way ANOVA (main effects - genotype) | F(2,2620) = 19.19, P<0.0001 | Dunnet’s | |
| Theta band – Light Phase | Two-way ANOVA (main effects - genotype) | F(2,283) = 8.421, P=0.0003 | Dunnet’s | |
| Alpha band – Light Phase | Two-way ANOVA (main effects - genotype) | F(2,288) =7.928, P=0.0004 | Dunnet’s | |
| Beta band – Light Phase | Two-way ANOVA (main effects - genotype) | F(2,1309) =38.35, P<0.0001 | Dunnet’s |
n/a = not applicable
3. Results
Previous functional studies showed altered voltage-dependence of KV2.1 channels incorporating the R306C variant (Kang et al., 2019; Saitsu et al., 2015). In transfected CHO-K1 cells, despite normal cell surface expression of KV2.1, R306C effects ranged from complete loss of delayed rectifier potassium currents when singly expressed to partial loss of function and altered voltage-dependence when co-expressed with WT to approximate the heterozygous condition (Kang et al., 2019). Transfection into cultured cortical pyramidal neurons resulted in lower sensitivity and cooperativity of the voltage sensor and severely impaired repetitive firing (Saitsu et al., 2015). These effects on channel function are unique compared to other variants modeled in mouse to date, including the dominant-negative pore variant Kcnb1G379R, the trafficking defective variant Kcnb1R312H, Kcnb1 knockout mice (Kcnb1−/−), or premature termination codon Kcnb1fs mice (Bortolami et al., 2022; Hawkins et al., 2021; Speca et al., 2014). Furthermore, the R306C variant has a high rate of recurrence in patient cohorts. Taken together, these observations made R306C a high priority variant for in vivo modeling.
3.1. Generation and initial characterization of Kcnb1R306C mice
Kcnb1R306C mice on the C57BL/6J inbred strain were generated using CRISPR/Cas9 to introduce the modification of arginine 306 (same codon number in human and mouse) by HDR. Sequencing chromatograms of Kcnb1 genomic PCR products showing the WT and R306C variant alleles are shown in Figure 1A. Expression analyses of bulk forebrain tissue revealed no significant differences in the Kcnb1 transcript or KV2.1 protein expression across the three genotypes: WT, heterozygous Kcnb1R306C/+ (Kcnb1C/+) and homozygous Kcnb1R306C/R306C (Kcnb1C/C) (Fig. 1B–D; p > 0.2, Kruskal-Wallis). Thus, the R306C variant does not affect KV2.1 expression levels, consistent with prior studies in CHO-K1 cells (Kang et al., 2019).
Figure 1.

Characterization of Kcnb1-p.R306C variant allele. (A) Chromatogram confirmation of Kcnb1 R306C genomic PCR product. Genomic PCR products were TOPO cloned and Sanger sequenced. The top trace represents a WT allele with 100% identity to the mouse C57BL/6J reference genome (GRCm39). The bottom trace shows a mutated allele (Mut) that encodes p.R306C, as well as a silent mutation to destroy the PAM site (p.I304=). (B-C) Transcript (B) and protein (C) expression levels did not differ between genotypes genotypes (p=0.28 and 0.68 respectively, Kruskal-Wallis). Symbols represent samples from individual mice, line represents median and error bars represent 95% confidence interval. (D) A representative western blot of forebrain membrane proteins probed for Kv2.1 protein and GRP75 as a normalization control show no difference. Kcnb1fs/fs that results in truncated protein with absent epitope was used as a negative control.
3.2. Normal expression and localization of KV2.1 in R306C cultured hippocampal neurons
To assess the impact of the Kcnb1R306C variant on KV2.1 expression in neurons, we performed immunolabeling of cultured hippocampal neurons (DIV16-18) isolated from WT, Kcnb1C/+ and Kcnb1C/C mice. The Kcnb1R306C variant had no overt effect on expression or subcellular localization of KV2.1. Robust clustering in the soma and proximal processes was present across all genotypes, indicating that the R306C variant does not impair localization or cluster formation (Fig. 2A). Co-immunolabeling with MAP2 or Ankyrin-G was consistent with KV2.1 localization in proximal dendrites and AIS, respectively, across all genotypes (Fig. 2A). One hallmark of KV2.1 expression in neurons is its early and robust expression in the proximal AIS, a critical site for regulation of neuronal polarity. Therefore, we measured AIS length to determine if Kcnb1-p.R306C affected AIS maturation. AIS length measurements were not different across genotypes (Fig. 2B) (F(2,177) = 1.807, p = 0.1671, one-way ANOVA).
Figure 2.
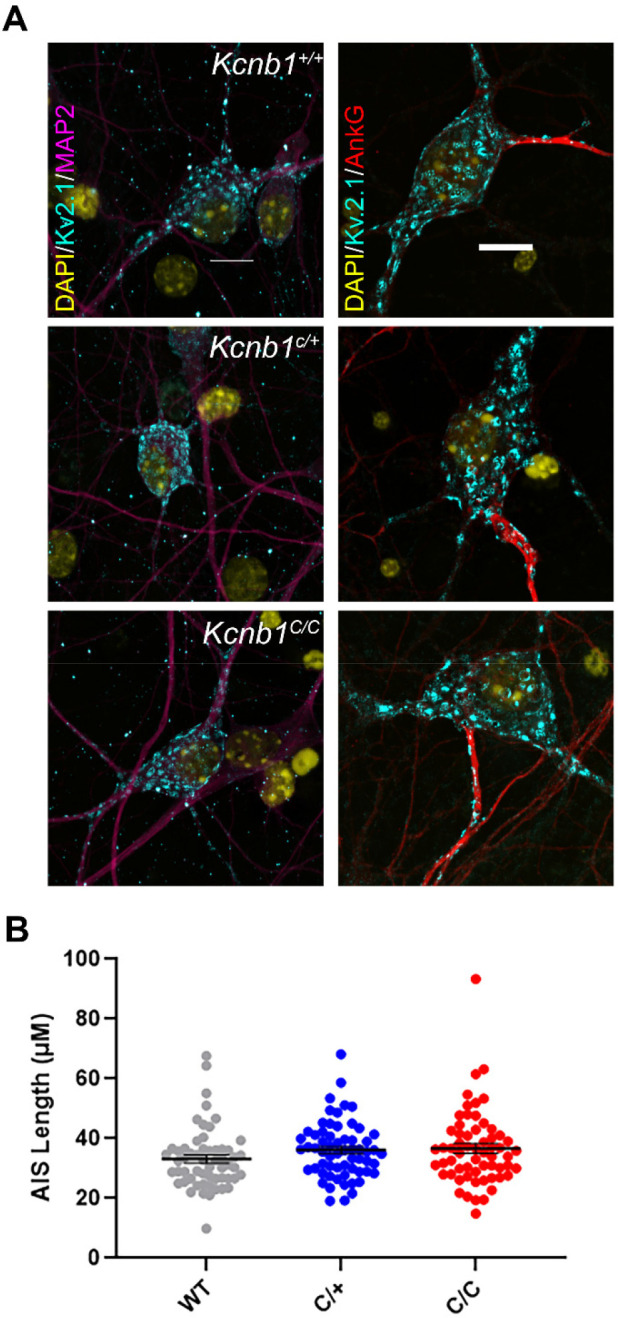
Subcellular localization Kv2.1 in cultured hippocampal neurons. (A) Cultured hippocampal neurons were immuno-labeled with Kv2.1 and neuronal processes (MAP2 for dendrites and AnkG for axon initial segment); 40x magnification for MAP2 and 60x for AnkG staining. (B) Length measurements of AIS were not different across different genotypes (p = 0.1671, one-way ANOVA; n = 57–62 per genotype).
3.3. Locomotor hyperactivity in Kcnb1R306C mice
Differences in locomotor activity levels between Kcnb1R306C and WT mice was evident in their home cages during routine husbandry and was reminiscent of the profound hyperactivity observed in Kcnb1G379R and Kcnb1−/− mice (Hawkins et al., 2021; Speca et al., 2014). To quantify this effect, we measured baseline locomotor activity in a 30-minute open field assay. Both Kcnb1C/+ and Kcnb1C/C mice traveled farther in the open field than WT littermate controls (F(2,44) = 20.6, p < 0.0001, one-way ANOVA). WT mice traveled an average distance of 121.4 ± 4.1 m, while Kcnb1C/+ and Kcnb1C/C traveled 155.1 ± 5.4 and 164.7 ± 5.4 m, respectively (Fig. 3A,E). Distance traveled was consistently elevated over the course of the 30-minute period in Kcnb1C/+ and Kcnb1C/C mice compared to WT, while all genotypes showed similar short-term habituation (Fig. 3B). The number of zone transitions and time spent in the arena center were assessed as a rudimentary evaluation for anxiety within the open field setting. The total number of zone transitions was affected by Kcnb1 genotype (F(2,44) = 4.86 p < 0.02; one-way ANOVA). Kcnb1C/+ mice crossed the testing arena an average of 207.4 ± 13.5 times in 30 minutes (p < 0.02), while WT and Kcnb1C/C mice crossed an average of 150.6 ± 10.8 times and 192.5 ± 16.6, respectively (Fig. 3C,E). However, there was no difference between genotypes for the percentage of time spent in the center of the arena (Fig. 3D).
Figure 3.

Kcnb1R306C mice have elevated exploratory locomotion in open field assay. (A) Total distance traveled in 30 minutes was affected by genotype (F(2,44) = 20.6, p < 0.0001; one-way ANOVA; ****p < 0.0001, Tukey’s). (B) Locomotion assessed in 10-minute bins across the 30-minute session. Kcnb1C/+ and Kcnb1C/C mice had elevated distance at all time points compared to WT (F(2,44) = 19.11, p < 0.0001; Two-way repeated measures ANOVA, Genotype). All groups showed similar habituation, with locomotion slowing over time and no significant genotype-by-time interaction (see Table 3). (C) Total number of zone transitions was affected by genotype (F(2,44) = 4.86, p < 0.02; one-way ANOVA; *p < 0.02, Tukey’s). (D) Time spent in the center of area was not affected by genotype (F(2,44) = 1.201, p > 0.31). (E) Representative examples of open field paths for WT, Kcnb1C/+ and Kcnb1C/C mice. For A, C and D, symbols represent individual mice and horizontal lines represent mean. Symbols in B represent group means. Error bars represent SEM (A-D).
3.4. Altered seizure susceptibility in Kcnb1R306C mice
Previous studies showed enhanced seizure susceptibility in Kcnb1G379R and Kcnb1−/− knockout mice (Hawkins et al., 2021). In order to compare with other Kcnb1 mouse models, we asked how the R306C variant affects seizure susceptibility using two chemoconvulsants, flurothyl and KA. First, we used the GABAA antagonist flurothyl to induce a stereotyped progression that begins with a myoclonic jerk (MJ) as the first seizure sign and progresses to a GTCS. Latency for flurothyl-induced seizures was affected differently by mutant allele dosage. Kcnb1C/+ mice exhibited longer latencies to both the MJ (127 seconds 95% CI [115, 141]) and GTCS, (188 seconds 95% CI [170, 205]), compared to WT mice (MJ: 113 seconds 95% CI [101, 121]; GTCS: 173 seconds 95% CI [158, 179]) (Fig. 4A–B). In contrast, Kcnb1C/C mice showed no difference in MJ latency relative to WT, but had a ≈15% shorter latency shorter latency to the GTCS (132 seconds 95% CI [128 146]), (Fig. 4A–B). Comparison of the time interval between MJ and GTCS showed that Kcnb1C/C mice progressed quickly between the stages, with a median time of 27 seconds 95% CI [17–50], while WT and Kcnb1C/+ exhibited similar median latencies of 58 seconds 95% CI [45–68] and 53 seconds 95% CI [40–64], respectively (Fig. 4C).
Figure 4.

Altered susceptibility to seizures induced by chemoconvulsants in Kcnb1C/+ and Kcnb1C/C mice. (A) Latency to the first flurothyl-induced MJ was affected by Kcnb1 genotype (Kruskal-Wallis H(2) = 12.28, p < 0.003; *p < 0.04 and **p < 0.004, Dunn’s). (B) Latency to flurothyl-induced GTCS was affected by Kcnb1 genotype (Kruskal-Wallis H(2) = 35.83, p < 0.0001). Kcnb1C/+ mice exhibited the longest median latency to GTCS, while Kcnb1C/C mice had the shortest latency to GTCS (*p < 0.03, **p < 0.003, ****p < 0.0001, Dunn’s). For A-B, symbols represent individual mice, horizontal line represents median and error bars are 95% CI. (C) Progression from MJ to GTCS differed between genotypes (Kruskal-Wallis H(2) = 13.50, p < 0.002). Kcnb1C/C mice progressed the fastest between stages compared to WT (‡ p < 0.005) and Kcnb1C/+ (‡ p < 0.003). (D) Progression of seizure stages scored on a modified Racine scale post KA administration. Kcnb1C/C mice progressed faster through stages 3–6 compared to WT and to stage 6 compared to Kcnb1C/+ (WT v. Kcnb1C/C Red *p < 0.02 **p < 0.008, ****p < 0.0001; Kcnb1C/+ v. Kcnb1C/C Black *p < 0.03). Kcnb1C/+ mice progressed faster to stages 5 and 6 compared to WT (WT v. Kcnb1C/+ Blue *p < 0.02, ****p < 0.0001). P values determined by Tukey’s with Two-way ANOVA (see Table 3). Symbols represent the average latency of n = 12–19 mice per genotype. Error bars represent SEM. (E) Survival after KA administration was affected by Kcnb1 genotype. 100% of Kcnb1C/C and 75% of Kcnb1C/+ mice did not survive following KA administration, compared to 25% of WT mice (LogRank Mantel-Cox p < 0.0001). (F) Heat map depicting individual level seizure severity post KA administration organized by genotype. Y axis represents individual mice and X axis represents 5 min bins.
Next, we evaluated susceptibility to seizures induced by the glutamatergic agonist KA in a separate cohort of mice. Seizure intensity following KA administration was assessed over a 2-hour period using a modified Racine scale, scoring for latency to first occurrence of each stage and for the highest stage reached within 5-minute bins (Fig. 4D–F). There were no differences in latency to stages 1 or 2 between any genotype. However, for stages 3–7, Kcnb1C/C mice had a shorter average latency compared to WT and was quicker to reach stage 6 compared to Kcnb1C/+. (Fig. 4D). Kcnb1C/+ mice had shorter latencies to stages 5 and 6 faster compared to WT mice (Fig. 4D). Comparison of the survival rates of WT, Kcnb1C/+ and Kcnb1C/C after KA administration revealed that all Kcnb1C/C and ≈75% of Kcnb1C/+ died within 2 hours following KA administration, while only ≈25% of WT mice died (Fig. 4E–F). The median latency to death was 31.6 min in Kcnb1C/C and 42.5 min for Kcnb1C/+ mice, while ≈75% of WT mice survived for at least 2-h post-KA (Fig. 4E–F).
3.5. EEG Abnormalities in Kcnb1R306C mice
Adult Kcnb1C/C mice were sporadically observed exhibiting spontaneous GTCS in their home cages (Supplemental Video S1). To systematically evaluate electrographic events and quantify EEG properties, we collected synchronized video-EEG data from WT, Kcnb1C/+ and Kcnb1C/C mice at ≈20 weeks of age. Video-EEG was continually recorded for 7–14 days. Manual review of EEGs revealed a single spontaneous generalized seizure in a Kcnb1C/+ mouse (Fig. 5A; Supplemental Video S2), as well as a single generalized seizure in a Kcnb1C/C mouse. Low GTCS incidence was not unexpected, as previous work from our lab showed that other Kcnb1 mutant lines had relatively low GTCS frequency (Hawkins et al., 2021; Speca et al., 2014). Furthermore, GTCS witnessed during routine handling or husbandry were infrequent.
Beyond the rare spontaneous GTCS events, EEG was markedly abnormal in Kcnb1R306C mice. Both Kcnb1C/+ and Kcnb1C/C mice displayed recurrent trains of slow spike-wave complexes of varying durations on EEG (Fig. 5B–G, 6A). To quantify these observations, we performed focused analysis of approximately 67.5 hours of EEG records with low artifact and total average EEG baseline < 75 uV (WT: range of 45–91 hrs/mouse (n = 4); Kcnb1C/+: range of 47–73 hrs/mouse (n = 6); Kcnb1C/C: range of 70–74 hrs/mouse (n = 5)). Within these records, we first assessed frequency and duration of spike trains by manual review of EEG and video records. Spike-wave trains were more often identified during periods of rest, but many did occur during wakefulness and coincided with circling or behavioral arrest with head bobbing (Fig. 5B–G). In Kcnb1C/+ recordings, 4 of 6 mice collectively experienced 69 instances of spike wave trains ranging from 6 seconds to 140 minutes (Fig. 5B–D, 6A). Spectral analysis during these runs demonstrated elevated spectral density units (μV2/Hz) in the frequency range of 1–4 Hz (Fig. 5B–D). In Kcnb1C/C recordings, 3 of 5 mice collectively experienced 45 instances, ranging from 19 seconds to 108 minutes, again with elevated spectral density units (μV2/Hz) in the frequency range of 1–4 Hz (Fig. 5E–G, 6A). Similar spike trains were never observed in recordings from WT mice.
We also used quantitative EEG spectral analysis of as a proxy measurement of global (ictal and interictal) activity across the light (13-h segments) and dark cycles (9-h segments). Max power frequency did not differ between light and dark phases within genotype and was therefore collapsed across phase. Both Kcnb1C/+ and Kcnb1C/C mice displayed high powered activity in the ~2 Hz frequency range (2.3 ± 0.2, 2.6 ± 0.4, respectively), while WT had an average max power at ~ 4 Hz (3.6 ± 0.4) (Figure 6B). This frequency difference is likely attributed to the recurrent, pathogenic SWDs found throughout Kcnb1C/+ and Kcnb1C/C EEGs.
Examination of power spectral densities (PSD) between 0–30 Hz in the dark phase showed that compared to WT, Kcnb1C/+ had elevated PSD across all frequency bands (p < 0.0001 for each band). In contrast, Kcnb1C/C had elevated PSD in the alpha (p < 0.02) and beta (p < 0.0001) frequency bands, while delta and theta PSDs were not significantly different (Fig. 6C; Table 3). Examination of PSD in the light phase revealed that Kcnb1C/+ had elevated PSD in the delta (p < 0.0001), theta (p < 0.002), alpha (p < 0.0003) and beta (<0.0001) frequency bands, while Kcnb1C/C mice had elevated beta PSD (p < 0.0001) (Fig. 6C; Table 3). The observed alterations of PSD in Kcnb1 mutant mice relative to WT are suggestive of an imbalance in excitation-inhibition homeostasis.
4. Discussion
KCNB1-p.R306C is the one of the most recurrent variants identified to date in individuals with KCNB1 encephalopathy, and is associated with mild to severe global developmental delays, behavioral disorders, and a diverse spectrum of epilepsy that includes infantile spasms, GTC, myoclonic, tonic, focal, and absence seizures (Bar et al., 2020a; de Kovel et al., 2017; Kang et al., 2019; Marini et al., 2017; Saitsu et al., 2015). Previous in vitro characterization of R306C showed loss of voltage sensitivity and cooperativity of the voltage sensor and inhibition of repetitive firing, which can disrupt neuronal circuitry and result in clinical manifestations of developmental encephalopathy (Kang et al., 2019; Saitsu et al., 2015). We and others have previously generated and characterized mouse models of Kcnb1 encephalopathy, including the missense variants KCNB1-p.G379R, KCNB1-p.R312H, as well as a Kcnb1−/− knock-out and frameshift alleles (Bortolami et al., 2022; Hawkins et al., 2021; Speca et al., 2014). The existing Kcnb1 mouse models recapitulated KCNB1 encephalopathy phenotypes, including spontaneous seizures, EEG abnormalities, learning deficits and hyperactivity (Bortolami et al., 2022; Hawkins et al., 2021; Speca et al., 2014). While Kcnb1G379R, Kcnb1R312H, and Kcnb1 null and frameshift models are informative LoF alleles, the Kcnb1R306C mutation represents a recurrent variant with different underlying mechanisms and biological impacts. Thus, this new model expands the allelic series of Kcnb1 mouse models, which may help establish nuanced genotype-phenotype correlations.
Previous results from our laboratory demonstrated that the R306C variant exhibited normal protein expression level and cell-surface trafficking in CHO cells (Kang et al., 2019). Consistent with this, Kcnb1C/+ and Kcnb1C/C mice did not have significant changes in transcript, or protein expression relative to WT (Fig. 1). Moreover, there was no difference in subcellular localization or clustering in Kcnb1C/+ and Kcnb1C/C mice compared to WT (Fig. 2). In contrast, the Kcnb1G379R and Kcnb1R312H mouse models had substantial, genotype-dosage dependent reduction in KV2.1 expression, as well as dominant-negative effects on KV2.1 macromolecular complexes (Bortolami et al., 2022; Hawkins et al., 2021). Thus, the Kcnb1R306C phenotype is likely a direct result of defective voltage sensing rather than diminished protein expression and/or localization. This is an important distinction as voltage-sensing dysfunction may be amenable to different therapeutic approaches than diminished protein expression (Haq et al., 2022; Tian et al., 2022).
Both Kcnb1C/+ and Kcnb1C/C mice exhibited open field hyperactivity. This is consistent with previous reports of hyperactivity in Kcnb1G379R and Kcnb1−/− mice (Hawkins et al., 2021; Speca et al., 2014), as well as clinical reports of attention-deficit/hyperactivity disorder or hyperactivity with inattention in numerous cases of KCNB1 encephalopathy (Bar et al., 2020a; de Kovel et al., 2017; Kang et al., 2019; Marini et al., 2017; Torkamani et al., 2014). There was no significant effect of R306C allele dosage on hyperactivity, in contrast to G379R that consistently had more severe neurobehavioral phenotypes in homozygotes compared to heterozygous littermates (Hawkins et al., 2021). This again supports the notion of differential effects of defective voltage sensing versus dominant negative in Kcnb1 disease.
Seizure susceptibility was altered in Kcnb1R306C mice relative to WT, although there were differential effects depending on genotype and chemoconvulsant. In response to KA, we observed an allele dosage effect, with Kcnb1C/C mice being more severe than both Kcnb1C/+ and WT, and Kcnb1C/+ having intermediate sensitivity to KA. In contrast, latency to flurothyl-induced seizures was differentially modulated in Kcnb1C/+ versus Kcnb1C/C mice. Latencies relative to WT were longer in Kcnb1C/+ heterozygotes, while they were shorter in Kcnb1C/C homozygotes. The paradoxical relationship between genotype and seizure susceptibility in response to flurothyl suggests a fundamental difference between having mutant-only homotetramers in Kcnb1C/C mice versus Kcnb1C/+ mice having a mixture of possible KV2.1 tetramer populations that may include WT-only and mutant-only homotetramers, as well as heterotetramers of WT and R306C with various stoichiometric ratios (Kang et al., 2019). When expressed as a homotetramer, R306C channels had complete loss-of-function. Consistent with this, the observed seizure susceptibility in Kcnb1C/C homozygous mice was similar to Kcnb1−/− mice, which also had a ≈15% reduction in flurothyl threshold relative to WT (Hawkins et al., 2021; Speca et al., 2014). In contrast, Kcnb1G379R mice with a dominant-negative variant had a more pronounced response to flurothyl compared to Kcnb1C/C mice. Compared to WT, Kcnb1G379R/G379R homozygotes had a 37% reduction in flurothyl threshold, while Kcnb1G379R/+ heterozygotes had a ≈15% reduction (Hawkins et al., 2021). The magnitude of threshold reduction compared to these other Kcnb1 lines suggests that Kcnb1C/C results in loss-of-function rather than a dominant-negative effect. Previous work showed that repetitive action potential firing was completely suppressed in cortical pyramidal neurons co-expressing WT and R306C channels (Saitsu et al., 2015). This, coupled with differences in mechanisms of seizure induction by KA versus flurothyl, may underlie the observed differential response in Kcnb1C/+ heterozygotes. Flurothyl acts as a GABA antagonist, suppressing presynaptic GABA release, while KA acts on both pre- and post-synaptic receptors to suppress presynaptic GABA release and enhance postsynaptic activation of glutamatergic neurons (Falcón-Moya et al., 2018). Thus, despite the failure of action potential firing in heterozygous pyramidal neurons, the KA condition provides an excitatory drive that is absent in the flurothyl condition.
Although seizure susceptibility can give us a measure of altered excitatory/inhibitory balance, the role of KV2.1 as a dynamically regulated homeostatic modulator of neuronal excitability makes it challenging to directly translate these acute effects to epilepsy propensity. Thus, we performed EEG analysis to study epileptiform activity and background EEG properties. Among individuals with the KCNB1-p.R306C variant, common EEG findings are diffuse polyspike waves, high amplitude spike wave complexes and continuous spike and wave during sleep (CSWS) (de Kovel et al., 2017; Marini et al., 2017). Kcnb1C/+ and Kcnb1C/C mice were found to have markedly abnormal ictal-interictal EEG patterns, including many of the above listed characteristics. Most evident in the EEG traces were lengthy, rhythmic, high-amplitude spike wave trains, sometimes lasting for hours, while the mouse was immobile. Although we cannot definitively conclude that the Kcnb1R306C model recapitulates CSWS, the similarity is striking. Previous work identified spike and wave complexes lasting up to 15 minutes in Kcnb1G379R mice, while spontaneous seizure activity was absent from recordings in Kcnb1−/− mice (Hawkins et al., 2021; Speca et al., 2014); thus, the frequency and duration of these complexes in Kcnb1R306C mice was unprecedented. The recently reported KCNB1-p.R312H mouse model also showed long duration seizure activity (4–5 min), defined by sustained rhythmic synchronous discharges, providing further support that the persistent spiking identified Kcnb1R306C is pathogenic (Bortolami et al., 2022). Future studies using high-dose benzodiazepines, valproate, or corticosteroids would be useful to determine if the rhythmic high-amplitude spike wave trains in the Kcnb1R306C mouse model can be attenuated with drugs commonly used for CSWS (Sánchez Fernández et al., 2014).
Limitations of this study that were not in the scope of this manuscript and will be addressed in the future include the following. Our analysis of subcellular localization and AIS maturation was a snapshot at DIV16–18, and therefore do not preclude the possibility of impaired maturation occurring at a later time point. In addition, our EEG recordings did not include EMG or accelerometer data necessary for systematically staging sleep, an essential feature for CSWS diagnosis; thus, precluding definitive classification of the long bouts of rhythmic high-amplitude spike wave trains accompanied by behavioral immobility as CSWS. Finally, effects at the level of circuit, network, and non-conducting roles of KV2.1 were not probed in this study and future studies will be necessary to determine their contributions to clinical phenotypes.
5. Conclusions
In summary, we generated and characterized a novel knock-in mouse model of KCNB1 encephalopathy due to voltage-sensor dysfunction of KV2.1 channels. This represents a major category of dysfunction observed for channelopathies and the model will be a valuable resource for understanding disease pathophysiology and evaluating potential therapies.
Supplementary Material
Acknowledgements
We thank KCNB1 families for their support, and Colette Brill-Forman for technical assistance. The genetically engineered mice were generated with the assistance of Lynn Doglio and Eugene Wyatt in Northwestern University Transgenic and Targeted Mutagenesis Laboratory. Imaging work was performed at the Northwestern University Center for Advanced Microscopy generously supported by NCI CCSG P30 CA060553 awarded to the Robert H Lurie Comprehensive Cancer Center. This work was supported by generous philanthropic donations and the National Institutes of Health grant U54 NS108874 (JAK).
Abbreviations:
- AnkG
Ankyrin G
- AIS
axon initial segment
- flurothyl
Bis(2,2,2-trifluoroethyl) ether
- CI
confidence interval
- DIV
days in vitro
- EEG
electroencephalogram
- FFT
fast fourier transform
- GTCS
generalized tonic-clonic seizure
- gRNA
guide RNA
- HDR
Homology directed repair
- ICC
immunocytochemistry
- IDT
Integrated DNA Technologies, Inc.
- KA
kainic acid
- LoF
loss-of-function
- MJ
myoclonic jerk
- PBS-T
PBS+tween-20
- PAM
protospacer adjacent motif
- RFLP
restriction fragment length polymorphism
- RNP
ribonucleotide protein complex
- ssODN
single-stranded donor oligonucleotide
- SPF
specific pathogen free
- WB
western blot
- WT
wildtype
Footnotes
Declaration of Competing Interest
The authors declare no competing interests related to this study.
CRediT authorship contribution statement
Seok Kyu Kang: Conceptualization, Methodology, Formal analysis, Investigation, Writing - Original Draft, Writing - Review & Editing, Visualization. Nicole A. Hawkins: Conceptualization, Methodology, Formal analysis, Investigation, Writing - Original Draft, Writing - Review & Editing, Visualization, Project administration. Dennis-Echevarria-Cooper: Investigation, Formal analysis, Writing - Review & Editing. Erin M. Baker: Investigation, Formal analysis, Writing - Review & Editing. Conor J. Dixon: Investigation, Formal analysis, Writing - Review & Editing. Nathan Speakes: Investigation, Formal analysis, Writing - Review & Editing. Jennifer A. Kearney: Conceptualization, Formal analysis, Investigation, Writing - Review & Editing, Visualization, Project administration, Funding acquisition.
Data Availability
Data will be made available upon reasonable request.
References
- Aida T., et al. , 2014. Translating human genetics into mouse: the impact of ultra-rapid in vivo genome editing. Dev Growth Differ. 56, 34–45. [DOI] [PubMed] [Google Scholar]
- Bar C., et al. , 2020a. Expanding the genetic and phenotypic relevance of KCNB1 variants in developmental and epileptic encephalopathies: 27 new patients and overview of the literature. Hum Mutat. 41, 69–80. [DOI] [PubMed] [Google Scholar]
- Bar C., et al. , 2020b. Developmental and epilepsy spectrum of KCNB1 encephalopathy with long-term outcome. Epilepsia. 61, 2461–2473. [DOI] [PubMed] [Google Scholar]
- Bortolami A., et al. , 2022. Integrin-KCNB1 potassium channel complexes regulate neocortical neuronal development and are implicated in epilepsy. Cell Death Differ. [DOI] [PMC free article] [PubMed] [Google Scholar]
- Catacuzzeno L., Franciolini F., 2022. The 70-year search for the voltage-sensing mechanism of ion channels. J Physiol. 600, 3227–3247. [DOI] [PMC free article] [PubMed] [Google Scholar]
- Chesselet M. F., Carmichael S. T., 2012. Animal models of neurological disorders. Neurotherapeutics. 9, 241–4. [DOI] [PMC free article] [PubMed] [Google Scholar]
- de Kovel C. G. F., et al. , 2017. Neurodevelopmental Disorders Caused by De Novo Variants in KCNB1 Genotypes and Phenotypes. JAMA Neurol. 74, 1228–1236. [DOI] [PMC free article] [PubMed] [Google Scholar]
- Echevarria-Cooper D. M., et al. , 2022. Cellular and behavioral effects of altered NaV1.2 sodium channel ion permeability in Scn2aK1422E mice. Hum Mol Genet. 31, 2964–2988. [DOI] [PMC free article] [PubMed] [Google Scholar]
- Falcón-Moya R., et al. , 2018. Kainate Receptors: Role in Epilepsy. Front Mol Neurosci. 11, 217. [DOI] [PMC free article] [PubMed] [Google Scholar]
- Haq I., et al. , 2022. Precision Medicine Based on CFTR Genotype for People with Cystic Fibrosis. Pharmgenomics Pers Med. 15, 91–104. [DOI] [PMC free article] [PubMed] [Google Scholar]
- Hawkins N. A., et al. , 2021. Epilepsy and neurobehavioral abnormalities in mice with a dominant-negative KCNB1 pathogenic variant. Neurobiol Dis. 147, 105141. [DOI] [PMC free article] [PubMed] [Google Scholar]
- Kang S. K., et al. , 2019. Spectrum of KV2.1 Dysfunction in KCNB1-Associated Neurodevelopmental Disorders. Ann Neurol. 86, 899–912. [DOI] [PMC free article] [PubMed] [Google Scholar]
- Marini C., et al. , 2017. Clinical features and outcome of 6 new patients carrying de novo KCNB1 gene mutations. Neurol Genet. 3, e206. [DOI] [PMC free article] [PubMed] [Google Scholar]
- Murakoshi H., Trimmer J. S., 1999. Identification of the KV2.1 K+ channel as a major component of the delayed rectifier K+ current in rat hippocampal neurons. J Neurosci. 19, 1728–35. [DOI] [PMC free article] [PubMed] [Google Scholar]
- Percie du Sert N., et al. , 2020. The ARRIVE guidelines 2.0: Updated guidelines for reporting animal research. Br J Pharmacol. 177, 3617–3624. [DOI] [PMC free article] [PubMed] [Google Scholar]
- Platt R. J., et al. , 2014. CRISPR-Cas9 knockin mice for genome editing and cancer modeling. Cell. 159, 440–55. [DOI] [PMC free article] [PubMed] [Google Scholar]
- Racine R. J., 1972. Modification of seizure activity by electrical stimulation. II. Motor seizure. Electroencephalogr Clin Neurophysiol. 32, 281–94. [DOI] [PubMed] [Google Scholar]
- Saitsu H., et al. , 2015. De novo KCNB1 mutations in infantile epilepsy inhibit repetitive neuronal firing. Sci Rep. 5, 15199. [DOI] [PMC free article] [PubMed] [Google Scholar]
- Sánchez Fernández I., et al. , 2014. Treatment for continuous spikes and waves during sleep (CSWS): survey on treatment choices in North America. Epilepsia. 55, 1099–108. [DOI] [PubMed] [Google Scholar]
- Scheffer I. E., Liao J., 2020. Deciphering the concepts behind “Epileptic encephalopathy” and “Developmental and epileptic encephalopathy”. Eur J Paediatr Neurol. 24, 11–14. [DOI] [PubMed] [Google Scholar]
- Speca D. J., et al. , 2014. Deletion of the KV2.1 delayed rectifier potassium channel leads to neuronal and behavioral hyperexcitability. Genes Brain Behav. 13, 394–408. [DOI] [PMC free article] [PubMed] [Google Scholar]
- Thiffault I., et al. , 2015. A novel epileptic encephalopathy mutation in KCNB1 disrupts KV2.1 ion selectivity, expression, and localization. J Gen Physiol. 146, 399–410. [DOI] [PMC free article] [PubMed] [Google Scholar]
- Tian F., et al. , 2022. Epilepsy phenotype and response to KCNQ openers in mice harboring the Kcnq2 R207W voltage-sensor mutation. Neurobiol Dis. 174, 105860. [DOI] [PubMed] [Google Scholar]
- Torkamani A., et al. , 2014. De novo KCNB1 mutations in epileptic encephalopathy. Ann Neurol. 76, 529–40. [DOI] [PMC free article] [PubMed] [Google Scholar]
Associated Data
This section collects any data citations, data availability statements, or supplementary materials included in this article.
Supplementary Materials
Data Availability Statement
Data will be made available upon reasonable request.