Abstract
Purpose:
This study evaluated if tauroursodeoxycholic acid (TUDCA) alleviates pro-inflammatory and endoplasmic reticulum (ER) stress-mediated visual deficits in diabetic tie2-TNF transgenic mice via Takeda G protein-coupled receptor 5 (TGR5) receptor signaling.
Methods:
Adult tie2-TNF transgenic or age-matched C57BL/6J (wildtype, WT) mice were made diabetic and treated subcutaneously with TUDCA. After 4 weeks, visual function, vascular permeability, immunohistology, and molecular analyses were assessed. Human retinal endothelial cells (HRECs) silenced for TGR5, followed by TNF and high glucose (HG) stress-mediated endothelial permeability, and transendothelial migration of activated leukocytes were assessed with TUDCA in vitro.
Results:
Compared with WT mice, tie2-TNF mice showed a decreased visual function correlated with a decrease in protein kinase C α (PKCα) in rod bipolar cells, and increased vascular permeability was further exacerbated in diabetic-tie2-TNF mice. Conversely, TUDCA alleviated these changes in diabetic mice. An increase in inflammation and ER stress in retina coincided with an increase in TGR5 expression in diabetic tie2-TNF mice that decreased with TUDCA. In vitro, HRECs exposed to TNF+HG demonstrated >2-fold increase in TGR5 expression, a 3-fold increase in leukocyte transmigration with a concomitant increase in permeability. Although TUDCA reversed these effects, HRECs silenced for TGR5 and challenged with TUDCA or TGR5 agonist failed to reverse the TNF+HG induced effects.
Conclusions:
Our data suggest that TUDCA will serve as an excellent therapeutic agent for diabetic complications addressing both vascular and neurodegenerative changes in the retina. Perturbation of the TGR5 receptor in the retina might play a role in linking retinal ER stress to neurovascular dysfunction in diabetic retinopathy.
Keywords: TNF-α, ER stress, diabetes, TUDCA, retinopathy, inflammation, post-translational modifications
Introduction
The concept of diabetic retinopathy (DR) as a microvascular disease has evolved in that it is now considered a more complex diabetic complication in which neurodegeneration plays a significant role.1–3 The American Diabetes Association has recently defined DR as a highly tissue-specific neurovascular complication involving progressive disruption of the interdependence between multiple cell types in the retina.4
The impairment of the neurovascular unit (NVU) is a primary event in the pathogenesis of DR that potentiates damage on diverse neural cell types (i.e., ganglion cells, amacrine cells, horizontal and bipolar cells), glia (Müller cells and astrocytes), professional immune cells (microglia and perivascular macrophages), and vascular cells (endothelial cells and pericytes).5
Impaired function of the endoplasmic reticulum (ER) results in ER stress, an accumulation of proteins in the ER lumen. Our recent work suggests that the early progression of DR may be mediated by ER stress through endothelial dysfunction.6 Using a pro-inflammatory tie2-TNF mouse model expressing uncleavable membrane-bound tumor necrosis factor-alpha in the vasculature, we have shown a feed-forward loop of ER stress and chronic proinflammation activation, resulting in endothelial junction protein alterations leading to visual deficits in the diabetic retina.6
Additional studies in the tie2-TNF mouse model also demonstrated age-associated accentuation of ER stress, premature cellular senescence accompanied by pro-inflammatory gene transcript modifications consistent with changes observed in DR models,7 potentially affecting neurovascular integrity, thus dampening the vision.8 Based on these studies, one could surmise that ER stress inhibitors might serve as a promising therapeutic target for treating DR.
Well-known ER stress inhibitors such as bile acids, including FDA-approved ursodeoxycholic acid (UDCA) and its conjugated derivative tauroursodeoxycholic acid (TUDCA), have shown neuroprotective effects in several neurodegenerative diseases, ischemia/reperfusion animal models, and against retinal damage.9–12 Bile acids are an interesting therapeutic tool since they can be administered orally, intravenously, or intraperitoneally and easily cross the blood-tissue barrier.
Although the bile acids are beneficial, the cell signaling and the receptor through which they act are shown to be contextual or cell-type dependent, with some studies showing benefits whereas others claiming harmful effects.12–16 Using our pro-inflammatory tie2-TNF mouse model of DR, we show that systemic treatment of TUDCA suppresses retinal inflammation and ER stress, resulting in decreased vascular permeability and improved retinal function.
In vitro, using retinal endothelial cells, we show that the combination of high glucose (HG) and TNF-α induced ER stress results in increased expression of Takeda G protein-coupled receptor 5 (TGR5), increased transmigration of leukocytes, and permeability defects that could be reversed using TUDCA. Taken together with the existing literature, our studies show that TUDCA will serve as an excellent therapeutic agent for diabetic complications addressing both vascular and neurodegenerative changes in the retina. Perturbation of the TGR5 receptor in the retina might play a role in linking retinal ER stress to neurovascular dysfunction in DR.
Methods
Streptozotocin-induced diabetes in tie2-TNF transgenic animals and TUDCA treatment
All animal studies were approved by the Institutional Animal Care and Use Committee, UTHSC, Memphis, following the guidelines per the Association for Research in Vision and Ophthalmology Statement for the Use of Animals in Ophthalmic and Vision Research, and the Association for Assessment and Accreditation of Laboratory Animal Care guidelines. Transgenic animals used in this study were a kind gift from Matthias Clauss, PhD (Indiana University School of Medicine, Indianapolis, IN).
An uncleavable murine transmembrane TNF-α under tie2 promoter confine TNF-α specific to the endothelium17 was generated by backcrossing in C57BL/6J mice.8 Diabetes was induced in wildtype (WT) and tie2-TNF transgenic animals (TNF), as previously described.6 Briefly, ∼7-week-old mice were intraperitoneally injected with 35 mg/kg streptozotocin (STZ) dissolved in sodium citrate buffer (0.01 M; pH 4.5) for 5 consecutive days. Non-diabetic animals receiving equal volumes of citrate buffer served as controls.
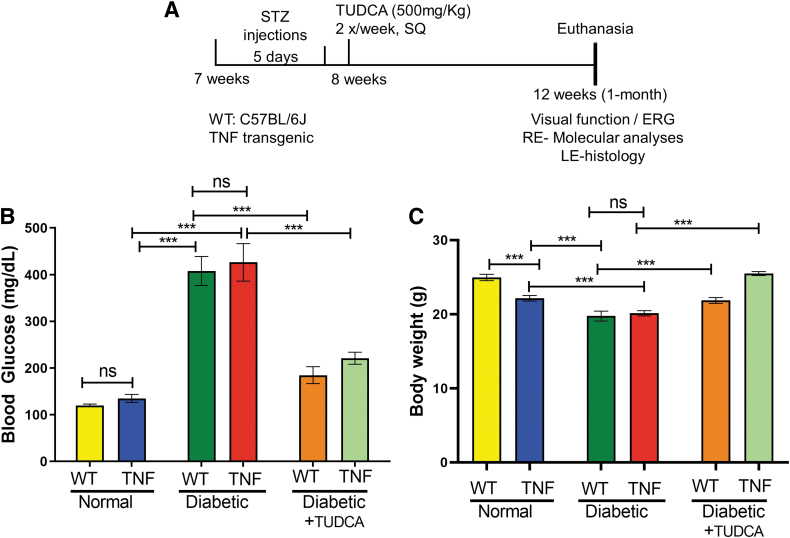
Animals with blood glucose >250 mg/dL were considered diabetic and used in the studies. One-half of the WT and TNF mice with diabetes received TUDCA (500 mg/kg body weight, T0266; Sigma) dissolved in sterile saline via subcutaneous route 2 times in a week for a total of 4 weeks (1 month) as previously described 18 (Fig. 1A). The other half of WT and TNF mice received an equal volume of saline injections.
FIG. 1.
TUDCA ameliorates blood glucose levels and body weights in the diabetic TNF mice. (A) In vivo animal experimental timeline, treatments, and analyses. (B) Blood glucose concentration (mg/dL) in the study groups. (C) Animal body weights of the study groups. Data represent mean ± SEM from n = 7–9 animals/group. *P < 0.05; **P < 0.01; ***P < 0.001. †P < 0.05 compared with TNF mice. ERG, electroretinogram; LE, left eye; RE, right eye; SEM, standard error of the mean; SQ, subcutaneous; STZ, streptozotocin; TUDCA, tauroursodeoxycholic acid.
The following 6 groups were included in the study: WT, TNF, WT-diabetic, TNF-diabetic, WT-diabetic-TUDCA, and TNF-diabetic-TUDCA. All experiments in this study were performed after 1 month of STZ injection and TUDCA treatment. To assess the long-term effects of TUDCA on visual function, 1 batch of animals was continued to be treated with TUDCA until 5 months of age. Following 1, 2, and 5 months of diabetes and treatment, control and diabetic mice were euthanized, and whole blood was collected transcardially to measure blood glucose levels by glucometer (Bayer Contour test strips; Bayer HealthCare, LLC, Pittsburgh, PA) (Supplementary Fig. S1A). To avoid catabolic effects, diabetic mice received insulin injections once a week (Humulin, 1 U/mouse) via the subcutaneous route. About 7–9 animals of both sex in each group (WT: 5 M/4 F mice, TNF: 3 M/4 F mice, WT-diabetic: 4 M/4 F mice, TNF-diabetic: 5 M/4 F mice, WT-diabetic-TUDCA: 4 M/4 F mice, and TNF-diabetic-TUDCA: 4 M/4 F mice) were included.
Optokinetic nystagmus measurement
Following the designated time point, awake mice were placed on a platform inside the OptoMotry virtual reality optokinetic nystagmus system (OKN) to quantify the visual acuity and contrast sensitivity thresholds (OptoMotry; CerebralMechanics, Lethbridge, Canada) as previously described.6,19 Acuity data (cycles/degree, c/d) testing was performed at 100% contrast. Contrast sensitivity testing was performed at a fixed spatial frequency threshold (0.042 c/d) and expressed in percentage (%).
Electroretinogram measurement
Following the designated time point, control and diabetic mice were dark-adapted overnight and prepared for electroretinogram (ERG) recording under dim red light. Scotopic threshold ERG recordings (0.0025, 0.025, 0.25, 2.5, and 25 cd·s/m2) were obtained using the Espion E2 ERG system (Diagnosys, LLC, Lowell, MA), as previously described.6 The b-wave and a-wave amplitudes were represented by averaging 3–5 ERG traces at 25 cd·s/m2.
Gene expression analysis
Whole mouse retinal tissue was used to isolate RNA using a NucleoSpin® RNA Plus kit (Macherey-Nagel GmbH, Takara Bio USA), following the protocol previously published.6 About 250 ng of total RNA from each tissue was converted to complementary DNA (cDNA) using a High-Capacity cDNA Reverse Transcription Kit (Thermo Fisher Scientific, Waltham, MA). The resulting cDNA sample served as a template (100 ng) for real-time quantitative polymerase chain reaction to study the expression levels of representative pro-inflammatory and ER stress-related gene transcripts (Table 1) using TaqMan assays and analyzed using 2−ΔΔCt method. Mouse 18S ribosomal RNA served as a housekeeping internal control.
Table 1.
TaqMan Assay Primer and Probes for Gene Transcript Analysis
| Genes | Assay ID (Thermo Fisher Scientific) | Reference sequence | Amplicon length |
|---|---|---|---|
| 18S ribosomal RNA (18s) | Mm04277571 | NR_003278 | 115 |
| Chemokine (C–C motif) ligand 2 (CCL2) | Mm00441242 | NM_011333.3 | 74 |
| Cholesterol 25-hydroxylase (CH25H) | Mm00515486 | NM_009890.1 | 126 |
| Endothelin 2 (EDN2) | Mm00432983 | NM_007902.2 | 74 |
| Intercellular adhesion molecule 1 (ICAM1) | Mm01175876 | NM_010493.2 | 94 |
| Tissue inhibitor of metalloproteinase 1 (TIMP1) | Mm01341361 | NM_001044384.1 | 100 |
| Vascular cell adhesion molecule 1 (VCAM1) | Mm01320973 | NM_011693.3 | 126 |
| Heat shock protein 5 (GRP78) | Mm00517691 | NM_001163434 | 75 |
| ER to nucleus signaling 1 (IRE1α) | Mm00470233 | NM_023913 | 95 |
| X-box binding protein 1 (XBP1) | Mm00457357 | NM_001271730 | 56 |
| DNA-damage inducible transcript 3 (CHOP) | Mm01135937 | NM_001290183 | 92 |
| Activating transcription factor 6 (ATF6) | Mm01295319 | NM_001081304 | 74 |
| Eukaryotic translation initiation factor 2 α kinase 3 (PERK) | Mm00438700 | NM_010121 | 62 |
CHOP, C/EBP homologous protein; ER, endoplasmic reticulum.
Protein expression analysis
Whole mouse retinal tissues or cultured human retinal endothelial cells (HRECs) after various treatments were lysed using RIPA buffer [50 mM Tris-HCl (pH 8.0), 150 mM NaCl, 0.1% sodium dodecyl sulfate (SDS), 0.2% sodium azide, 1% Triton X-100, 0.25% sodium deoxycholate, and 1 × protease inhibitor] as previously described.6 Primary antibodies used in this study are listed in Table 2. Targeted proteins were probed in separate blots. Mean densitometry data from independent experiments were calculated using Image-J (NIH, Bethesda, MD) software and represented as the ratio of the target protein to β-tubulin or total protein of interest, where applicable.
Table 2.
Antibodies Used in the Immunoblot Analysis
| Protein ID | Manufacturer | Catalog No. |
|---|---|---|
| Grp78 | Thermo Fisher Scientific | PA1-014A |
| Ire1α | Thermo Fisher Scientific | PA5-20189 |
| p-Ire1α | Thermo Fisher Scientific | PA1-16927 |
| Chop | Thermo Fisher Scientific | MA1-250 |
| β-tubulin | Thermo Fisher Scientific | MA5-16308 |
| p21 | Santacruz Antibody (F-5) | sc-6246 |
| p16 | Santacruz Antibody (C-3) | sc-166760 |
| O-GlcNAc (CTD110.6) (anti-serine-O-linked N-acetyl glucosamine) | Santa Cruz Biotechnologxy | sc-59623 |
| VE-cadherin (total) | Santa Cruz Biotechnology | sc-9989R5 |
| Phospho -VE-cadherin (Tyr658) | Abcam | ab119785 |
| TGR5 | Thermo Fisher Scientific | PA5-23182 |
TGR5, Takeda G protein-coupled receptor 5.
Retinal vascular permeability
Retinal vascular permeability in mice was performed as previously described with slight modifications.20 Briefly, anesthetized mice received albumin–fluorescein isothiocyanate conjugate (FITC-BSA, Sigma) dissolved in injectable saline (100 mg/kg) via the tail vein. After 2 h, blood samples were collected from anesthetized animals and were perfused for 5 min with warm phosphate buffered saline (PBS) to remove vascular FITC-BSA. Subsequently, the retinas were harvested and dried overnight in the dark to obtain dry weight.
FITC-BSA fluorescence intensity in whole retinal lysates was measured (excitation λ 485 nm, emission λ 528 nm) using a plate reader (Bio Tek Instruments, Inc., Winooski, VT) and compared with a standard curve. Blood plasma fluorescence intensity, retinal dry weight, and the time of dye circulation were used for normalization for each animal to obtain the retinal vascular permeability.
Immunohistochemistry
Tissue processing and immunohistochemistry to compare the expression of protein kinase C α (PKCα) specific for rod bipolar cells (RBCs) was done as previously described.21 Briefly, retinal sections were incubated with mouse monoclonal anti-PKCα (dilution 1:250; sc-17769; Santa Cruz Biotechnology, Dallas, TX) for 24 h at 4°C. Images were acquired using an Olympus FV-3000 laser-scanning confocal system connected to an Olympus IX-83 inverted microscope, controlled by Olympus FV31S-SW software with a Galvano scanner and a 60 X silicon (numerical aperture, 1.3), using the following settings: 1–7 times software zoom, z-step size of 0.45 μm, and sequential line scan averaged 3 times for scan size of 256 × 256 pixels at 10.0 μs/pixel.22
For quantification of PKCα, a common threshold was set for all images and a defined region of interest that incorporates the soma and dendrites of RBC in the outer plexiform layer (OPL), inner nuclear layer (INL), and terminals in the inner plexiform layer (IPL) were selected. The percent area of pixels over the threshold was quantified within the region of interest for 6 sections per animal.
Cell soma was labeled with 300 nM DAPI (diluted from a 14.3 mM stock solution) for 5 min. After a thorough wash (once in PBS-Tween, 3 times in PBS, and once in distilled water), sections were mounted using Prolong Diamond Antifade Mountant (Thermo Fisher Scientific). Fluorescence images were acquired using Olympus FluoView software controlling an Olympus FV1000/IX-81 laser-scanning confocal microscope equipped with a 20 × objective. The acquisition parameters (laser power, photomultiplier tube gain, scan speed, optical zoom, offset, step size, and pinhole diameter) were kept constant for each experimental dataset.
The number of neuron nuclei in the outer nuclear layer (ONL) was counted by an investigator blinded to the study groups using Fiji/ImageJ software with ITCN: Image-based Tool for Counting Nuclei plugins. In the projected images of ONL, the average nuclei diameters were determined to give the width threshold in pixels. Regions of interest encompassing ONL were defined, and the ONL counts from 6 sections per animal were normalized to the area (μm2) measured.
Cell culture and TGR5 silencing
HRECs (Cell Systems, Inc., Kirkland, WA) incubated at 37°C, 5% CO2 at 60%–80% confluence were used in the assay. Lipofectamine 2000 (Life Technologies, Thermo Fisher Scientific) and TGR5 small interfering RNA (siRNA; 30 pmol; Thermo Fisher Scientific) were mixed in OptiMEM (Gibco, Thermo Fisher Scientific) media, and they were incubated for 5 min to form an siRNA complex. The HRECs were briefly washed with PBS and incubated with siRNA complex for 6 h, followed by replacing the mixture with a complete EGM-2MV medium for an additional 48 h.
Cells between passage number 4 and 8 were used in all the experiments. To induce ER stress, cells were exposed to 20 ng/mL TNF-α (Sino Biological US, Inc., Wayne, PA) and 30 mM d-Glucose (Millipore Sigma, St Louis, MO) for 24 h in serum-free media. l-Glucose (30 mM; Millipore Sigma) is an enantiomer of the more common d-Glucose and served as an osmotic control. The cells were then used in subsequent experiments described later.
Transendothelial migration assay
Transendothelial migration of mononuclear leukocytes across the monolayer of HRECs was performed as previously described.23 Briefly, HRECs were cultured in collagen-coated transwell filter inserts (Corning Costar, Bodenheim, Germany) for 2 days. After specific treatments, the inserts were placed in fresh wells with serum-free medium. About 1 × 10⁶ DiI labeled THP-1 (ATCC, TIB-202) cells were added to the upper compartment and incubated for 24 h at 37°C, 5% CO2. The number of transmigrated leukocytes was measured in the media from the bottom well by measuring the fluorescence intensity (excitation λ 549 nm, emission λ 565 nm) using a plate reader (Bio Tek Instruments, Inc.). In addition, representative images of the transmigrated leukocytes were captured using an EVOS fluorescence microscope.
Retinal endothelial cell permeability in vitro
Measurements of trans-endothelial electrical resistance (TER) were performed using an electric cell-substrate impedance sensing (ECIS) device (ECIS 1600R; Applied Biophysics, Inc., Troy, NY), as previously described.6 Briefly, HRECs were seeded at a density of 5 × 10⁵ cells/mL on gold electrodes (8W10E+; Applied Biophysics, Inc.) with or without TGR5 siRNA treatment and grown for 16 h until maximum resistance was attained (1,200 Ω). Cells were treated with HG and TNF-α with and without TUDCA (20 μM), and changes in resistance were monitored for up to 18 h.
In some experiments, HRECs were incubated with TGR5 receptor agonist (16291,20 μM; Cayman) or antagonist (Triamterene, T 4143; 20 μM; Sigma) and challenged with HG and TNF-α. Resistance values for multiple wells at 4,000 Hz were normalized to an identical starting resistance value and averaged and presented as normalized resistance over time.
Statistical analysis
Results are expressed as mean ± standard error of the mean. For all quantitative experiments, statistical analyses were performed using a 2-way student t-test for paired samples (Microsoft Excel) or a 2-way analysis of variance with Tukey post hoc test for multiple-group comparisons (Prism 9.0; GraphPad Software, La Jolla, CA). A P value <0.05 was considered significant.
Results
TUDCA reduces blood glucose in STZ-induced diabetic tie2-TNF transgenic mice
As represented in the timeline map (Fig. 1A), we induced diabetes in TNF transgenic, and age-matched WT controls for 1 month, followed by various follow-up assays. All mice treated with STZ developed hyperglycemia compared with those treated with saline (Fig. 1B). Blood glucose levels in WT and tie2-TNF animals were 120 ± 3 and 135 ± 9 mg/dL, respectively (P > 0.05), whereas diabetic WT and diabetic tie2-TNF animals had significantly elevated levels (WT-diabetic, 408 ± 31 mg/dL; TNF-diabetic, 426 ± 40 mg/dL, P < 0.001) when compared with their non-diabetic controls (Fig. 1B).
The blood glucose levels in diabetic-WT mice did not differ from diabetic-TNF mice (P > 0.05). Interestingly, diabetic mice treated with TUDCA showed a decline in glucose levels with a significant difference in WT-diabetic mice (WT-diabetic TUDCA, 185 ± 18 mg/dL vs. WT-diabetic, 408 ± 31 mg/dL, P < 0.001) with a similar significant decrease in TNF-diabetic (TNF-diabetic TUDCA, 221 ± 13 mg/dL vs. TNF-diabetic, 426 ± 40 mg/dL, P < 0.001).
In response to the hyperglycemia, diabetic mice in this study demonstrated a significant reduction in body weight compared with their age-matched non-diabetic controls, with a significant increase noted in diabetic mice treated with TUDCA (Fig. 1C). It is worth noting that the tie2-TNF animals weighed significantly lower than their age-matched WT controls.
Diabetic mice in this study maintained sustained levels of hyperglycemia up to the 5-month time point when compared with those treated with saline (Table 3). Regular insulin injections in the long-term animals prevented the catabolic effects as demonstrated by sustained body weight across all the groups, despite the diabetic mice showing a significant reduction in body weights compared with their age-matched non-diabetic controls (Table 3).
Table 3.
Body Weights and Blood Glucose Levels in Mice
| Group | Bodyweight (g) |
Blood glucose (mg/dL) |
||||
|---|---|---|---|---|---|---|
| 1 Month | 2 Months | 5 Months | 1 Month | 2 Months | 5 Months | |
| WT | 24.96 ± 0.43 | 25.43 ± 0.28 | 26.36 ± 0.34 | 120.08 ± 12.77 | 122.44 ± 2.51 | 126.67 ± 3.41 |
| TNF | 22.15 ± 0.36 | 23.44 ± 0.27 | 24.01 ± 0.17 | 135.06 ± 8.52 | 132.43 ± 3.04 | 127.29 ± 2.17 |
| WT-diabetic | 19.75 ± 0.67 | 21.71 ± 0.44 | 20.55 ± 2.38 | 407.84 ± 31.11 | 322.38 ± 8.71 | 362.75 ± 10.69 |
| TNF-diabetic | 20.12 ± 0.31 | 19.22 ± 0.57 | 20.30 ± 0.58 | 426.44 ± 40.15 | 381.22 ± 15.48 | 427.11 ± 17.83 |
| WT-diabetic-TUDCA | 21.85 ± 0.39 | 22.66 ± 0.44 | 23.63 ± 0.44 | 184.63 ± 18.15 | 222.00 ± 12.78 | 254.63 ± 9.97 |
| TNF-diabetic-TUDCA | 25.49 ± 0.25 | 22.43 ± 0.40 | 21.18 ± 0.19 | 220.81 ± 12.88 | 204.38 ± 9.37 | 284.25 ± 7.47 |
TUDCA, tauroursodeoxycholic acid; WT, wildtype.
TUDCA protects from visual deficits in diabetic tie2-TNF transgenic mice
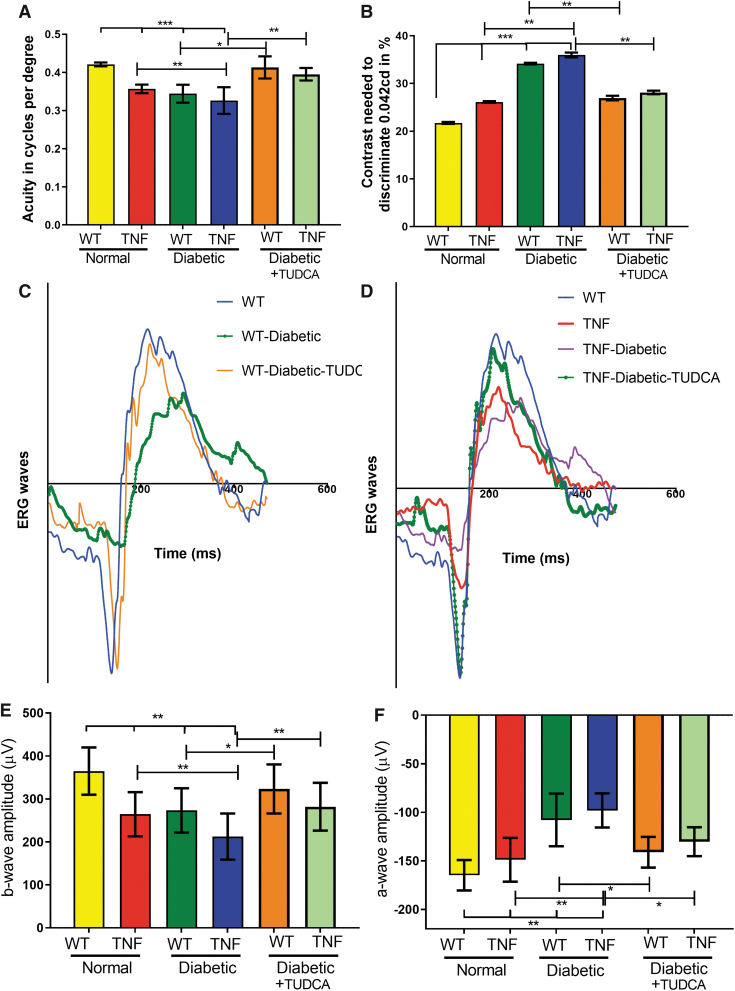
At the end of the study, visual acuity in tie2-TNF mice decreased compared with age-matched WT mice (TNF, 0.36 ± 0.005 versus (v/s) WT, 0.42 ± 0.001 cycles/degree (c/d), P < 0.001). In addition, TNF diabetic mice demonstrated a further decrease in visual acuity compared with the TNF group (TNF-diabetic, 0.32 ± 0.01 v/s TNF, 0.36 ± 0.005 c/d, P < 0.01). This decrease in visual acuity is also seen in WT-diabetic animals (WT-diabetic, 0.34 ± 0.008 v/s WT, 0.42 ± 0.001 c/d, P < 0.001).
Interestingly, TUDCA treatment significantly ameliorated these effects (WT-diabetic-TUDCA, 0.41 ± 0.005 v/s WT-diabetic, 0.34 ± 0.008; TNF-diabetic-TUDCA, 0.39 ± 0.005 v/s TNF-diabetic, 0.32 ± 0.01 c/d, P < 0.01) (Fig. 2A). In line with a decrease in visual acuity, contrast sensitivity thresholds were significantly increased in tie2-TNF mice compared with WT mice (TNF, 26.1% ± 0.07% v/s WT, 21.7% ± 0.07%, P < 0.001) with a further increase in both tie2-TNF and WT diabetic mice (TNF-diabetic, 36.1% ± 0.02% v/s WT-diabetic, 34.1% ± 0.07%, P < 0.01). Interestingly, TUDCA treatment significantly ameliorated contrast sensitivity thresholds (WT-diabetic-TUDCA, 26.9% ± 0.10% v/s WT-diabetic, 34.1 % ± 0.07%; TNF-diabetic-TUDCA, 28.1% ± 0.13% v/s TNF-diabetic, 36.1% ± 0.02%, P < 0.01) (Fig. 2B).
FIG. 2.
TUDCA protects from visual deficits in diabetic tie2-TNF mice. (A) Visual acuity in mice is expressed as cycles per degree. (B) Contrast sensitivity thresholds in mice expressed as a percentage. (C, D) Representative graphs of a typical electrogram from all groups. (E, F) b-Wave and a-wave amplitude measurements at 25 cd·s/m2 expressed as μV shown from all groups. Data represent mean ± SEM from n = 7–9 animals/group. *P < 0.05; **P < 0.01; ***P < 0.001.
TNF diabetic mice demonstrated an age-associated further decrease in visual acuity at both 2 and 5 months compared with the TNF diabetic group at 1 month (2-month: 0.319 ± 0.0; 5-month: 0.309 ± 0.0 v/s TNF-diabetic, 0.326 ± 0.0 c/d, P < 0.05). This decrease in visual acuity is also seen in contrast sensitivity thresholds (2-month: 35.76% ± 1.3%; 5-month: 37.86% ± 1.1% v/s TNF-diabetic, 26.1% ± 1.1%, P < 0.05).
Interestingly, TUDCA treatment significantly ameliorated both visual acuity (2-month: TNF-diabetic-TUDCA, 0.377 ± 0.01 c/d, P < 0.05; 5-month: TNF-diabetic-TUDCA, 0.387 ± 0.01 c/d, P < 0.05) and contrast sensitivity threshold deficits (2 month: TNF-diabetic-TUDCA, 27.68% ± 1.9%, P < 0.05; 5 month: TNF-diabetic-TUDCA, 28.26% ± 1.2%, P < 0.05) (Supplementary Fig. S1A, B).
Next, we examined the electrophysiological changes generated by neuronal and non-neuronal cells in the mouse retina from all groups. Dark-adapted scotopic ERG responses were recorded from both eyes of WT and tie2-TNF transgenic mice (Fig. 2C, D). When compared with age-matched WT mice, tie2-TNF mice demonstrated a substantial decrease in the b-wave amplitude in the scotopic range, with the data being significant at the 25 cd·s/m2 flash intensity (tie2-TNF, 264 ± 14 v/s WT, 364 ± 35 μV, P < 0.01) (Fig. 2E).
This decrease was further exacerbated when the mice were made diabetic, with diabetic tie2-TNF mice demonstrating the worst amplitudes (tie2-TNF-diabetic, 212 ± 33 v/s tie2-TNF, 264 ± 14 μV, P < 0.01; WT-diabetic, 273 ± 33 v/s WT, 364 ± 35 μV, P < 0.01). Interestingly, TUDCA treatment significantly ameliorated these effects (WT-diabetic-TUDCA, 323 ± 30 v/s WT-diabetic; TNF-diabetic-TUDCA 281 ± 19 v/s TNF-diabetic, P < 0.01) (Fig. 2E). Similar to b-wave amplitudes, a-wave amplitudes also demonstrated similar changes in all groups.
When compared with age-matched WT mice, tie2-TNF mice demonstrated a substantial decrease in the a-wave amplitude in the scotopic range, with the data being significant at the 25 cd·s/m2 flash intensity (tie2-TNF, −98.1 ± 18 v/s WT, −164.8 ± 16 μV, P < 0.01) (Fig. 2E). This decrease was further exacerbated when the mice were made diabetic, with diabetic tie2-TNF mice demonstrating the worst amplitudes (tie2-TNF-diabetic, −148.8 ± 23 v/s tie2-TNF, −98.1 ± 18 μV, P < 0.01).
Interestingly, TUDCA treatment significantly ameliorated these effects (WT-diabetic-TUDCA, −141.0 ± 16 v/s WT-diabetic −107.9 ± 27; TNF-diabetic-TUDCA −130.3 ± 15 v/s TNF-diabetic, −148.8 ± 23 μV, P < 0.05) (Fig. 2F). In line with deficits observed with OKN studies, TNF diabetic mice demonstrated an age-associated further decrease in b-wave amplitudes at both 2- and 5 months when compared with the TNF diabetic group at 1 month (2 month: 189.04 ± 10.35; 5 month: 141.3 ± 8.26 v/s TNF-diabetic, 212.44 ± 10.36 μV, P < 0.05).
Interestingly, TUDCA treatment significantly ameliorated b-wave amplitudes (2 month: TNF-diabetic-TUDCA, 254.0 ± 11.99 μV, P < 0.05; 5 month: TNF-diabetic-TUDCA, 246.0 ± 6.0 μV, P < 0.05) (Supplementary Fig. S2).
TUDCA protects vascular permeability in diabetic tie2-TNF transgenic mice
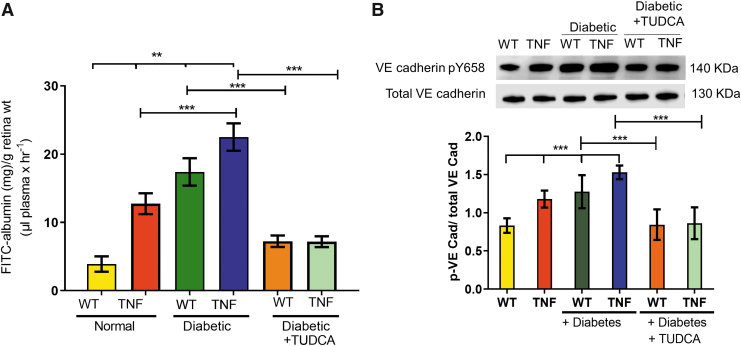
Based on our previous observation that TNF mice have increased systemic vascular permeability, we measured vascular leakage in the retina of all groups of mice. As shown in Fig. 3, permeability to FITC-BSA was measured by extracting and quantifying the deposited dye. Quantification of fluorescence intensity normalized to total plasma fluorescence suggested a significant leakage in TNF transgenic mice compared with WT animals (TNF, 12.7 ± 1.5 v/s WT, 3.89 ± 1.1 mg/g of retina weight, P < 0.001).
FIG. 3.
TUDCA protects from increased vascular permeability in diabetic tie2-TNF mice. (A) Vascular permeability was assessed by FITC-albumin leakage in retinal tissues from all study groups. (B) Representative blot of phosphorylated levels of VE-Cadherin normalized to total VE-Cadherin from all study groups. Data represent mean ± SEM from n = 7–9 animals/group. **P < 0.01; ***P < 0.001.
This increase in fluorescence leakage was further exacerbated when the mice were made diabetic (WT-diabetic, 17.3 ± 2.0 v/s WT, 3.89 ± 1.1; TNF-diabetic, 22.49 ± 2.0 v/s TNF, 12.7 ± 1.5 mg/g of retina weight, P < 0.001). Interestingly, TUDCA treatment significantly ameliorated these effects (WT-diabetic-TUDCA, 7.23 ± 0.8 v/s WT-diabetic 17.3 ± 2.0; TNF-diabetic-TUDCA 7.1 ± 0.8 v/s TNF-diabetic, 22.49 ± 2.0 mg/g of retina weight, P < 0.05) (Fig. 3A).
Tyrosine phosphorylation of the VE-Cadherin catenin complex has been reported to correlate with changes in the stability of VE-Cadherin adhesion in pro-inflammatory conditions and correlated with vascular permeability.23,24 As expected, TNF transgenic mice demonstrated increased pY658 levels in a manner similar to their increased levels of vascular permeability compared with WT animals (TNF, 1.17 ± 0.11 v/s WT, 0.83 ± 0.08, P < 0.001).
This increase in pY658 levels was further exacerbated when the mice were made diabetic (WT-diabetic, 1.27 ± 0.03 v/s WT, 0.83 ± 0.08; TNF-diabetic, 1.52 ± 0.09 v/s TNF, 1.17 ± 0.11, P < 0.001). Interestingly, TUDCA treatment significantly ameliorated these effects (WT-diabetic-TUDCA, 0.84 ± 0.20 v/s WT-diabetic 1.27 ± 0.03; TNF-diabetic-TUDCA 0.86 ± 0.20 v/s TNF-diabetic, 1.52 ± 0.09, P < 0.05) (Fig. 3B).
TUDCA prevents the loss of PKCα expression in RBCs in diabetic tie2-TNF transgenic mice
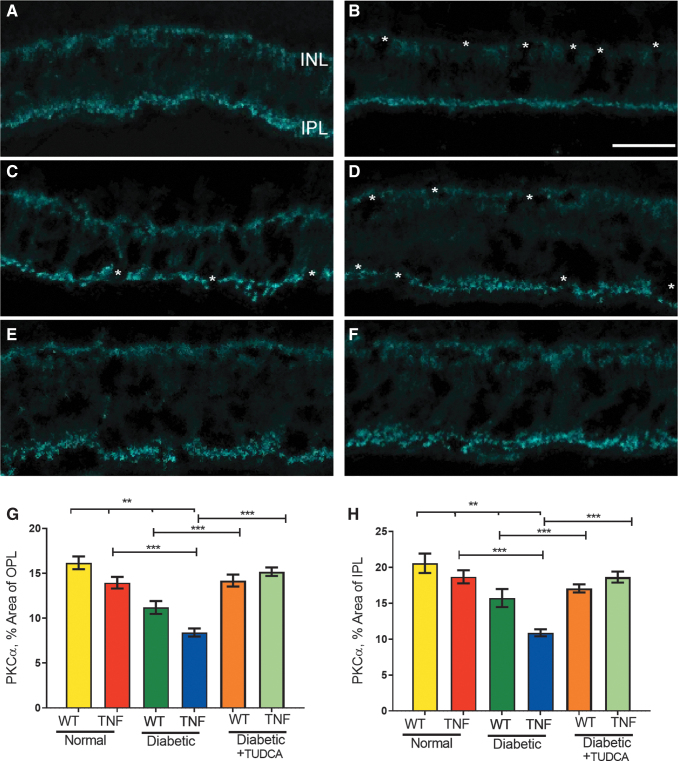
To reveal the functional defects in diabetic tie2-TNF mice for the observed decrease in the b-wave amplitude in the scotopic range, we examined the expression of PKCα since it is abundantly expressed in RBCs, and it is well established that the b-wave of the scotopic ERG is governed by the light responses of RBCs.25 We compared the expression of the PKCα immunoreactivity area in the soma, dendrites, and terminal in OPL, ONL, and IPL, respectively (Fig. 4).
FIG. 4.
TUDCA protects from loss of PKCα in RBC in the diabetic tie2-TNF mice: PKCα expression in WT (A), diabetic-WT (B), tie2-TNF (C), diabetic-tie2-TNF (D), diabetic-WT-TUDCA (E), and diabetic-tie2-TNF-TUDCA (F). The asterisk denotes the gaps in PKCα expression in either OPL, ONL, or IPL. The scale bar shown in (A–F) is 20 μm2. Quantification of PKCα expression in OPL+ soma shown in (G) whereas from IPL in the (H). Data represent mean ± SEM from n = 5–7 animals/group. **P < 0.01; ***P < 0.001. IPL, inner plexiform layer; ONL, outer nuclear layer; OPL, outer plexiform layer; PKCα, protein kinase C α; RBC, rod bipolar cell; WT, wildtype.
Quantification of PKCα expression in OPL and INL suggested a significant reduction in TNF transgenic mice compared with WT animals (TNF, 13.9 % ± 0.64% v/s WT, 16.1% ± 0.71%, P < 0.01). This reduction in PKCα expression was further enhanced when the mice were made diabetic (WT-diabetic, 11.2% ± 0.71% v/s WT, 16.1% ± 0.71%; TNF-diabetic, 8.4% ± 0.45% v/s TNF, 13.9% ± 0.64%, P < 0.001).
Interestingly, TUDCA treatment significantly ameliorated these changes (WT-diabetic-TUDCA, 14.2% ± 0.6% v/s WT-diabetic 11.2% ± 0.71%; TNF-diabetic-TUDCA 15.2% ± 0.05% v/s TNF-diabetic, 8.4% ± 0.45%, P < 0.001) (Fig. 4). Similarly, the quantification of PKCα expression in IPL significantly reduced in TNF transgenic mice compared with WT animals (TNF, 18.7% ± 0.91% v/s WT, 20.6% ± 1.4%, P < 0.01). This reduction in PKCα expression in IPL was further exacerbated when the mice were made diabetic (WT-diabetic, 15.7% ± 1.3% v/s WT, 20.6% ± 1.4%; TNF-diabetic, 10.9% ± 0.49% v/s TNF, 18.7% ± 0.91%, P < 0.001). In addition, TUDCA treatment significantly ameliorated these effects (WT-diabetic-TUDCA, 17.1% ± 0.6% v/s WT-diabetic 15.7% ± 1.3%; TNF-diabetic-TUDCA 18.6% ± 0.8% v/s TNF-diabetic, 10.9% ± 0.49%, P < 0.001).
Since RBC receives input from rod photoreceptors, next, we assessed the nuclear counts in ONL in all groups (Supplementary Fig. S3). The mean neuron densities estimated by DAPI-positive cells in ONL were not different in TNF transgenic mice compared with WT animals (TNF, 0.047 ± 0.0 v/s WT, 0.049 ± 0.0 cells/μm2, P > 0.05). In addition, the mean neuron densities were not different in diabetic-TNF or diabetic-WT animals (TNF-diabetic, 0.045 ± 0.0 v/s WT-diabetic, 0.045 ± 0.0 cells/μm2, P > 0.05) as well as those treated with TUDCA (WT-diabetic-TUDCA, 0.44 ± 0.0; TNF-diabetic-TUDCA 0.043 ± 0.0 cells/μm2, P > 0.05).
Taken together with ERG analysis, these findings suggest a protective role of TUDCA on RBC function in the absence of overt neurodegeneration, thus sustaining light response in diabetic tie2-TNF mice.
TUDCA protects from retinal inflammation in diabetic tie2-TNF transgenic mice
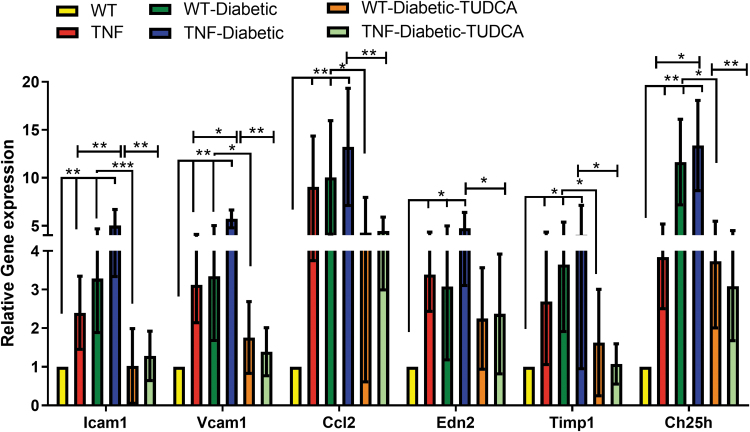
To establish that endothelial TNF exhibits retinal inflammation as observed in early-stage DR, we assessed pro-inflammatory cytokines and biomarker panel genes implicated in DR research7 from retinal tissues from all the groups. As expected, a significant increase in adhesion molecules, including intercellular adhesion molecule-1 (ICAM1), vascular cell adhesion molecule 1 (VCAM1), chemokine (C–C motif) ligand 2 (CCL2), endothelin 2 (EDN2), tissue inhibitor of metalloproteinase 1 (TIMP1), and cholesterol 25-hydroxylase (CH25H), were significantly upregulated (>2-fold, P < 0.05, P < 0.01) in tie2-TNF retina compared with WT retina.
In addition, ICAM1, VCAM1, and CH25H were further increased in diabetic tie2-TNF mice (>2-fold, P < 0.05) compared with tie2-TNF mice (Fig. 5). Interestingly, those mice treated with TUDCA demonstrated a significant reduction in the genes reported earlier when compared with diabetic tie2-TNF mice (P < 0.01) (Fig. 5).
FIG. 5.
TUDCA protects from inflammatory gene expression in diabetic tie2-TNF mice. Markers of retinal inflammation by Taqman quantitative polymerase chain reaction expressed as fold change normalized to internal control in the study groups. Data represent mean ± SEM from n = 7–9 animals/group. *P < 0.05; **P < 0.01; ***P < 0.001.
TUDCA reduces ER stress activation in diabetic tie2-TNF transgenic mice
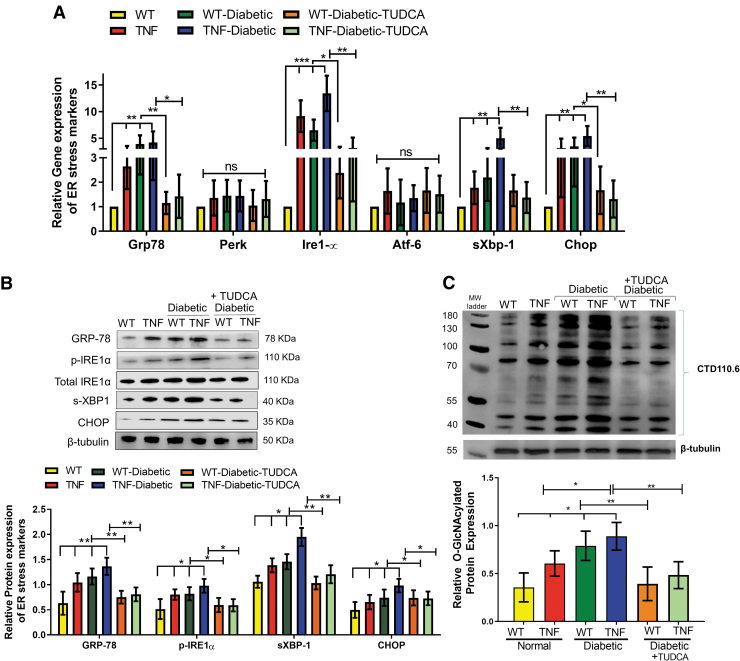
Based on our previous work that diabetic tie2-TNF mice have accentuated ER stress,6 we investigated whether ER stress could be alleviated in these mice using TUDCA. To this end, we assessed messenger RNA (mRNA) and protein levels of ER stress markers, including GRP78, PERK, IRE1α, ATF6, spliced X box binding protein 1 (sXBP1), and C/EBP homologous protein (CHOP) in the retinal tissues in all groups of mice (Fig. 6A). As expected, mRNA expression of GRP78, IRE1α, sXBP1, and CHOP was significantly elevated in retinal tissues of tie2-TNF mice compared with WT mice (>2-fold, P < 0.01).
FIG. 6.
TUDCA protects from an increased gene and protein expression of ER stress markers in the diabetic tie2-TNF mice. (A) Assessment of gene expression by Taqman qPCR expressed as fold change normalized to internal control in the study groups. (B) Representative immunoblots of ER stress markers in the retina from the study groups. (Below): Densitometric analysis of target to internal control or total protein of interest. (C) Representative immunoblots of O-GlcNAcylated proteins in the retina from the study groups. (Below): Densitometric analysis of target to internal control or total protein of interest. Data represent mean ± SEM from n = 7–9 animals/group. *P < 0.05; **P < 0.01; ***P < 0.001. ER, endoplasmic reticulum.
In addition, the expression of these genes further increased significantly in diabetic tie2-TNF mice compared with tie2-TNF mice. Moreover, 3 out of 4 of these genes increased by >1.5-fold in diabetic tie2-TNF mice compared with diabetic-WT mice. Interestingly, diabetic tie2-TNF mice that have received TUDCA significantly ameliorated the ER gene expression compared with diabetic mice that received saline (P < 0.01).
Consistent with the gene transcript data, protein expression of ER stress markers, GRP78, p-IRE1α, sXBP1, and CHOP, was also increased in tie2-TNF mice compared with WT mice (Fig. 6B). In addition, protein levels of these markers were further increased in diabetic tie2-TNF mice compared with tie2-TNF mice, whereas TUDCA groups showed a marked reduction in these protein levels (P < 0.01). Lastly, based on our previous observation that ER stress augments post-translational modifications, we assessed O-GlcNAcylation of proteins by O-GlcNAcylation specific antibody raised against a peptide containing serine-O-linked N-acetyl glucosamine.
Our immunoblot analysis demonstrated that a significant increase in protein O-GlcNAcylation in tie2-TNF mice, with a further increase in diabetic tie2-TNF mice (0.60 ± 0.03 v/s 0.88 ± 0.05, P < 0.01), could be alleviated by the TUDCA treatment (P < 0.01) (Fig. 6C).
TUDCA reduces TGR5 expression in diabetic tie2-TNF transgenic mice
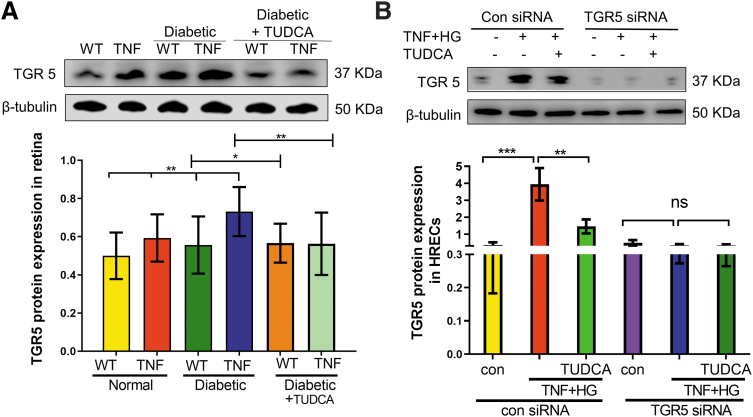
Since TUDCA mediates its effects through TGR5 receptor, we next examined if TGR5 levels are altered in tie2-TNF and diabetic tie2-TNF mice. As shown in Fig. 7A, TGR5 protein expression increased in the diabetic tie2-TNF mice with a significant reduction on treatment with TUDCA. Since endothelial TGR5 likely plays a role in the observed effects of TUDCA, we then established if pro-inflammatory diabetic stress (TNF+HG) could mimic increased TGR5 expression in vitro using retinal endothelial cells.
FIG. 7.
TUDCA reduces TGR5 expression in diabetic tie2-TNF transgenic mice. (A) TGR5 protein expression in retinas of diabetic tie2-TNF transgenic mice. (B) TGR5 protein expression in HRECs in various groups. Data represent mean ± SEM from n = 4 animals/group, or n = 3 replicates in HRECs. *P < 0.05; **P < 0.01; ***P < 0.001. HREC, human retinal endothelial cell; TGR5, Takeda G protein-coupled receptor 5.
As shown in Fig. 7B, HRECs treated with TGR5 siRNA markedly reduced the TGR5 expression in HRECs, whereas those cells treated with TNF+HG and incubated with control siRNA showed increased TGR5 expression with a significant reduction by TUDCA (Fig. 7B).
TGR5 is necessary for TUDCA-mediated protection from leukocyte transmigration
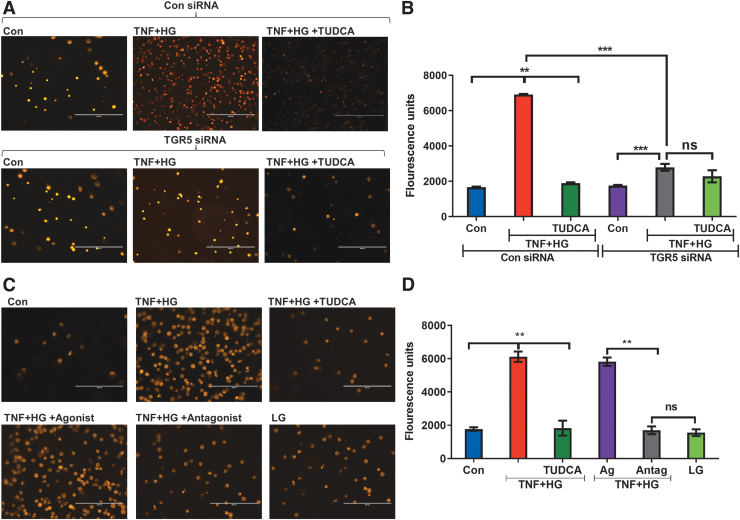
Transmigration of leukocytes across the endothelium is a hallmark of inflammatory diseases such as DR.5 To this end, we asked if TUDCA acting via TGR5 inhibits the transmigration of monocytes through the endothelial cells. As shown in Fig. 8A and B, HRECs treated with control siRNA and incubated with TNF+HG demonstrated a significant increase in transmigration. In contrast, those cells treated with TGR5 siRNA and incubated with TNF+HG showed a substantial reduction in transmigration.
FIG. 8.
TGR5 is necessary for TUDCA-mediated protection from leukocyte transmigration. (A) Representative images of fluorescently labeled monocytes transmigrated across HRECs treated with control siRNA (above) or TGR5 siRNA (below) in various groups and the (B) quantification of transmigrated cells. (C) Representative images of fluorescently labeled monocytes transmigrated across HRECs in various groups with TGR5 agonist and antagonist and the (D) quantification of transmigrated cells. Data represent mean ± SEM from n = 3 replicates. **P < 0.01; ***P < 0.001. ns, Not significant; siRNA, small interfering RNA.
Interestingly, TUDCA could reverse the transmigration effects only in control siRNA-treated cells. To further support the role of TGR5, we asked if pharmacological activation and or inhibition of TGR5 would prevent the transmigration of monocytes across activated endothelium. Using a TGR5 agonist, we show that TNF+HG markedly increased the transmigration of monocytes (Fig. 8C, D), whereas the addition of an antagonist prevented such transmigration.
TGR5 is necessary for TUDCA-mediated protection from endothelial barrier loss
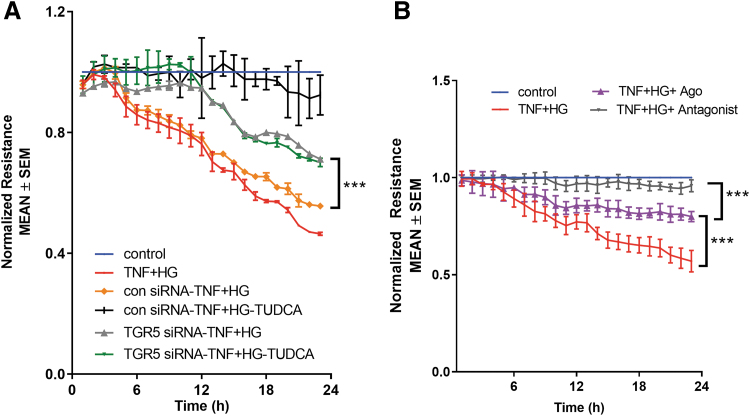
To investigate whether TGR5 signaling is involved in the TUDCA-mediated protection from the permeability defects in the retinal endothelial cells in vitro, we measured TER in TGR5-silenced cells. HRECs were exposed to TGR5 siRNA or control siRNA and challenged with TNF+HG with and without TUDCA. Previously, we have shown that HRECs exposed to TNF+HG result in a sustained reduction in barrier integrity as evidenced by decreased TER.6
Similarly, HRECs knockdown with control siRNA-treated cells exposed to TNF+HG induced a sustained reduction in barrier integrity as evidenced by decreased TER (Ctrl-siRNA-TNF+HG, 0.556 ± 0.002 vs. Control, 1.0 ± 0.0 AU, P < 0.001). On the other hand, those cells treated with TGR5 siRNA and incubated with TNF+HG showed a substantial decrease in TER (TGR5-siRNA-TNF+HG, 0.712 ± 0.03 vs. Control, 1.0 ± 0.0 AU, P < 0.001); however, they significantly differed from control siRNA-treated cells (TGR5-siRNA-TNF+HG, 0.712 ± 0.03 vs. Con siRNA-TNF+HG, 0.556 ± 0.002 AU, P < 0.001).
Control siRNA cells treated with TUDCA significantly rescued TNF+HG associated TER (0.924 ± 0.066 vs. Con siRNA-TNF+HG, 0.556 ± 0.002 AU, P < 0.001), whereas knockdown of those cells with TGR5 failed (0.700 ± 0.14 vs. TGR5-siRNA-TNF+HG, 0.712 ± 0.03 AU, P > 0.05) to rescue these effects (Fig. 9A). To further support the role of TGR5, we asked if pharmacological activation and or inhibition of TGR5 would prevent permeability. Using a TGR5 agonist, we show that TNF+HG markedly decreased the barrier integrity, although at a lower level than induced by TNF+HG alone (0.799 ± 0.03 vs. TNF+HG: 0.569 ± 0.05 AU, P < 0.001).
FIG. 9.
TGR5 is necessary for TUDCA-mediated protection from endothelial barrier loss. Representative ECIS tracings plotted as normalized resistance from (A) TGR5 knockdown (TGR5 siRNA) or control siRNA (con siRNA) treated cells or (B) TGR5 agonist and antagonist treatment groups with various treatments. Data represent mean ± SEM from n = 3 replicates. ***P < 0.001. ECIS, electric cell-substrate impedance sensing.
On the other hand, the addition of antagonist prevented complete loss of barrier integrity induced by TNF+HG (0.958 ± 0.03 vs. TNF+HG: 0.569 ± 0.05 AU, P < 0.001; vs. Control, 1.0 ± 0.0 AU, P > 0.05) (Fig. 9B).
Discussion
Our data suggest that TUDCA will serve as an excellent therapeutic agent addressing both vascular and neurodegenerative changes in the diabetic retina. Using a constant endothelial activation animal model of diabetes previously described,6 we show that systemic treatment with TUDCA alleviates the ER stress and proinflammation in the retina resulting in increased protection against vascular leakage, neural retinal response to light, and visual deficits. In addition, our studies show that systemic treatment of TUDCA not only reduces blood glucose levels but also, in long-term studies, is shown to be effective up to 5 months post-diabetes.
One compelling feature of our study is that systemic delivery of TUDCA into the diabetic TNF mice resulted in the significant rescue of visual function assessed by OKN and retinal function assessed by ERG. Visual acuity and contrast sensitivity thresholds decreased in diabetic TNF mice compared with age-matched diabetic WT mice at 1, 2, and 5 months, whereas treatment with TUDCA significantly improved them.
Since visual deficits occurring along the visual-motor chain assessed by OKN may likely differ in cell signaling underlying the retinal function, we also evaluated ERG in these mice. Following OKN changes, both the b-wave amplitudes (predominantly elicited from INL cells, especially bipolar, amacrine, and Müller cells) and a-wave amplitudes (elicited from rod photoreceptors) were significantly affected in diabetic TNF mice, further confirming retinal dysfunction, with a significant rescue with systemic TUDCA treatment.
It is noteworthy that TUDCA rescued the age-associated accentuated visual deficits in the diabetic TNF mice studied until 5 months post-diabetes. Considering the essential role of PKCα in neural retinal response to light that is abundantly expressed in RBCs,25 we have correlated the loss of PKCα with the decrease in retinal function and shown a remarkable reduction of PKCα expression in diabetic TNF mice with a significant rescue with TUDCA treatment.
Our data confirm that the reduction in PKCα expression observed in diabetic TNF mice is not due to loss of photoreceptor input per se as assessed by DAPI-positive cells in the ONL but likely due to loss of activity-dependent regulation of PKCα expression in diabetic TNF mice. Moore-Dotson et al previously observed a similar change in a light-evoked reduction in RBC activity without changes in large-scale loss of retinal neurons after 6 weeks of diabetes.26
Interestingly, these changes in RBC activity in diabetic-TNF were substantially reversed with TUDCA treatment administered at an early stage. In support of our observations, the Fu et al group has shown that an equivalent dose of TUDCA treatment preserved both visual function and retinal function in an STZ-mouse model of type 1 diabetes.18
Blood tissue barrier integrity plays a vital role in DR, with activated endothelium known to compromise such barrier integrity with changes in VE-cadherin and other adheren junction proteins in the diabetic and/or ischemic retina resulting in extensive vascular leakage, leukocyte extravasation, and tissue inflammation.27–30 In line with these studies, we show significantly increased vascular permeability in TNF mice compared with their age-matched WT animals, with a further increase in diabetic mice within 1 month after STZ treatment.
Interestingly, this increase in permeability was significantly reduced to near-normal levels in diabetic mice treated with TUDCA. Previously, we have reported increased phosphorylated VE-cadherin levels in diabetic TNF mice and suggested that altered VE-cadherin levels likely contribute to the increased vascular permeability in diabetic TNF mice.6 In this study, we show a similar increase in phosphorylated levels of VE-cadherin in diabetic TNF mice but with a significant reduction with TUDCA treatment, suggesting that the effects of TUDCA on vascular permeability effects are mediated via improving endothelial junction integrity.
These studies align with our previous studies conducted in retinal endothelial cells in vitro that have shown similar protection of TUDCA on VE-cadherin distribution and improved trans-endothelial resistance, a surrogate measure of vascular permeability.6 The DR models are known to show changes in pro-inflammatory gene changes associated with endothelial activation; specifically, genes coding proteins involved in the infection and immune response (CH25H), intracellular signal transduction pathways activated by cytokines and chemokines, such as adhesion and tissue structure (VCAM1 and ICAM1), inflammation (CCL2 and EDN2) and protein degradation (TIMP1), as well as changes in ER-stress related proteins, including GRP78, IRE1α, sXBP1, and CHOP, at both the mRNA transcript and protein levels.6
Accordingly, we show an increase in pro-inflammatory and ER stress markers in diabetic TNF mice compared with diabetic WT mice, with a significant reduction in these genes and/or proteins with TUDCA treatment. Taken together with changes in vascular permeability studies, changes in altered gene expression suggest endothelial dysfunction in diabetic TNF mice compromising the retinal barrier integrity. On the other hand, our studies show that TUDCA treatment successfully alleviates endothelial dysfunction in the diabetic retina.
Increasing literature now reports that bile acids such as TUDCA function through the TGR5 receptor.11,31 In line with these studies, we show that TGR5 receptor expression is observed in the retina, with the levels of TGR5 significantly increased in TNF mice compared with their age-matched WT animals, with a further increase in diabetic mice. Interestingly, this increase in TGR5 receptor expression was significantly reduced to near-normal levels in diabetic mice treated with TUDCA, suggesting that a feedback mechanism is likely involved in regulating TGR5 expression in these mice.
In contrast to our observation, the Zhu et al group previously showed no changes in TGR5 receptor levels in diabetic rats; however, an agonist of TGR5 successfully reversed the DR features.12 In accordance with these conflicting data, TGR5 receptor cell signaling has been shown to be cell-type dependent and/or contextual, with some studies showing benefits whereas others claiming harmful effects.12–16 Future studies are needed to either knock down or overexpress TGR5 in the diabetic retina to further establish the role of the TGR5 receptor in the observed benefits of TUDCA.
To this end, we show that knocking down TGR5 receptor expression in HRECs and subjected to a combination of hyperglycemia and TNF failed to show the beneficial effects of TUDCA as evidenced by the lack of protection against transmigration of activated leukocytes or the loss of trans-endothelial resistance. Moreover, a TGR5 antagonist but not the agonist protected from TNF+HG induced transmigration of activated leukocytes or the loss of trans-endothelial resistance.
These studies suggest that the protective actions of TUDCA are mediated via the TGR5 receptor; however, a feedback mechanism likely regulates receptor expression. Future studies are necessary to decipher the underlying signaling mechanism of such feedback regulation of receptor-ligand interactions.
We readily recognize a few limitations of our study. The initial body weight of tie2-TNF mice is significantly lower than their age-matched WT animals in our study as the tie2-TNF mice are small for gestation for reasons unknown to us. Whether this difference contributed to a different degree of inflammation and ER stress is not known. However, TUDCA treatment improved their body weights in WT and tie2-TNF diabetic mice.
The pharmacokinetics and dynamics of TUDCA likely depend on the delivery route. Our study did not attempt the timing of initiation of treatment, dose, or treatment intervals. We have used a single dose of 500 mg/kg via a subcutaneous route based on previous publications showing the benefits of TUDCA.18,32 However, the beneficial effects of TUDCA in our study might have occurred indirectly via controlling hyperglycemia and not necessarily acting at the local tissue level. To this end, future studies should assess the utility of various treatment regimens and local delivery of TUDCA in our model.
However, caution must be exercised that a recent study has shown the superiority of the intravenous route of TUDCA over intravitreal delivery in delivering high local drug levels in the retina with the most negligible systemic side effects.33 Visual dysfunction and retinal degeneration in the STZ model of DR begins at 4 weeks, with progressive degeneration occurring in the long-term (3–6 months).34
Though our studies have focused on addressing the therapeutic benefits of TUDCA at 4 weeks and 5 months post-diabetes, future studies are needed to study the long-term effects of retinal structural abnormalities in our model to validate our initial results. Neuron density counts show no overt neurodegeneration in diabetic TNF mice; however, future studies need to explore the underlying mechanism for the loss of activity-dependent changes of PKCα expression in RBC and reduction in ERG in this model using cell type-specific antibodies or using ex vivo single-cell recordings to better correlate the molecular changes with the observed neuronal and endothelial dysfunction.
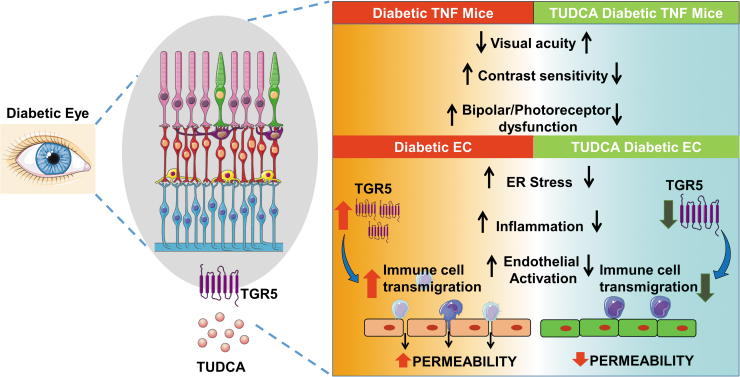
In conclusion, using a pro-inflammatory tie2-TNF mouse model of DR, we show that systemic treatment of TUDCA suppresses retinal inflammation and ER stress resulting in decreased vascular permeability and improved retinal function. In vitro, using retinal endothelial cells, we show that the TUDCA acting via the TGR5 receptor suppresses HG and TNF-α induced transmigration of leukocytes and permeability defects.
Taken together with the existing literature, our studies show that TUDCA will serve as an excellent therapeutic agent for diabetic complications addressing functional changes in both vascular and neuronal cells in the retina. Perturbation of the TGR5 receptor in the retina might play a role in linking retinal ER stress to neurovascular dysfunction in DR (Fig. 10).
FIG. 10.
TUDCA alleviates ER stress-mediated visual deficits in diabetic tie2-TNF transgenic mice via TGR5 signaling in retinal endothelial cells. A schematic model showing TUDCA will serve as an excellent therapeutic agent for diabetic complications addressing vascular and neurodegenerative retina changes. Perturbation of the TGR5 receptor cell signaling in the diabetic retina alleviates retinal ER stress associated with endothelial dysfunction. Created with content from Servier Medical Art (https://smart.servier.com) under Creative Commons Attribution 3.0 Unported license (https://creativecommons.org/licenses/by/3.0).
Supplementary Material
Authors' Contributions
Conceived and designed the experiments and wrote the paper: R.L., R.G. Performed the experiments: R.L., K.A.J., A.S., E.V.C., and J.G. Analyzed the data: R.L., K.A.J., A.S., E.V.C., J.G., T.V., and R.G. Reviewed the paper: all authors.
Author Disclosure Statement
None of the other authors declare any financial interests relevant to the studies presented here.
Funding Information
This study was supported by grants from the National Eye Institute [EY023427 (R.G.) and EY030863 (T.V.)], gifts from the Hamilton Eye Institute, and an unrestricted grant from Research to Prevent Blindness. R.L. is a recipient of postdoc fellowship awards from the Neuroscience Institute, UTHSC, and the International Retinal Research Foundation. The funders played no role in the conduct of the study, collection of data, management of the study, analysis of data, interpretation of data, or preparation of the manuscript.
Supplementary Material
References
- 1. Stitt AW, Curtis TM, Chen M, et al. The progress in understanding and treatment of diabetic retinopathy. Prog Retin Eye Res 2016;51:156–186. [DOI] [PubMed] [Google Scholar]
- 2. Abcouwer SF, Gardner TW. Diabetic retinopathy: Loss of neuroretinal adaptation to the diabetic metabolic environment. Ann N Y Acad Sci 2014;1311:174–190. [DOI] [PMC free article] [PubMed] [Google Scholar]
- 3. Simo R, Hernandez C. Novel approaches for treating diabetic retinopathy based on recent pathogenic evidence. Prog Retin Eye Res 2015;48:160–180. [DOI] [PubMed] [Google Scholar]
- 4. Solomon SD, Chew E, Duh EJ, et al. Diabetic retinopathy: A position statement by the American Diabetes Association. Diabetes Care 2017;40(3):412–418. [DOI] [PMC free article] [PubMed] [Google Scholar]
- 5. Lenin R, Thomas SM, Gangaraju R.. Endothelial activation and oxidative stress in neurovascular defects of the retina. Curr Pharm Des 2018;24(40):4742–4754. [DOI] [PubMed] [Google Scholar]
- 6. Lenin R, Nagy PG, Alli S, et al. Critical role of endoplasmic reticulum stress in chronic endothelial activation-induced visual deficits in tie2-tumor necrosis factor mice. J Cell Biochem 2018;119(10):8460–8471. [DOI] [PMC free article] [PubMed] [Google Scholar]
- 7. Freeman WM, Bixler GV, Brucklacher RM, et al. A multistep validation process of biomarkers for preclinical drug development. Pharmacogenomics J 2010;10(5):385–395. [DOI] [PubMed] [Google Scholar]
- 8. Lenin R, Nagy PG, Gentry J, Gangaraju R.. Featured article: Deterioration of visual function mediated by senescence-associated endoplasmic reticulum stress in inflammatory tie2-TNF mice. Exp Biol Med (Maywood) 2018;243(12):976–984. [DOI] [PMC free article] [PubMed] [Google Scholar]
- 9. Oveson BC, Iwase T, Hackett SF, et al. Constituents of bile, bilirubin and TUDCA, protect against oxidative stress-induced retinal degeneration. J Neurochem 2011;116(1):144–153. [DOI] [PMC free article] [PubMed] [Google Scholar]
- 10. Phillips MJ, Walker TA, Choi H-Y, et al. Tauroursodeoxycholic acid preserves photoreceptor structure and function in the rd10 mouse through post-natal day30. Invest Ophthalmol Vis Sci 2008;49(5):2148–2155. [DOI] [PMC free article] [PubMed] [Google Scholar]
- 11. Beli E, Yan Y, Moldovan L, et al. Restructuring of the gut microbiome by intermittent fasting prevents retinopathy and prolongs survival in db/db Mice. Diabetes 2018;67(9):1867–1879. [DOI] [PMC free article] [PubMed] [Google Scholar]
- 12. Zhu L, Wang W, Xie TH, et al. TGR5 receptor activation attenuates diabetic retinopathy through suppression of RhoA/ROCK signaling. FASEB J 2020;34(3):4189–4203. [DOI] [PubMed] [Google Scholar]
- 13. Hsu CC, Cheng KC, Li Y, et al. TGR5 expression is associated with changes in the heart and urinary bladder of rats with metabolic syndrome. Life (Basel) 2021;11(7):695. [DOI] [PMC free article] [PubMed] [Google Scholar]
- 14. Wang XX, Wang D, Luo Y, et al. FXR/TGR5 dual agonist prevents progression of nephropathy in diabetes and obesity. J Am Soc Nephrol 2018;29(1):118–137. [DOI] [PMC free article] [PubMed] [Google Scholar]
- 15. Guo C, Chen W-D, Wang Y-D.. TGR5, not only a metabolic regulator. Front Physiol 2016;7:646. [DOI] [PMC free article] [PubMed] [Google Scholar]
- 16. Baptissart M, Vega A, Martinot E, et al. Bile acids alter male fertility through G-protein-coupled bile acid receptor 1 signaling pathways in mice. Hepatology 2014;60(3):1054–1065. [DOI] [PubMed] [Google Scholar]
- 17. Willuweit A, Sass G, Schoneberg A, et al. Chronic inflammation and protection from acute hepatitis in transgenic mice expressing TNF in endothelial cells. J Immunol 2001;167(7):3944–3952. [DOI] [PubMed] [Google Scholar]
- 18. Fu J, Aung MH, Prunty MC, et al. Tauroursodeoxycholic acid protects retinal and visual function in a mouse model of type 1 diabetes. Pharmaceutics 2021;13(8):1154. [DOI] [PMC free article] [PubMed] [Google Scholar]
- 19. Prusky GT, Alam NM, Beekman S, et al. Rapid quantification of adult and developing mouse spatial vision using a virtual optomotor system. Invest Ophthalmol Vis Sci 2004;45(12):4611–4616. [DOI] [PubMed] [Google Scholar]
- 20. Dreffs A, Lin CM, Liu X, et al. All-trans-retinaldehyde contributes to retinal vascular permeability in ischemia reperfusion. Invest Ophthalmol Vis Sci 2020;61(6):8. [DOI] [PMC free article] [PubMed] [Google Scholar]
- 21. Jha KA, Pentecost M, Lenin R, et al. Concentrated conditioned media from adipose tissue derived mesenchymal stem cells mitigates visual deficits and retinal inflammation following mild traumatic brain injury. Int J Mol Sci 2018;19(7):2016. [DOI] [PMC free article] [PubMed] [Google Scholar]
- 22. Shrestha AP, Saravanakumar A, Konadu B, et al. Embryonic hyperglycemia delays the development of retinal synapses in a zebrafish model. Int J Mol Sci 2022;23(17):9693. [DOI] [PMC free article] [PubMed] [Google Scholar]
- 23. Lenin R, Nagy PG, Jha KA, et al. GRP78 translocation to the cell surface and O-GlcNAcylation of VE-Cadherin contribute to ER stress-mediated endothelial permeability. Sci Rep 2019;9(1):10783. [DOI] [PMC free article] [PubMed] [Google Scholar]
- 24. Adam AP. Regulation of endothelial adherens junctions by tyrosine phosphorylation. Mediators Inflamm 2015;2015:272858. [DOI] [PMC free article] [PubMed] [Google Scholar]
- 25. Xiong W-H, Pang J-J, Pennesi ME, et al. The effect of PKCα on the light response of rod bipolar cells in the mouse retina. Invest Ophthalmol Vis Sci 2015;56(8):4961–4974. [DOI] [PMC free article] [PubMed] [Google Scholar]
- 26. Moore-Dotson JM, Beckman JJ, Mazade RE, et al. Early retinal neuronal dysfunction in diabetic mice: Reduced light-evoked inhibition increases rod pathway signaling. Invest Ophthalmol Vis Sci 2016;57(3):1418–1430. [DOI] [PMC free article] [PubMed] [Google Scholar]
- 27. Smith RO, Ninchoji T, Gordon E, et al. Vascular permeability in retinopathy is regulated by VEGFR2 Y949 signaling to VE-cadherin. eLife 2020;9:e54056. [DOI] [PMC free article] [PubMed] [Google Scholar]
- 28. Garrett JP, Lowery AM, Adam AP, et al. Regulation of endothelial barrier function by p120-cateninVE-cadherin interaction. Mol Biol Cell 2017;28(1):85–97. [DOI] [PMC free article] [PubMed] [Google Scholar]
- 29. Abcouwer SF, Lin C-M, Shanmugam S, et al. Minocycline prevents retinal inflammation and vascular permeability following ischemia-reperfusion injury. J Neuroinflammation 2013;10:149. [DOI] [PMC free article] [PubMed] [Google Scholar]
- 30. Muthusamy A, Lin CM, Shanmugam S, et al. Ischemia-reperfusion injury induces occludin phosphorylation/ubiquitination and retinal vascular permeability in a VEGFR-2-dependent manner. J Cereb Blood Flow Metab 2014;34(3):522–531. [DOI] [PMC free article] [PubMed] [Google Scholar]
- 31. Yanguas-Casas N, Barreda-Manso MA, Nieto-Sampedro M, et al. TUDCA: An agonist of the bile acid receptor GPBAR1/TGR5 with anti-inflammatory effects in microglial cells. J Cell Physiol 2017;232(8):2231–2245. [DOI] [PubMed] [Google Scholar]
- 32. Tao Y, Dong X, Lu X, et al. Subcutaneous delivery of tauroursodeoxycholic acid rescues the cone photoreceptors in degenerative retina: A promising therapeutic molecule for retinopathy. Biomed Pharmacother 2019;117:109021. [DOI] [PubMed] [Google Scholar]
- 33. Olsen TW, Dyer RB, Mano F, et al. Drug tissue distribution of TUDCA from a biodegradable suprachoroidal implant versus intravitreal or systemic delivery in the pig model. Transl Vis Sci Technol 2020;9(6):11. [DOI] [PMC free article] [PubMed] [Google Scholar]
- 34. Sergeys J, Etienne I, Van Hove I, et al. Longitudinal in vivo characterization of the streptozotocin-induced diabetic mouse model: Focus on early inner retinal responses. Invest Ophthalmol Vis Sci 2019;60(2):807–822. [DOI] [PubMed] [Google Scholar]
Associated Data
This section collects any data citations, data availability statements, or supplementary materials included in this article.


